
Abstract
Objectives:
Anthroposophic therapeutic speech (ATS) has been shown to positively influence heart rate variability (HRV) and cardiorespiratory coordination in healthy volunteers. This prospective, exploratory, pre–post study was performed to investigate ATS effects on baroreflex sensitivity (BRS), heart rate (HR), HRV by standard deviation of beat to beat intervals (SDNN), blood pressure (BP), and mood in hypertensive patients.
Design:
Patients received three ATS treatments, alternating with three sham interventions (control). During the sessions, BP and electrocardiography were continuously recorded. BRS and SDNN were analyzed from those measurements. Changes in mood score were assessed by a questionnaire. All data were compared before and after intervention (ATS and control).
Results:
Thirty-one patients participated, the majority diagnosed with arterial hypertension (22 out of 31). Pre–post analysis of the data revealed immediate and significant changes in hypertensive patients during control and ATS with respect to BRS (control: 6.57 to 6.92 msec/mmHg, p = 0.0349; ATS: 6.03 to 7.27 msec/mmHg, p < 0.0001), SDNN (control: 39 to 42 msec, p = 0.0058; ATS: 38 to 43 msec, p = 0.0003), and HR (control: 74 to 71 beats per minute [bpm], p < 0.0001; ATS: 74 to 70 bpm, p < 0.0001). In normotensive patients, those changes were generally less pronounced and less significant with respect to BRS (control: 8.13 to 8.56 msec/mmHg, p = 0.1102; ATS: 8.20 to 8.98 msec/mmHg, p = 0.0273), SDNN (control: 36 to 40 msec, p = 0.0002; ATS: 35 to 38 msec, p = 0.0556), and HR (control: 80 to 77 bpm, p < 0.0001; ATS: 80 to 78 bpm, p < 0.0011). Only in hypertensive patients significant long-term changes were observed for BRS (6.6 to 7.7 msec/mmHg, p = 0.0070), SDNN (39.1 to 45.5 msec, p = 0.0074), and HR (75.8 to 67.2 bpm, p = 0.0001). No significant long-term changes were observed in normotensive patients. The mean systolic BP did not change significantly during this study. Both ATS and control also yielded improvements in the mood summary score, which again were more apparent for ATS than for sham interventions, but these were more pronounced among normotensive patients (3.5 to 4.2) than for hypertensive patients (2.9 to 3.9).
Conclusion:
The results indicate that ATS has the potential to improve cardiovascular parameters which play an important role in BP regulation capability.
Introduction
H
BRS relys on pressure-induced changes in the arterial wall. Therefore, healthy BP regulation capability requires normal contractile function of vascular walls with fit viscoelasticity and a regular modulation of vasoconstriction. In this state, the BRS provides a rapid feedback in which an elevated or reduced BP reflexively causes the heart rate (HR) to adjust for pressure regulation. During such feedback events, the relationship between systolic pressure and subsequent beat to beat intervals is effectively linear. The slope of this relationship is a direct measure of the BRS and an increased value means an increased sensitivity. In hypertension, however, one or more of the vascular resistance alteration factors exhibit pathological conditions, BRS loses its efficiency, and exhibits reduced values. 7,8 The stimulation of BRS is increasingly being considered as an important factor in the therapy of the nervous regulatory processes of BP. A recent study, assessing the stimulation of carotid nerves for the therapy of chronic hypertension demonstrated that sufficient BRS is not only important in the short term, but also in long-term BP regulation. 9 Furthermore, reduced BRS is directly related to increased 24-h BP variability and increased target organ damage, 10 giving enough justification for active therapies aimed at decreasing respiration rate and increasing BRS.
Studying heart rate variability (HRV) is an established method for investigating changes in cardiovascular regulatory processes, cardiorespiratory coordination, and autonomic balance. A time-domain measure of the HRV is the magnitude of temporal changes of consecutive beat to beat intervals (RR intervals in msec), which is represented by the standard deviation of the RR interval time series (SDNN). Spectral analysis of the HRV in the frequency domain can be used for precise assessment of autonomic function. While power spectral density in the high-frequency (HF) band (0.15–0.4 Hz) reflects vagal activity only, both sympathetic and parasympathetic activities modulate the power in the low-frequency (LF) band (0.04–0.15 Hz). The LF/HF ratio is used as an index for sympathovagal balance; lower values indicate a balance shift toward vagal activity. 11,12 Pronounced differences in the circadian amplitude of the HRV between healthy subjects and cancer patients (reduced) point to the importance of rhythmical flexibility. 13 At the level of ultradian periods, the interaction of BP variability and HRV enables the organism to self-calibrate. Since physiological sensors adapt to a steady signal, BP regulation might become unstable in the absence of variations. The feedback loop type of both interacting rhythms prevents such adaptation. 14 –16
Individuals with a history of BP levels higher than 120/80 mmHg may consider adjuvant nondrug, nondietary treatments, such as device-guided slow breathing, aerobic resistance exercises, or isometric exercises, which are also recommended by the American Heart Association. 17,18 These types of treatments have a long tradition in Anthroposophic Medicine (AM), which is an integrative multimodal treatment system based on a holistic concept of the human organism and nature. 19 Many considerations in AM account for the interaction of exo- and endogenous rhythms from microscopic to macroscopic periods. Unfavorable health changes appear to be connected with a pattern change in complex physiological rhythms as confirmed by chronobiology and chronomedicine. 14,15 Thus, therapies in AM aim at supporting and restoring favorable physiological rhythm patterns.
Anthroposophic therapeutic speech (ATS) utilizes voice and breathing exercises, often based on epic, lyrical, and dramatic texts, with intensive use of rhythmic speech. The scope of indications spans psychosomatic illness as well as cardiac and respiratory diseases. In ATS, the vocalization of specific sounds and texts (e.g., Greek hexameter) deepens and rhythmizes the respiration and creates a pronounced synchronization of cardiorespiratory interaction by increasing the vagal control of HRV. 20 –22 An example for an ancient religious and cultural technique, leading to a regularization and slowing of breathing (5–6 breaths per minute) is the recitation of rosary prayer. As a consequence, the prayer evokes synchronized fluctuations in HRV, systolic BP (SBP), and diastolic BP (DBP), as well as transcranial blood flow. 23
ATS has been used clinically in AM for the treatment of arterial hypertension for many years; however, there is no scientific evidence of its effectiveness yet. In this prospective, exploratory, pre–post study, we have investigated the influence of speech-guided breathing on BRS and HRV, as well as on mood, in patients with arterial hypertension, for the first time.
Methods
Study design, participants, and therapy
This multicenter, prospective, exploratory preintervention–postintervention study was approved by the local Ethics Committees (EKBB 62/03) and conducted according to the Helsinki Declaration. The study was registered postintervention on
Initially, it was planned to include three groups each of 22 patients: (essential hypertension (ICD-10: I10), tension-type headache (G44.2), and anxiety disorders (F41). Due to persistent recruitment problems in the two latter groups, enrolment was stopped when the intended number of patients (n = 22) was achieved in the first group. The normotensive patients recruited until then (n = 9; five with tension-type headache and four with anxiety) followed the same protocol and were used as additional normotensive control group. Recruitment of inpatients and outpatients took place at the Klinik Arlesheim and at the Paracelsus-Spital Richterswil (n = 29 and n = 2, respectively).
Inclusion criteria: (1) Prescription of ATS by a medical doctor (MD) (2) Willing and able to perform ATS (3) Diagnosed with hypertension (I 10, either on drug therapy or verified by 24 h BP measurements), with tension headache (G44.2) or with anxiety (F41) confirmed by the recruiting physician (4) Aged between 20 and 60 years (5) No alteration in medication affecting HRV for the last 2 months before and during the study
Exclusion criteria: (1) Comorbidity strongly influencing HRV (2) Too weak to participate in an active therapy (3) Pacemaker (4) Skin disease or allergies preventing the use of electrocardiography (ECG) electrodes
Patients were continuously enrolled by MDs in the study centers who prescribe ATS. It was left to the opinions of the MDs to consider ATS as a reasonable treatment in this clinical setting, where several alternative therapies were available. Included patients received oral as well as written information from their MD and signed informed consent. All patients received three ATS sessions (T) with physiological and psychometric recordings, alternating with three control sessions (C), consisting of normal conversation with the same therapist in the same room (sham intervention). Sessions were executed in the following order: C1–T1–C2–T2–C3–T3. Figure 1 shows the flow diagram of sequential actions, measurements, and intervention within one session. ATS used sound combinations, such as “KLSFM” or “OM” and hexameter verses in German, spoken by the therapist and imitated by the patients, for retraining patient's breathing. Another three ATS sessions without measurements were included to achieve a modest learning effect without corrupting compliance (see section “Discussion”). All interventions were conducted by the same qualified therapist for each patient on different days, but at the same time of day for 30 min in upright position and walking. Before and after the intervention, a resting period of 15 min (prerest and postrest) had to be observed for comparison reasons.
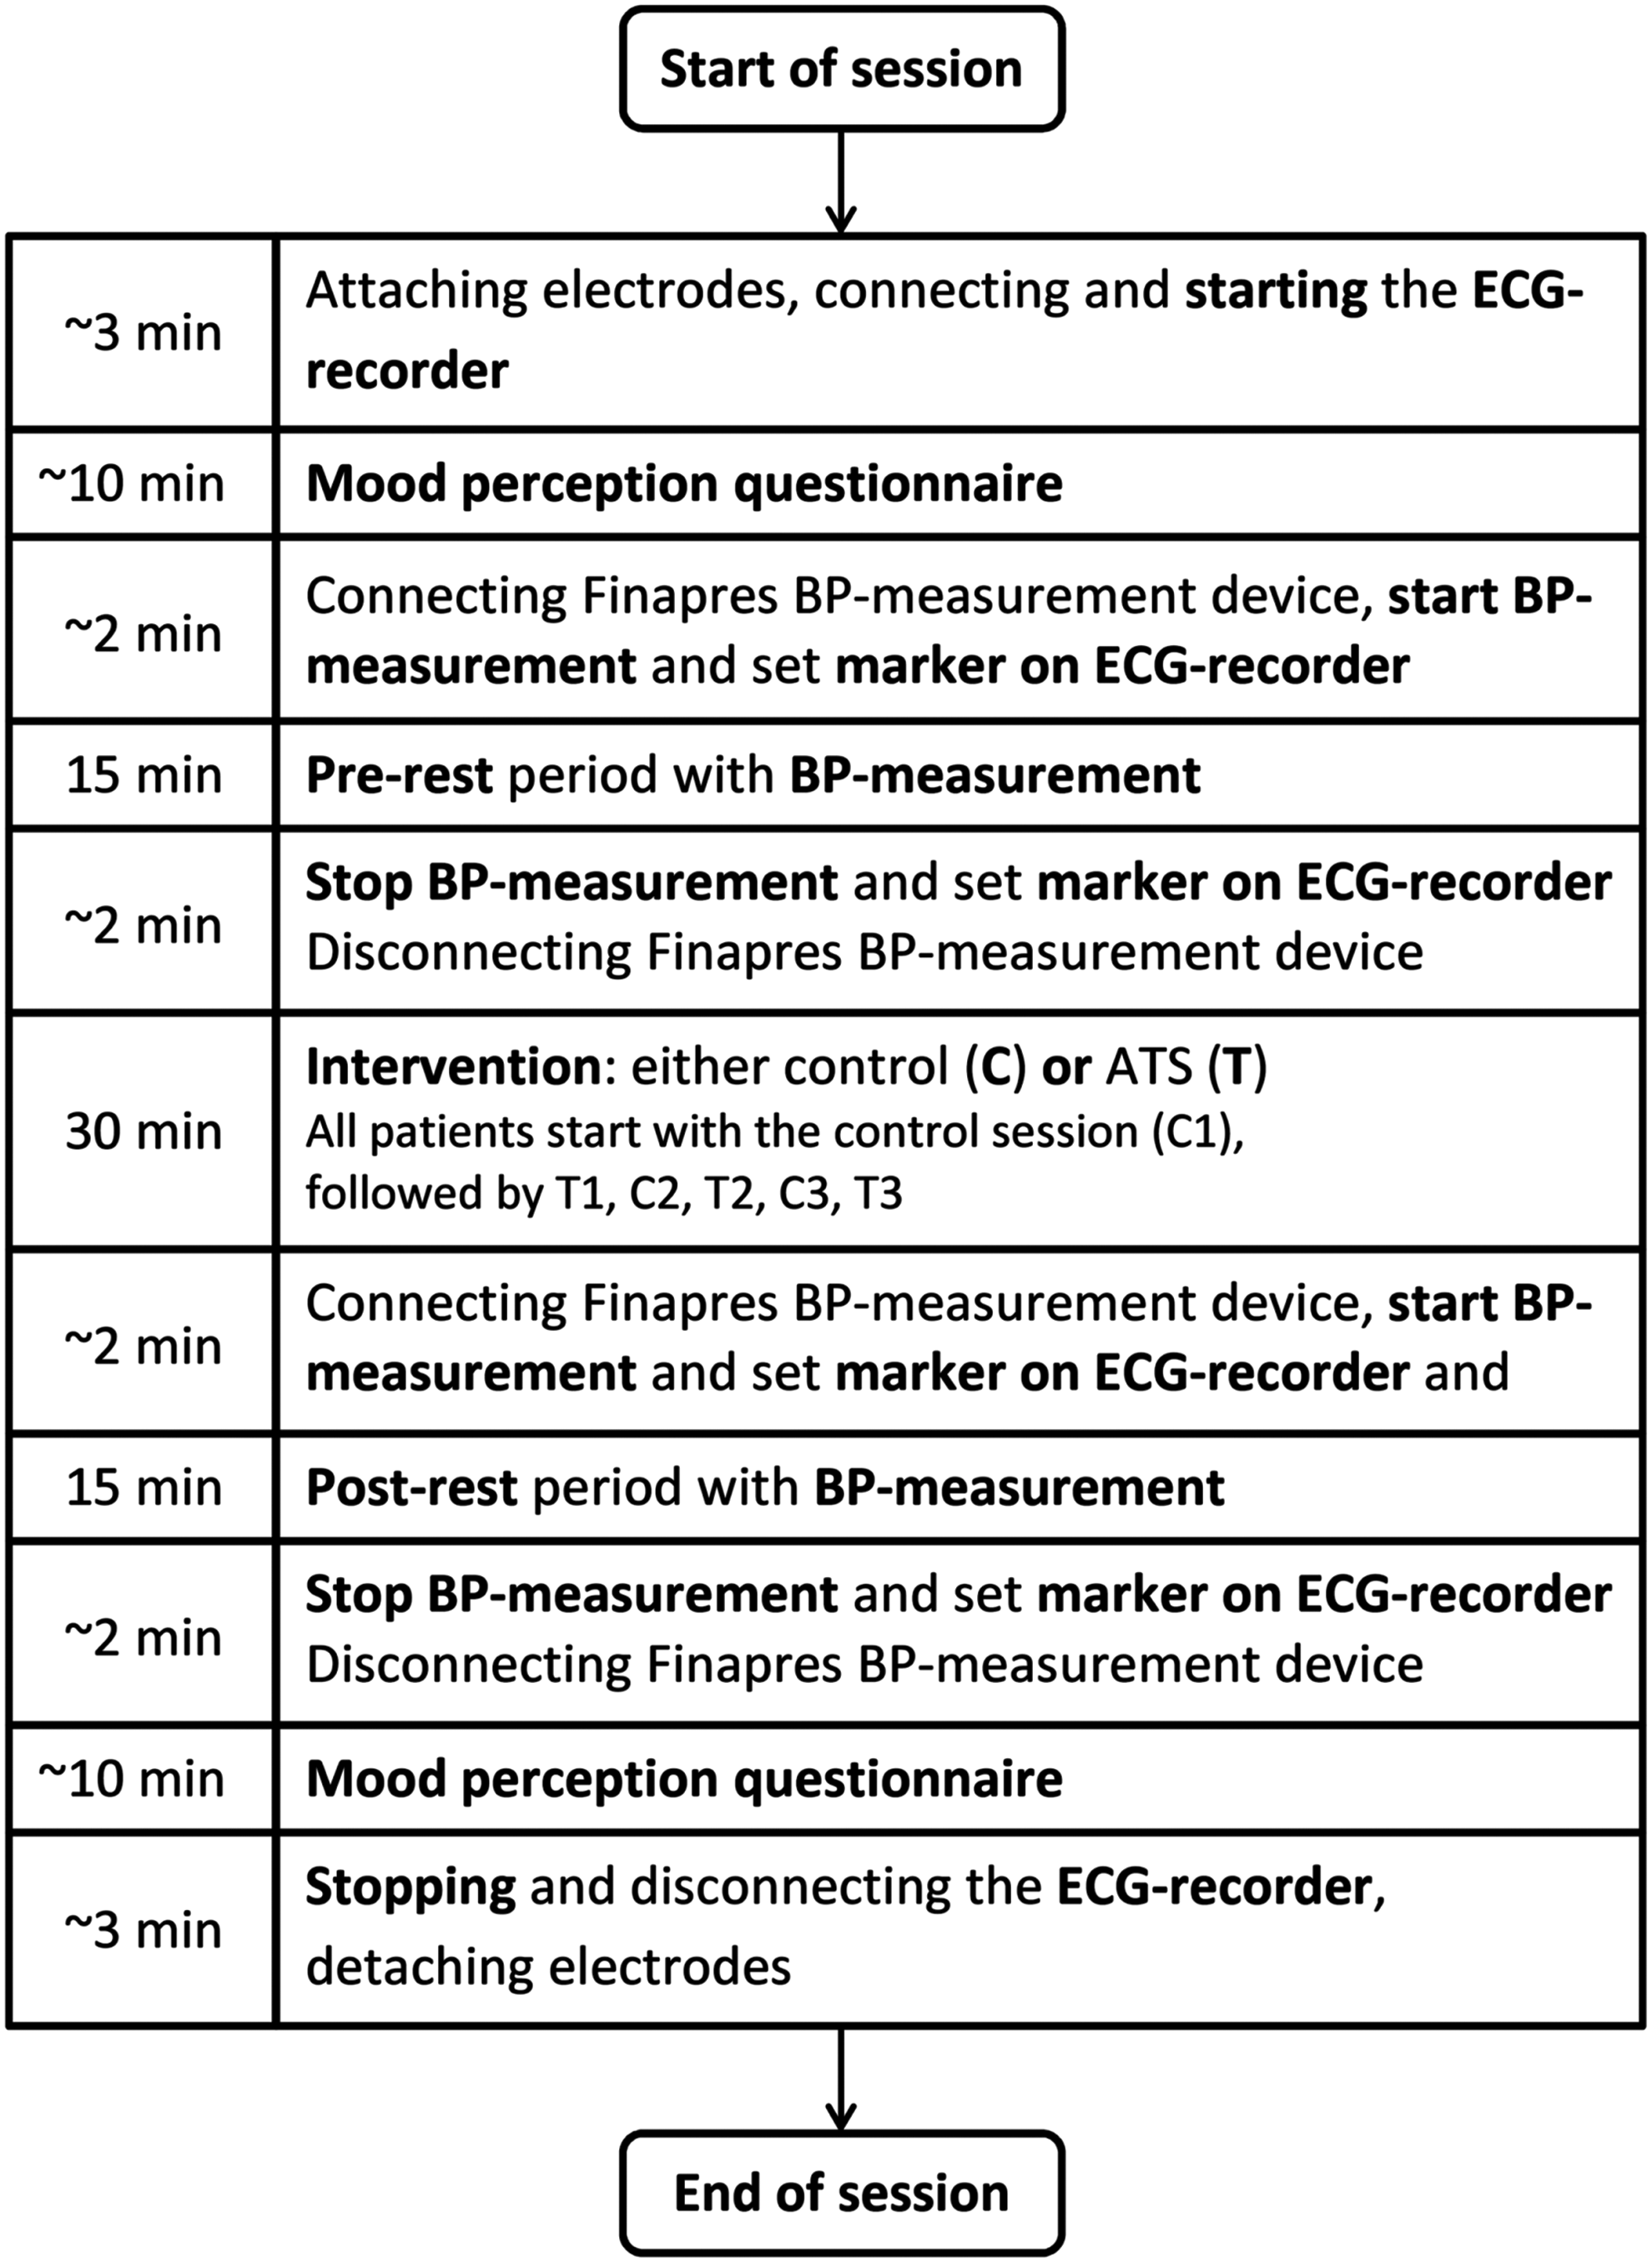
Flow diagram of the session. Sessions were executed over 2–3 weeks for each patient in the following order of intervention: C1–T1–C2–T2–C3–T3.
Data collection and outcomes
To determine the BRS, BP was continuously measured during prerest and postrest by the volume clamp method using a finger-cuff measurement device with 100 Hz sampling rate (Portapres®; Finapres Medical Systems, Amsterdam, The Netherlands). This device is useful for relative BP measurements as required for the determination of the BRS. 24 The verification of hypertension and normotension was performed in the clinical setting by 24 h BP measurements with a Mobil-O-Graph version 12 BP monitor (I.E.M. GmbH, Germany) before enrolment into this study. Based on the sequence method 25 and on a global approach, 26 the BRS was calculated in an advanced sequence method from statistical analysis of SBP changes versus HR differences of six consecutive beats, if the regression coefficient was larger than 0.8. A specifically designed computer program has been generated for this purpose.
ECGs were recorded with a scientific Holter ECG device (MK3; TOM Medical Graz, Austria) with a sampling rate of 4 kHz. The ECGs were visually inspected for artefacts, used to extract the R-peak to R-peak distances (RR) and to calculate the ECG-derived respiration. RR time series were treated with respect to statistical time domain analysis and fast Fourier HRV frequency domain analysis using MATLAB R2007a© programming, according to the 1996 North American Society of Pacing and Electrophysiology guidelines. 11 Primary outcome measure was the change of BRS, secondary outcomes were changes of HRV, SBP, and DBP during ATS.
Immediately before and after each session, the patients completed a questionnaire that was structurally based on the original Basel Mood Questionnaire 27 consisting of four of the original bipolar items (a, b, d, and i) plus eight new bipolar items, assessing symptoms of hyperventilation. These items provided possible answers to the question “How do you feel now?,” each with a visual scale, including seven defined tick possibilities that were thereafter coded with numbers 0–6. The items provide opposite answers (bipolar): (a) “quiet” = 6 and “nervous” = 0; (b) “fresh” = 6 and “tired” = 0; (c) “warm hands” = 6 and “cold hands” = 0; (d) “strengthened” = 6 and “weakened” = 0; (e) “warm feet” = 6 and “cold feet” = 0; (f) “harmonious” = 6 and “disharmonious” = 0; (g) “feelings of breath length” = 6 and “short of breath” = 0; (h) “relaxed” = 6 and “tense” = 0; (i) “active” = 6 and “powerless” = 0; (j) “I'm warm” = 6 and ‘I'm cold” = 0; (k) “clear-headed” = 6 and “dazed, dizzy” = 0; and (l) “pleasant feeling in the hands” = 6 and “tingle my hands” = 0. Answers to these questions are shown individually and as an average value (mood summary score), in which a higher score represent a better mood. To test for longitudinal changes (total of six sessions), the physiological parameters as well as the questionnaire scores were compared after the last therapy session with respect to baseline values. Changes for control sessions and therapy sessions were compared separately as a mean value of the mood summary scores.
Statistics
Average changes of BRS, HRV, SBP, and DBP, as well as of the mood summary score during therapy and sham interventions were calculated and shown as differences between postrest and prerest values. Statistical significance of differences between postrest and prerest values in both the hypertensive group and the normotensive group was detected by using the paired t test.
To test for longitudinal changes (from baseline to end of treatment) in the hypertensive and normotensive groups, the physiological parameters as well as the questionnaire scores are compared after the last therapy session with respect to baseline values (paired t test).
Statistical significance of possible differences between baseline characteristics (e.g., patients age) and outcome changes (questionnaire scores) of hypertensive and of normotensive patients was characterized with analysis of variance (ANOVA) tests.
Differences are considered as statistically significant if p ≤ 0.05; a statistical tendency is defined as p < 0.15. Data are shown as mean ± standard error of the mean, unless specified otherwise. The number of patients with valid data for analysis is shown when different from the total number of patients in each group.
Results
Baseline characteristics
Thirty-one patients participated in this study from September 2002 to April 2008. The majority of the patients had been diagnosed with arterial hypertension (n = 22). All patients completed the protocol. In total, 329 BP recordings and 356 ECG measurements were analyzed. Two ECG measurements, which did not meet the required signal quality, were excluded. Physiological baseline parameters were taken before the first control session.
The main baseline characteristics are depicted in Table 1. Two thirds of the patients are female (20). The hypertensive patients are older than the normotensive patients (50.6 ± 1.93 vs. 42.6 ± 3.34 years, p = 0.039, ANOVA test). In case of missing or corrupt data, the patient has been removed from the corresponding analysis. The number n in the tables indicate the remaining number of patients in the corresponding analysis. In hypertensive patients, SBP and DBP are generally elevated (149.2 ± 4.0 mmHg; 82.9 ± 3.2 mmHg) and BRS is generally lower (6.6 ± 0.6 msec/mmHg) than in normotensive patients (SBP = 125.3 ± 8.8, DBP = 71.2 ± 7.8 mmHg; BRS = 8.5 ± 1.4 msec/mmHg). The LF/HF ratio is slightly higher in hypertensive patients (5.5 ± 1.2) than in normotensive patients (3.2 ± 0.9); HR and SDNN range similarly in both groups (HR = 75.8 ± 2.1; 77.1 ± 2.2 beats per minute [bpm], SDNN = 39.1 ± 4.7; 38.5 ± 3.8 msec).
Statistically significant.
n, number of participants with valid data for analysis.
Within the two subgroups (hypertensive, normotensive), differences between baseline values and end-of-treatment values are compared.
Statistical tendency.
BP, blood pressure; bpm, beats per minute; BRS, baroreflex sensitivity; HF, high frequency; HR, heart rate; LF, low frequency; SDNN, standard variation of beat to beat intervals; SEM, standard error of the mean.
Physiological parameters
Table 1 summarizes the main physiological parameters after the last therapy session in comparison with baseline values. The SPB and DBP show pronounced scattering and SPB is regularly slightly higher after therapy or control for hypertensive patients. Mean SPB and DBP did not change significantly after therapy sessions compared with control sessions as well as after 3 weeks of therapy. Figure 2 represents the box plots for SBP and DBP before (Fig. 2a) and after (Fig. 2b) the intervention (C for control, T for therapy), in the course of treatment. The DBP in hypertensive patients exhibits a slight but significant increase after the last therapy session, compared with the baseline value (82.9 ± 3.3 to 86.7 ± 2.8 mmHg). The HR, BRS, and SDNN values change in hypertensive patients significantly after the last therapy session compared with their baseline values: HR decreases by 8.6 bpm (75.8 ± 2.1 to 67.2 ± 1.8: −11.3%), BRS increases by 1.1 msece/mmHg (6.6 ± 0.6 to 7.7 ± 0.6: +16.7%), SDNN increases by 6.4 msec (39.1 ± 4.8 to 45.5 ± 3.5 msec: +16.3%). The same parameters show for the analog comparison in the normotensive group no significant changes or statistical tendencies. The LF/HF ratio shows no significant changes in both groups, but a tendency toward slightly lower values in hypertensive patients (5.5 ± 1.2 to 4.4 ± 0.85: −20%), indicating a balance shift toward vagal activity.
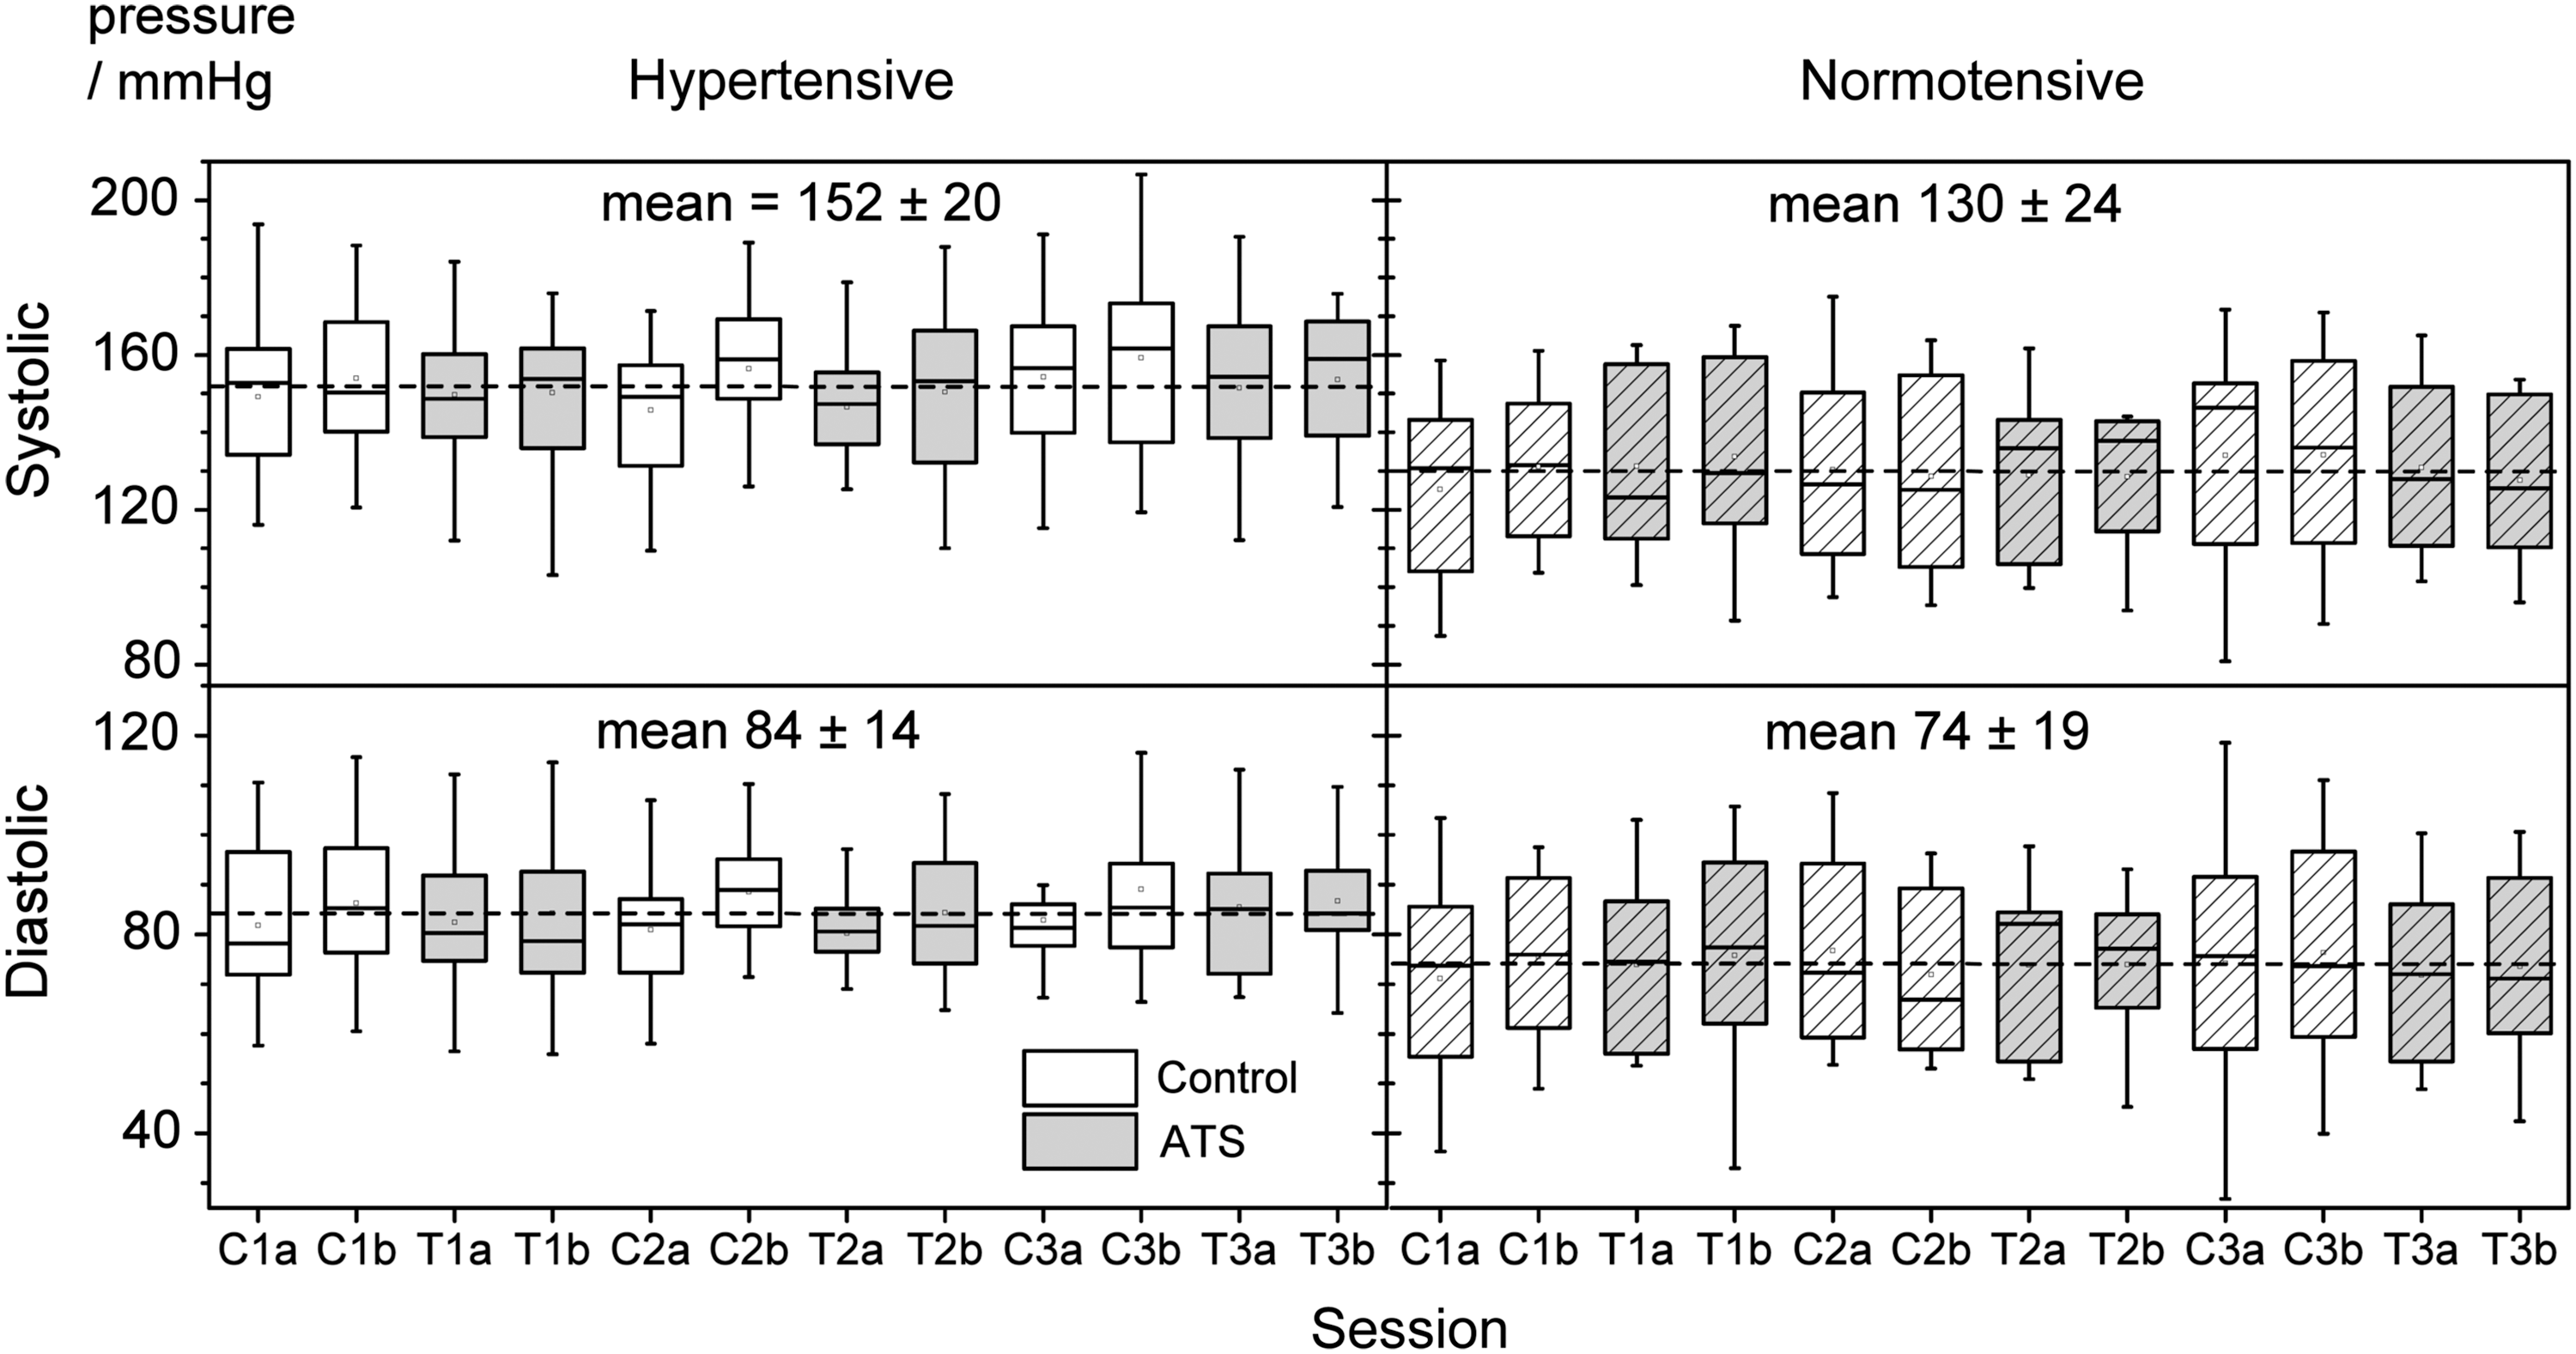
Box plots for systolic blood pressure and diastolic blood pressure. The labeling of the x-axis indicates the consecutive intervention in the course of treatment of hypertensive (open) and normotensive (diagonal lined) patients. C stands for control (white boxes) and T for therapy (gray boxes), before (a) and after (b) intervention.
Figure 3 shows BRS changes for consecutive sessions. In hypertensive patients, a strong alternating effect is observed with large, significant changes during therapy, and small, insignificant changes during control. In normotensive patients, all changes are insignificant with no discrimination between therapy and control. Intraindividual changes during control sessions are regarded as unspecific therapy effects and intraindividual changes during ATS sessions as the sum of specific and unspecific therapy effects. Hence, the specific therapeutic effects of ATS (EATS) are the intraindividual difference between the ATS and control sessions (e.g., EATS in Fig. 3).
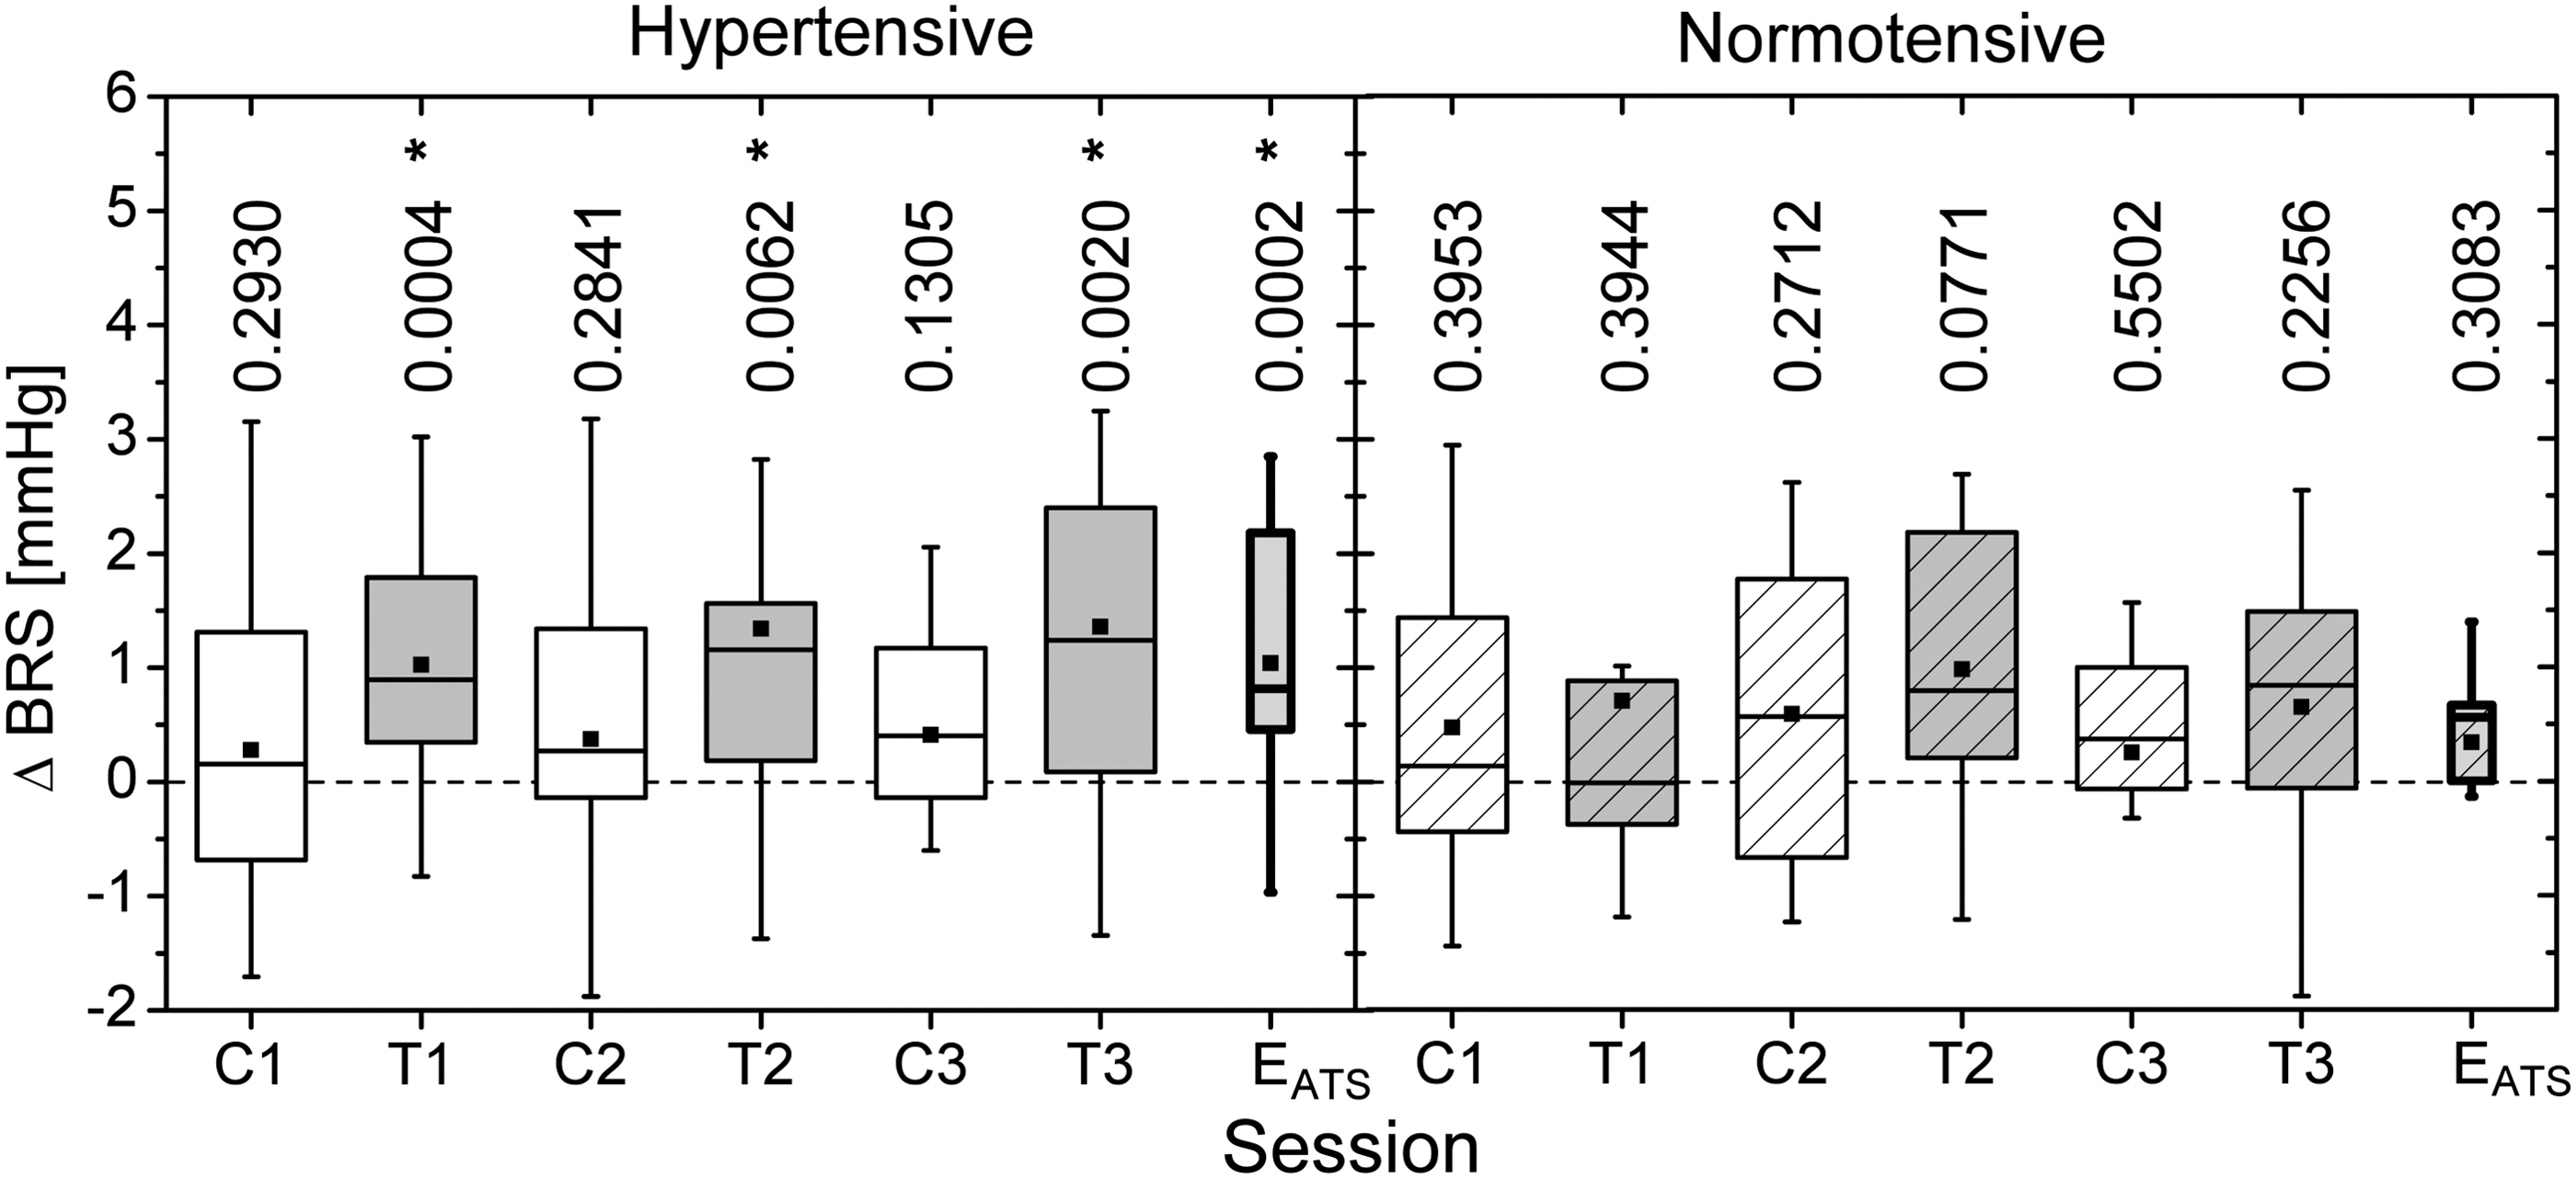
Mean changes in BRS (ΔBRS) (postrest BRS − prerest BRS) in control (C) and therapy sessions (T) for hypertensive and normotensive patients. The differences between the changes during therapy and during control (ΔBRST − ΔBRSC) give the specific therapeutic effects of ATS (EATS). BRS, baroreflex sensitivity; ATS, anthroposophic therapeutic speech.
Average immediate changes in HR, SDNN, and BRS after control and ATS sessions are compared in Figure 4 (changes are grouped together in separated mean values). The HR decreases significantly after the control and ATS sessions in both groups (in hypertensive patients: 74 ± 1 to 71 ± 1 bpm, p < 0.0001 during control, 74 ± 1 to 70 ± 1 bpm, p < 0.0001 during ATS and in normotensive patients: 80 ± 1 to 77 ± 1 bpm, p < 0.0001 during control and 80 ± 2 to 78 ± 1 bpm, p < 0.0011 during ATS). The HRV significantly increases during ATS in hypertensive patients (SDNN = 38 ± 2 to 43 ± 2 msec, p = 0.0003), but shows no significant change during ATS in normotensive patients. The BRS shows a highly significant, strong increase during ATS in hypertensive patients (6.03 ± 0.31 to 7.27 ± 0.35 msec/mmHg, p < 0.0001), and a significant, but less pronounced change during ATS in normotensive patients (8.20 ± 1.2 to 8.98 ± 1.2 msec/mmHg, p = 0.0273). Small yet significant BRS changes during the control session occur only in hypertensive patients (6.57 ± 0.35 to 6.92 ± 0.35 msec/mmHg, p = 0.0349). Significant average immediate changes in BP are only observed in hypertensive patients. DBP increases during control (81.9 ± 1.6 to 87.8 ± 1.9 mmHg, p < 0.0001) and during ATS (82.7 ± 1.7 to 85.0 ± 1.8, p = 0.0288). SBP increases during control (149.7 ± 2.4 to 156.4 ± 2.7 mmHg, p < 0.0001), but shows no significant change during ATS. Data of a single session compare well with grouped data.
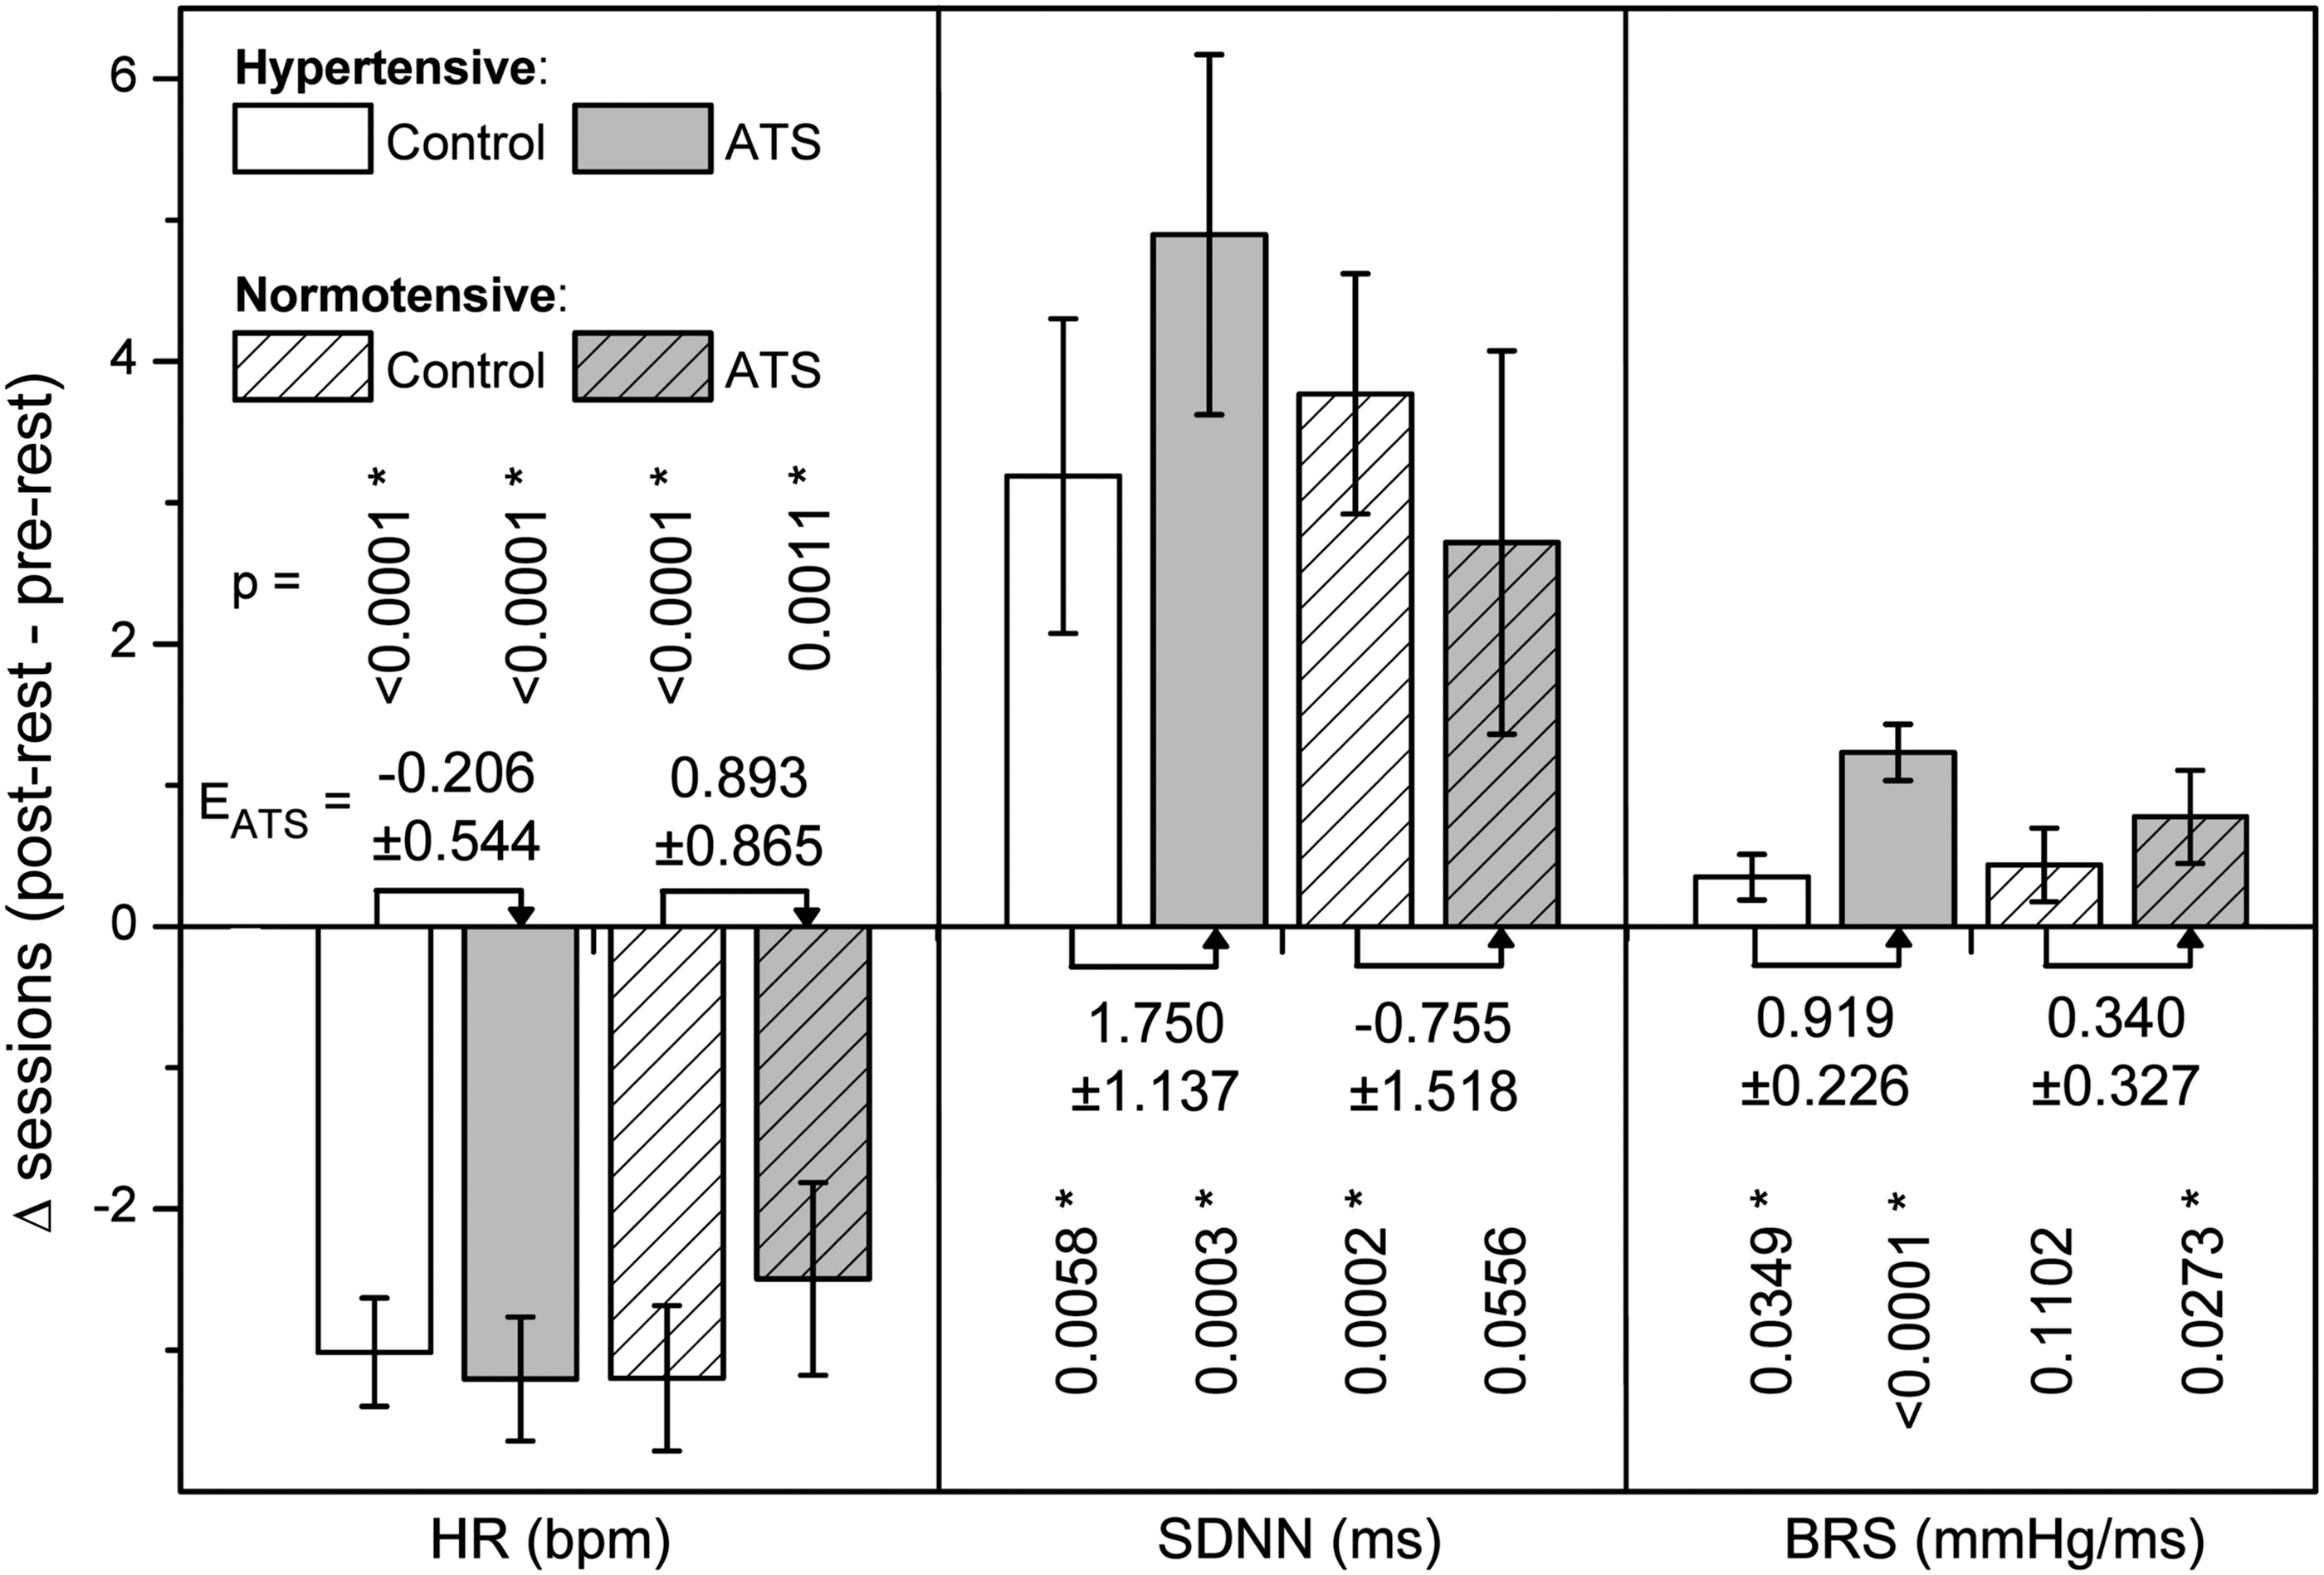
Changes in HR, heart rate variability (SDNN), and BRS during control (white) and therapy sessions (gray) for hypertensive (open) and normotensive (diagonal lined) patients. p-Values of all changes are given vertically aligned with the columns. The differences between the changes during therapy and during control give the specific therapeutic effects of ATS (EATS). HR, heart rate; SDNN, standard deviation of beat to beat intervals. (*Indicates p-values of significant changes in the parameters.)
EATS is also indicated in Figure 4. For hypertensive patients, we found EATS for: BRS = 0.919 ± 0.23 msec/mmHg, p = 0.0002; SDNN = 1.750 ± 1.137 msec, p = 0.1294; HR = −0.206 ± 0.544, p = 0.7058. This means that EATS is significant only for the BRS. EATS for the same parameter in normotensive patients are all insignificant: BRS = 0.340 ± 0.33 msec/mmHg, p = 0.3083; SDNN = −0.755 ± 1.518 msec, p = 0.6237; HR = 0.893 ± 0.865, p = 0.3128.
To estimate an immediate disease-related specific effect of ATS on BRS, the EATS in hypertensive patients (0.919 msec/mmHg, 14% of baseline) was subtracted by the EATS in normotensive patients (0.34 msec/mmHg, 4% of baseline). Accordingly, ATS shows an estimated immediate disease-related specific effect of about +10% on BRS. The same calculation suggests an estimated immediate disease-related specific effect of about +6.4% in the case of SDNN (1.750 msec, 4.48% of baseline subtracted by −0.750 msec, −1.96% of baseline) and about −1.4% in case of HR (−0.206 bpm, −0.27% of baseline subtracted by 0.893 bpm, 1.16% of baseline).
Mood perception
Both control and ATS sessions yielded short-term improvements in the mood in hypertensive as well as in normotensive patients. ATS led to stronger improvements than normal talking (control sessions). The positive effects were stronger in normotensive patients than in hypertensive patients as shown in the mood summary score (Fig. 5).
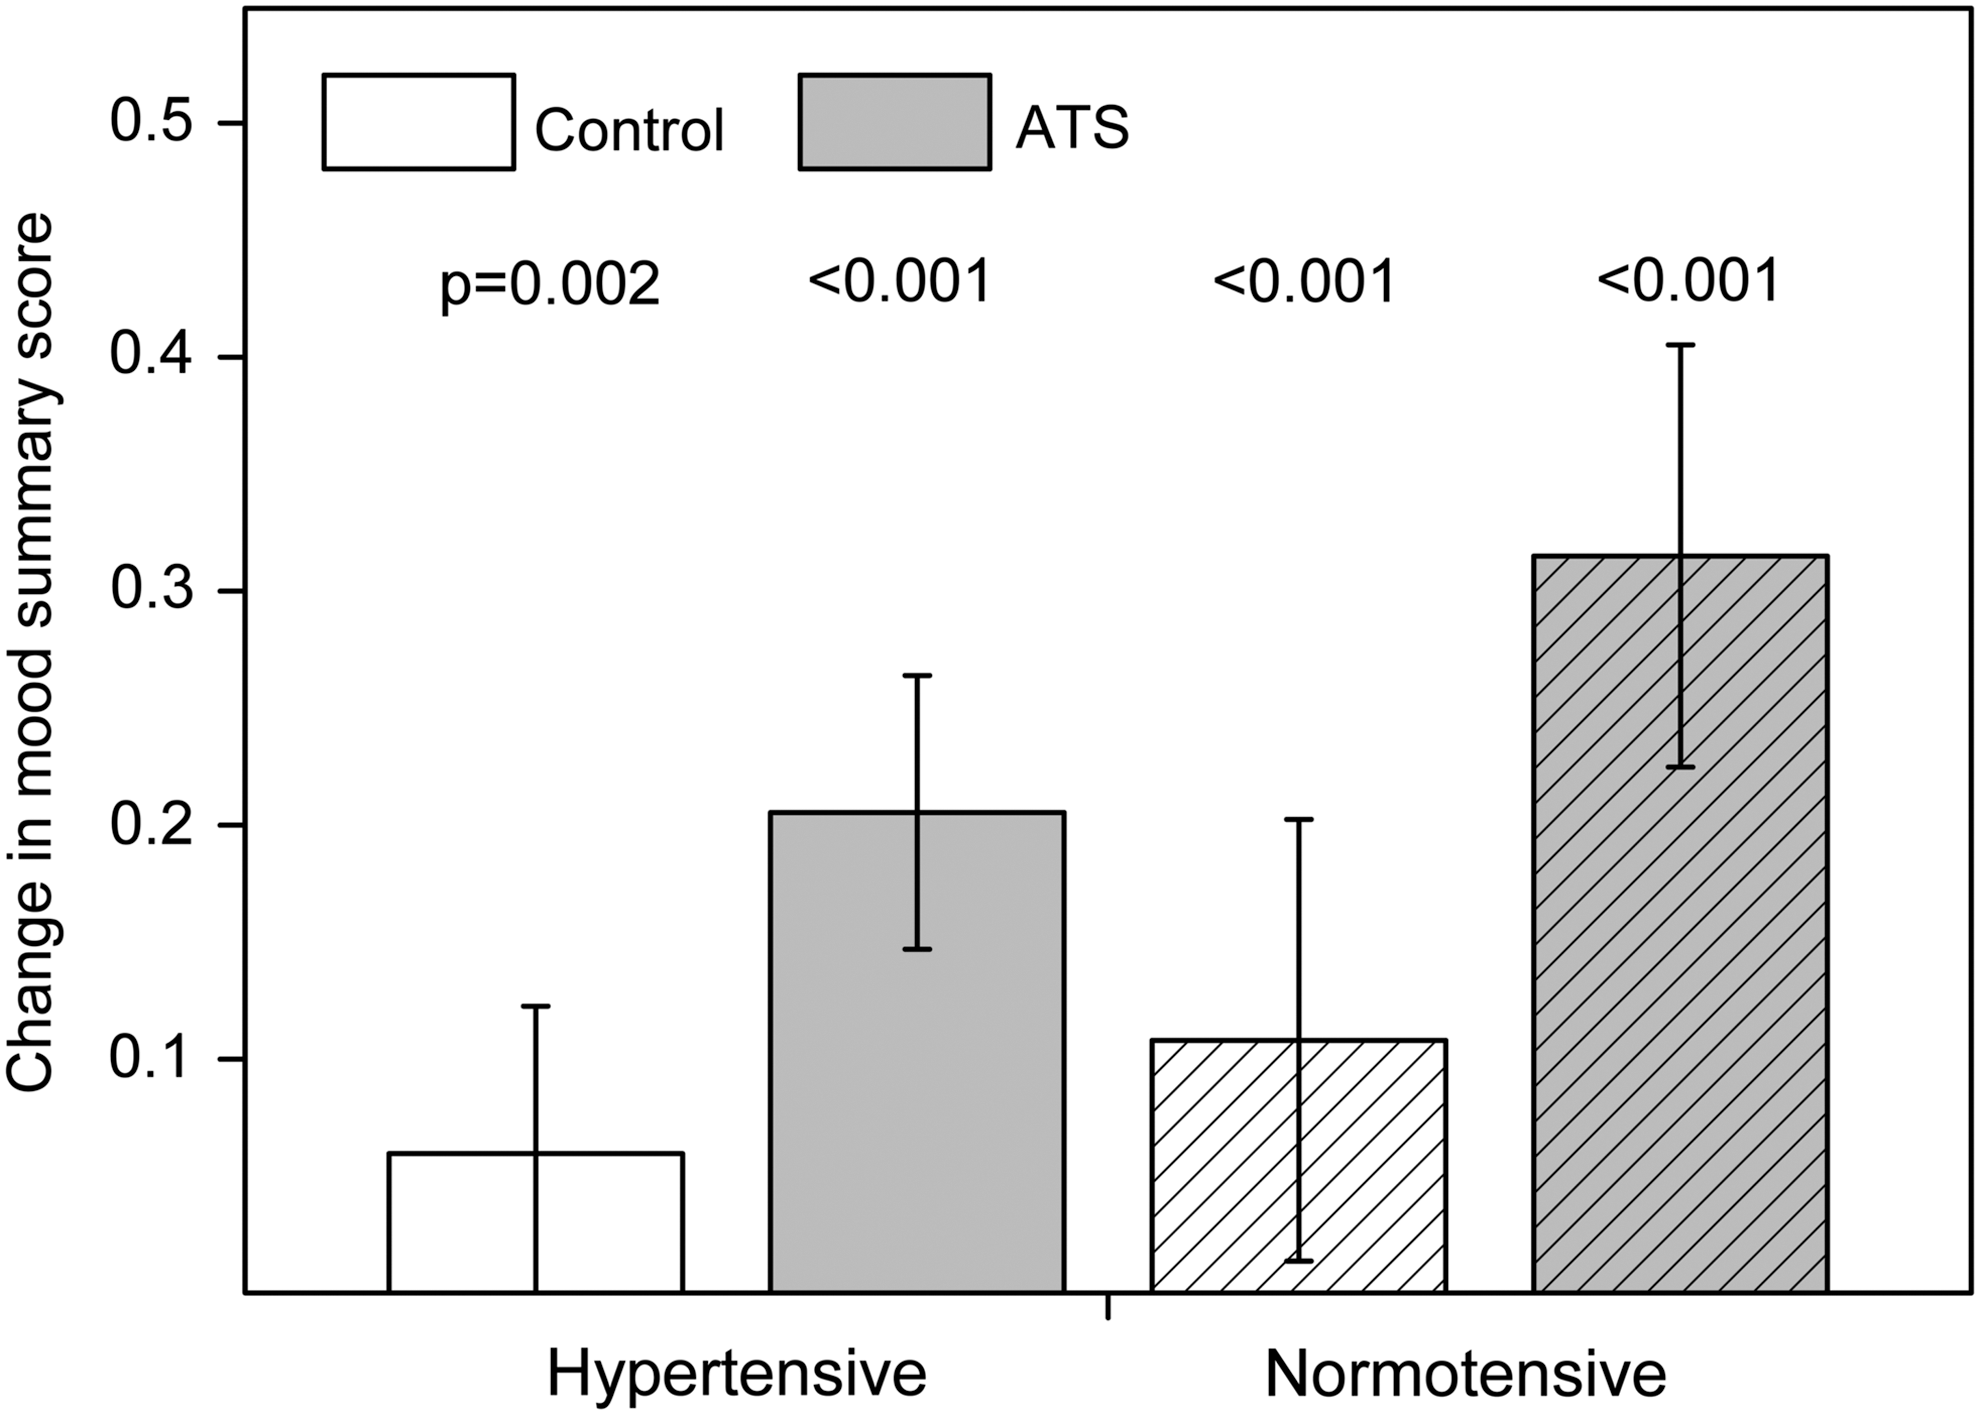
Comparison of the grouped data in “mood summary score” during control and ATS therapy sessions. Differences between the values obtained before and after the sessions show statistical significance in all cases.
Comparing longitudinal changes, ATS among normotensive patients led to statistically significant improvements in all mood items, except nervousness. Among hypertensive patients, significant improvements were observed in nervousness, breath shortage, and tension; tendencies were found for weakness, cold feet, and disharmony (Table 2).
Note that items are described by the negative aspect of the bipolar questions; a shift to higher values correspond to improvements.
Statistically significant.
Data shown as mean ± standard deviation.
n, number of participants with valid data for analysis.
Longitudinal changes in mood questionnaire during the study (from baseline to end of treatment, including all therapy and control sessions).
When comparing changes taking place during the study between hypertensive and normotensive patients, a statistical tendency could be found.
Statistical tendency.
Discussion
During the study period of 2–3 weeks, BRS changed significantly by 16.7% in hypertensive patients (6.6–7.7 msec/mmHg) and nonsignificantly by 9.4% in normotensive patients (8.5–9.3 msec/mmHg) from baseline to the end of the therapy. To control confounding variables over time, we administered a sham intervention (conversation with the therapist) and calculated the preintervention–postintervention effects. As a specific efficacy in case of hypertension, it seems that ATS immediately increased BRS by 10%, increased SDNN by 6.4%, and reduced HR by 1.4%. We did not observe a reduction of elevated BP levels after administering six sessions of ATS and three control sessions, neither for hypertensive nor for normotensive patients. In contrast, we observed a small but significant increase in DBP, which might be connected to higher BP amplitudes during interventions at simultaneously still pathological vascular resistance alteration factors. The missing reduction in BP may be attributable to the low number of six therapy interventions in our treatment group. It was previously shown that 10 min of musically guided breathing exercises per day can reduce the respiratory rate and lower BP by −7.5/−4.0 mmHg in uncontrolled hypertonia after 8 weeks of intervention. The total number of interventions in this other study amounted to 40–56 sessions, assuming a weekly practice on 5–7 days. An observable effect appeared only after 4 weeks of practice. 6 A marked reduction of BP with ATS might thus be attained only after a more frequent and longer application of the exercises, for example, 6–8 weeks, with daily practice. The observed increase in BRS after ATS exercise suggests a decrease in breathing frequency, since BRS is dependent on breathing rate. 28 This is in accordance with the clinical aim of the ATS exercises to induce a regular, deep, and slow breathing.
No previous study on ATS in hypertensive patients was available, which could have been used to determine the sample size. Several relevant cardiorespiratory effects could be observed in a previous study performed with 20 healthy subjects. 22 Therefore, a comparable number of patients have been recruited in the present study. A posteriori, one can say that the number of 22 hypertensive participants was sufficient to detect statistically significant differences (p < 0.05 with 80% power) between the situation before and after ATS in various outcomes (BRS, HR, SDNN). This demonstrates the feasibility of such a project in smaller clinical units.
The study design shows strengths and weaknesses that have to be considered. ATS, in this study, is part of a multimodal treatment in an integrative clinical setting. Even if changes in BP medication were among the exclusion criteria, the patients were subject to influences other than ATS, which perhaps confounded the aim to causally attribute longitudinal changes of the study parameters over the treatment period to therapy effects. We, therefore, regard the preintervention–postintervention analysis of the study parameters, as already demonstrated in previous studies, 20,22 as a meaningful way to elucidate immediate effects of the intervention. However, even if immediate effects are clearly attributable to the intervention, the context, meaning, and environmental influences (“placebo effects”) have to be considered. These effects may account for a considerable proportion of the total positive therapeutic outcome. 29 In ATS, creating an overall healing environment is also a core aim. Therefore, it is necessary to discern nonspecific influences from true intervention effects as much as possible. We thus used the same therapist for performing ATS and sham interventions in the same room with the same appliances attached. This is a feasible way to control important interpersonal and environmental as well as physiological nonspecific responses. 20,22
In comparison to hypertensive patients, ATS improved the mood score more consistently in normotensive patients. One could speculate that the reduced ability of cardiovascular regulation in arterial hypertension might be accompanied by a reduced responsiveness in health-related mood dimensions. Further investigations regarding the possibility of such a correlation are needed.
Conclusion
In this multicenter, prospective, exploratory preintervention–postintervention study, we compared the effects of speech-guided breathing during ATS with normal conversation during sham intervention on hypertension. We did not observe a reduction of high BP level after six sessions of ATS and three control sessions in hypertensive patients.
In summary, performing six sessions of speech-guided breathing was associated with a significant increase of cardiovascular regulation (HRV, BRS) in hypertensive patients in a real-life setting, without changing hypertension significantly. Longitudinal studies with longer exposure to ATS are needed for confirmation and further investigation of these first results.
Footnotes
Acknowledgments
The present study was funded by the Software AG Foundation and Weleda AG. The authors are grateful to Lukas Rist for substantial input and to Chantal Wälchli for questionnaire data transcription. The therapist, Andrea Klapproth, is gratefully acknowledged for performing AST at the Paracelsus-Spital Richterswil.
Author Disclosure Statement
The authors performed this study working at institutions in which Anthroposophic Medicine is being used.