
Abstract
Objectives:
The aim of this study was to assess the possibility of transmitting the “ampicillin” growth inhibitory property to pure sterile water.
Design:
Three control groups were designed as references of bacterial maximal growth (MG). Different concentrations of ampicillin and pure sterile water used as “positive” and “negative” controls, respectively, and the bacterial cultures supplemented with water that merely exposed to the background carrier waves were set as “sham control.”
Settings:
The electronic characteristic of the ampicillin solution relayed to the water and then it was added to the bacterial culture medium. By this treatment, water received both the carrier wave and ampicillin electronic properties at 1–105 Hz range.
Results:
When the MG of the “treated water” and “positive control” dilutions is getting normalized against either sham or negative control, the treated water competently imitates ampicillin in a way that there is no significant difference with the positive control. These results will be affected to some extent by the time of electronic transmission and the inoculation concentration of bacterial culture. Comparison of electromagnetic signal patterns of “treated water” with the “positive control” shows that they are more similar to each other rather than negative control.
Conclusion:
It is believed that the extremely low frequencies can facilitate electronic transmission of ampicillin supramolecular chemistry into water. Imprinting such a property in water could be the result of durable structural configuration in treated water.
Introduction
T
Basically, this peculiar property of “structured water,” or in some literature called “memory of water,” remained a major international controversy because of the difficulties to reproduce the results by other teams. 3 For example, it was found that the emitting EMSs are transmissible from a tube that contains an emitter DNA dilution to another tube that is filled with “naive” water. 4
Very weak natural EMSs at extremely low frequency (ELF) range (1–60 Hz) are generated in the earth ionosphere cavity. These frequencies are an intrinsic feature of the Schumann resonance (SR) that is also found as a feature of the sensor coils and amplifiers used by Parra and his group to detect SR. 4,5
The electric conductivity resembles the supramolecular self-organization and permanent polarization of water. Very dilute aqueous solutions (with the order of lower than 10−4 M concentrations) generate long-lasting (cold) vortices in crystalline-like-structured super fluidic domains. 6 Treatment of distilled water with low-frequency electromagnetic field provides the mandatory renewable energy target water that has a high level of long-range dynamic structuring of polarized-oriented molecules in multilayer formations. 7
Treatment of water with ultraweak electromagnetic emission changes the property of water in some way. 8 The magnetized water becomes different in pH, conductivity, evaporating temperature, and the total count of bacteria. 9 The existing controversy over water's diamagnetic property could be monitored spectrographically for the study of postexposure properties of magnetically induced water. 10 It would later describe periodic fading voltage fluctuations of water used as a dielectric that brings up the assumption that “long-term changes in water properties mediate the effect of electromagnetic fields on biological systems”. 11
Transfer of bioinformation in bioresonance therapy devices such as MORA and BICOM involves induction of biological noise transition. This informative noise is then transmitted through audio format. 12 The electromagnetic coupling is also known as the basis of the information transfer. When the device noise (a white noise) is used as a carrier wave for the signal, there would be a need for stochastic synchronization and stochastic resonance between the signal and the carrier. Hence, it is believed that its representation would be turned out like a noise itself. 1,13 There are other reports in which the biological information or medicine could be transmitted to water through ELF electromagnetic waves. 14 –16 Here, the authors intend to do a new experiment in which to see whether the ampicillin property (or its “information”) can be copied into the water.
Methods
Study design
The water imprinting procedure is usually performed during 1–7
Four groups of bacterial culture were designed. They are positive control (bacterial culture in the presence of different ampicillin concentrations), negative control (regular bacterial culture that contains deionized water), sham control (bacterial cultures in the presence of different dilutions of water that was treated with basal carrier noise of the transmitter device), and treatment group (bacterial cultures in the presence of different dilutions of water that was treated with both basal carrier noise and electronically transmitted ampicillin property and named as I-Amp).
During the first step, the maximal growth (MG) inhibition of bacteria in the presence of ampicillin was measured at concentrations of 10–10−15 μg/μL with the power of 10 intervals. To calculate the MG, first, the colonies of I-Amp, negative, positive, and sham control samples were counted. Second, the results of maximal growth in positive control and treatment groups divided by either negative or sham control. Third, the resulting ratio was normalized against negative or sham control and represented as a percentage. The concentration intervals increased to the power of 103 intervals in further experiments.
The same procedure was done for the samples that were investigated by optical density measurement.
Bacterial culture
The bacterial strain used in this study was Escherichia coli DH5α, purchased from Invitrogen (11319-019) and kept at −70°C in the freezer. For each set of experiment, it was taken from freezer, subcultured overnight, and the next day it was used as a seed of inoculation for the experiments. The bacterial strain was never treated with either ampicillin or any epigenetic factor. The nutrient broth (Sigma 70149) was inoculated with the concentration range of 10–104 colony forming unit (CFU) per milliliter of E. coli, which is equal to the optical density of 15 × 10−4 at 600 nm. In all experiments, the bacterial population increased from 7 × 10³ to 7 × 10⁷ CFUs after 16 h of incubation at 37°C.
Adjustment of minimal inhibitory concentration of ampicillin
The minimal inhibitory concentration (MIC) of positive control (ampicillin-Sigma, A9393) that guarantees MG inhibition of E. coli is almost 10−2 μg/μL in culture medium. 17
The MG of each treatment (including I-Amp or ampicillin) was monitored simultaneously by measuring the optical density of nutrient broth at 600 nm and counting the colonies on solid nutrient agar (Sigma 70148). Optical density measured by an Eppendorf Biophotometer. Colony counting performed according to the Odenholt-Tornqvist et al. 17 with the difference that only plates with >20 colonies were counted.
Electronic transmission of ampicillin property into water
The equipment used for electronic transmission comprised a bioresonance therapy device, Bicom version optima by Regumed (SN B021204.1412; Regulative Medizin Technik GmbH, Germany). The transmission procedure performed was in accordance with J. Antonio Heredia-Rojas et al. 18 with the difference that in this case ampicillin was electronically transmitted for 1–5 h to 3 mL of deionized water. Signals were recorded every 30 sec during 30 min of transmission. The maximum time that the Bicom device allows signal transmission is 30 min. For longer transmission times of 1–5 h, the same procedure is repeated. The maximal range that the spectrum analyzer can apply the Fourier transform is 0.01–1000 Hz, so the authors could not check signal transfer at higher frequencies. Since water was always placed in the glass beaker and then placed inside the cups, there was no need for cleaning the cups between exposures. Both cups contain a plastic cover that shields them from electronic noise. Besides, the cups are made of brass that helps to inhibit penetration of external electromagnetic noise into the cup (Fig. 1A).
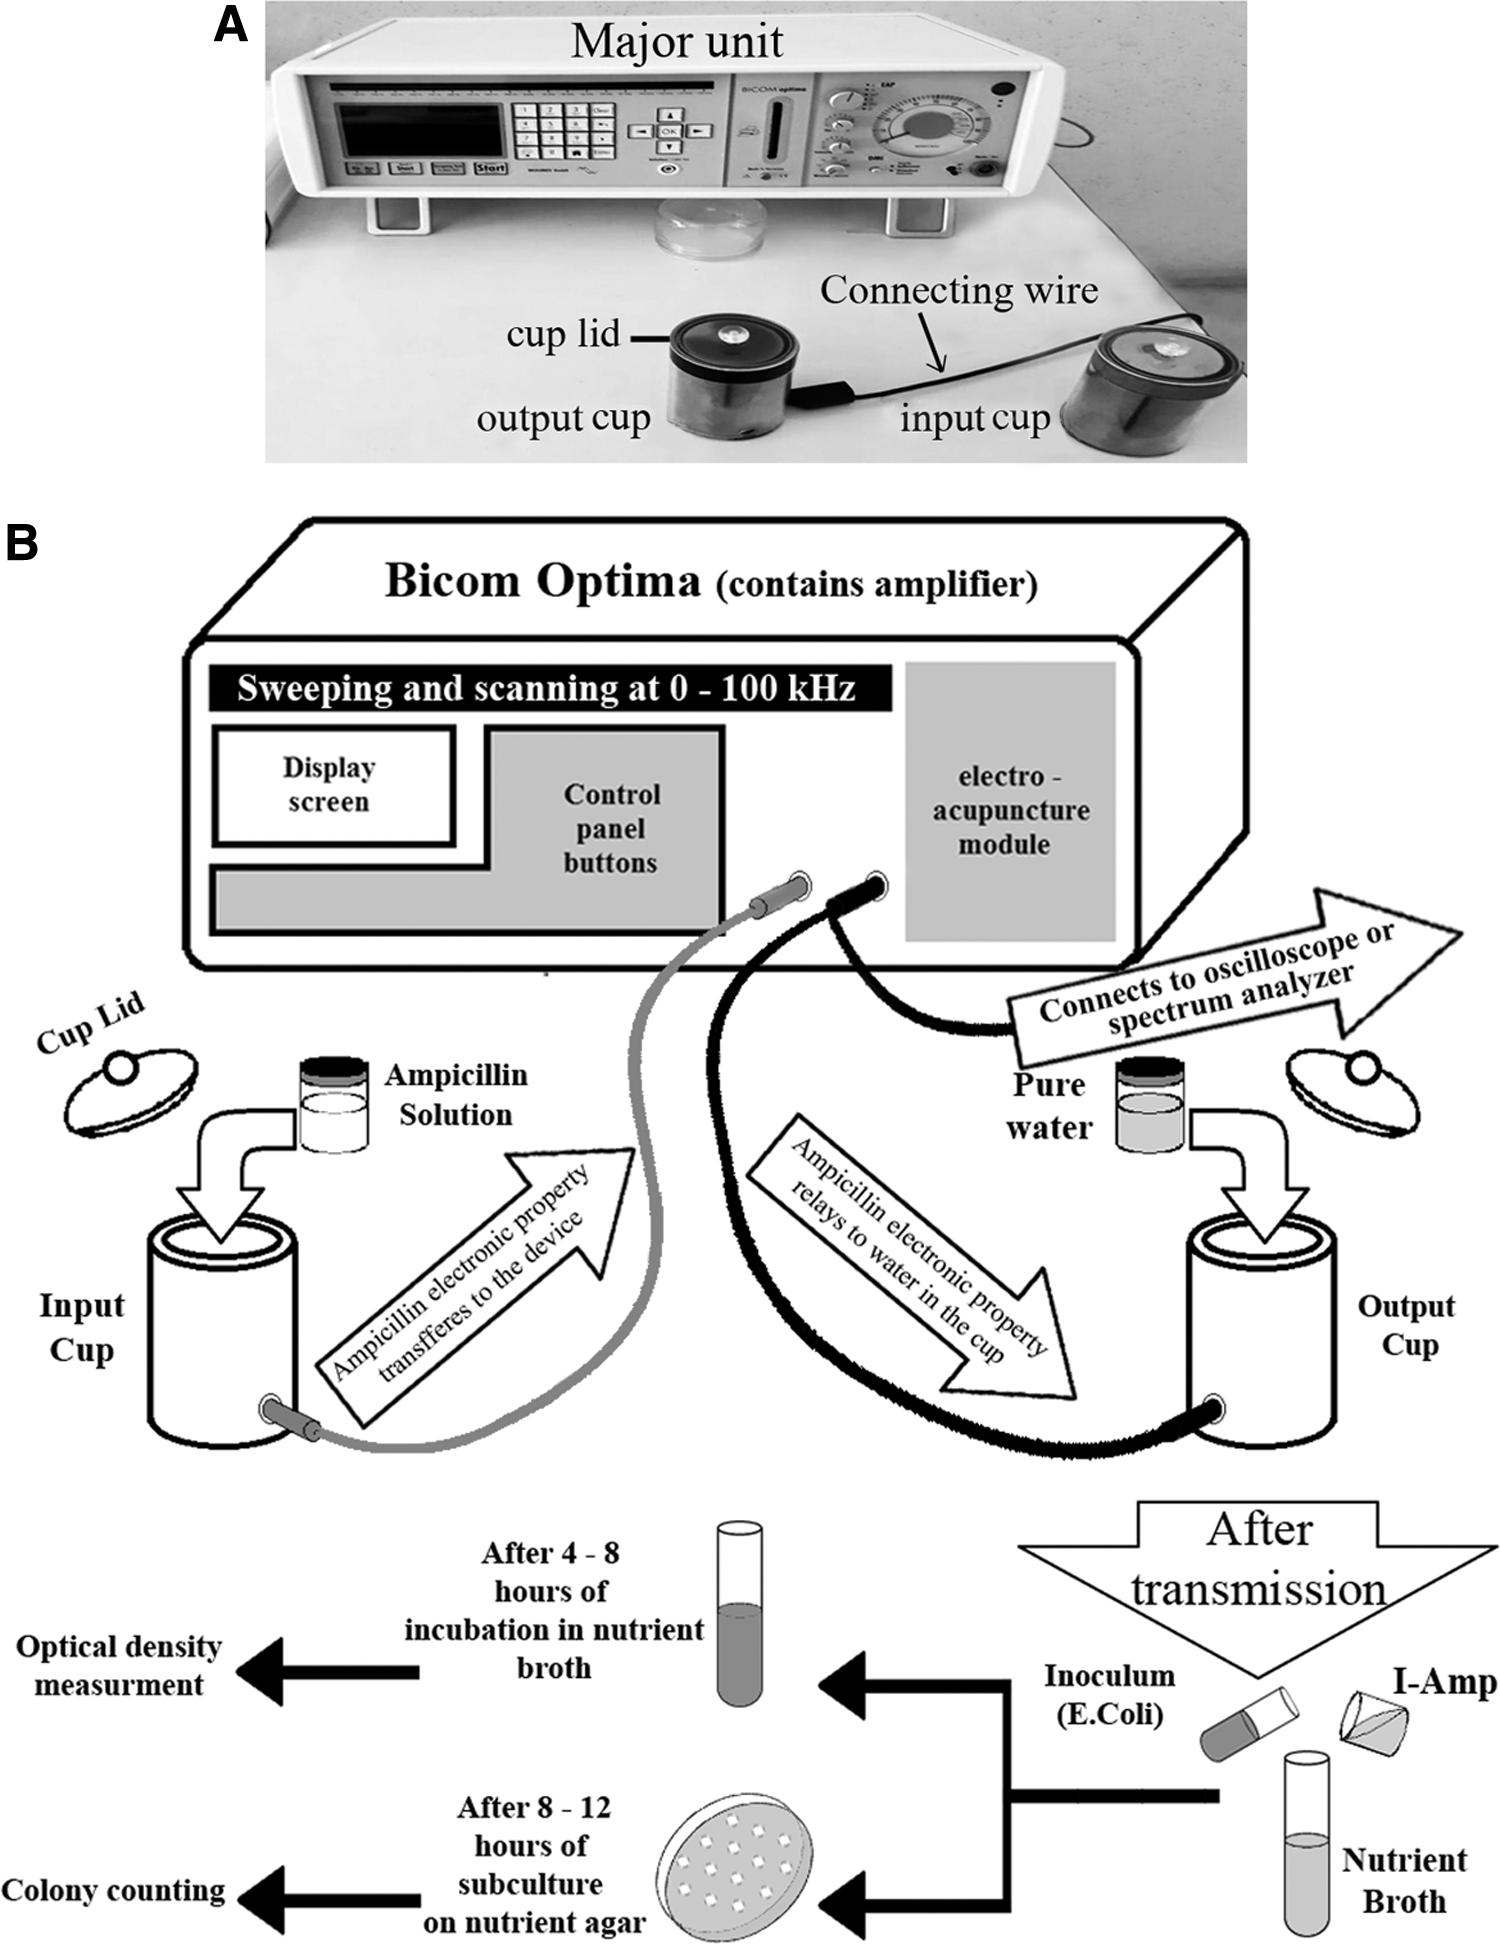
The ampicillin electronic transmission setup.
During the transmissions, antibacterial property relayed from the input cup to the output cup of the BICOM Optima device (Fig. 1). Signals are transmitted through a Polyvinyl chloride (PVC)-insulated copper wire with 5 mm banana connectors at the ends. The output cup always contains double distilled sterile water and the input cup was either empty (for sham control treatment) or filled with 10 μg/μL of ampicillin (Fig. 1B). The electronic characteristic of the ampicillin solution transfers to the water through a rapid sweep at 1–105 Hz that is so-called normal range. The frequency of sweep took 180 sec with 10 times of amplification. Any electronic signal that comes out of the ampicillin solution is detected through this sweep. Then, it would be relayed to the water in the output cup. The BICOM device was turned on for 1, 3, and 5 h of transmission and the treated double distilled water was then sterilized by a mixed cellulose ester syringe filter (Millipore™).
Evaluation of imprinting efficiency before the MG test
To achieve a uniform dilution, all the imprinted specimens were agitated vigorously for 15 sec after transmission. All the information transferred from cup to cup was monitored (Fig. 1B) through GPS-1072B digital oscilloscope and spectrum analyzer (Alemi Bros.). The GPS-1072B has a 70 MHz bandwidth with a 1 Giga sample/second sample rate. Fast Fourier transform estimates the spectral density of recorded signal from its original time domain (second) and converts them to the frequency domain (Hz). The spectrum analyzer has a 1 kHz bandwidth with a 100 Mega sample/second sample rate with 1.95 Hz resolution. All the signal transfer process was assayed (up to 5 h) through frequency sweeps with ±50 Hz wobbling in the range of 0.01 Hz to 1 kHz. The recorded signals in each step were summed up to depict a comprehensive view of the signal transfer in the spectrum.
The EMS patterns of ampicillin are usually detectable in time intervals of 120 to 180 sec. Hence, all of the marked frequencies of SR range are not present with the same amplitude in each pattern. However, the extended time of data transfer (1–5 h) guarantees the relay of all detected Fourier transformed frequencies.
Analysis
All experiments performed in triplicate were averaged and their standard deviation was calculated. The results of treatment with I-Amp were normalized against their corresponding negative or sham control. There are two main reasons for reporting all the results in relative term. First, what was frequently repeatable about the results is their trend of bacterial growth or survival, not merely the absolute amounts. Second, data normalization puts them on the same scale, which then made them comparable. To find the homology among the aforementioned trends, bivariate correlation (Pearson coefficient) and one-way ANOVA were used. It must be noted that the Fourier transformed patterns are raw data and must be averaged to look like those graphs that are represented in Figures. To quantify the difference between averaged patterns, we performed one-way ANOVA test. This test was run for ampicillin, I-Amp, and negative control records through entire spectrum.
Results
It is reported that MG in the presence of ampicillin at concentrations of lower than MIC (10−2 μg/μL) is not further guaranteed. It could be even inverted in a way that the bacterial growth in the treatment group is not only inhibited but also exceeds the negative control (nontreated bacterial culture). 17 These results of positive control bacterial culture were in agreement with previous reports. In the following two sections, the imprinted I-Amp property into the water was reported after 5 h of transmission.
Comparison of bacterial MG when outputs are normalized against the negative control
Comparison of the sham control's MG with I-Amp shows that dilutions of 10, 1, 10−1, 10−2, 10−3, 10−8, and 10−12 μg/μL considerably exceed their I-Amp homologue (Fig. 2A–four-point stars). In conclusion, water that merely received the carrier noise (sham control) could not inhibit bacterial growth as well as I-Amp.

Counted bacterial colonies in the presence of different concentrations. The MG is normalized against the negative control (intact water) ) represent significant differences between maximal growth (MG) of sham control and I-Amp. Five-point stars (★) represent significant differences between MG of ampicillin and I-Amp.
The ampicillin MG is considerably higher than sham control MG and I-Amp MG at concentrations of 10−4, 10−5, and 10−11 μg/μL (Fig. 2A–five-point stars). However, positive control still keeps its lower MG with respect to sham control in the remaining concentrations (Fig. 2A). Most dilutions of I-Amp are not considerably different from those of ampicillin. Hence, it is concluded that differential dilutions of I-Amp have similar growth inhibitory strength like ampicillin (Fig. 2A).
Comparison of bacterial MG when outputs are normalized against the sham control
When both I-Amp and positive control are normalized against sham, almost no significant difference was observed in their MG. However, at dilutions of 10−14 and 10−15 μg/μL, positive control MG considerably falls behind I-Amp MG (Fig. 2B–five-point stars). It means that bacterial MG increases in correlation with elevation of I-Amp dilution (Fig. 2B). At a general view, MG profile of I-Amp increased in chorus with positive control through a linear decrease of concentration. I-Amp MG profile was not as perturbed as positive control profile when they were both normalized against sham control (Fig. 2B).
Impact of inoculum concentration on bacterial MG at serial dilutions of ampicillin
Different inoculum concentrations are adjusted at optical densities of 1.5, 0.15, and 0.015, which give us CFU contents of 103, 102, and 10 in each milliliter, respectively.
In a general trend, the MG is inversely correlated with the ampicillin concentration (Fig. 3). This trend is observed either in optical density (Fig. 3A) or in colony count (Fig. 3B) method. The 10 CFU/mL comes with a rather perturbed MG profile compared with the time that 100 or 1000 CFU/mL was applied (Fig. 3). Considering inoculum concentration assay, the authors could define an “equilibrium index,” which is the ratio of “inoculum concentration/Amp concentration.” The more this ratio gets closer to zero, the trend of bacterial growth gets more perturbed (Fig. 3).
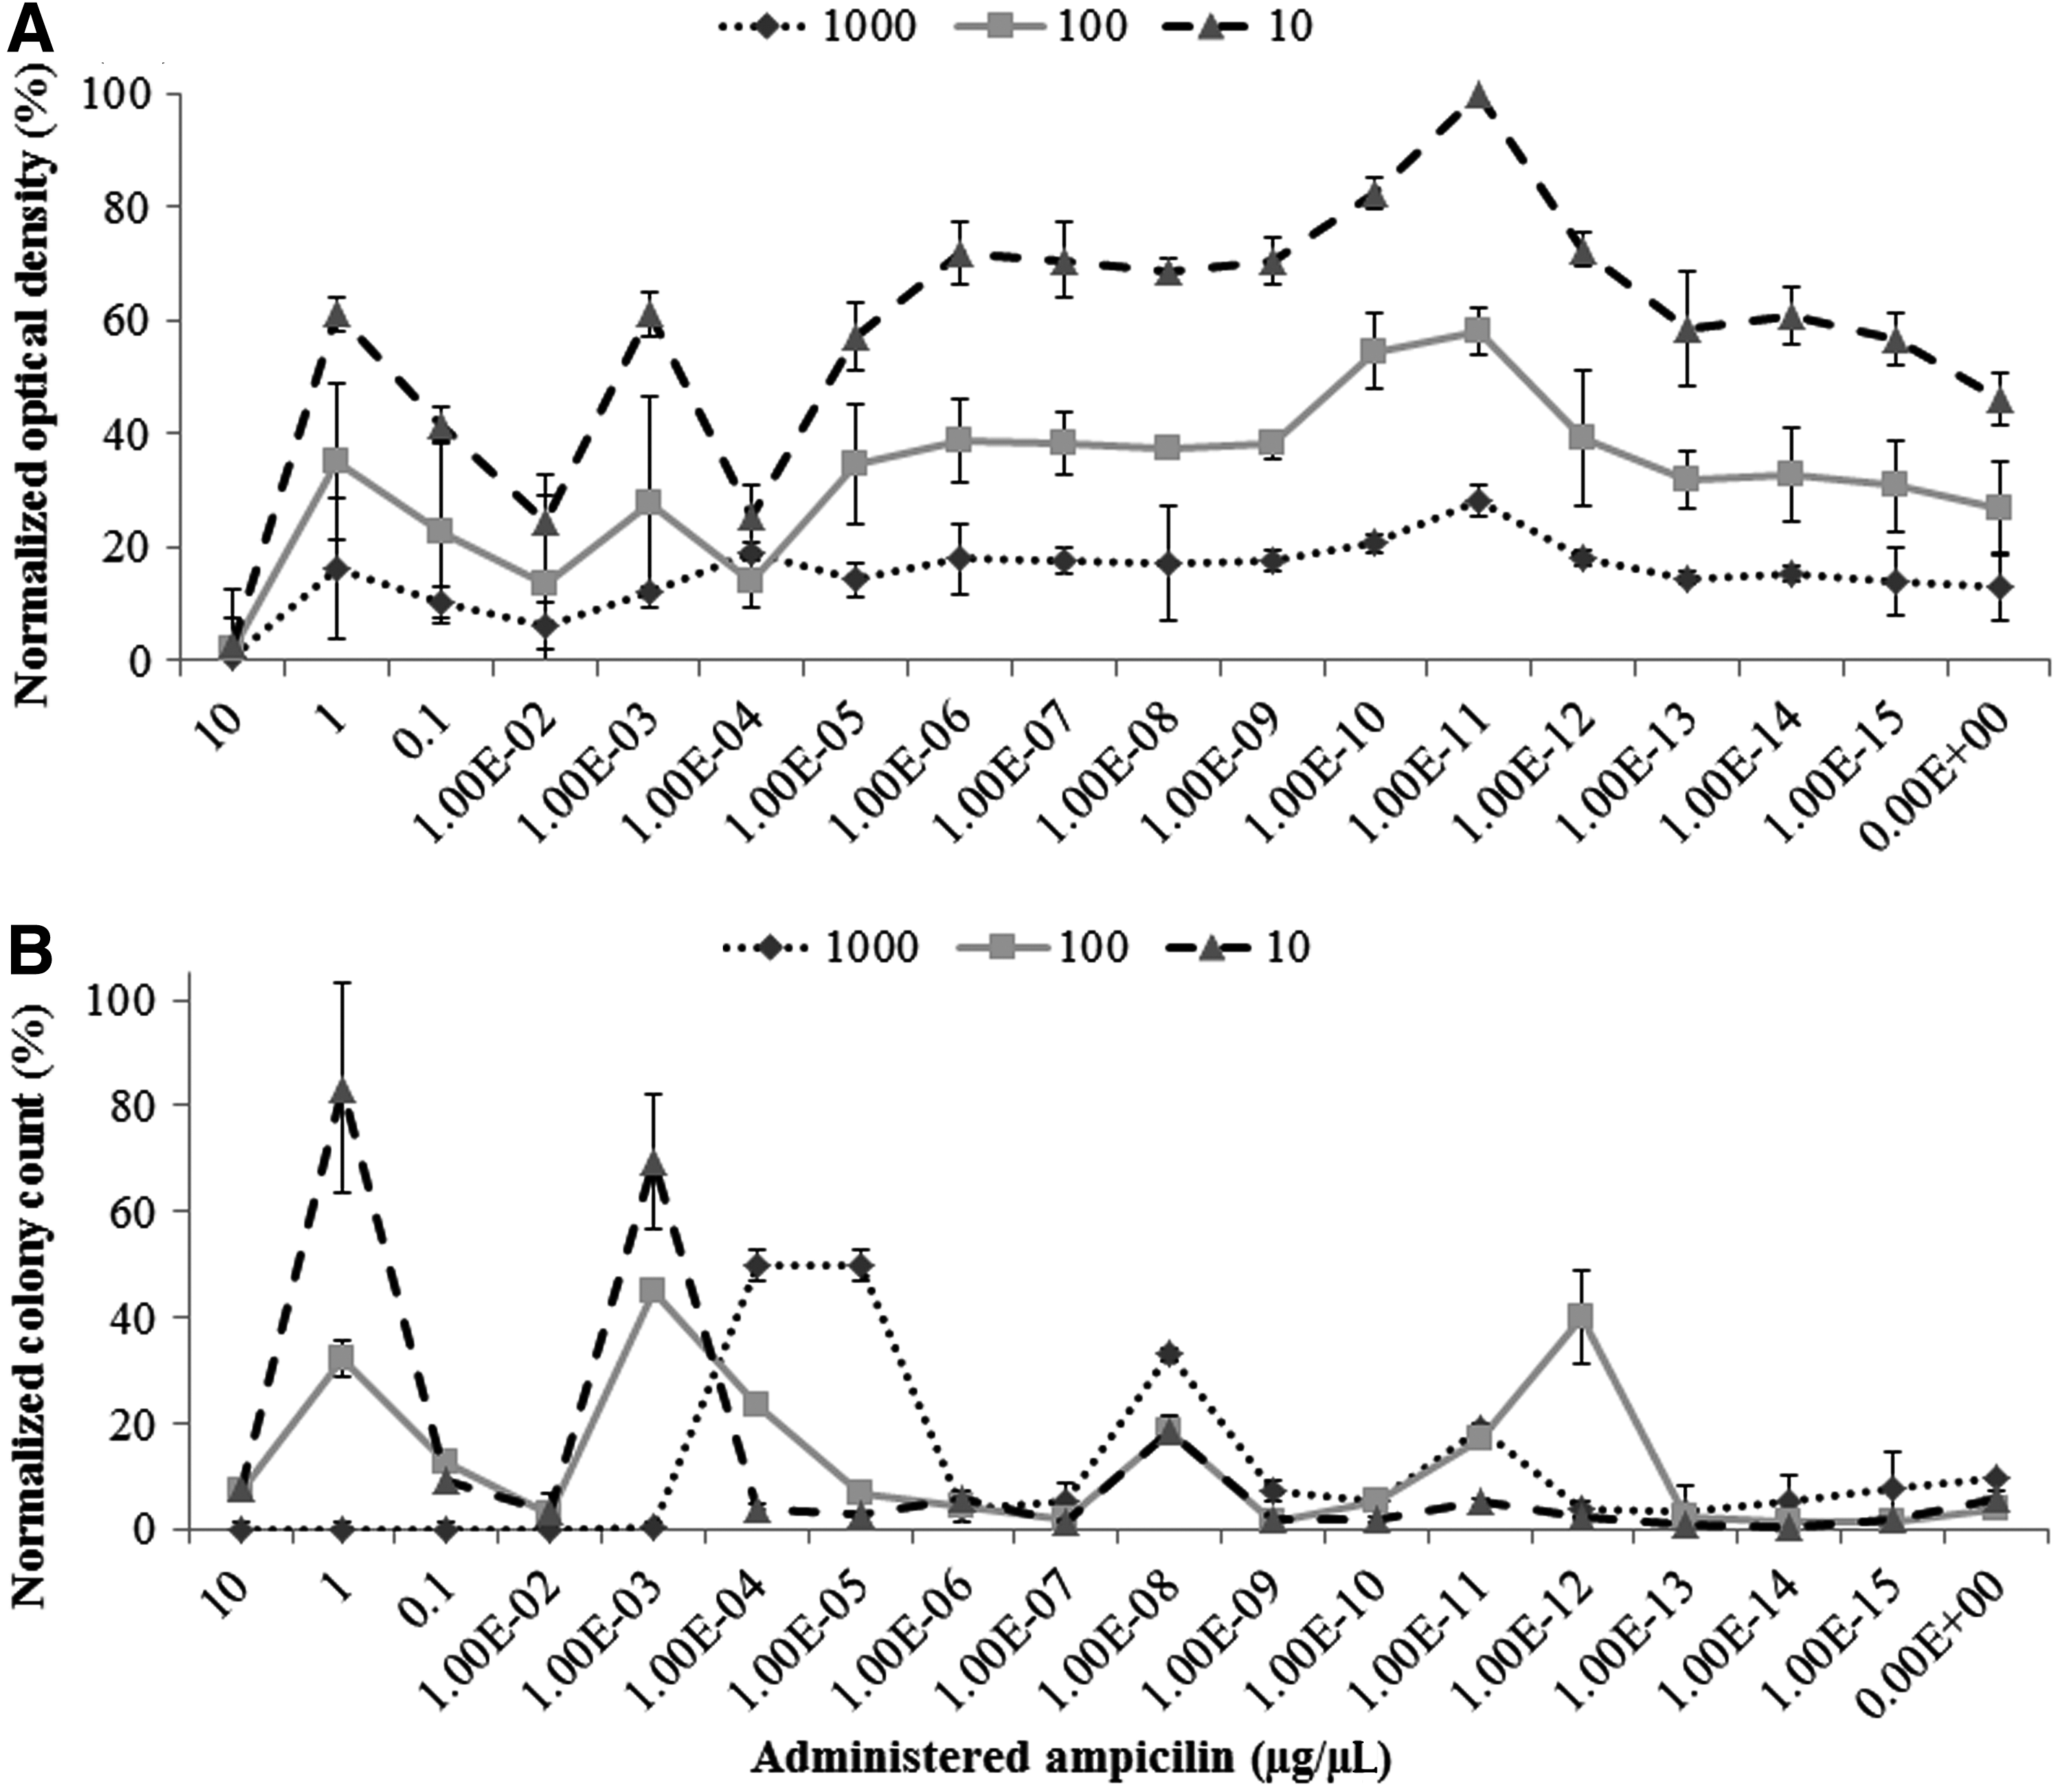
Effect of inoculum density on bacterial MG. Impact of three different bacterial inoculum concentrations of 103, 102, and 10 colony forming unit/milliliter is compared. The MG monitored using
Evaluation of MG correlation with the duration of electromagnetic transmission
In this section, the effect of electromagnetic exposure time on MG is monitored through the optical density and colony counting measurements (Fig. 4). Water is exposed to electromagnetic transmission for 1, 3, and 5 h.

The MG and its correlation with electronic transmission time. The MG of I-Amp through 1, 3, and 5 h of treatment is assessed through
As optical density test reveals, there is a right shift in I-Amp MG profile (Fig. 4A). Hence, the more the transmission time, the more the MG is observed in higher dilutions of I-Amp. Maximal growth of the ampicillin at one dilution (10−5 μg/μL) remained less than its I-Amp equivalent either after 1 or 3 hours of transmission. (Fig. 4A–five-point stars). At dilution of 10−8 μg/μL after 5 h of transmission, the I-Amp MG reduced to be less than ampicillin MG (Fig. 4A–five-point star). The correlation coefficient of growth inhibition profile grows in chorus with an increment of transmission extension (72.19, 79.59, and 90.01% for 1, 3, and 5 h, respectively). In other words, there would be more similarity between I-Amp and ampicillin MG profile, when the time of transmission increases.
According to the colony counting method, the MG in the three I-Amp dilutions (10−2, 10−8, and 10−14 μg/μL) significantly exceeded their corresponding positive control after 1 h of transmission (Fig. 4B–five-point stars). After three to five hours of transmission, only one dilution of I-Amp (10−2 μg/μL) results in higher MG compared to the positive control (Fig. 4B).
MG correlation with electronically transmitted ampicillin at ELF range
To see whether electronic transmission of ampicillin antibacterial property into the water is correlated with certain frequencies at ELF range, a digital oscilloscope and a spectrum analyzer were applied to monitor the information transfer from cup to cup.
There were 60 records of electronic transmission for 30 min of sample recording by either oscilloscope or spectrum analyzer. Then, they were categorized as the five most repeatable EMS patterns (Fig. 5A1, A2 ). For this purpose, a homology test between 60 records was performed. The correlation coefficient that the test gives us could be used as an index for repeatability of EMS patterns. Finally, five most repeatable pattern groups were averaged and demonstrated as a spectrum of each sample (Fig. 6). When correlation coefficient is almost zero, lower repeatability of the EMS pattern is expected. Increment of correlation coefficient up to one guarantees repeatability of the EMS pattern. For example, the correlation coefficient between five repeatable ampicillin EMS patterns that were recorded by oscilloscope at the range of 0.01–1000 Hz was 0.016, which improved to 0.73 after Fourier transformation. This observation indicates that the increased correlation coefficients are more due to the impact of Fourier transform equation that makes results more reproducible than necessarily a positive result among the signals.
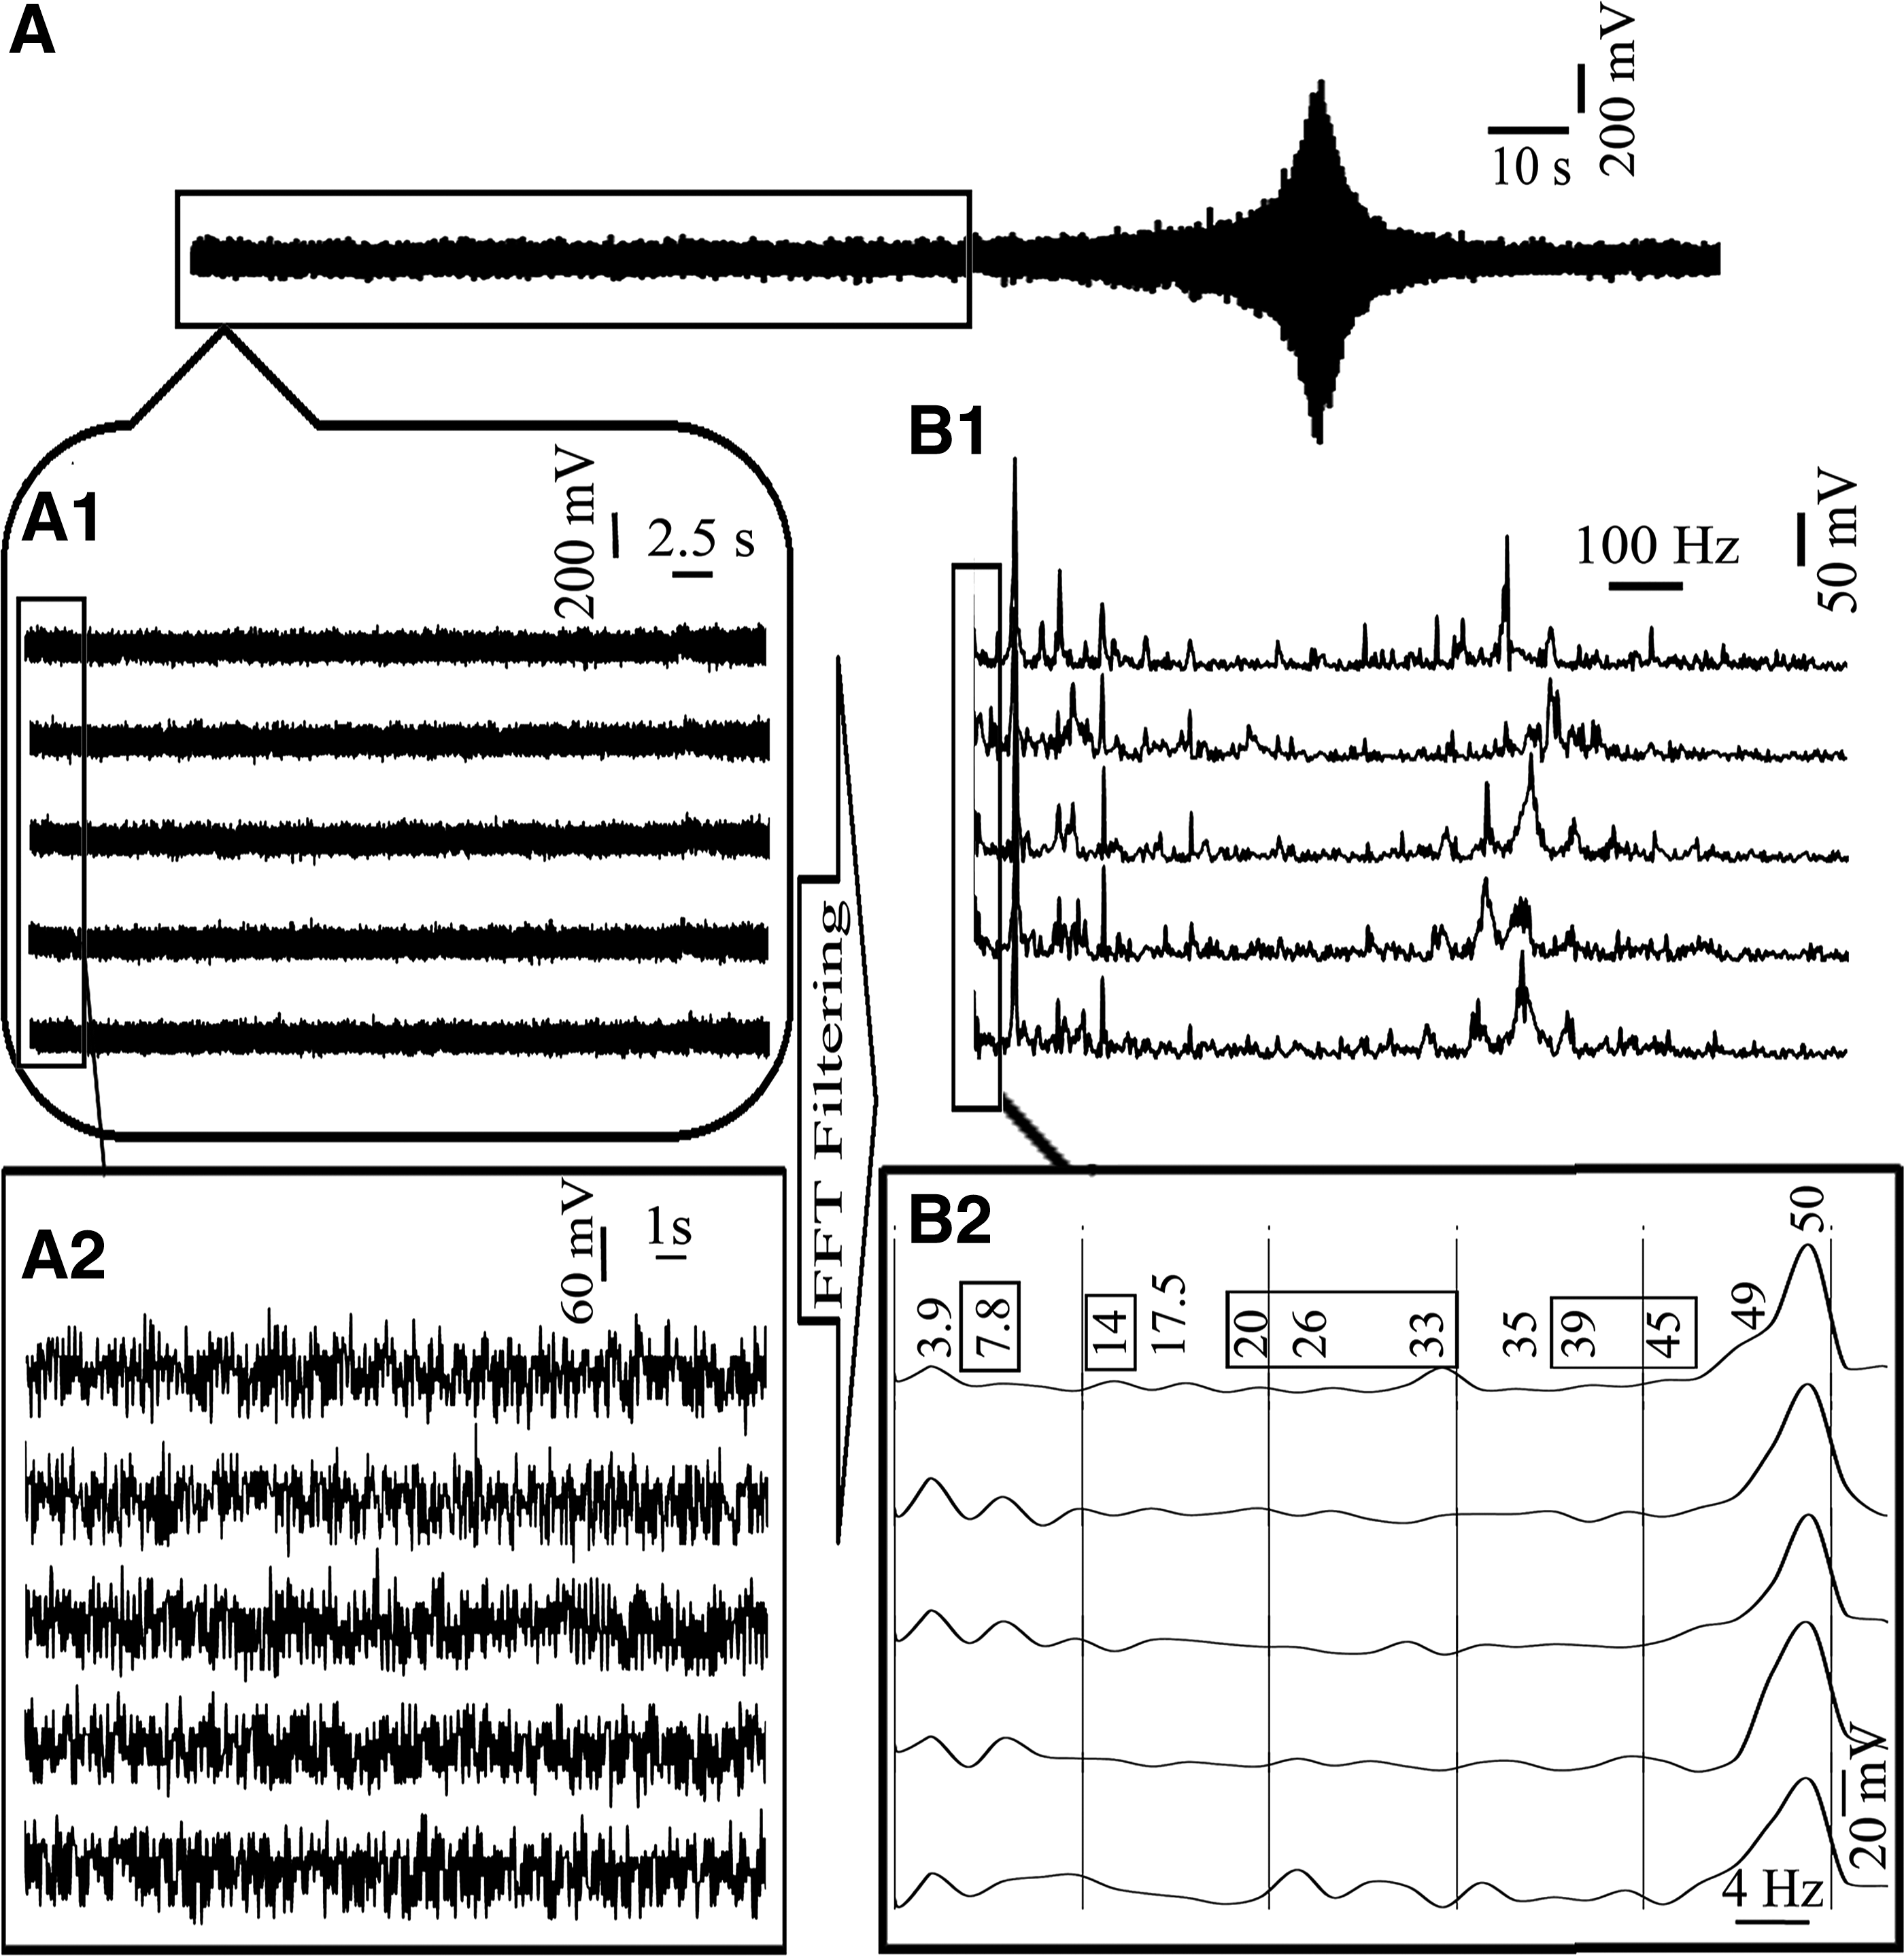
Monitoring EMS transfer through oscilloscope and spectrum analyzer.
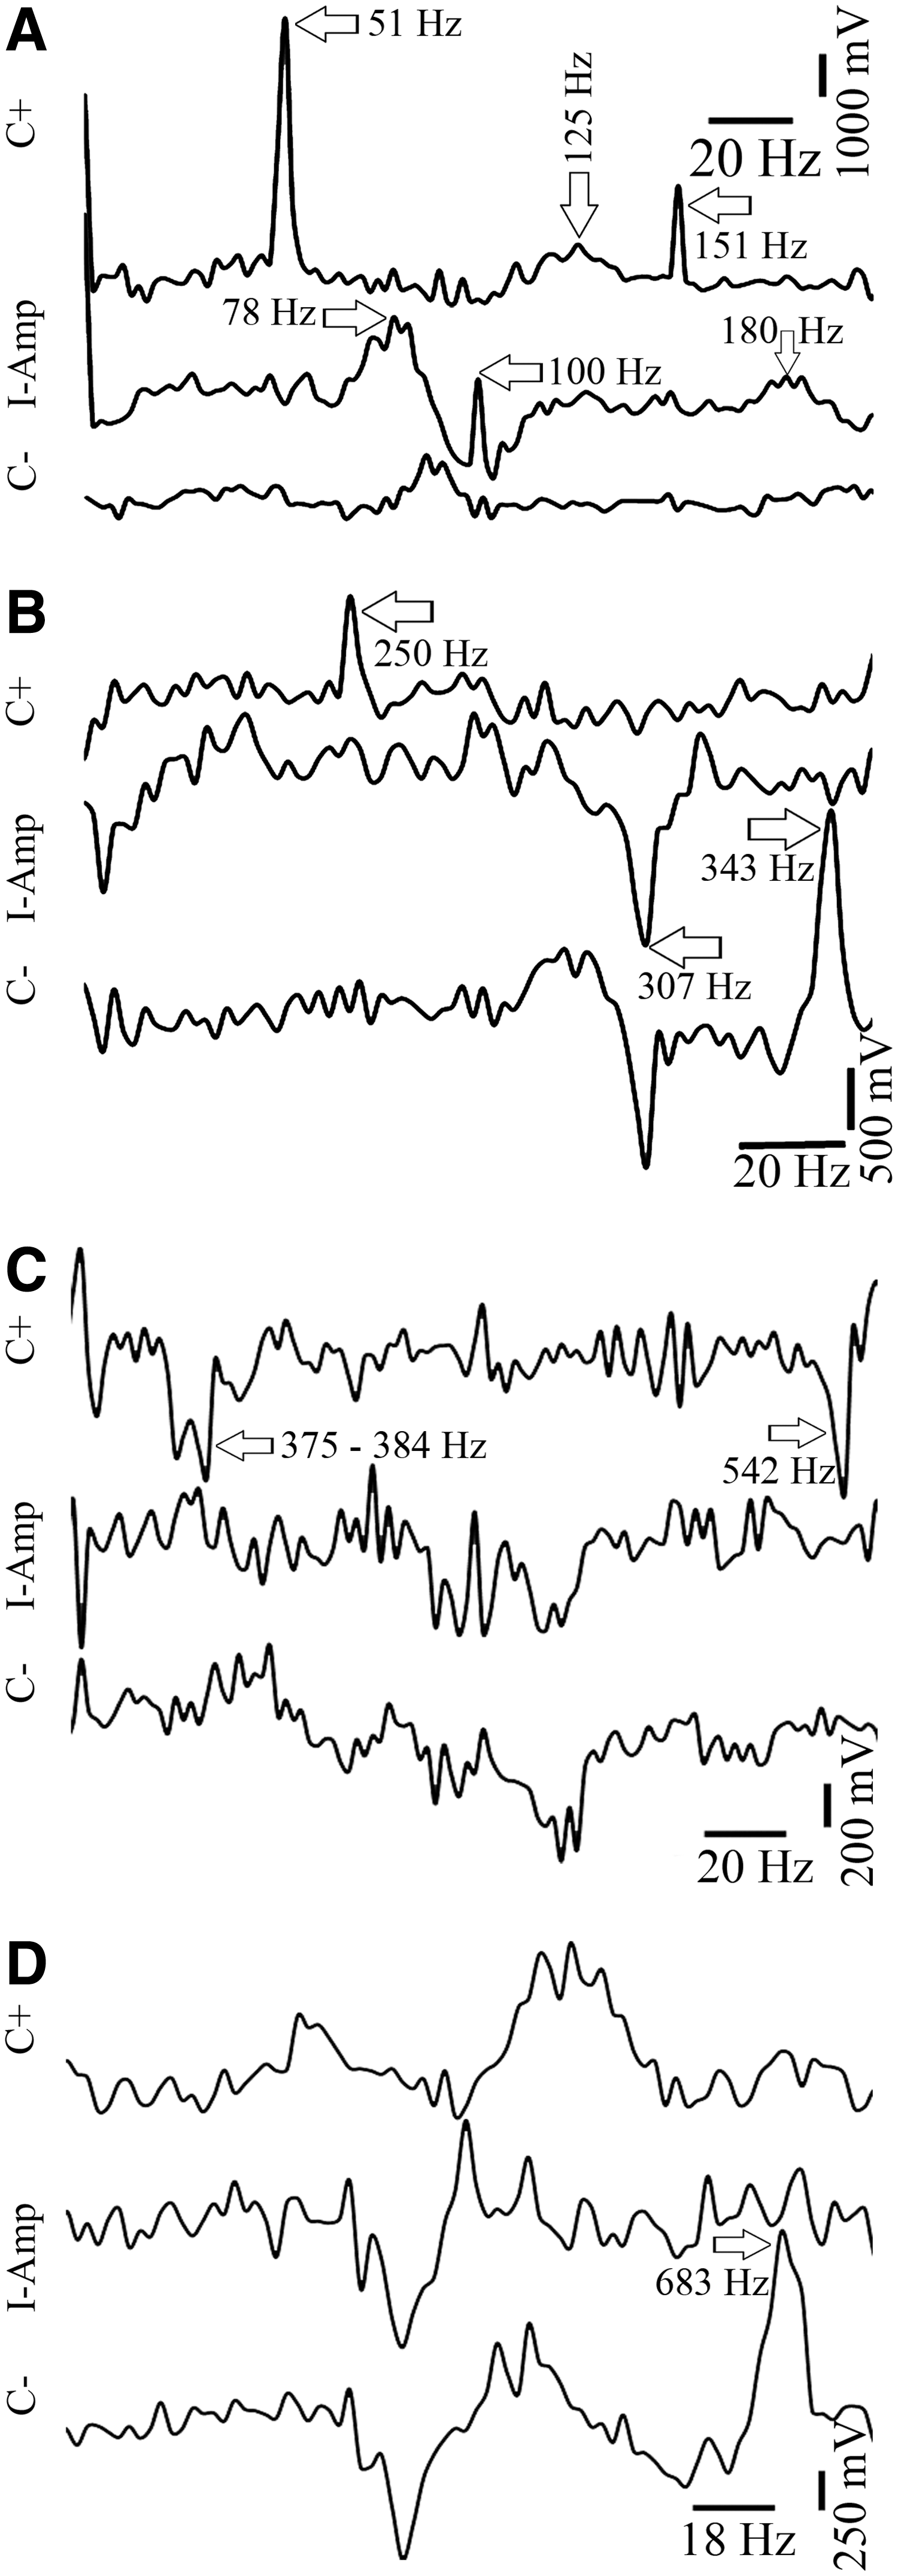
Average of the five most repeatable EMS patterns after Fourier transformation.
The averaged pattern of I-Amp was significantly different with the negative control in the range of 0.01–200, especially at 78, 100, and 180 Hz, but was quite similar to the positive control (ampicillin), especially at 125 Hz (Fig. 6A). The ampicillin averaged pattern in the 0.01–200 Hz range was considerably different from its corresponding negative control especially at 51, 125, and 151 Hz (Fig. 6A). In the ranges of 200–350 and 350–550 Hz, the averaged pattern of I-Amp and negative control was similar to each other but considerably different from that of ampicillin, especially at 307 and 343 Hz (Fig. 6B) and also at 375–384 and 542 Hz (Fig. 6C). The averaged pattern of I-Amp and ampicillin becomes more similar to each other, but less similar to that of the negative control in the range of 550–700, especially at 638 Hz (Fig. 6D). In frequencies higher than 700 Hz, the averaged pattern of I-Amp, negative control, and ampicillin showed nothing in common.
Discussion
Management of bacterial infection by broad spectrum antibiotics is no longer guaranteed. 19 New approaches are needed to meet the increasing wave of resistant strains. However, the role of water “as a solvent” is always neglected on how the designed antibiotics function.
When I-Amp and ampicillin are normalized against sham, both of their MG diminishes at higher dilutions with less fluctuation compared with the time that are normalized against negative control. Hence, the sham control is the source of fluctuations in the MG profile and its positive impact on the MG of E. coli can overshadow the inhibitory impact of I-Amp.
The MG diminishes when the ratio of “equilibrium index” in both of colony counting and the optical density methods gets closer to 0. For this reason, the effect of CFU content on the MG profile by using the CFU content of 103 per milliliter (1.5× optical density) in all of the experiments was ruled out.
The “right shift” phenomenon shown in Figure 4 depicts that imprinting ampicillin property in water is dependent on the time the transmission occurs. It was also confirmed that a minimum of 3 h transmission is needed for the current protocol till the I-Amp MG meet its positive control equivalents.
On condition that the EMS pattern of negative control is different from I-Amp in the entire spectrum, the I-Amp shares a high similarity with the positive control (ampicillin). The more similar the electronic transmission profile of ampicillin and I-Amp gets, higher the possibility of copying the ampicillin property (or its “information”) into water is expected.
The averaged EMS patterns of I-Amp, ampicillin, and intact water at 0.01–50 Hz (SR range–Fig. 6A) are more similar compared with the observed EMS patterns at other ranges. If subtle variations at 0.01–50 Hz range that could tune either the emergence or collapse of certain peaks at higher frequencies are acceptable, it would be analogical to the breakdown of rotational symmetry in dipole waves that turns into the appearance of CD. By the way, not to forget that the “meaning” of the EMS pattern and CD are still semantic contents.
In conclusion, in the whole spectrum of 0.01–1000 Hz in which the authors monitored the signal transfer, there are two areas of 0.01–200 and 550–700 Hz that I-Amp and ampicillin share a similar frequency pattern (specifically in 125 and 638 Hz). There are also certain regions of the spectrum in 307 Hz, 343 Hz, 375–384 Hz, and 542 Hz that could be assigned to ampicillin. However, transmission of biological information is not merely due to specific frequency components embedded in the noisy spectrum. Rather, the response of the E. coli cells could be due to a more inclusive set of frequency patterns, which might not easily be reduced to the analysis by standard signal processing techniques. The transformed signals that are reported in this study do not imply that bioinformation is transmitted by certain frequencies, but they might be considered as indices of signal imprinting.
Conclusion
The bacterial growth that was treated with I-Amp dropped up to 30% ± 15% of negative control. It is found that there are some frequencies that could be used as indices of ampicillin and I-Amp signal transmission during the imprinting of ampicillin supramolecular property into water. Achieving higher growth inhibition needs reinforcing the stochastic resonance between the noises of the biological sample and the device. It could then be considered as a model study in other complementary medicine approaches such as homeopathy and telemedicine.
Footnotes
Acknowledgments
The authors wish to acknowledge financial support of the Stem Cell Technology Research Center through grant number CI36. The authors thank Alireza and Hamid Alemi Tameh for the design and manufacture of spectrum analyzer and other technical support. The authors also wish to appreciate Dr. Vahid Salari and Hana Hanaee Ahvaz for their useful comments.
Author Disclosure Statement
No competing financial interests exist.