
Abstract
Abstract
Objectives:
Acupuncture points as bioactive points on human skin have special electrical properties, compared to points in surrounding areas. This article focuses on measuring skin electrical potentials in a rat model using a point-by-point scanning method.
Materials and Methods:
Animals were placed on a motorized stage with two orthogonal degrees of freedom. X- and Y-coordinates were set by stepper motors and determined the position of each measurement. A third orthogonal axis, the Z-axis, was under separate stepper control and was used to raise and lower the electrode, thus determining contact pressure between the electrode and the skin. The abdominal region, centered around the umbilicus, was chosen for the study. Data were processed to produce visual images.
Results:
Distribution mapping demonstrated the existence of high potential points that were distinct from surrounding regions. Positions and intensity of these high potential points were variable.
Conclusions:
High electrical potential points may have applicability in future acupuncture research.
Introduction
F
Biophysical research has indicated that acupuncture points have distinct electrical properties. These include low electrical resistance, high conductance, high capacitance, and high electrical potential, compared to surrounding tissue.2–11 Electrical resistance of acupuncture points has been studied intensively since the 1950s and remains an important research topic. 12 Relatively few studies have investigated the electrical potential of acupuncture points.11,13
Recently, a new technology for evaluating in vivo skin potentials was introduced using the Scanning Kelvin Probe. 14 Electrodermal devices in which an electrode contacts the skin directly inherently introduce variables such as electrode pressure, skin moisture, and conductive medium. These confounding factors might collectively contribute to measurement variability and susceptibility to bias. 15 The Kelvin probe method addresses these issues by using technology that obviates the need for contact between the electrode and the skin.
In this study, a scanning system was developed for measuring electrical potentials; the system uses direct, uniform pressure contact between an electrode and the skin. Compared with the noncontact scanning technique, mentioned above, the current author believes that direct contact is more likely to access biosignals that might be used to visualize the distribution of acupuncture points.
Materials and Methods
Six Spague-Dawley rats (males, 6–7 weeks old) were purchased from the DooYeol Laboratory Animal Company (Seoul, South Korea). The animals were housed in a temperature-controlled environment (constant 23°C) with 60% relative humidity. All animals were exposed to a 12-hour light–dark cycle and had ad libitum access to food and water. Procedures involving animals and their care conformed to institutional guidelines (approval number: WJIACUC 20140807-3-07), which were in full compliance with current laws and policies. 16
Prior to the procedure, each animal was anesthetized with an intramuscular injection of urethane (1.5 μg/kg). Fur was removed from the abdominal area via a combination of clipping and application of a depilatory cream (Niclean Cream, Idong Pharmaceutical Company, Ltd. Seoul, South Korea). After removal of the depilatory cream and careful cleansing with tap water, the animal was then dried and placed upon the motorized stage. The four limbs were restrained with paper tape.
Movement of the stepper motors was controlled by a computer interface. A force measurement sensor formed the basis of a pressure transducer (FlexiForce Sensors A201-1, 0–450 g, Tekscan, Incorporated, South Boston, MA). Signal protection and amplification relied upon an isolated DC input/output module (ADAM-3014, Advantech Company, Ltd. Milpitas, CA), and a data acquisition (DAQ) module provided that functionality (USB-6009, National Instruments, Korea, Seoul, Korea). Interpolation of data and image construction was performed using GNUPLOT data-plotting software.
Stepwise linear motion along X- and Y-axes was used to scan the designated skin area. Movement along the Z-axis controlled application of the electrode to the skin. For uniform control of contact pressure between the electrode and the skin, the sensor was inserted inside a 10-mL plastic syringe. This allowed for the mechanical pressure to be applied by the piston in the syringe. Pressure values obtained from the transducer were monitored by a desktop computer. Lowering the apparatus on the Z-axis increased contact pressure. Raising the apparatus lowered the contact pressure. The electric potential was measured between two electrodes—the skin electrode, attached to the strain gauge on the Z-axis and a common ground placed within the anal verge. Electrical signals were amplified 100 times by the amplifier (ADAM-3014) and stored in the computer through the DAQ (USB-6009). The setup is shown in Figures 1A and 1B. Through the advanced development experiments, it was found that the materials and shape of the electrodes, especially the skin electrode, were not critical factors for the results. Almost identical potential mapping results were obtained with a variety of electrodes, provided that there was good conduction.
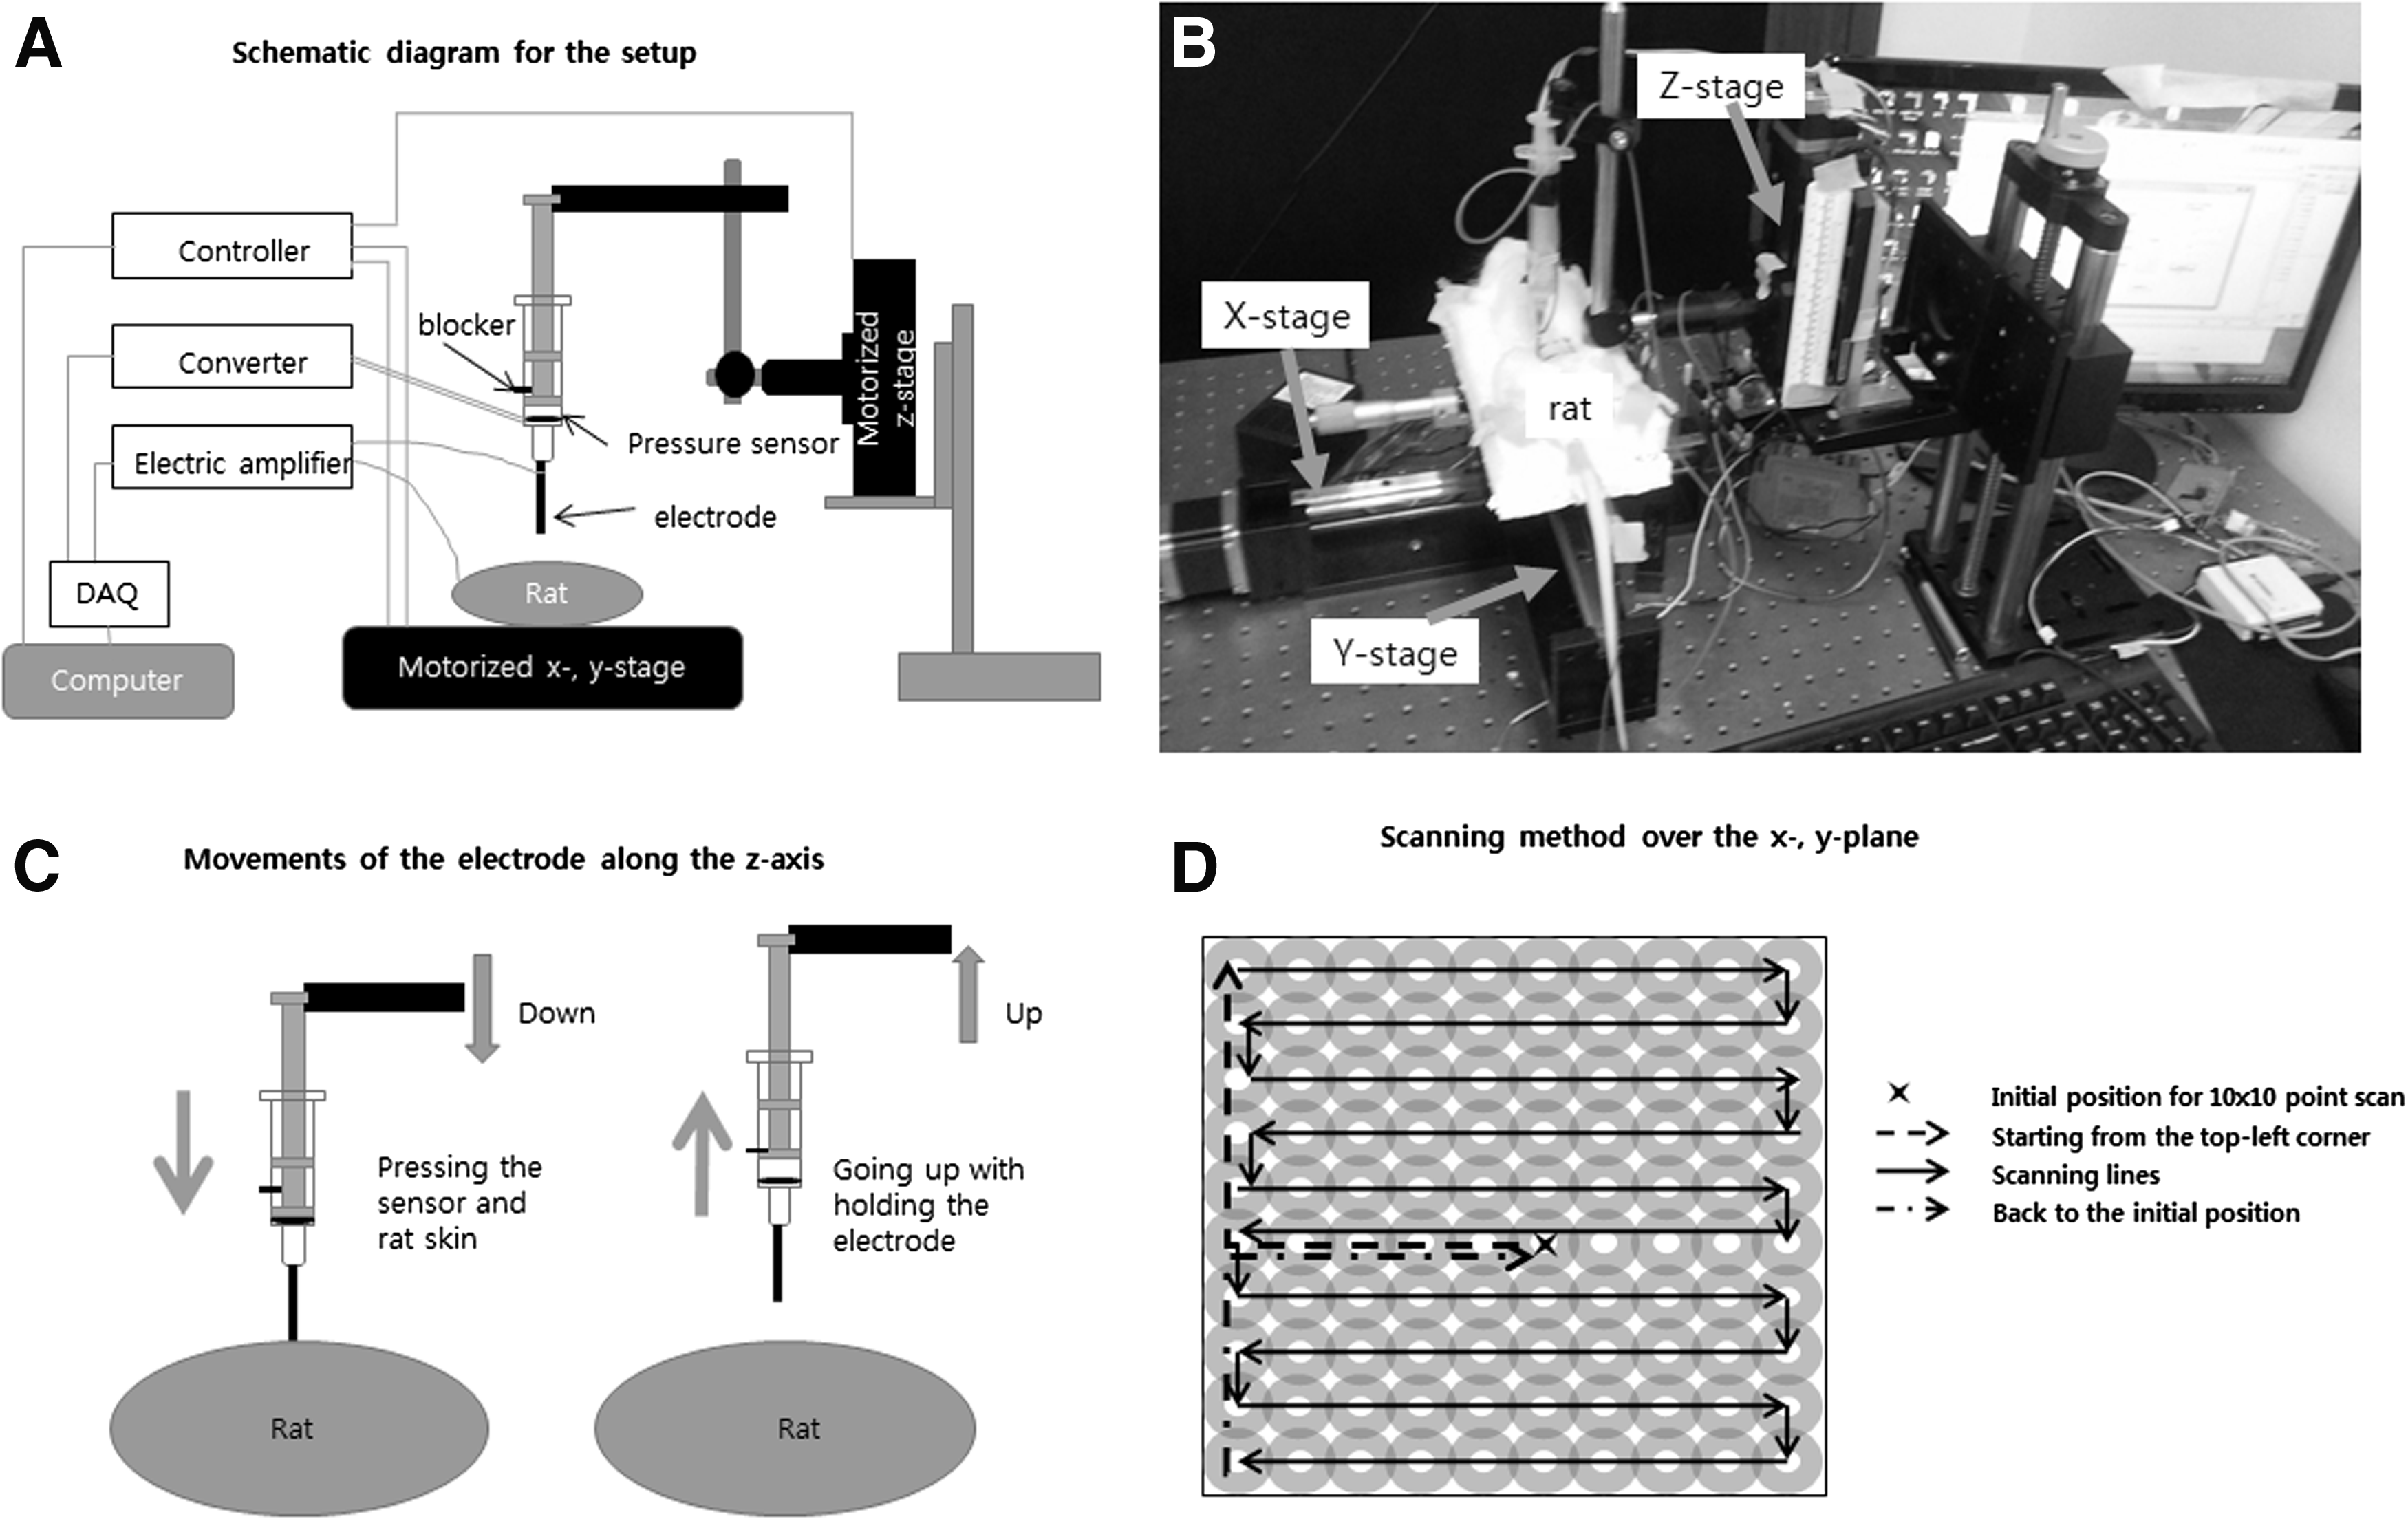
For a designated area on the abdominal skin, scanning was performed at discrete points. Figure 1C shows the pattern of movement along the X- and Y-axes for a 10 × 10-point scan. The distance between two consecutive points along the X- and Y-axes was 1 mm. Initially, the skin electrode was positioned at the center (the × in Fig. 1D). The skin electrode moved up and down along the X-axis at each X- and Y-scanning position as shown in Figure 1D. The distance between two consecutive steps along the Z-axis was 0.06 mm. At each step, there was a 10-ms pause during which the data for the pressure and the electrical potential was taken and averaged by the computer. If the pressure reached a predetermined value, the skin electrode took a 100-ms pause at that depth for continuous data acquisition of electrical potentials. After completing a scan, a digital photograph was taken of the scanning area. Computer software was programmed to combine all the stage movements and data acquisition synchronously. An additional computer program was created to isolate the electrical potential data for a given pressure at each X- and Y-position involved in the scan. The data were interpolated by the software for a smooth image and presented in a palette-map drawing style.
The size of the scanning area determined the number of contact points on the skin. When a scanning area was chosen, the position of the skin electrode automatically went to the center of the area. Scanning time depended on the number of contact points and the initial height of the electrode above the skin. For example, 72 contact points would correspond to a 12 mm × 6 mm scanning area. To cover this area, assuming an initial electrode height of several mm, would require 30–40 minutes to complete at a given pressure.
The pressure between the electrode and the skin was controlled via a pressure transducer–computer-stepper interface. A calibration process was performed to convert voltages from the force sensor to actual pressure values. For this study, a threshold voltage from the pressure sensor was set at 0.06 volts. This corresponded to a uniform pressure of 25.8 ± 8.4 × 10⁴ Pa. This is equivalent to a 26.3 ± 8.6–g weight distributed over an area of 1 mm2, within the standard deviation at all contact points. This pressure was not sufficiently high to make a puncture in the skin, but it did leave contact marks on the skin that lasted several minutes. Electrical potential data were extracted only under the conditions of uniform pressure for a 100-ms interval.
Results
Figure 2 shows measurements taken from the first scan. The region is an 8-mm × 8-mm area centered on the umbilicus. The left end panel in Figure 2 shows the abdominal area prior to the scan. The next panel is a magnified view showing the location of the umbilicus marked with an × . The third panel shows the results of the measurement at the 64 contact points. Duration of the scan was ∼35 minutes. A color scale displays potential magnitudes in 10 mV increments, with 110 mV being the maximum. The upper limit of the DAQ, considering amplification, was 100 mV. However, the interpolation process using GNUPLOT software raised the limit to 110 mV. In the brightest regions, where the voltage reaches saturation, the actual voltage would have been >110 mV. In the darkest regions, the minimum measureable potential was 10 mV. The bias potential measured without any skin contact of the electrode was 6.5 ± 0.1 mV. Figure 2 shows that the potentials went up to 110 mV at several points. After completion of the first scan, a second measurement was performed over the same area, without delay. The two images from the same area show different patterns of electric potentials. It is not clear whether this difference is secondary to a real time dependency or from interacting effects related to repeat measurements.
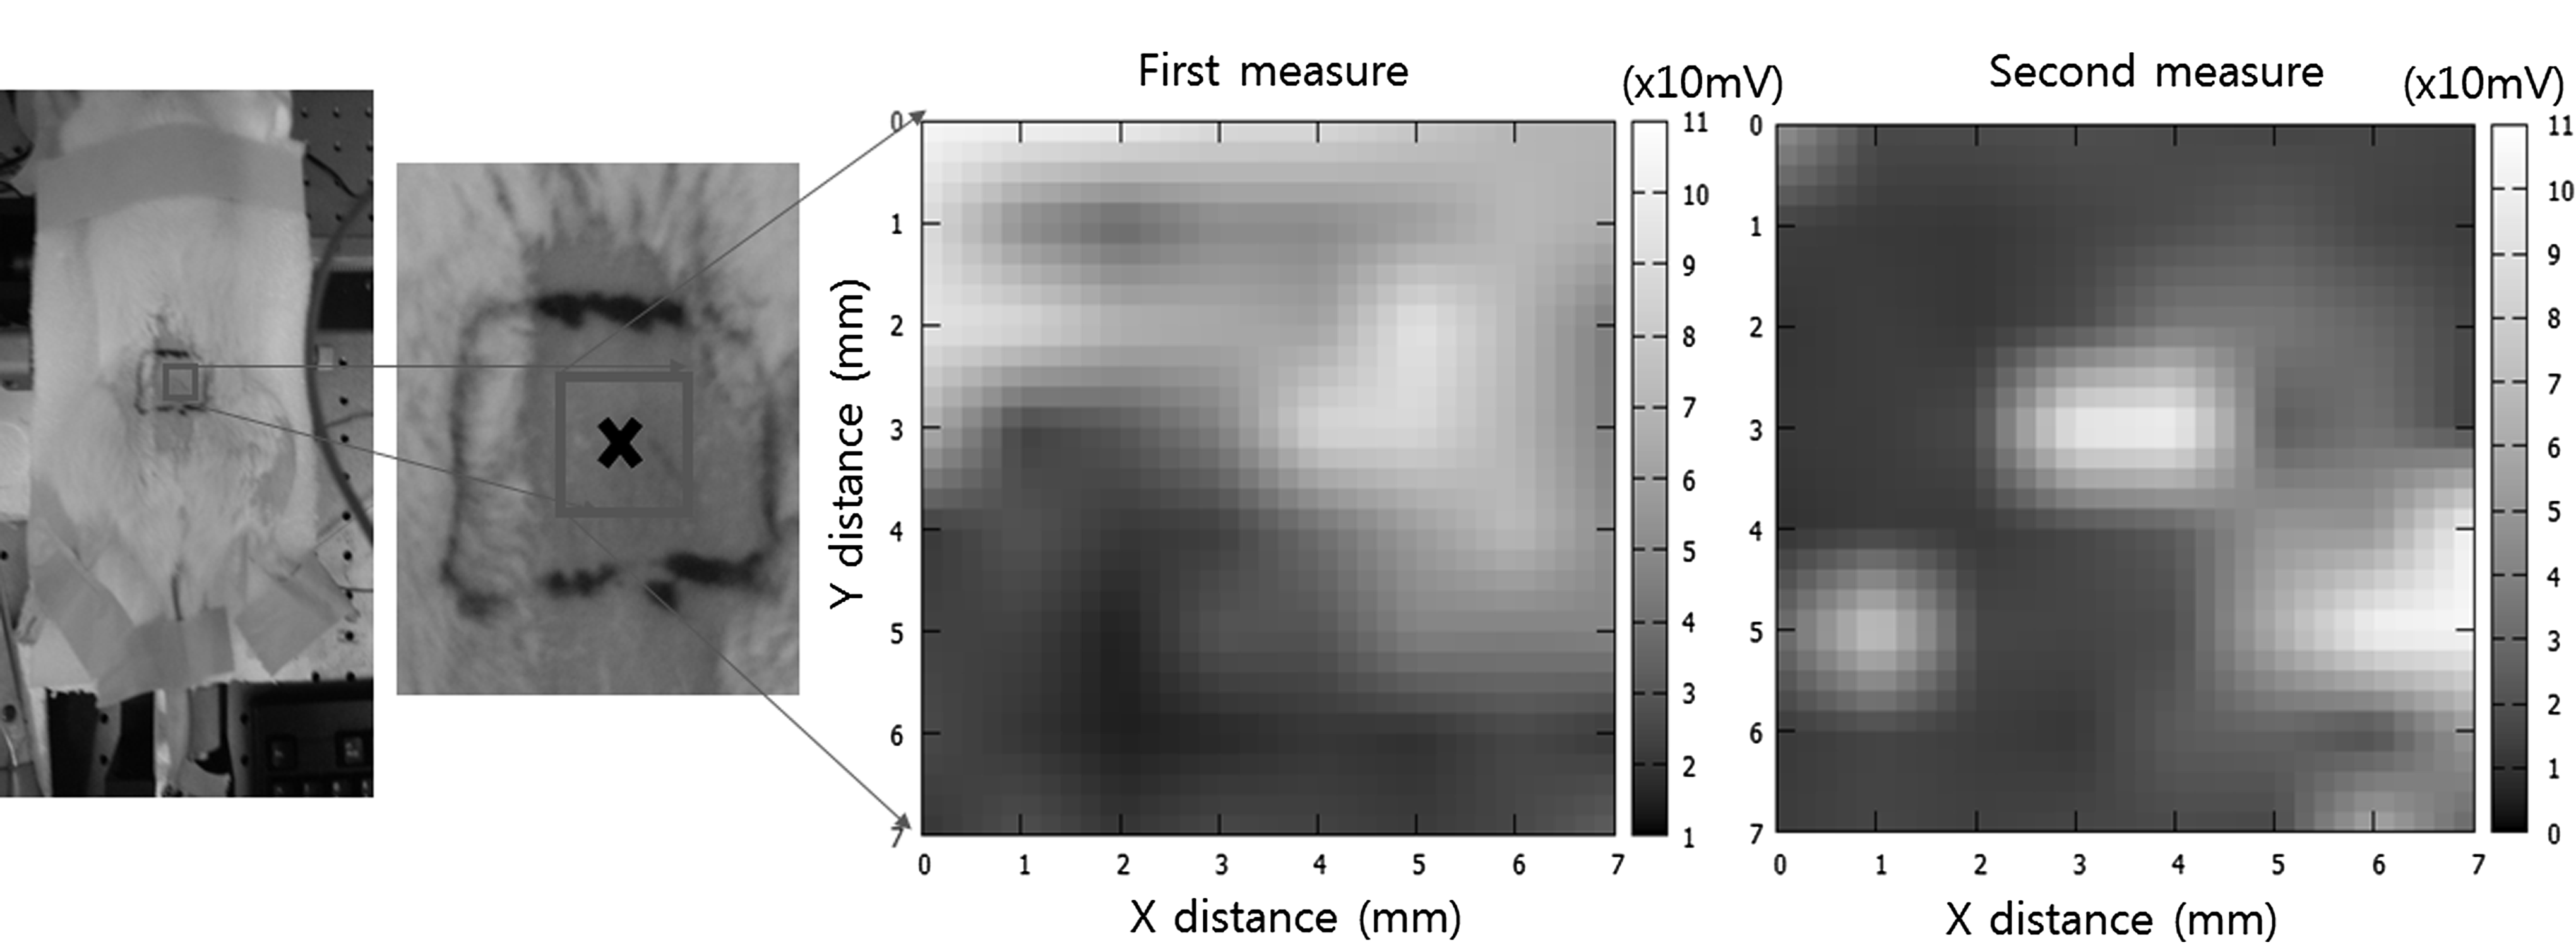
A scanning area in the rat's abdomen (in this case, the number of contact points is 8 × 8 points, which corresponds to the actual size of 8 mm × 8 mm). The two left panels show photographs of the scanning area in the square shape where the umbilical spot is indicated by an × at the center. The third panel shows the first measurement of the electric potentials in that area (scanning time: ∼35 minutes). Without a delay, the same area was scanned again for the second measurement as shown in the last panel. For each scanned image, a gray scale bar displays electric potential magnitude in 10-mV units.
Figure 3 shows two electric potential images for partially overlapped areas around the umbilicus of a second animal. In this case, the brightest points in the left and right panels matched approximately with the umbilical marker in the center panel. The images show the location of the umbilicus clearly. After removing fur from the rat's abdomen, the umbilicus was easily identifiable on the skin along the midline of the animal. Therefore, the umbilicus could be used as a reference point in scanning neighboring areas.

Two scanning areas are displayed by the rectangles, which have an overlapped area surrounding the umbilical spot. The electrical potential mappings for each area are displayed on both sides.
Figure 4 shows topographic maps of electric potential imaging data from four different experimental rats. All of the animals were prepared using the same protocol as described in the previous section. Two imaging areas, 6 mm × 12 mm, were selected for the first 2 animals. One area was to the left of the umbilicus and the other was to the right; the total number of points scanned on each side was 72. For the next 2 animals, the scanning areas were increased to 8 mm × 12 mm, resulting in potential measurements at 96 points on each side. Scanning time was ∼60 minutes. For the last 2 animals, scanning areas were increased to 12 mm × 12 mm on each side of the umbilicus, yielding 144 measurement points and requiring a scanning time of ∼100 minutes. The locations of the scanning areas are shown in the images by rectangles. Scanning images revealed several high potential points in each case.

Both absolute and averaged potentials found in the scans were consistently higher than the bias voltage of 6.5 mV. Polarity was uniformly positive for the skin electrode. Potentials measured in the periumbilical region were notably higher than for surrounding tissue. This feature was observed for all specimens. Simultaneous display of contact pressure and electric potential revealed some random variations in pressure measurements but no correlation was noted with potential measurements. Although the skin electrode typically left marks from skin indentation, these resolved spontaneously within minutes, and no permanent skin injuries were noted.
Discussion
In this study, an imaging technique was developed for mapping the electric potential on the skin surfaces of experimental rats. Point-by-point scans were made over the abdominal areas of the animals with direct contact between the electrode and the skin. Confounding factors for measuring electric potentials on the skin, including imprecise contact pressure, choice of conductive medium, electrode polarity and skin moisture, were all minimized by this approach.
Currently, animal studies are performed to understand the underlying mechanisms of acupuncture. Location of acupuncture points in laboratory animals have not yet been clearly defined. 17 An advantage of animal studies is that they can be carried out under more controlled circumstances as a preliminary step before human studies.
Several limitations of this study were related to the spatial and temporal resolution of the scanning system. These were limited by the size of the electrode and the scanning time, respectively. In this experiment, the electrode size was 1 mm, but numerical interpolation via plotting software enhanced the virtual size to 0.2 mm. Spatial resolution could be improved with a smaller electrode. Finer spatial resolution would result in more contact points and longer scanning time.
Conclusions
Images obtained by measuring the electric potential distribution on the abdomens of experimental rats, using this technique, identified high potential points. This methodology could be used for further studies on acupuncture.
Footnotes
Acknowledgments
The author would like to sincerely thank Kwang-Sup Soh, PhD, and Dae-In Kang, PhD, for providing valuable advice and support.
Author Disclosure Statement
No competing financial conflicts exist.