




Abstract
Established treatments for psoriasis are generally based on anti-proliferative, anti-inflammatory, or differentiation-modifying activity, or a combination of these effects. New agents for the treatment of psoriasis could be identified by high-throughput screening (HTS) of large compound libraries using keratinocyte proliferation models. Although several new proliferation assays have been developed, the radioactive [ 3 H]-thymidine incorporation assay is still considered to be the gold standard for the evaluation of keratinocyte proliferation in vitro. In this study, we compare a number of simple, and reliable, colorimetric (MTT, NRU, SRB, and CVS), and fluorimetric (CAM and AB) methods with the [ 3 H]-thymidine incorporation assay for the measurement of keratinocyte proliferation in the exponential growth phase in 96-well formats. The concentrations that induced 50% growth inhibition (GI50) were determined by each assay for the established antipsoriatics, dithranol, and methotrexate. Strong correlations were observed between the percentage growth inhibitions determined by the radioactive and the colorimetric assays, with no significant differences (P > 0.05) between their GI50 values. The colorimetric assays are thus suitable alternatives to the radioactive assay for quantifying keratinocyte growth inhibition. We have also validated the use of the HaCaT cell line as a representative of the hyper-proliferative psoriatic epidermis, in the preclinical screening of experimental anti-psoriatic agents.
Introduction
Novel biologics, which target a particular step in the immune or inflammatory pathways leading to psoriasis, have considerably improved the treatment of moderate to severe psoriasis. The anti-psoriatic biologics etanercept, 6 infliximab, 7 and adalimumab 8 target the proinflammatory cytokine, tumor necrosis factor α (TNF-α), which is responsible for many of the clinical features of psoriasis. Numerous studies address the potential mechanism of action of anti-TNF agents in psoriasis 9,10 and have underlined the significance of the immune system in the manifestation of the disease. Another group of anti-psoriatic biologic agents, which include the drugs efalizumab 11 and alefacept, 12 function by T-cell modulation, while the recently approved stekinumab 13 inhibits IL-12, IL-23 activity and also the differentiation of Th17 cells. These and other studies highlight the crucial role played by T helper (Th)17 cells and interleukin (IL)-23 in the pathogenesis of psoriasis. 14 Such novel approaches have shown significant efficacy in clinical settings and provide a potential explanation of the link between cutaneous inflammation and hyperproliferation and hyperplasia within the psoriatic plaque.
Despite all these developments, a significant requirement still exists for novel therapeutic strategies for patients who do not respond to existing therapies, or for whom these therapies are unsuitable. 2 Despite the importance of systemic therapies and the advances represented by biologics, topical treatments still remain the mainstay of psoriatic therapy for most patients. 15 There is thus a constant demand for new, cosmetically attractive vehicles that may enhance compliance, enhance the use of topical agents, reduce adverse effects, and improve patient outcomes. 15
High-throughput screening (HTS) assays for the biological evaluation of diverse collections of compounds could lead to the rapid identification of leads for potential drug candidates in the treatment of psoriasis, but the unknown etiology of psoriasis, the absence of established preclinical screening assays and a lack of suitable in vitro models of the disease, have hindered research in the development of novel drugs. Novel compounds with the ability to inhibit keratinocyte proliferation have potential therapeutic value in the treatment of this condition because a significant aspect of the disorder is an inflammatory rash, with increased epidermal proliferation, resulting in an accumulation in the stratum corneum. Another potential mechanism that has been highlighted in a number of studies, particularly for dithranol 16 and methotrexate, 17 is the induction of apoptosis. The balance of all the possible effects of these 2 agents has not yet been explained in detail.
A goal of therapy is to decrease the abnormal epidermal hyperproliferation, differentiation, and underlying inflammation; and a rebalanced homeostatic control of keratinocyte growth and differentiation is crucial for recovery from psoriatic to normal epidermis. A successful anti-psoriatic drug that targets the epidermis (rather than the immune system) is defined as a compound that ideally shows low toxicity and restores skin homeostasis by suppressing keratinocyte hyperproliferation, abnormal differentiation, and inflammation. 18 Most established anti-psoriatic drugs, such as dithranol and methotrexate, have been shown to inhibit the proliferation of keratinocytes in vitro, 19,20 as well as in vivo, 21,22 so that keratinocyte proliferation is an important parameter to be considered in the development and screening of novel drugs for psoriasis. In fact, this is the first step employed in the biological evaluation of novel anti-psoriatic drug candidates in many laboratories, alongside assessment of their cytotoxicity, carcinogenicity, and anti-inflammatory activity 23 and such drug discovery programs would benefit from an evaluation in a range of assays suitable for determining the inhibition of keratinocyte proliferation.
To date, several 96-well adapted high-throughput screening methods have been utilized to quantify the inhibitory effect of compounds on cell proliferation in vitro. Colorimetric indicators of cell viability, such as 3-(4,5-dimethyl-2-thiazolyl)-2,5-diphenyl-2H-tetrazolium bromide (MTT), neutral red uptake (NRU), sulforhodamine B (SRB), and crystal violet staining (CVS), are widely used to evaluate the growth inhibitory effect of test compounds. The MTT assay is based on the ability of a mitochondrial dehydrogenase enzyme, from viable cells, to cleave the tetrazolium ring of the pale yellow MTT and form purple formazan crystals, which are largely impermeable to cell membranes, thus resulting in their accumulation within healthy cells. 24,25 The NRU assay determines the ability of viable cells to incorporate and bind neutral red dye. 26,27 CVS detects cell lysis and this assay is based upon the growth rate reduction reflected by the colorimetric determination of the stained cells. 28 The SRB assay estimates cell growth by measuring the cellular protein content, after staining of trichloroacetic acid (TCA) fixed cultures with SRB. 29 Fluorimetric methods that could be used for the determination of keratinocyte proliferation include calcein AM (CAM) and alamar blue (AB). CAM is a nonfluorescent, hydrophobic compound that easily permeates intact, live cells. 30,31 The hydrolysis of CAM by intracellular esterases produces calcein, a hydrophilic, strongly fluorescent compound that is well retained in the cell cytoplasm. Finally, the AB assay is based on the ability of metabolically active cells to convert a redox dye (resazurin) into a fluorescent end product (resorufin). 32,33
Despite the availability of such a diverse range of assays, the [3H]-thymidine incorporation assay is still widely regarded as the most reliable quantification of cellular proliferation. This assay is based on the incorporation of radioactive thymidine into the DNA of proliferating cells. 34 As with any other radioactive technique, the [3H]-thymidine incorporation assay has several disadvantages, including the radiation hazard, the time taken, the requirement for expensive specialized equipment, and problems of handling and disposal, thus limiting its routine use in HTS experiments for novel drug candidates. Due to the limited information available regarding the comparability of colorimetric and fluorimetric assays with the gold standard radioactive method, there are conflicting views on the suitability of other assays as alternatives to the radioactive assay so that further studies comparing them for the evaluation of keratinocyte proliferation are necessary. The MTT assay had previously been compared with the radioactive assay in keratinocyte cultures, where differences were observed between the assays, which were attributed to the differences in the drugs tested, 35 but, to our knowledge, no studies had been published comparing any of the other assays with the radioactive method in keratinocyte cultures.
No single animal model reproduces the complete pathogenesis and phenotype of psoriasis, 36 so a variety of in vitro models have been developed in attempts to identify the trigger factors and to test the efficacy of potential therapeutic compounds, 37,38 but no model thus far accurately reproduces the stable psoriatic phenotype. For preclinical evaluation, compounds could be screened for their growth inhibitory activity in primary psoriatic keratinocytes, but these are difficult to obtain and grow, require ethical approval, and are less amenable than cultured cell lines to the development of HTS assays. For these reasons, novel drug entities are initially screened in established human keratinocyte cell lines that are representatives of the hyperproliferative psoriatic epidermis. Among these, the HaCaT cell line is a good model of the hyperproliferative psoriatic epidermis, 39,40 as it exhibits a similar keratinization pattern to psoriatic skin, and it has been widely used as a model for the preclinical evaluation of novel anti-psoriatic agents and for the study of the underlying mechanisms of the disease. 41 –44
A century since its first introduction, dithranol continues to be one of the most successful and indispensable topical anti-psoriatic agents but, despite several clinical and experimental investigations, its mechanism of action is still far from clear. The drug inhibits keratinocyte hyperproliferation, mitochondrial respiration, and granulocyte function, induces apoptosis and, in addition, exerts an immunosuppressive effect. 16,20,45 Methotrexate is another effective anti-psoriatic agent and has been widely used as systemic therapy in the treatment of severe psoriasis since 1960s. Methotrexate is an anti-folate that was designed to inhibit cell proliferation by blocking de novo synthesis of nucleotide precursors of nucleic acid synthesis.
Methotrexate causes a temporary and reversible inhibition of DNA synthesis and cell proliferation and induces differentiation and apoptosis in human keratinocytes. 17,46,47 With completely different mechanisms of action, dithranol and methotrexate are 2 model anti-psoriatic drugs with which new potential agents can be compared in terms of efficacy and we thus chose them as the test compounds for the evaluation of these assays. It is also interesting to note that the sensitivity of the HaCaT cell line to these established agents had never previously been compared.
The initial aim of this study was, therefore, to investigate the suitability of a diverse range of simple, inexpensive, and easy-to-use colorimetric methods (MTT, NRU, SRB, and CVS) and fluorimetric methods (CAM and AB) as alternatives to the [3H]-thymidine incorporation assay in the evaluation of in vitro keratinocyte proliferation, using the established anti-psoriatic drugs, dithranol and methotrexate, as the model compounds. In addition to this, a further aim was to validate the use of the human keratinocyte (HaCaT) cell line as an in vitro model for the screening of experimental anti-psoriatic drugs.
Materials and Methods
Chemicals
Radioactive 6-[3H]-thymidine was purchased from Amersham (Buckinghamshire, United Kingdom). Alamar blue was obtained as a pre-mixed solution from Serotec (Oxford, United Kingdom) and CAM from Invitrogen (Paisley, United Kingdom). A caspase-3/7 activity assay kit was obtained from Promega (Madison, WI). Fetal bovine serum was purchased from Biosera (East Sussex, United Kingdom). All other chemicals were purchased from Sigma-Aldrich (Dorset, United Kingdom) and were of reagent grade.
Cell lines and media
HaCaT cells were a kind gift from Prof. Lars French (Geneva University Medical Centre, Switzerland). The cells were grown in Dulbecco's modified Eagle's medium (GIBCO, Paisley, United Kingdom) supplemented with 10% fetal bovine serum. Streptomycin (100 μg/mL) and penicillin (100 U/mL) were also added to the medium.
Cell culture
Cell culture was carried out in a BioMAT Class II safety cabinet (Medical Air Technology Ltd., Chadderton, United Kingdom) under stringent aseptic conditions. Cells were maintained as monolayer cultures to 60%–80% confluency under conditions of 5% CO2 at 37°C. To remove the adherent cells from the flask for passaging and counting, cells were washed with phosphate-buffered saline (PBS) without calcium or magnesium, incubated with a small volume of 0.25% trypsin–EDTA solution for 5 min, washed with trypsin inhibitor, and centrifuged. All experiments were performed using cells in the exponential phase of growth.
Sample preparation
Stock solutions of the drugs were freshly prepared in dimethyl sulfoxide (DMSO) on the day of the experiment. Working solutions were prepared by diluting with fresh medium and the same was used to perform serial dilutions across the plate. Dithranol was tested at concentrations ranging from 0.05 to 3.5 μM and methotrexate from 0.17 to 22 μM, the optimum concentrations to obtain sigmoidal dose–response curves, based on our preliminary studies.
Study design
Cells were seeded in 96-well microtiter plates at an optimal density such that the untreated cells were in the exponential growth phase at the time of harvest (10,000 cells/well, which was the optimal cell density from preliminary studies). All the plates were incubated overnight to allow cell attachment. The 96-well plates were set up with 6 in-plate replicates of 8 concentrations of the drug and were exposed to drugs for a period of 72 h. Control wells were treated with fresh medium containing no drug. The same solvent (DMSO) used to dissolve the test compound was added to the control wells so that the concentration of the solvent present in all the wells was <1%. Wells were also set up containing medium alone to serve as the negative control for the determination of any background absorbance (or fluorescence) that may be present. The absorbance (or fluorescence) levels from drug–treated cells were corrected against untreated control absorbance (or fluorescence) values.
Cell growth assays using colorimetric dyes or stains
The MTT assay was performed according to the method previously described. 24 After the incubation period, cells in 96-well plates were exposed to 200 μL of MTT (0.5 mg/mL in PBS) and incubated for 2 h at 37°C/5% CO2. The cells were washed with PBS after the removal of the dye and 200 μL of 90% isopropanol/10% DMSO was added to the plates. The plates were incubated in the dark for 10 min and the absorbance at 590 nm was recorded immediately using a microplate reader (Tecan, Reading, United Kingdom).
The NRU assay was carried out as previously described. 27 After the incubation period, the medium was replaced with 50 μL per well of sterile filtered neutral red solution (3.3 g/L in DPBS); the plates were incubated for 3 h at 37°C, then the cells were rinsed carefully with the neutral red assay fixative solution (0.1% CaCl2 in 0.5% formaldehyde) prior to the addition of 100 μL of neutral red solubilization solution (1% vol/vol acetic acid in 50% aqueous EtOH). The plates were shaken for 10 min and the absorbance at 590 nm was recorded using the microplate reader as described previously.
The CVS assay was based on the method previously described with some modifications. 28 After the incubation period, the medium was removed and the cells were fixed with 1% formaldehyde at 4°C for 10 min. After this time, the cells were stained with 0.5% CVS solution in 30% EtOH for 30 min. After the plate was washed with water and dried, 100 μL of crystal violet solubilization solution (50:50 mixture of EtOH and 0.1 mol/L of NaH2PO4) was added per well. The plates were shaken for 10 min and the absorbance at 590 nm was recorded using the microplate reader.
The SRB assay was performed according to the method previously described. 29 At the end of the drug exposure, cells were fixed with 50 μL of ice-cold 40% TCA for 1 h at 4°C. The plates were washed and dried and then stained with 0.4% SRB dissolved in 1% acetic acid for 30 min, and subsequently washed 4 times with 1% acetic acid to remove the unbound stain. Protein-bound stain was solubilized with 100 μL of 10 mM Tris base and the absorbance at 590 nm was determined using the microplate reader.
Cell growth assays using fluorimetric dyes or stains
The CAM assay was carried out based on the method previously described with some modifications. 31 After the incubation period, the cells were washed twice with PBS and 100 μL of 1 μM CAM (from 1 mg/mL in DMSO stock) was added. After 45 min of incubation at 37°C, the cells were washed twice with PBS and 100 μL of culture medium was added to all the wells. The fluorescence was recorded at 485 nm/535 nm in a spectrofluorimeter (Molecular Probes, Paisley, United Kingdom).
The AB assay was carried out according to the method of Ahmed et al. 33 At the end of the drug exposure period, 20 μL of AB was added to each well and the plates were incubated for 3 h at 37°C in the 5% CO2 incubator. Following the incubation, the fluorescence was measured at 560 nm/590 nm in the spectrofluorimeter.
[3H]-Thymidine incorporation assay
The [3H]-thymidine incorporation assay was carried out as previously described with some modifications. 19 The plates were removed from the incubator 24 h prior to the end of the incubation period and 1 μCi of [3H]-thymidine was added to each well. Cells were harvested 24 h later. The medium was aspirated from each well and 50 μL of trypsin (2.5%) was added. After 45 min incubation, 50 μL of 10% ice-cold TCA was added to all the wells and the cells incubated at 4°C for 2 h. The plates were harvested on a Brandel cell harvester (Model: M-12R), dried at 60°C for 30 min, and counted, following the addition of scintillation fluid, using a liquid scintillation analyzer (Packard, 1900 TR, Tri-Carb liquid. S.A).
Expression of cell proliferation
In treated cells, the cell proliferation was expressed as the percentage of growth inhibition compared with untreated cells. For the evaluation of the growth inhibition, the average absorbance (or fluorescence or radioactivity) of the control wells, which contained no drug, was regarded as 100%, and the percentage of cell growth in each well was calculated and expressed as the percentage of control. The results of the growth inhibition assays were expressed as the GI50, which is the concentration of the drug that results in a reduction in the growth of untreated cells by 50% with respect to the control.
Assay of caspase-3/7 activity
Cells were plated in 96-well plates at 10,000 cells/well and exposed to different concentrations of dithranol. Control wells were treated with fresh media containing no drug. Wells were also set up with the medium alone to serve as the negative control for the determination of any background fluorescence that may be present. Each sample was analyzed in triplicate. After the incubation period, the caspase-3/7 activity was measured using the Apo-ONE homogeneous caspase-3/7 assay kit (Promega, Madison, WI) according to the manufacturer's instructions. Fluorescence was measured at 499 nm/521 nm using a Flex station (Invitrogen, Paisley, United Kingdom).
Statistical analysis
All statistical analyses were conducted using SPSS for Windows 14.0 (SPSS Inc., Chicago, USA). The GI50 values were calculated from the dose–response curves by nonlinear regression analysis using GraphPad Prism (version 4.0; GraphPad Software, San Diego, CA). Descriptive statistics were calculated on each variable and z-scores were used to verify normality. For each drug, the mean GI50 values were analyzed using one-way analysis of variance (ANOVA). A 2-way factorial ANOVA was used to analyze the main effects and interaction of drug concentration and assay type on percentage growth inhibition. In the event of a difference occurring, Tukey's post-hoc tests were used to identify any localized effects. Relationships between the percentage growth inhibitions determined by the assays for different drug concentrations were analyzed by calculating Pearson's product moment correlation coefficients. For the assay of caspase-3/7 activity, significant differences between the control and the treated samples were determined by independent t-test. Statistical significance was accepted at the α-level of P < 0.05. All results are expressed as mean ± SEM unless otherwise stated.
Results
The effects of the established anti-psoriatic drugs, dithranol and methotrexate, on the proliferation of the HaCaT cell line after 72 h drug exposure, were evaluated by a range of colorimetric (MTT, NRU, SRB, and CVS) and fluorimetric methods (CAM and AB). The results were compared with those obtained from the standard [3H]-thymidine incorporation assay.
Growth inhibitory effect of dithranol
The dose–response relationship for dithranol in HaCaT cells was established in all the assays and GI50 values were calculated from these dose–response plots ( Fig. 1 ). Similar dose–response patterns were obtained from all the assays with the exception of the AB assay. After 72 h exposure, dithranol inhibited the growth of keratinocytes in a dose-dependent manner (significant main effects of both drug concentration and assay type, P < 0.001) with a reduction in cell number by up to 90% for the concentration range tested (0.05–3.5 μM) in all the assays, except for the AB assay (only 50% growth inhibition at the highest concentration tested). Similar trends were observed in the dose–response curves obtained for all the colorimetric assays.
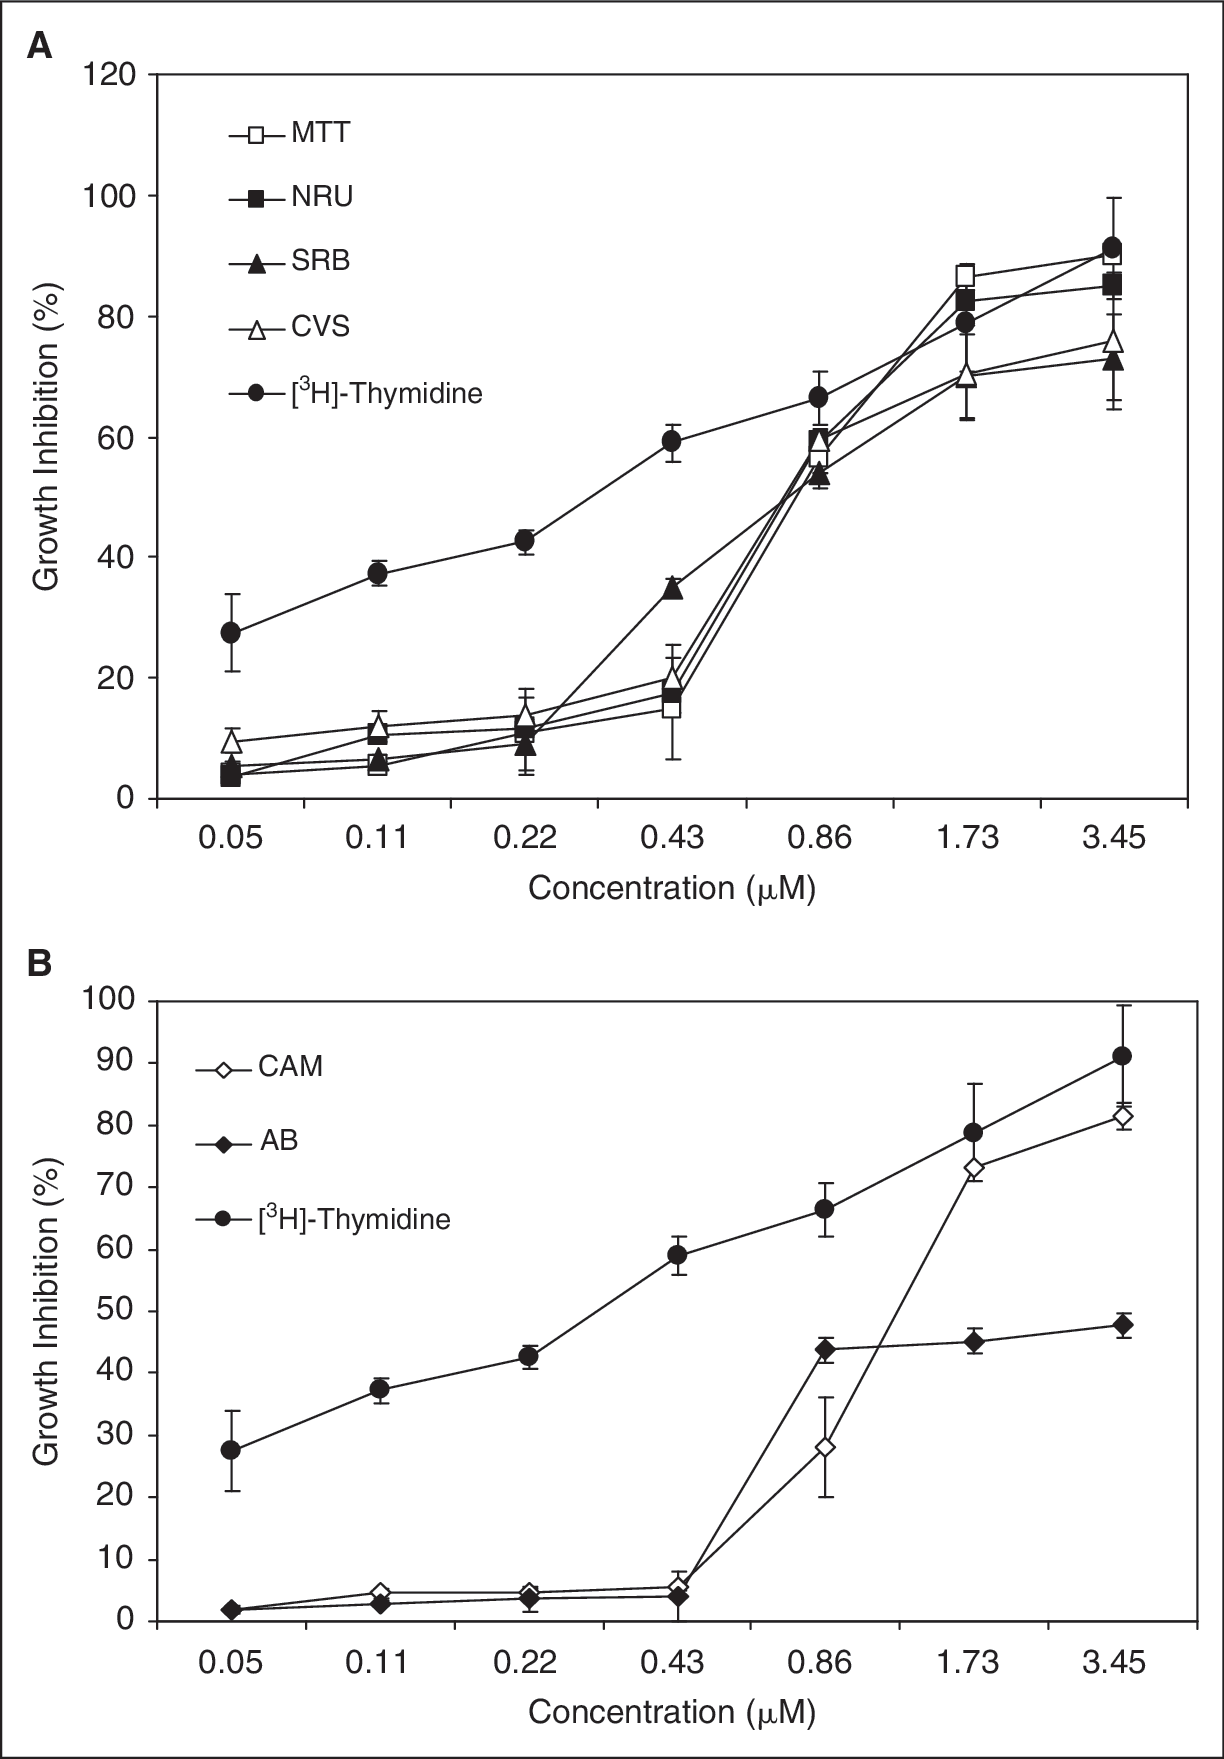
Dose–response curves for dithranol in human keratinocyte (HaCaT) cell line keratinocytes determined by (
Caspase activity assays were used in this study to determine whether dithranol was inducing apoptosis, by caspase activation, at lower concentrations. These assays ( Fig. 2 ) confirmed that dithranol induced dose-dependent caspase-3/7 activation in HaCaT keratinocytes at concentrations between 1.25 and 10 μM. No caspase activation was observed below these concentrations, so there is insufficient evidence to confirm whether the striking differences observed between the assays ( Fig. 1 ) at the lowest concentrations tested are due to dithranol-induced apoptosis.
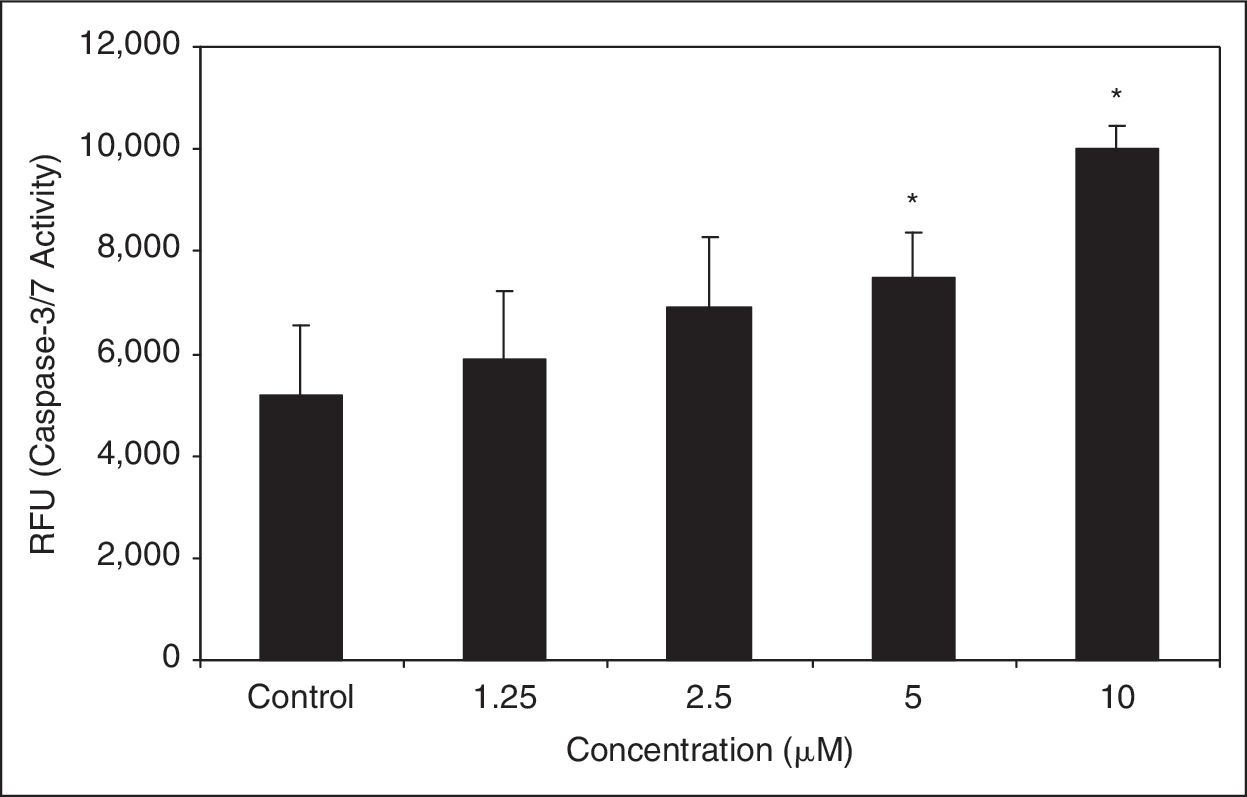
Assay of caspase-3/7 activity in the HaCaT cell line keratinocytes treated with increasing concentrations of dithranol as determined by the Apo-ONE homogeneous caspase-3/7 assay. Keratinocytes were seeded in 96-well microplates at 10,000 cells/0.2 mL/well and allowed to attach overnight. Dithranol was added to the cells and incubated for 24 h. Caspase-3/7 assays were performed as described in the Materials and Methods section. Data shown represent means ± SEM, n = 3 of 2 different experiments. Statistical significances between the control and the treated samples were determined by independent t-test, *P < 0.05.
No statistically significant differences (P > 0.01) were observed between the GI50 values determined by the colorimetric methods and the [3H]-thymidine incorporation assay ( Table 1 ). The GI50 values estimated by the fluorimetric assays were found to be significantly different (P < 0.001) from the [3H]-thymidine incorporation assay. These differences, as is evident from the dose–response curves, were more pronounced in the AB assay, which gave a significantly high GI50 value (P < 0.001).
The GI50 Values for Established Anti–Psoriatic Drugs as Determined by Various Growth Inhibition Assays
Dithranol and methotrexate were tested in the human keratinocyte (HaCaT) cell line at a concentration range of 0.05–3.5 μM and 0.17–22 μM, respectively, in all the assays. One-way analysis of variance (ANOVA) was performed to calculate the significant difference of the means from that of the [3H]-thymidine incorporation assay. Statistically significant differences were observed at * P < 0.001.
Data given as mean ± SEM, n = 6, of 2 different experiments.
Abbreviations: MTT, 3-(4,5-dimethyl-2-thiazolyl)-2,5-diphenyl-2H-tetrazolium bromide; NRU, neutral red uptake; SRB, sulforhodamine B; CVS, crystal violet staining; CAM, calcein AM; AB, alamar blue; GI50, the concentration that induced 50% growth inhibition relative to the control.
Growth inhibitory effect of methotrexate
The dose–response relationship for methotrexate in HaCaT cells was established in all the assays and, once again, GI50 values were calculated from these dose–response plots ( Fig. 3 ). As for dithranol, similar dose–response patterns were obtained from all the assays, with the exception of the AB assay. After 72 h exposure, methotrexate inhibited the growth of keratinocytes in a concentration-dependent manner (significant main effects of both drug concentration and assay type, P < 0.001), with a reduction in cell number by up to 90% for the concentration range tested (0.17–22 μM) in all the assays except for the AB assay (only 20% growth inhibition at the highest concentration tested). As before, similar trends were observed in the dose–response curves obtained for all the colorimetric assays but, in contrast to Figure 1, Figure 3 shows the colorimetric assays to be more sensitive (greater growth inhibition) than the radioactive assay in assessing the effects of methotrexate while the 2 fluorimetric assays show diverse results; with one being profoundly less and another being profoundly more sensitive than the radioactive assay. As in the case of dithranol, the fluorimetric CAM assay showed trends similar to those of the colorimetric assays, while the AB assay was found to significantly underestimate the effect of the drug at all the concentrations tested. The reasons for the differences in the growth inhibitions observed between the radioactive and the other assays are unclear.
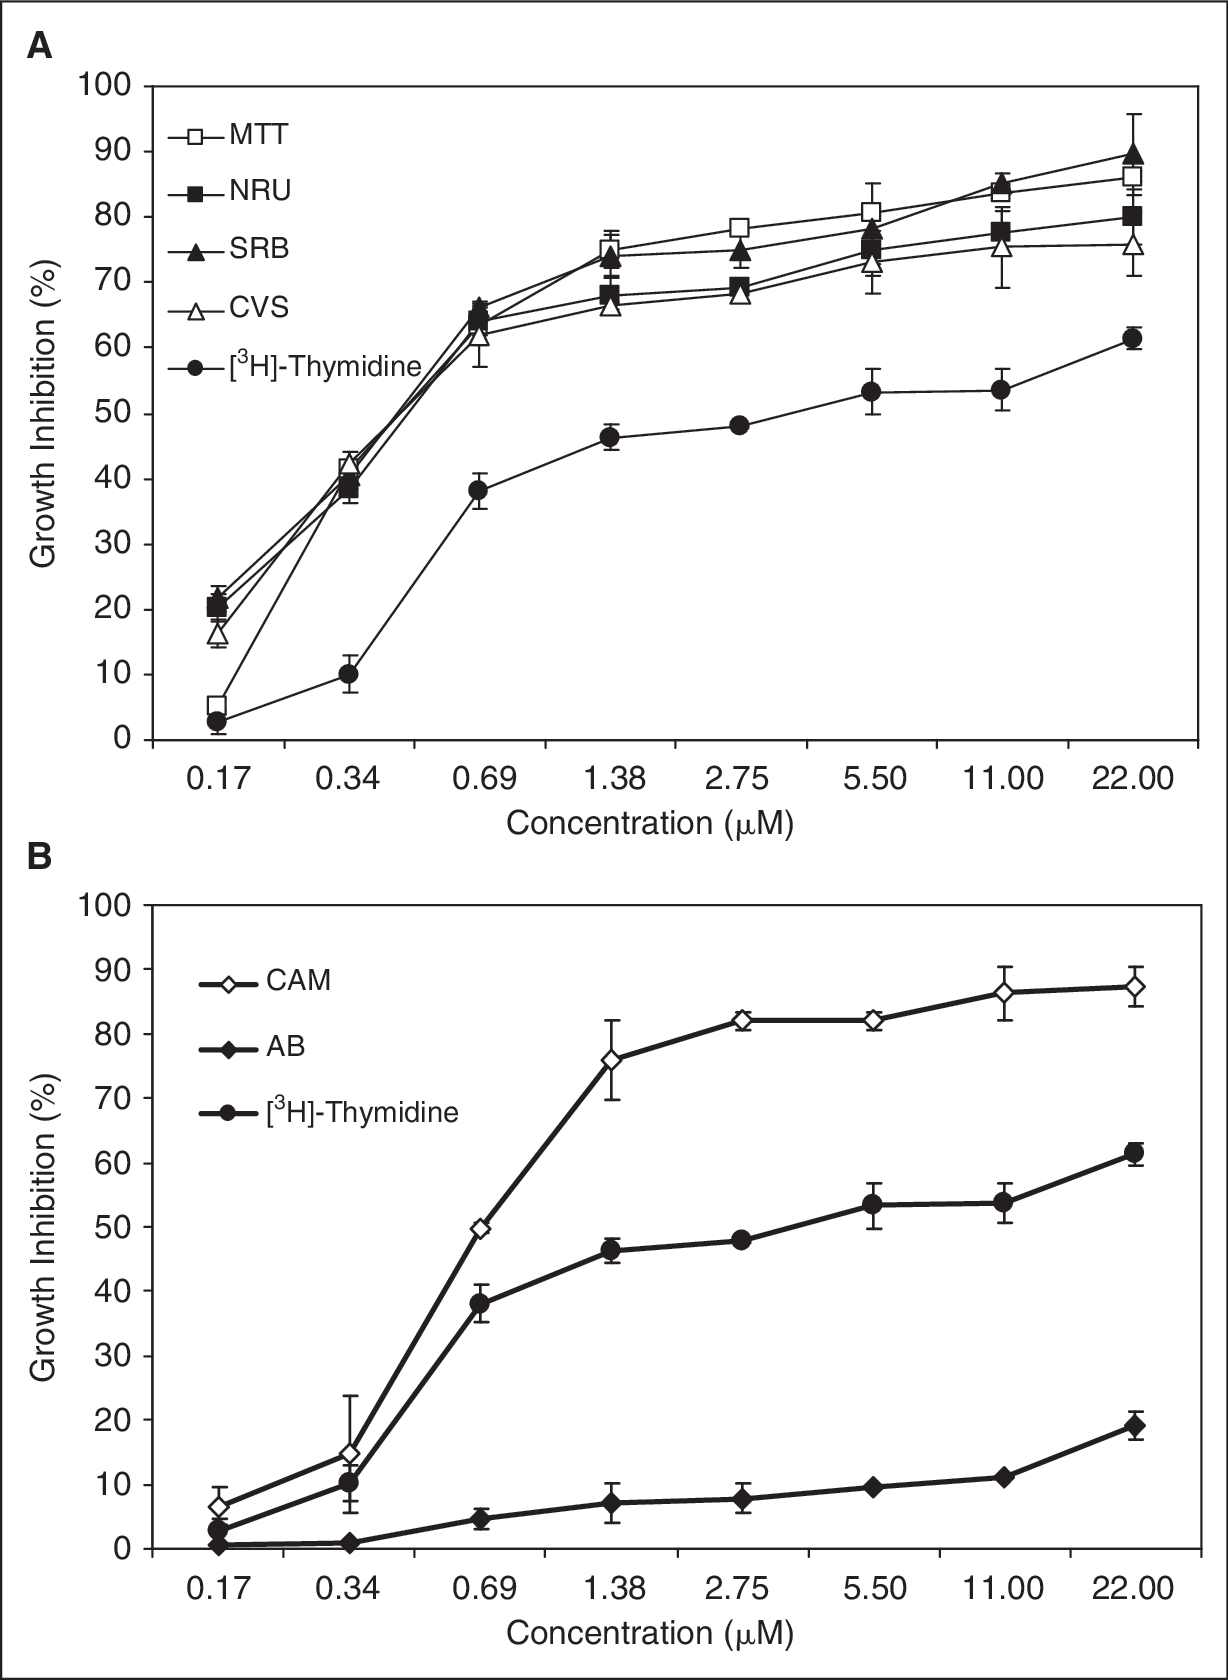
Dose–response curves for methotrexate in HaCaT keratinocytes determined by (
The GI50 values for methotrexate evaluated by the different assay methods are listed in Table 1 . No statistically significant differences were observed between the GI50 values determined by the colorimetric methods, the fluorimetric CAM assay, and the [3H]-thymidine incorporation assay. The GI50 value estimated by the AB assay was found to be significantly different (P < 0.001) from that from the [3H]-thymidine incorporation assay. As was the case for dithranol, staining with AB gave a significantly high GI50 value (P < 0.001), indicating an underestimation of growth inhibitory activity in comparison with the radioactive method.
For the concentration ranges tested, both dithranol and methotrexate inhibited the growth of keratinocytes in a dose-dependent manner, but methotrexate (GI50 0.14–0.3 μM) was found to demonstrate significantly higher growth inhibitory activity in HaCaT keratinocytes than dithranol (GI50 0.5–1.0 μM).
Comparison of colorimetric and fluorimetric methods with the [3H]-thymidine incorporation assay
For both the drugs tested, the dose responses estimated by the colorimetric methods were in agreement with the [3H]-thymidine incorporation assay. Also, no significant differences (P > 0.05) were observed between the GI50 values quantified by the colorimetric methods with the radioactive assay ( Table 1 ). The fluorimetric CAM assay underestimated the inhibitory effects of dithranol in comparison with the radioactive method ( Fig. 1 ), so the GI50 value obtained was significantly higher than that from the [3H]-thymidine incorporation assay (P < 0.001), but no significant differences were observed between the CAM and the [3H]-thymidine incorporation assay for the estimated GI50 values of methotrexate. The AB assay was the only indicator that gave significantly higher GI50 values than those obtained from the [3H]-thymidine incorporation assay (P < 0.001); for both the drugs tested and at all the concentrations tested, AB was found to constantly underestimate the growth inhibitory potential of both the drugs.
The correlations between the percentage growth inhibition determined by the different assay methods and the [3H]-thymidine incorporation assay are given in Figure 4 . For both the drugs tested, the strongest correlations (r > 0.9368; P < 0.01) were observed between the percentages of growth inhibitions determined by the [3H]-thymidine incorporation assay and the colorimetric methods ( Table 2 ), so any of these techniques are suitable alternatives to the radioactive assay for the evaluation of keratinocyte proliferation in vitro. The AB assay showed the lowest correlation (r > 0.874; P < 0.01) with the radioactive assay and was, therefore, found to be the least suitable for estimating keratinocyte proliferation in vitro. The colorimetric SRB assay showed the strongest correlation with the [3H]-thymidine incorporation assay for both the drugs tested, and was therefore found to be the most comparable to the standard radioactive method and so the most suited to replace it in the evaluation of the inhibition of keratinocyte proliferation by either new or established agents.
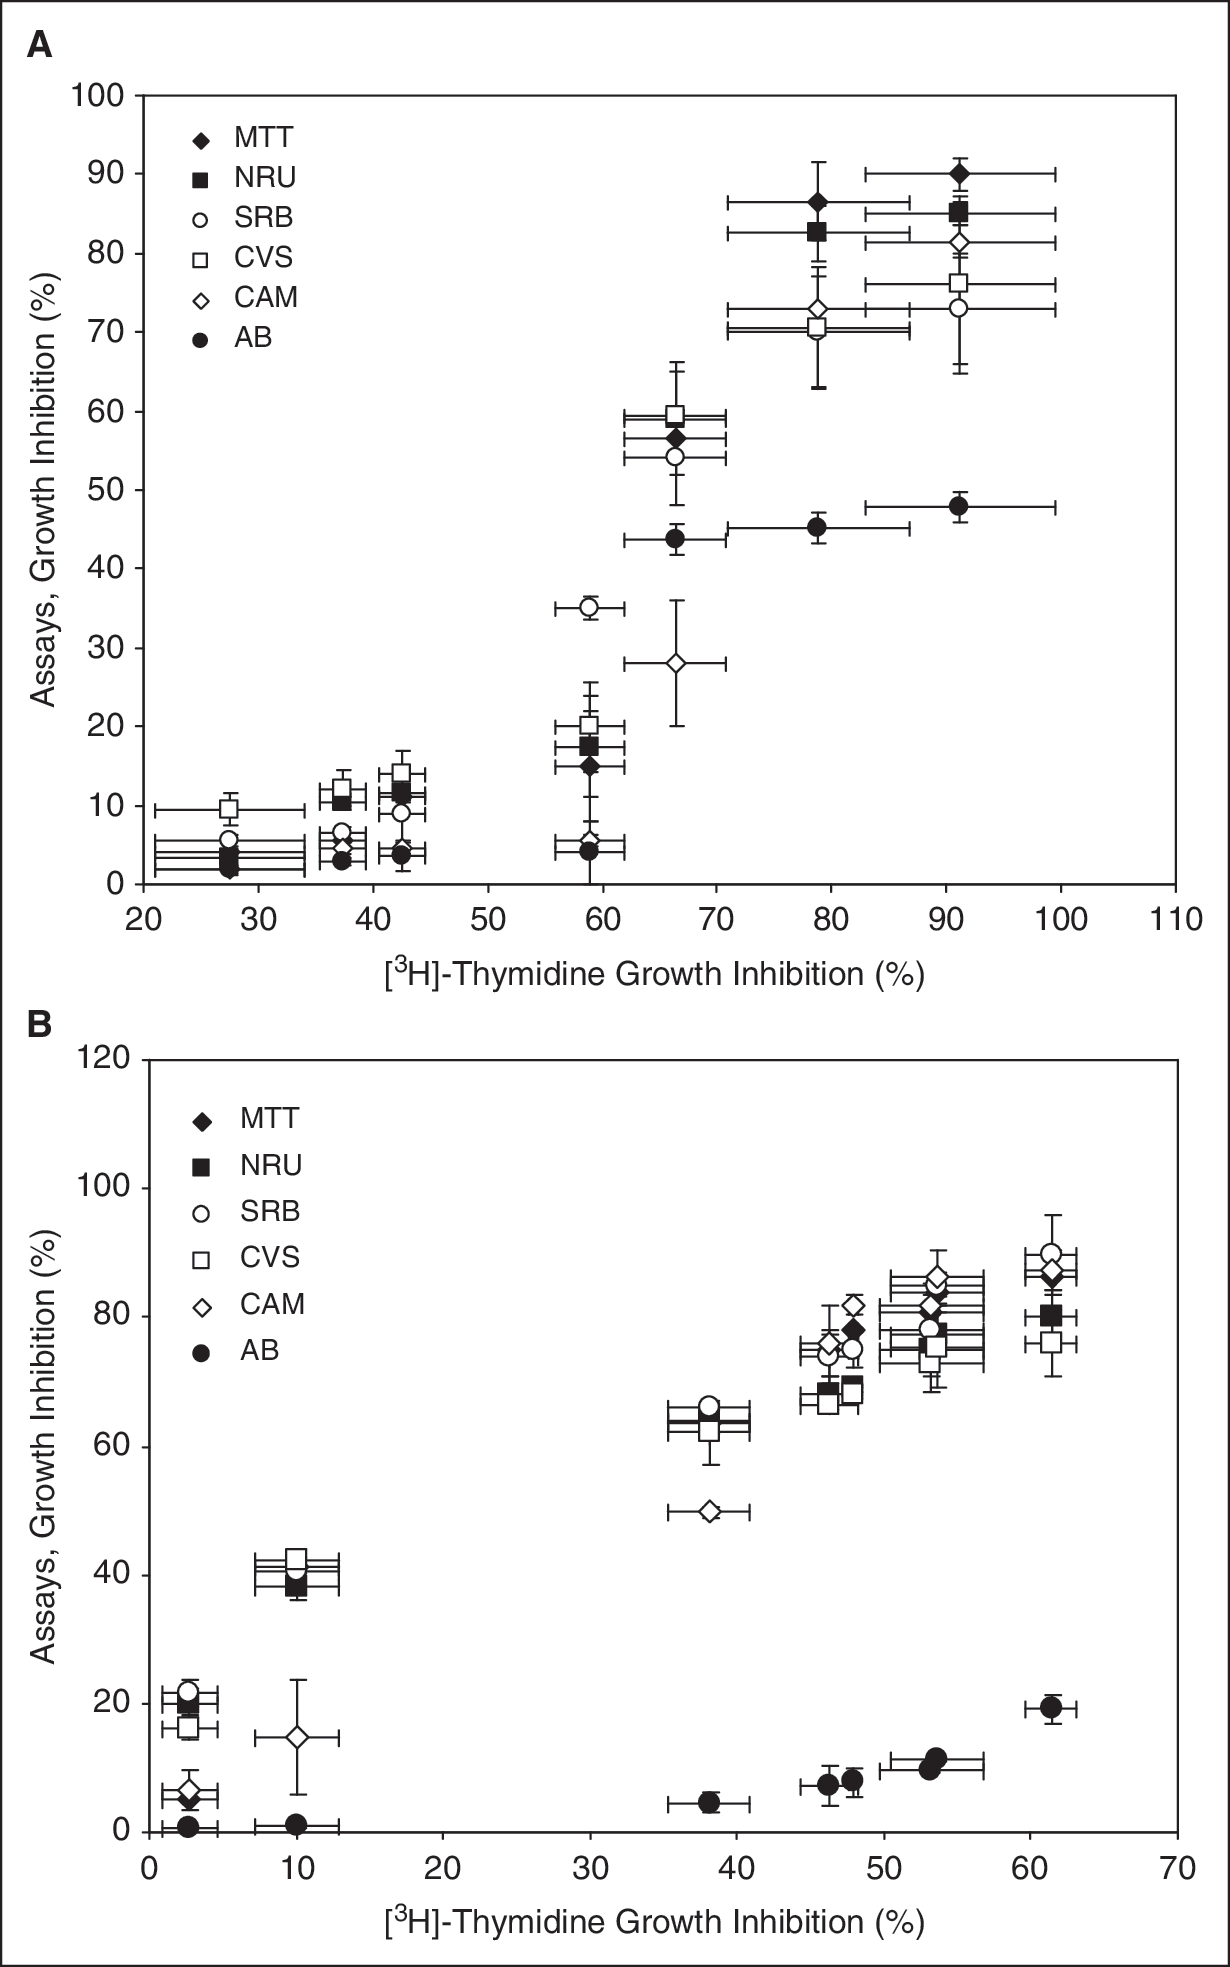
Correlation between 6 different growth inhibition assays and the standard [3H]-thymidine incorporation assay in HaCaT cells treated with (
Correlation Between 6 Different Growth Inhibition Assays and the Standard [3H]-Thymidine Incorporation Assay in HaCaT Cells Treated With Dithranol and Methotrexate
The correlations between the percentage growth inhibitions determined for different concentrations of the drugs were calculated using Pearson's correlation analysis. Correlation analysis was performed as shown in Figure 3 using the software GraphPad Prism. The statistical significance of correlation was set at P < 0.05. ** P < 0.01; *** P < 0.001.
Dithranol and methotrexate were tested in the HaCaT cell line at a concentration range of 0.05–3.5 μM and 0.17–22 μM, respectively, in all the assays.
Abbreviations: MTT, 3-(4,5-dimethyl-2-thiazolyl)-2,5-diphenyl-2H-tetrazolium bromide; NRU, neutral red uptake; SRB, sulforhodamine B; CVS, crystal violet staining; CAM, calcein AM; AB, alamar blue.
Reproducibility and assay variations
The intra- and inter-assay variabilities are presented in Table 3 . All the assays were observed to be reproducible in the HaCaT cell line. Intra-assay coefficients of variation for the assays were typically between 4% and 10%, whereas inter-assay variations were between 3% and 9%. The lowest variability was observed for the AB assay. Similar variabilities were observed for the colorimetric assays and the radioactive method.
Inter- and Intra-Assay Variabilities
Dithranol and methotrexate were tested in the human keratinocyte cell line, HaCaT cell line at a concentration range of 0.05–3.5 μM and 0.17–22 μM, respectively, in all the assays.
Each experiment repeated twice with 6 replicates of at least 7 different concentrations of both the drugs.
Abbreviations: MTT, 3-(4,5-dimethyl-2-thiazolyl)-2,5-diphenyl-2H-tetrazolium bromide; NRU, neutral red uptake; SRB, sulforhodamine B; CVS, crystal violet staining; CAM, calcein AM; AB, alamar blue.
Discussion
The inhibition of keratinocyte proliferation is an important parameter to be considered in the development and preclinical screening of experimental drugs for psoriasis. Despite the availability of a diverse range of assays measuring different indicators of proliferation (or viability), the [3H]-thymidine incorporation assay is still regarded as the method of choice when measuring keratinocyte proliferation in vitro. As stated previously, this technique has numerous disadvantages and its use is limited to laboratories equipped with radioactive facilities, restricting its application in routine high-throughput preclinical screening assays for the identification of novel anti-psoriatic drug candidates. A simple, sensitive, and reliable alternative to this radioactive method is thus desirable for the evaluation of keratinocyte proliferation and, for this, a comparative study between the radioactive assay and the commonly used growth inhibition assays was necessary.
In this work, we have investigated the suitability of 4 cost-effective and widely used colorimetric methods and 2 fluorimetric methods as alternatives to the [3H]-thymidine incorporation assay for the measurement of keratinocyte proliferation. Other than the MTT assay, none of the assays had previously been compared with the radioactive method in keratinocyte cultures. A strong correlation had previously been found between the results obtained from the MTT and [3H]-thymidine incorporation assays in many adherent and suspension cell lines of various origins, 48,49 but previous studies in keratinocyte cultures have reported that the MTT and [3H]-thymidine incorporation assays gave different results depending upon the drugs tested. 35 Similar results were observed in this study, where the alternative assays (including MTT) were found to over-or underestimate the growth inhibition potential of the test agents when compared with the radioactive assay, depending upon the drugs tested. The alternative assays also tended to over- or underestimate the potency of tested drugs depending on the ranges of concentration tested. There may be underlying reasons behind the differences in the assay results using compounds with different mechanisms of action, as each assay measures a different endpoint for cellular proliferation (or viability) and the different drugs may interfere with the assay chemistry and/or exhibit their effects on different proliferation pathways. Previous work supports the mechanism of action of the drugs influencing the assay results 35 and this inherent variation between the assay results highlights the significance of using more than one assay to validate the results when screening for compounds that have anti-proliferative activity.
Figure 1 highlights the differences between the effects of dithranol on [3H]-thymidine incorporation (designed specifically to measure changes in proliferation) and both the colorimetric and fluorimetric assays (which measure changes in cellular mass, metabolic state, lysosomal injury, intracellular esterase activity, etc.), particularly at lower concentrations (0.05–0.43 μM), which may be due to the inherent differences in the assay mechanisms.
Apoptosis is an important factor that has been attributed to the therapeutic action of dithranol in clearing psoriasis. Previous studies 16 have demonstrated that dithranol (1–10 μM) induced a reduction in the mitochondrial membrane potential (Δψm), the complete release of cytochrome c from mitochondria, caspase-3 activation, and morphological changes associated with apoptosis in HaCaT cells. Caspase activity assays were used in this study to determine whether dithranol was inducing apoptosis by caspase activation, at lower concentrations. These assays ( Fig. 2 ) confirmed that dithranol induces dose-dependent caspase-3/7 activation in HaCaT keratinocytes at concentrations between 1.25 and 10 μM. No caspase activation was observed below these concentrations, so there is insufficient evidence to confirm that the striking differences observed between the assays ( Fig. 1 ) are due to dithranol-induced apoptosis.
A previous study 17 demonstrated substantial apoptosis in keratinocytes treated with low doses of methotrexate (10−7 M), with a significant proportion (1%) of keratinocytes treated for 5 days with 10−7 M methotrexate being damaged and exhibiting the morphological features of apoptotic cell death. Only after 5 days exposure to MTX were sufficient numbers of apoptotic cells observed, so the marked differences between the assays in this work (which involved incubation for only 3 days with the drugs) are unlikely to be due to apoptosis alone.
The application of the AB assay in measuring the proliferation of adherent and nonadherent human and animal cell lines had been well demonstrated 50 and a close correlation between this assay and the [3H]-thymidine incorporation assay had been previously illustrated in lymphocytes. 33 In this first study evaluating the association between the AB and thymidine incorporation assays in keratinocyte cultures, the AB assay was found to constantly underestimate the potency of drugs when compared with the [3H]-thymidine incorporation assay. As discussed earlier, this may be due to the mechanism of action of the drugs interfering with the assay endpoint or the interference of serum in the media. 32 Nonetheless, the AB assay alone is clearly not suitable for the evaluation of the inhibition of keratinocyte proliferation in vitro.
Despite the discrepancies between the assays mentioned previously, all of the assays under investigation, with the exception of the AB assay, gave similar dose–response profiles for both the drugs tested, with the results from the colorimetric methods, MTT, SRB, NRU, and CVS, being most similar to those from the radioactive method, and the SRB and NRU assays showing the strongest correlation. All of these assays showed good reproducibility in keratinocyte cell lines, with low inter-and intra-assay deviations. Based on this study, the colorimetric assays, MTT, SRB, NRU, and CVS, are deemed to be suitable to replace the [3H]-thymidine incorporation assay in the evaluation of the inhibition of keratinocyte proliferation in vitro. It is, however, recommended that more than one assay from this panel is used in order to validate the results when screening novel agents.
When choosing assays for a particular application, various factors, such as the assay and drug chemistry, sensitivity, speed, and simplicity of the method, should be carefully considered. The SRB assay is a rapid, sensitive, and inexpensive method suitable for use in ordinary laboratory purposes and for very large-scale applications. The SRB and CVS assays have the advantage that a large number of plates can be stored dry, following staining, for processing at a later time and they are well suited to high-volume, automated drug screening. One drawback, however, is that these assays require extensive and time-consuming washing steps and there is also the possibility of nonspecific dye binding leading to possible overestimation of cell numbers, which needs to be taken into account. The advantage of the MTT assay is that it is simple, rapid, and easy to perform, and it requires fewer steps in comparison with the protein staining assays. The nonspecific reduction of MTT by serum or plasma in the medium and the interference by various assay conditions should, however, be carefully considered. The NRU assay is simple, reproducible, and is relatively easy to perform, but care should be taken to consider the possibility of false results due to lysosomal swelling by the test agents. As recommended by Hamid et al., careful interpretation of the data generated using colorimetric assays in HTS of compound libraries is warranted, due to the possibility of false positive or negative results caused by the inhibition or induction of drug-metabolizing enzymes. 51 Another crucial factor to consider when evaluating the inhibition of proliferation of keratinocytes is the fact that they exhibit contact inhibition, so it is important to ascertain that the cells are in the exponential growth phase during drug exposure, by choosing the optimum cell density and drug incubation period. To conclude, our data provide further insights into the use of proliferation assays using HaCaT cells as a general strategy for the preclinical screening of novel anti-psoriatic drugs, and suggests that any of the colorimetric methods MTT, SRB, NRU, and CVS, are suitable alternatives to the [3H]-thymidine incorporation assay.
Footnotes
Acknowledgment
The authors wish to thank Stiefel Laboratories for funding and their permission to submit this manuscript, Mr. Barrie Thynne and Mrs. Joy Otun for their technical assistance, and Mr. Paul S. Bradley and Dr. Ken McGarry for their statistical guidance.
Author Disclosure Statement
The authors state no competing interests.