




Abstract
In the search for new chemical entities that interact with G-protein-coupled receptors (GPCRs), assays that quantify efficacy and affinity are employed. Traditional methods for measuring affinity involve radiolabeled ligands. To address the need for homogeneous biochemical fluorescent assays to characterize orthosteric ligand affinity and dissociation rates, we have developed a fluorescence anisotropy (FA) assay for the muscarinic M1 receptor that can be conducted in a 384-well plate. We used membranes from a muscarinic M1 cell line optimized for high-throughput functional assays and the previously characterized fluorescent antagonist BODIPY ® FL pirenzepine. The affinities of reference compounds were determined in the competitive FA assay and compared with those obtained with a competitive filter-based radioligand-binding assay using [3H] N-methylscopolamine. The IC50 values produced from the FA assay were well-correlated with the radioligand-binding K i values (R 2 = 0.98). The dissociation of the BODIPY FL pirenzepine was readily monitored in real time using the FA assay and was sensitive to the presence of the allosteric modulator gallamine. This M1 FA assay offers advantages over traditional radioligand-binding assays as it eliminates radioactivity while allowing investigation of orthosteric or allosteric muscarinic M1 ligands in a homogeneous format.
Introduction
Affinity and efficacy measurements define a ligand–receptor interaction. 3 The most common assay methods used to quantify GPCR–ligand affinity employ radioactive ligands. The use of radioligands requires that the assay method discriminate the ligand that is specifically bound to the GPCR from the free or unbound ligand. Several methods have been developed to distinguish free from bound radioligand, such as nonhomogeneous filtration or homogeneous scintillation proximity-based methods. The disadvantages of either approach include the costs associated with radioactive waste disposal and the labor-intensive nature of these assays.
Several fluorescence-based techniques such as fluorescence anisotropy or polarization (FA and FP), fluorescence-resonance energy transfer (FRET), and time-resolved (TR) methods have been applied to measure GPCR–ligand affinity using either whole cells or membranes derived from cells expressing a GPCR of interest. FA assays have been developed for several GPCRs using fluorescently labeled ligands and cellular membranes containing the GPCR of interest. 5 –9 In order to measure binding affinity, an FA assay does not require the separation of the receptor-bound fluorescent ligand from the unbound fluorescent ligand. The signal measured in the FA assay derives from the fact that a small, unbound fluorescently labeled ligand (“tracer”) can rotate more quickly in solution relative to when bound to a larger receptor. When the tracer is excited with plane-polarized light, the rapid rotation of the unbound tracer results in a depolarization of emitted photons. Conversely, when the tracer is bound to a receptor there is less fluorophore rotation, and less of a loss of polarization upon emission. Therefore, the affinity of ligands can be readily assessed in a competitive FA assay format by monitoring the polarization of the tracer as it is displaced from the receptor. FRET-based assays have been configured to measure ligand affinity using a fluorophore-linked or quencher-linked ligand and a cell expressing a GPCR that is fused with a green fluorescent protein (GFP) variant. 10,11 The proximity of the receptor-bound fluorescent ligand to the GFP allows transfer of energy between the fluorescent ligand and GFP. Similar to an FA assay, the affinity of a ligand can be measured in a competitive format. TR fluorescent assay formats have been reported for GPCRs using lanthanide-labeled ligands. 5,12 Distinct assay benefits can be achieved through the use of lanthanide-labeled molecules due to their long fluorescent lifetimes, or time periods over which fluorescence emission is sustained. These methods have required either expression of the GPCR as a fusion to another protein/peptide sequence in order to achieve a TR-FRET assay 5 or the need to perform multiple wash steps to remove unbound fluorescent ligand from receptor-bound ligand in TR-fluorescent intensity assays. 12 Among the assay techniques described above, only FA-based GPCR assays offer the ability to use a membrane preparation (MP) that contains a native/nonmodified GPCR to rapidly quantify orthosteric ligand affinity in a homogeneous, nonradioactive format.
There are 5 members of the muscarinic acetylcholine receptor family (M1–M5) that belong to the GPCR superfamily. 13 A drug that can selectively target one of the muscarinic receptor subtypes may have therapeutic benefit for the treatment of several neurologic or psychiatric disorders, including Alzheimer's disease and schizophrenia. 14 Since the orthosteric binding site found within the muscarinic family is highly conserved, identification of muscarinic subtype selective ligands has been challenging. Allosteric site(s) on the muscarinic receptors are thought to be more extracellular compared to the orthosteric site and less conserved between muscarinic subtype family members (reviewed in Ref. 13,14 ). As a result, the identification of allosteric ligands that could selectively modulate a muscarinic receptor subtype is highly desirable.
Several muscarinic antagonists including anthroylcholine, 15 telezepine, 16,17 and pirenzepine 17 –19 have been modified to enable receptor cross-linking or receptor labeling for the purpose of monitoring receptor expression and distribution. Of particular note for this work was the synthesis and use of the fluorescent analog BODIPY® FL pirenzepine to investigate the expression and distribution of muscarinic M1 receptors in cultured neurons. 19 The use of fluorescent muscarinic ligand analogs to determine ligand affinity for the M1 receptor is more limited. 10,20 To date, no studies have used a fluorescent M1 ligand and a nonaltered (non-fused) M1 receptor to quantify orthosteric and allosteric binding via fluorescence anisotropy or polarization.
To address the need for homogeneous biochemical fluorescent assays to quantify orthosteric ligand affinity as well as dissociation rates, we have developed an FA assay using muscarinic M1 membranes and BODIPY FL pirenzpine. We describe the development of the FA assay and compare the affinities of reference compounds obtained via radiometric-based and FA-based methods using the same M1 membranes. Additionally, we have demonstrated that the dissociation of the BODIPY FL pirenzepine can be monitored readily by FA, and that the rate of this dissociation is altered in the presence of gallamine, a previously described allosteric ligand of the M1 receptor.
Materials and Methods
Materials
GeneBLAzer® M1-NFAT-bla Jurkat cells, all cell culture reagents, Dulbecco's phosphate-buffered saline (PBS; lacking calcium and magnesium), ultrapure BSA, and BODIPY FL pirenzepine were obtained from Life Technologies (Carlsbad, CA). The GeneBLAzer M1 NFAT-bla Jurkat cells (M1 GeneBLAzer) stably express the human M1 muscarinic receptor and contain the β-lactamase gene under the control of an NFAT response element. All unlabeled muscarinic ligands, GTPγS, and polyethyleneimine (PEI) were obtained from Sigma Aldrich (St. Louis, MO). [ 3 H] N-methylscopolamine (NMS) and [ 35 S] GTPγS were obtained from Perkin Elmer. Dry dimethylsulfoxide (DMSO) was obtained from FLUKA.
Cell Culture and Membrane Preparation
M1 GeneBLAzer cells were maintained according to manufacturer's instructions at 37°C, 5% CO2, in RPMI 1640 plus GLUTMAX™ media supplemented to contain 10% dialyzed fetal bovine serum (FBS), 0.1 mM nonessential amino acids, 1 mM sodium pyruvate, 25 mM HEPES (pH 7.3), 100 units/mL penicillin, 100 μg/mL streptomycin, 500 μg/mL Geneticin, and 100 μg/mL Zeocin. Cells were harvested at 1–2 × 10⁶ cells/mL by centrifugation at ∼300–400g for 10 min. The cell pellet was resuspended in cold homogenization buffer (20 mM HEPES, pH 7.5, 2 mM MgCl2, 1 mM EDTA, 2 mM EGTA, 1 mM PMSF, 10 μg/mL leupeptin, 5 μM E64, 0.5 mM benzamidine) and homogenized on ice using a glass dounce (15–20 strokes) followed by brief sonication (10-s bursts) on ice; cell breakage was monitored by phase microscopy. The homogenized sample was centrifuged at 400g at 4°C for 10 min. The supernatant was then subjected to centrifugation at 72,000g for 30 min at 4°C. The pellets were washed twice by resuspending in homogenization buffer, followed by douncing, and centrifugation at 72,000g for 30 min at 4°C. The final pellet was resuspended in 20 mM HEPES, pH 7.5, 1 mM MgCl2, 1 mM EGTA, 10 μg/mL leupeptin, 10% glycerol, and sonicated in 6-s bursts on ice to obtain a homogeneous suspension. The MP was aliquoted, rapidly frozen on dry ice, and stored at −80°C. Total protein content of the MP was determined using the Bio-Rad Protein Assay (Bio-Rad) with BSA (Pierce) as the standard.
[35S] GTPγS-Binding Assays
Agonist-induced [35S] GTPγS binding was conducted using M1 MPs. The components of the assay buffer were varied to find conditions that produced a large acetylcholine-induced response. The final assay buffer composition was 20 mM HEPES, pH 7.5, 20 mM NaCl, 5 mM MgCl2, 3 μM GDP, 1 mM EGTA, 10 μg/mL saponin. These conditions resulted in a maximal acetylcholine-induced response 3-fold greater than the response observed in the absence of ligand (ie, basal conditions). A dilution series for each ligand was incubated with M1 membranes at room temperature for ∼20 min prior to addition of [ 35 S] GTPγS. Incubations were allowed to proceed for 1 h. The final concentrations of M1 MP, [35S] GTPγS, and DMSO were 15–35 μg/mL, 0.2 nM, and 0.5%, respectively. The reactions were terminated by filtration through GF/C unifilter 96-well plates (Perkin Elmer) using a Brandel harvester (Brandel, Gaithersburg, MD). Filter plates were washed with 5 × 0.4 mL of cold 50 mM Tris–Cl, pH 7.5, 5 mM MgCl2 and then allowed to dry prior to addition of 50 μL of Microscint-20 (Perkin Elmer). Bound radioactivity was quantified using a TopCount scintillation counter (Perkin Elmer), and all data were analyzed using Micosoft Excel®. Not more than 20% of the [35S] GTPγS was bound under any condition. Nonspecific binding was defined as that which occurred in the presence of 10 μM-unlabeled GTPγS, and represented <0.5% of total binding. Specific binding was calculated as the difference between total binding and nonspecific binding. Basal binding was the specific binding that occurred in the absence of ligand. Specific binding was normalized to the percent of basal as follows: (% of basal GTPγS binding) = 100 × (specific agonist-induced GTPγS binding)/(specific basal GTPγS binding). The percentage of basal binding for each ligand concentration was subsequently plotted using Prism® (GraphPad Software Inc.) with a 4-parameter logistical curve fit to determine EC50 values. All ligands were tested in duplicate dose responses in 2–5 unique experiments.
Radioligand-Binding Assays
Saturation-binding assays were performed on M1 MPs. Total binding was determined by incubating 2–4 μg of M1 MP with increasing concentrations (0.063–2 nM) of [ 3 H] NMS in 0.4–0.5 mL Dulbecco's PBS (1.5 mM potassium phosphate, 8.1 mM sodium phosphate, pH 7.4, 137.9 mM NaCl, 2.7 mM KCl) that was supplemented with 50 μg/mL ultrapure BSA. Nonspecific binding was determined in the presence of 10 μM atropine. Reactions were allowed to equilibrate for 2 h at room temperature prior to transfer to 0.5% polyethyleneimine-coated GF/B unifilters (Perkin Elmer) using a Brandel harvester. Filter plates were washed with 5 × 0.4 mL of cold 50 mM Tris–Cl, pH 7.5, and then allowed to dry prior to addition of 50 μL of Microscint-20. Bound radioactivity was quantified using a TopCount scintillation counter. Specific binding was calculated as the difference between total binding and nonspecific binding. All conditions were performed in at least duplicate. All data were analyzed using Excel® and Prism® to determine ligand affinity (K D) and receptor density (B max).
Competitive binding assays were performed by incubating increasing concentrations of ligands with 2–4 μg of M1 MP with 0.15 nM [ 3 H] NMS in a total volume of 0.5 mL. The assay buffer was similar to that used in the [ 35 S] GTPγS-binding experiments, and contained 20 mM HEPES, pH 7.5, 20 mM NaCl, 5 mM MgCl2, and 50 μg/mL ultrapure BSA. Ligands were analyzed using duplicate 10-point dilution series such that the final DMSO concentration in each assay well was 0.5%. Incubation times, transfer to filter plates, and processing are as described above for saturation-binding experiments. In select experiments, unlabeled GTPγS was included at a final concentration of 5 μm. All competitive binding data were analyzed using Excel and were plotted within Prism using a 4-parameter logistical curve fit, a 1-site competitive curve fit, or a 2-site competitive curve fit. The method of Cheng–Prusoff 21 was used to calculate K i values from IC50 values obtained from 4-parameter logistical curve fits.
Fluorescence Anisotropy Ligand Displacement Assay
To determine assay conditions that result in BODIPY FL binding to M1 MPs, the following 2 experiments were conducted: (a) increasing concentrations of M1 MPs were incubated with a fixed concentration (2 nM) of BODIPY FL pirenzepine and (b) a fixed M1 MP concentration was incubated with increasing BODIPY FL pirenzepine concentrations (0.5–4 nM). The molar concentration of M1 present in each MP was calculated from the total protein content (mg/mL) and receptor density (pmol/mg) determined via a protein assay and a [
3
H] NMS saturation-binding assay, respectively. The FA assay buffer composition was experimentally investigated using radioligand-binding and GTPγS-binding buffers as starting points. The final FA assay buffer selected was 20 mM HEPES, pH 7.5, 20 mM NaCl, 5 mM MgCl2 supplemented with 0.025% Big CHAP. For experiments where membranes were titrated, the assay buffer was supplemented with 50 μg/mL ultra-pure bovine γ-globulin (Life Technologies, Carlsbad, CA) to reduce nonspecific loss of protein due to serial dilution. Unless otherwise stated, all assays were conducted in black 384-well polypropylene plates (Matrical, Inc.) in 30 μL total volume using a fixed concentration of 2 nM BODIPY FL pirenzepine. The reactions were allowed to incubate at room temperature for 1–4 h, protected from light and evaporation. Fluorescence polarization and total intensity values were measured on a Tecan Infinite® F500 plate reader using a 485 (20 nm bandpass) excitation filter, 535 nm (25 nm bandpass) emission filter, and a dichroic mirror of 510 nm. Anisotropy (A) was calculated from polarization (P) values via the equation: A = 2P/(3 – P). As the total fluorescence intensity of the BODIPY FL pirenzepine was altered by increasing concentrations of M1 membranes, the measured anisotropy values (A) were corrected via the following equation.
22,23
:
A b and A f are the anisotropies of the bound and free fluorescent molecules, respectively. Q is the ratio of fluorescence intensities of the bound and free fluorescent molecules. F SB is the fraction of bound fluorescent ligand.
For FA competitive binding experiments and kinetic dissociation experiments, a fixed concentration of M1 membranes was used within the EC70–EC80 concentration range, which was experimentally determined via membrane titration; and reactions were allowed to incubate for 2 h prior to collecting data. Competitive binding experiments for various M1 ligands were performed in duplicate using a 10-point dilution series and a final DMSO concentration of 0.5%. The anisotropy values and F SB values resulting from competitive binding experiments were fit within Prism using either a 4-parameter logistical curve fit, a 1-site competitive curve fit, or a 2-site competitive curve fit. Z′ values were calculated according to the method of Zhang and colleagues. 24 Ligand-induced dissociation experiments were conducted by pre-incubating the M1 membranes with BODIPY FL pirenzepine in the presence or absence of 2 μM atropine for 2–2.5 h at room temperature. To these samples, atropine or atropine plus gallamine to final concentrations of 1 μM atropine, 1 μM atropine plus 0.1 mM gallamine, or 1 μM atropine plus 1 mM gallamine were added. The FP and total intensity of the samples were monitored every 3 min on the Tecan Infinite F500 instrument using kinetic mode. Each condition was assayed in triplicate. The FP was converted to anisotropy and F SB as described above. F SB was plotted as a function of time and fit using the nonlinear regression analysis of mono-exponential decay within Prism.
Results
Characterization of M1 Membranes and BODIPY FL Pirenzepine
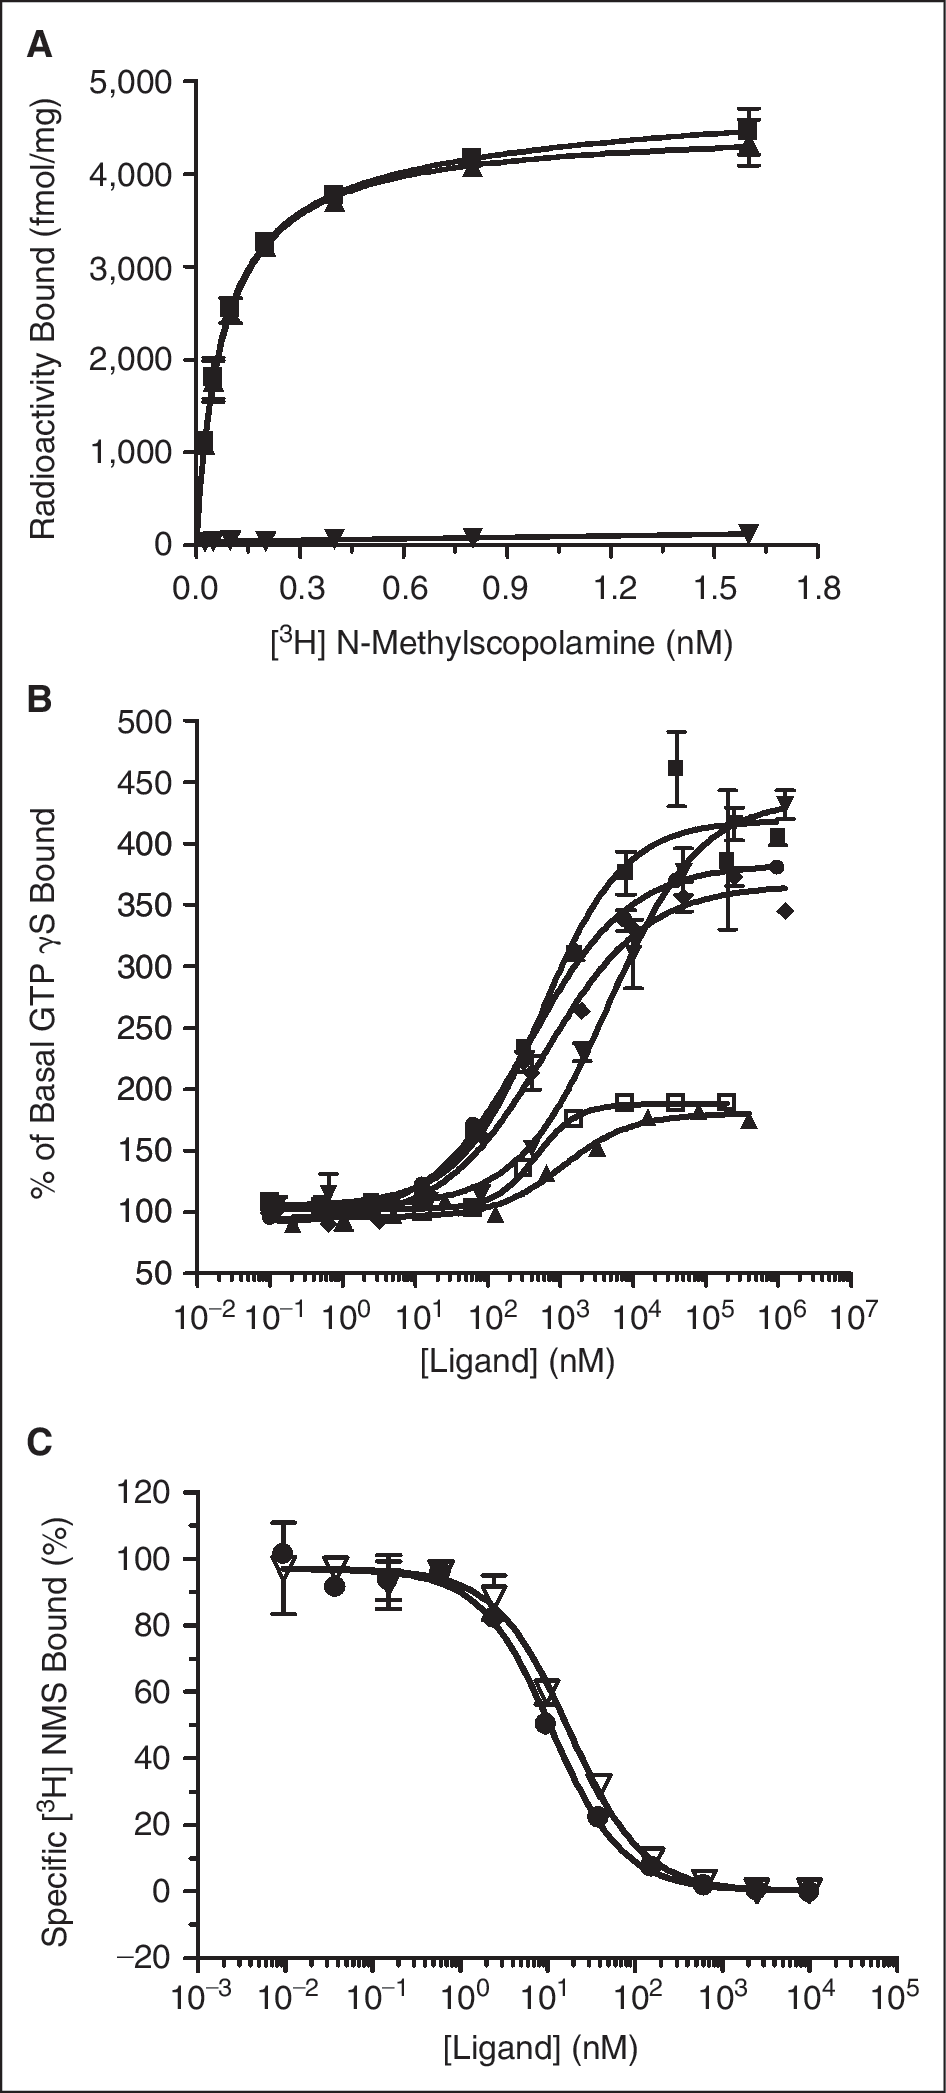
In order to develop an FA assay for GPCRs, an appropriately high receptor density is critical. 7 We sought to develop an FA assay using membranes from a cell line overexpressing the Muscaranic M1 GPCR and the fluorescent antagonist BODIPY FL pirenzepine. Membranes prepared from this cell line were analyzed via saturation-binding analysis using [ 3 H] NMS ( Fig. 1A ). The average specific receptor density obtained from 5 independent M1 MPs is 5.0 pmol/mg and the K D for [ 3 H] NMS is 0.12 nM, which is consistent with the expected K D values (0.05–1.6 nM) reported in the literature 25 and in the International Union of Pharmacology (IUPHAR) GPCR database. 26 The functional quality of the M1 MPs was assessed using a [ 35 S] GTPγS assay. The M1 MPs were found to functionally couple to G-proteins in an agonist-dependent manner ( Fig. 1B ). From at least 2 independent experiments, the full agonists of oxotremorine M, carbachol, and methacholine had average maximal efficacies of 92%–100% of the efficacy obtained with acetylcholine. The partial agonists of pilocarpine and McNA-343 had average maximal efficacies relative to that obtained with acetylcholine of 29% and 22%, respectively. As a high-affinity ligand is required to develop an FA assay, the affinity of unlabeled pirenzepine and BODIPY FL-labeled pirenzepine were determined in competitive binding experiments with [ 3 H] NMS and M1 MPs ( Fig. 1C ). The average K i value (±SEM) for BODIPY FL pirenzepine was slightly right-shifted (20.8 ± 3.8 nM) relative to that of pirenzepine (6.5 ± 0.26 nM).
(
Anisotropy Assay Optimization using M1 Membranes and BODIPY FL Pirenzepine
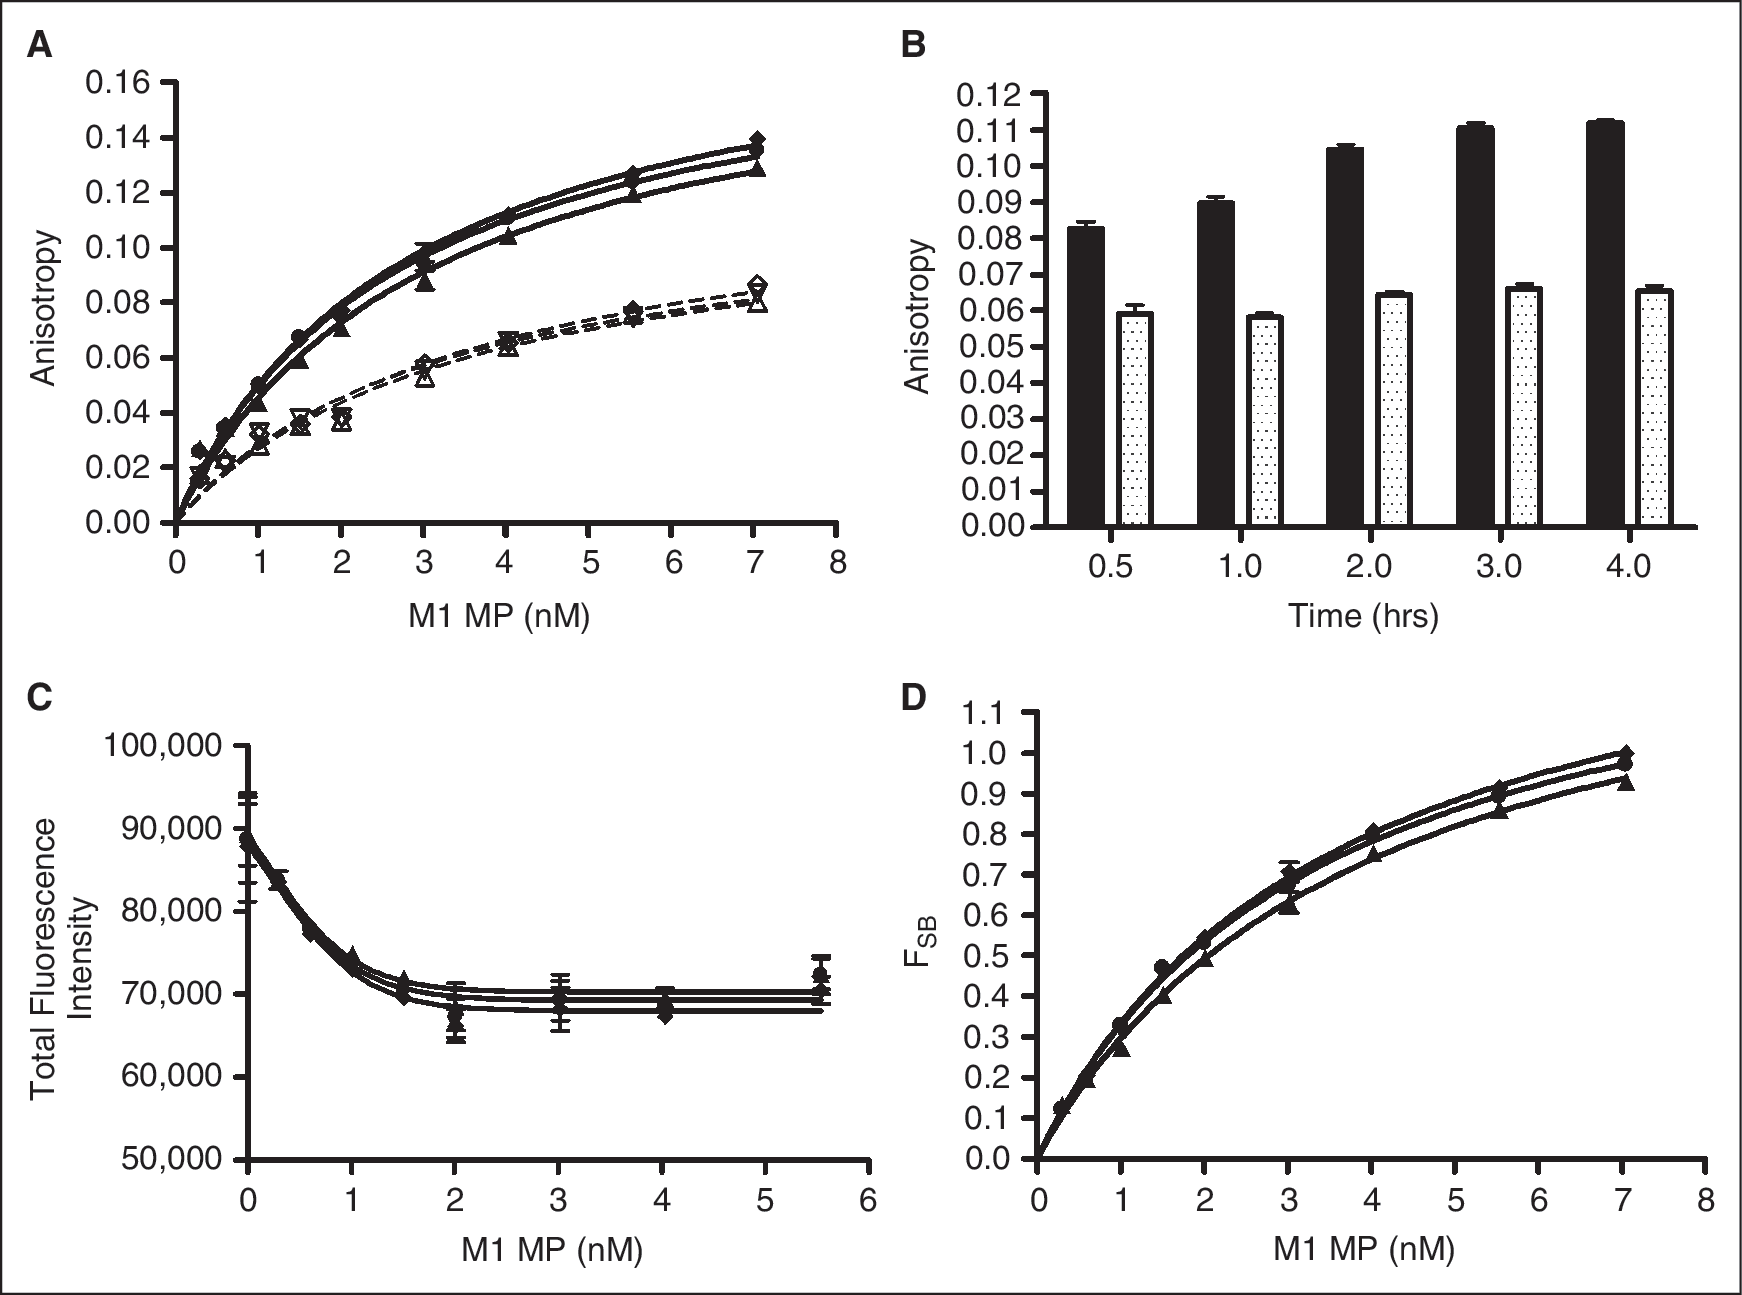
To optimize the anisotropy assay, various combinations of M1 MPs and BODIPY FL pirenzepine concentrations were tested. M1 MPs were titrated against a fixed concentration of (2 nM) BODIPY FL pirenzepine in the presence or absence of saturating atropine, and the resulting anisotropy signals were monitored over time ( Fig. 2A ). A kinetic plot of the data in Figure 2A for a single MP concentration is shown in Figure 2B . The anisotropy in samples lacking unlabeled competitive ligand (solid lines, Fig. 2A ; solid bars, Fig. 2B ) increased during the first 2 h and then changed much less between 2 and 4 h. The changes that occurred during this same time period in presence of the unlabeled competitive ligand atropine are less substantial (dashed lines, Fig. 2A ; dotted bars, Fig. 2B ). As a result, all data was collected after an incubation of 2–4 h unless otherwise specified. The increase in the anisotropy of BODIPY FL pirenzepine with increasing M1 MPs corresponded to a decrease in the total fluorescence ( Fig. 2C ). This suggests that the binding event could be detected by either anisotropy or total fluorescence intensity. As a result of this decrease in total fluorescence intensity, the anisotropy values were corrected for the change in total fluorescence intensity as described in the Materials and Methods section. The resulting corrected data (F SB) was plot vs. M1 MP concentration ( Fig. 2D ). A final concentration of 2 nM BODIPY FL pirenzepine was chosen for all experiments reported here because it resulted in the largest anisotropy change between reactions with or without unlabeled competitive ligand as well as Z′ values >0.5 (data not shown).
(
Pharmacology of the M1 Receptor Assessed by Fluorescence Anisotropy and Radioligand Binding
The affinity of several known M1 ligands was determined using the competitive anisotropy assay and a competitive radioligand-binding assay. The anisotropy values or fluorescence intensity corrected F SB values were plot vs. unlabeled ligand concentration to determine IC50 values ( Fig. 3A and 3B , respectively). The resulting IC50 values obtained using either anisotropy or F SB plots are summarized in Table 1 . Using F SB values that correct for the fluorescence intensity changes rather than uncorrected anisotropy values, there is a rightward shift in IC50 values of ∼1.5- to 3-fold ( Table 1 ). Using the same group of compounds, K i values were determined using [ 3 H] NMS competitive binding and were found to be in close agreement to those reported in the literature, differing by ≤4-fold for any ligand tested ( Fig. 3C and Table 1 ). 26 –28 Excellent correlation was found between the average pK i determined in a radioligand-binding assay and the average pIC50 determined using either anisotropy (open diamond and dashed line) or F SB (closed triangle and solid line), with linear regression analysis of the data producing an R 2 of 0.98 for both anisotropy and F SB ( Fig. 3D ). The robustness of the assay was assessed by Z′-value calculation. 24 The anisotropy obtained for 8 replicates in the presence of competitive ligand (open symbols) and 8 replicates in the absence of competitive ligand (closed symbols) from 4 independent experiments is shown in Figure 3E. As Z′ values for each of these 4 experiments were >0.5, the assay is robust. Future steps to determine compatibility of this assay with high-throughput methods should include automation of the assay and screening of a control library of compounds.
Pharmacology Profile of Selected M1 Ligands in a Radioligand Filter-Based Assay or a Fluorescence Anisotropy Assay
K i and IC50 values represent the mean ± SEM resulting from 2 to 4 experiments in which a 4-parameter logistical curve fit was used.
K i from International Union of Pharmacology (IUPHAR) database. 26
K i from Psychoactive Drug Screening Program (PDSP) Database. 27
K H – K L obtained from 2-site binding model of competitive radioligand-binding data. 28

(
Agonist-binding properties can be modulated by the manipulation of assay buffer composition in biochemical assays. 4,29 Under conditions of low ionic strength and in the presence of magnesium, ternary complex formation (ligand, receptor, and G-protein) can be promoted. The inclusion of saturating concentrations of guanine nucleotides can disrupt the ternary complex and cause a right-shift in agonist affinity. We sought to determine the sensitivity of several agonists to guanine nucleotides in the radiometric and FA-binding assays. Unlabeled GTPγS had little effect on the affinities of the partial agonists pilocarpine or McN-A-343 in either the radioligand-binding assay or the FA assay ( Table 2 ). For the full agonists acetylcholine and carbachol, inclusion of GTPγS resulted in a very small rightward shift of ∼2.2–3.3-fold for the average K i values determined via radioligand binding, and ∼1.8–2.2-fold in the FA assay ( Table 2 ).
Pharmacological Profile of M1 Agonists in the Absence or Presence of 5 μM GTPγS Using a Radioligand Filter-Binding Assay and Fluorescence Anisotropy Assay
K i and IC50 values (in μM) represent the mean ± SEM resulting from 2 to 3 experiments.
Monitoring Allosteric Ligand Binding by Fluorescence Anisotropy
The conformational change that results from an allosteric compound binding to a GPCR can affect the association and/or dissociation rates of an orthosteric ligand. 4 It has been previously established using kinetic radioligand-binding studies that the dissociation rate of [ 3 H] NMS 30,31 or [ 3 H] pirenzepine 32 from the orthosteric site of M1 can be decreased by gallamine, via binding to an allosteric site on M1. We sought to determine if the dissociation of BODIPY FL pirenzepine could be measured using FA, and if the presence of gallamine would slow the observed dissociation of BODIPY FL pirenzepine from the M1 receptor. BODIPY FL pirenzepine was allowed to equilibrate with M1 membranes prior to the addition of atropine, atropine plus 0.1 mM gallamine, or atropine plus 1 mM gallamine. The dissociation that occurred over time could be fit with a mono-exponential curve ( Fig. 4 ). The presence of increasing gallamine concentrations slowed the dissociation of BODIPY FL pirenzpine producing K off (average ± SEM) values of 5.0 ± 0.35 × 10⁻⁴ s−1 for atropine alone, 3.7 ± 0.01 × 10⁻⁴ s−1 for atropine plus 0.1 mM gallamine, and 2.1 ± 0.08 × 10⁻⁴ s−1 for atropine plus 1 mM gallamine. Our data is consistent with early work that indicated at least 0.1 mM gallamine was required to alter the dissociation of [ 3 H] pirenzepine from M1 MP. 32

Effect of gallamine on the dissociation of BODIPY FL pirenzepine from M1 MPs monitored by fluorescence anisotropy (FA). Anisotropy of BODIPY FL pirenzepine (2 nM) in the presence of 1 μM atropine (▪), 1 μM atropine plus 0.1 mM gallamine (△), or 1 μM atropine plus 1 mM gallamine (▼) were monitored every 3 min. Anisotropy values were converted to F SB as described in the Materials and Methods. The lines represent a mono-exponential fit of the data, and the inset is a plot of the data using a logarithmic scale.
Discussion
The interaction between a ligand and a GPCR is characterized by the affinity, or strength of the binding interaction, and the efficacy, or physiologic response. 3,29 Numerous fluorescent technologies have been developed to measure the efficacy at different points along the signal transduction pathway; these assays are often the first choice for high-throughput screening (HTS) in the search for new chemical entities (NCEs) that bind and modulate GPCR function. 33 Determining affinity values for NCEs, following initial HTS library screening, is a very important part of a medicinal chemistry effort. Affinity measurements for GPCRs have often been made using radioligand-binding techniques, as few fluorescent tracers and binding assays have been developed to quantify ligand affinity for GPCRs. Our goal was to develop a homogeneous fluorescent-binding assay to quantify orthosteric interactions with the muscarinic M1 GPCR using a cell line that had been previously developed for HTS efficacy measurements. In addition, as allosteric ligands of the M1 GPCR have been reported to modulate radioligand binding at the M1 orthosteric ligand site, we sought to determine if this fluorescent-binding assay could detect allosteric ligand binding to the M1 GPCR. The product of this work would allow for a workflow in which an HTS functional assay can first be performed, and then detailed secondary follow-up analysis on ligand binding or G-protein activation could be performed using membranes from the same cells used in the HTS assay.
Using a stable cell line expressing M1, we produced membranes with an average receptor density of 5 pmol/mg and developed a homogeneous FA assay that produced Z′ value >0.5 in a 384-well plate format. The IC50 values of reference compounds determined via the competitive FA assay were in excellent agreement with K i values obtained from a competitive filter-based radioligand-binding assay using the same M1 membranes. Recently, a live-cell-binding assay has been reported that utilized a fluorescent telenzepine to measure binding to cells expressing M1 receptor. 34 This assay measured the fluorescence of cell-bound Cy3B-telenzepine with an Isocyte™ laser platform. For the compounds that were tested in both the live-cell-binding assay and the FA assay, there was very good agreement in IC50 values. A lower limit to the accuracy of affinities measured in the FA assay compared to the radioligand-binding assay was observed near 1 nM. Atropine had a K i of 0.40 nM in a radioligand-binding assay, but an IC50 of 3.85 nM in the FA assay. The IC50 value determined in an FA experiment is dependent on the concentration of receptor used in the assay. 35 For example, by increasing the concentration of receptor in a competitive FA-binding experiment, the measured IC50 values will increase. The low nanomolar M1 receptor concentration present in these FA assays sets a lower limit for IC50 determination that is greater than the sub-nanomolar K i of atropine. By lowering the receptor concentration in FA assays, the dynamic range or assay window will also be lowered. 35 Therefore, the assay window and Z′ values are important factors in determining the lower amount of receptor concentration to use in an anisotropy assay. It has previously been reported that expression of at least 1 pmol/mg for a GPCR is required to develop a robust FP/anisotropy assay. 7 The reason for this being that the presence of membrane components contribute to increased light scattering and/or nonspecific binding of the tracer resulting in decreased assay window. Due to the effect of light scatter, the quality of the MP is also critical to generating a robust assay when using preparations with low receptor content.
We observed a decrease in the fluorescence emission for BODIPY FL pirenzepine when bound to M1 membranes. It is believed that the orthosteric ligand-binding pocket for the muscarinic receptors lies deep within its transmembrane core. 13 Therefore, the quenching of the BODIPY FL fluophore may be due to a change in the immediate environment of the fluorophore when it is bound to the receptor vs. when the BODIPY FL pirenzepine is unbound and free in the aqueous assay buffer. To account for this change in fluorescence intensity we converted the anisotropy values to F SB values, as described in the Materials and Methods, and present both sets of data. The IC50 values determined from anisotropy or F SB competitive ligand-binding plots were within 3-fold of each other. Excellent correlation was achieved between radioligand determined K i values and IC50 values obtained from either anisotropy or F SB-derived plots (R 2 = 0.98). As a result of these findings, the change in fluorescence intensity of BODIPY FL pirenzepine did not impact the ability of this fluorescence-binding method to serve as an alternative to a competitive radioligand-binding approach.
The conformational change that results from an allosteric compound binding to a GPCR can affect the association and/or dissociation rates of an orthosteric ligand. 4 Radioligand-binding assays are one method by which allosteric interactions can be detected. 4 We were able to configure the muscarinic M1 FA assay to monitor in real time the dissociation of the BODIPY FL pirenzepine and its modulation by the allosteric ligand gallamine. We demonstrated that the dissociation of BODIPY FL pirenzepine, like that of [ 3 H] pirenzepine, 32 is slowed by the presence of high concentrations of gallamine. Taken together, the M1 FA assay is a suitable replacement for traditional radioligand-binding assays as it eliminates radioactivity while allowing investigation of orthosteric or allosteric muscarinic M1-binding potential in a homogeneous 384-well plate format.
When an agonist binds to the orthosteric site of a GPCR, a receptor conformation is stabilized that possesses higher affinity for the heterotrimeric G-protein, thereby promoting the coupling between the receptor and G-protein. The binding of GTP to the G-protein results in a conformational change that negatively affects the ability of the receptor to bind the G-protein. As a result, the presence of GTP or nonhydrolyzable forms of GTP in a biochemical assay can cause a right-shift in the binding affinity of an agonist for a GPCR. 4,29 The GTP-shift has been used as a measure of relative efficacy for a series of ligands within a given assay system. 29 Thus, larger GTP-shifts would be expected for agonists compared to partial agonists. However, GTP-shifts have not been applicable to all GPCR MPs. 29 For muscarinic M1, one study found a guanine nucleotide-induced shift in affinity for several full and partial agonists, 28 while another study found M1 receptors to be resistant to GTP-induced affinity shifts. 36 We found only small GTPγS-induced shifts for 2 full agonists but none for parital agonists in both the radioligand-binding assay and the FA assay. In a recent study using a live-cell M1 fluorescent-binding assay, the IC50 values obtained for antagonists were not substantially different from IC50 values obtained using a radioligand-binding assay that employed membranes prepared from the same M1 expressing cell line. 34 However, the IC50 value for the agonist Oxotremorine was right-shifted in the membrane-based binding assay (47,500 nM) compared to the IC50 value obtained in live-cell-binding assay (2,171 nM). The authors suggested that one explanation for this difference could be that the high-affinity G-protein-coupled state may be more intact in the live cells compared to their MPs.
In conclusion, we developed a homogeneous biochemical FA assay for the muscarinic M1 receptor using membranes derived from a cell line optimized for high-throughput functional assays and a fluorescent pirenzepine analog. The cell line expressed native/nonmodified human muscarinic M1 receptor at 5 pmol/mg of MP. The FA assay can quantify orthosteric ligand affinity as well as dissociation rates modulated by allosteric ligands. A lower limit to the affinity measurements obtained by the FA assay was found to be ∼4–5 nM. However, the ligand affinities determined via the FA assay were well-correlated with the K i values obtained using a filter-based radioligand method and these values spanned 4 orders of magnitude. As the FA assay required less labor and eliminated the need for radioligand disposal, it can serve as an alternative for radioligand-based assays.
Footnotes
Acknowledgment
We would like to kindly thank Rica Bruinsma and Megan Jensen for preparation of M1 membranes.
Author Disclosure Statement
No competing financial interests exist.