
Abstract
Microfluidic methods for cellular studies can significantly reduce costs due to reduced reagent and biological specimen requirements compared with many traditional culture techniques. However, current types of readouts are limited and this lack of suitable readouts for microfluidic cultures has significantly hindered the application of microfluidics for cell-based assays. The In-Cell Western (ICW) technique uses quantitative immunocytochemistry and a laser scanner to provide an in situ measure of protein quantities in cells grown in microfluidic channels of arbitrary geometries. The use of ICWs in microfluidic channels was validated by a detailed comparison with current macroscale methods and shown to have excellent correlation. Transforming growth factor-β–induced epithelial-to-mesenchymal transition of an epithelial cell line was used as an example for further validation of the technique as a readout for soluble-factor-based assays performed in high-throughput microfluidic channels. The use of passive pumping for sample delivery and laser scanning for analysis opens the door to high-throughput quantitative microfluidic cell-based assays that integrate seamlessly with existing high-throughput infrastructure.
Introduction
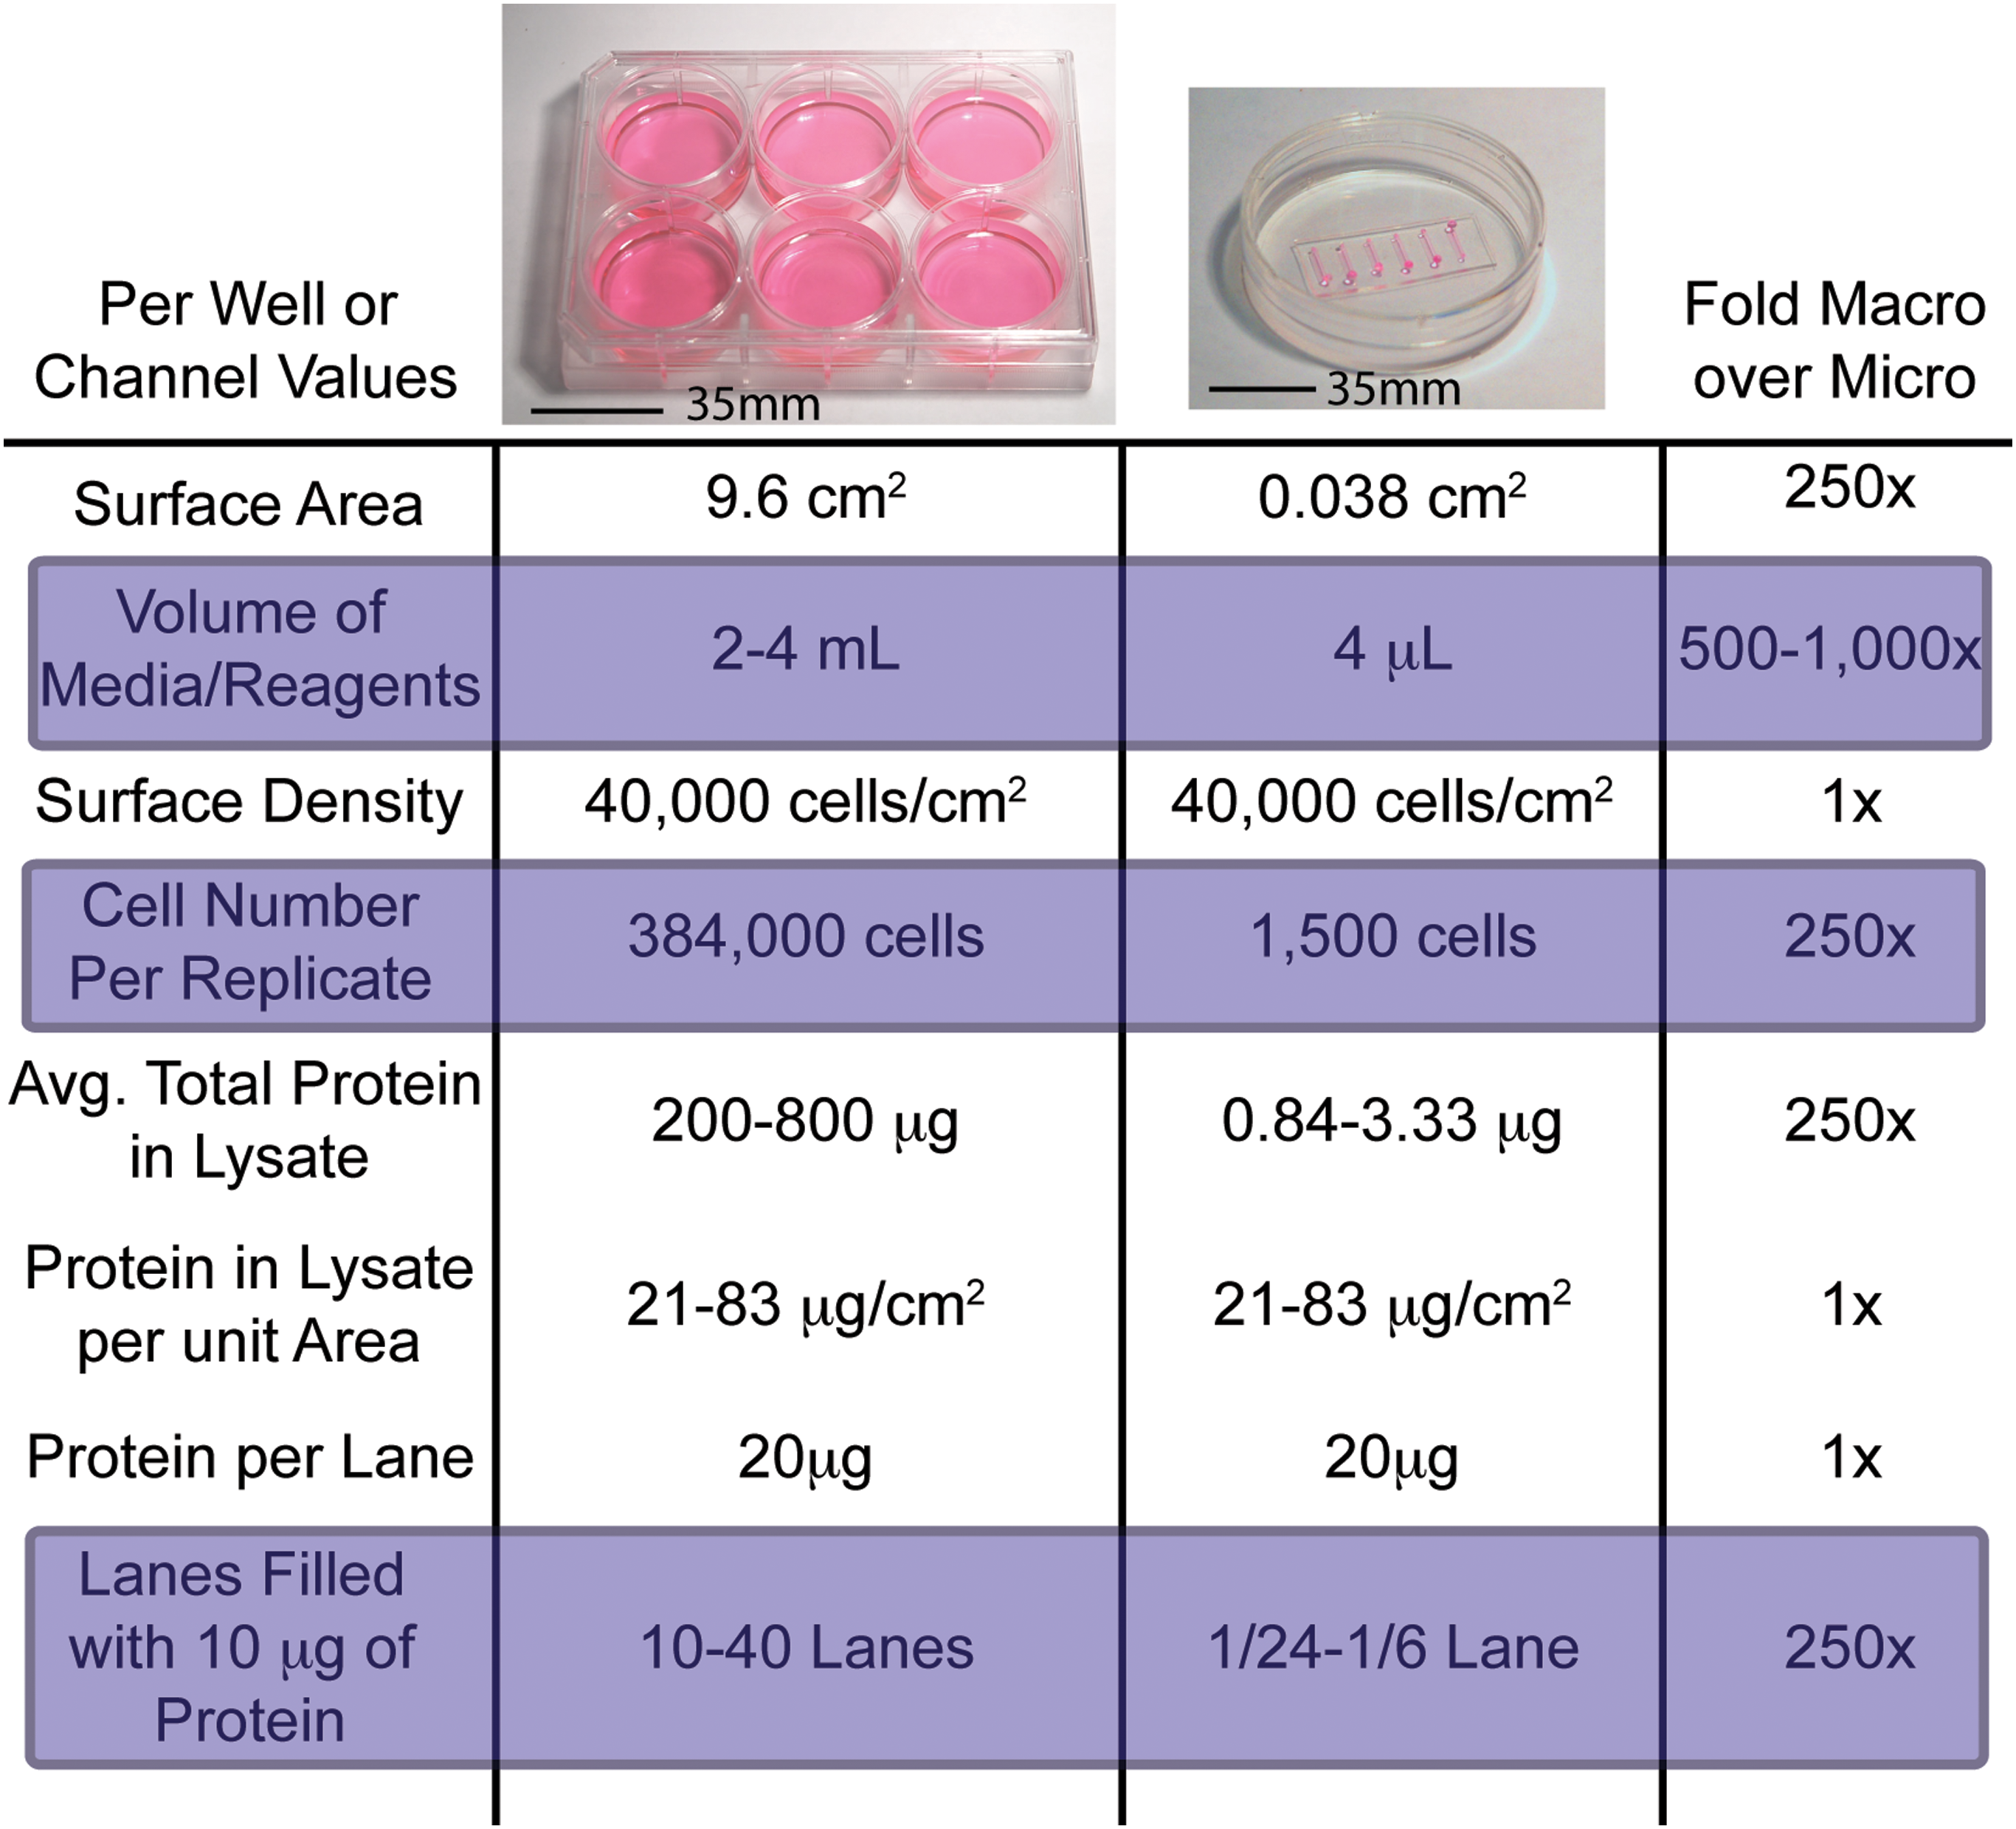
Calculations relating cultures in 6-well plates to those in microchannels. Because surface areas and medium volumes in microchannels are significantly smaller than those in 6-well plates, for the same cell surface density, fewer cells per independent environmental condition are required per replicate in microchannels. However, with cells seeded at the same surface densities in 6-well plates or in microchannels, sufficient lysate can be obtained in a single well of a 6-well plate for 10–40 lanes of a gel, whereas microchannels will provide only up to 1/6 the amount needed for 1 lane of a gel for a Western blot. Although the reduction in sample sizes is a strength of microfluidic cultures, such small samples make many traditional readouts nearly impossible. Color images available online at
While the designs and functionalities of microfluidic devices are diverse, methods for analysis of cellular responses to microenvironments and experimental conditions are not as numerous. One issue that prevents microfluidic assays from being integrated as a tool for in vitro assays, which this article aims to address, is the lack of simple, quantitative readouts. 9 Staining for viability using dyes such as calcein AM/propidium iodide or trypan blue is common, but requires to be analyzed manually or via image processing. 10 –14 Similarly, markers of differentiation or other immunocytochemistry (ICC) methods must be analyzed manually, frame by frame (or slice by slice in 3D cultures) via microscopy. 11,15 These readouts, when analyzed manually, are subject to experimenter bias in choosing a representative field, threshold values, or determining what is positive and what is negative staining for a protein of interest; they are only applicable to a small subset of experiments in which viability or the complete absence or presence of a specific protein is a useful readout. While some degree of experimenter bias is removed when automated microscopy image-processing methods are used, they too have significant caveats and limitations (e.g., inherent properties of the optics, ambient light conditions leading to nonuniformity of the excitation intensity within a single field of cells or between images, and inaccuracies in determining the edge of individual cells). 14 Using a plate reader to determine cell numbers in channels enables improved automation, reduced experimenter bias, and the ability to assay the entire population rather than just a few representative images. 16 However, this method requires specific channel geometries, limiting the types of designs that can be analyzed this way.
Microfluidic culture systems often require extensive specialized equipment for fluid handling such as syringe pumps or fluidic controllers connected to the devices via tubing. 6,17 More simply designed microfluidic culture devices that integrate with current biology lab infrastructure (such as single or multichannel pipettes, or automated liquid handlers [ALHs]) and use more accessible supplies (such as tissue culture polystyrene substrates, off-the-shelf cell culture, and immunofluorescence reagents) are more accessible to a wider community of users. 18 Integration of these devices with current liquid-handling systems could allow for rapid, high-throughput cell-based assays to be performed with the benefits of low volumes and small total sample size. However, the traditional techniques used for quantitative analysis in macroscale cultures require significantly larger samples than typically found in microfluidic cultures (Fig. 1).
Immunostaining techniques such as Western blotting are common practice in traditional biology laboratories, but the amount of cell lysate obtained to perform a typical assay is 250-fold more than a microfluidic culture normally provides (Fig. 1). Even if only 1 lane of a gel is filled with lysate from 1 microfluidic channel, at least 6 times more cell lysate would be required to put the comparable amount of protein per lane of a gel as typically done. The applicability of microfluidics for Western blotting becomes even worse for cell types that produce relatively little protein per cell, or if the protein of interest is particularly rare and requires more protein per lane to be loaded to detect it (e.g., 100 μg + of total protein per lane). While low cell numbers preclude the possibility of performing traditional Western blots easily and efficiently from microfluidic cultures, they make performing analysis in situ beneficial. Additionally, because microfluidic cultures allow for more replicates or more conditions to be tested with the same cell sample, Western blotting techniques are not as amenable to these high-throughput analyses as an in situ–type assay would be.
Recently, techniques for performing In-Cell Westerns (ICWs) using a laser scanner or plate reader have been applied to a variety of macroscale analyses. 19 –21 To perform an ICW, cells are grown in monolayer cultures using typical tissue culture protocols and then fixed and stained just as for ICC using fluorescent secondary antibodies. Using commercially available laser scanners, the total fluorescent signal from a well of a 96-well plate is determined and normalized to a loading control such as β-actin or DNA content. With the appropriate controls needed to correct for issues like background fluorescence, a quantitative measurement of the changes in relative levels of protein expression between conditions can be determined. This technique does not rely on obtaining and processing sufficient amounts of cell lysate or performing gel electrophoresis and blotting procedures like traditional gel-based Westerns. Although it does not typically provide resolution sufficient to detect intracellular localization of proteins of interest, it is not subject to the level of experimenter bias that occurs when using microscopy-based ICC methods. The data presented here employ infrared fluorophore-labeled secondary antibodies, which reduces the limitations due to autofluorescence (from cells or polymers present), and also allows for integration with cells labeled with fluorophores that excite/emit in the visible portion of the spectrum (such as green fluorescent protein/yellow fluorescent protein). Also, this type of readout lends itself to automation and high-throughput analyses well, providing a method to perform many quantitative protein analysis assays at once, in a much more user-friendly manner.
To validate the ICW technique in microfluidic cultures, a well-established cellular response was chosen to illustrate the technique and determine the feasibility of integrating it with high-throughput microfluidic channels. Epithelial-to-mesenchymal transition (EMT) is a transdifferentiation process involving a variety of short- and long-term cellular responses. 22 –25 Mouse mammary epithelial cells undergo this transition in response to transforming growth factor-beta (TGF-β), and the responses of these cells to this growth factor have been studied for over a decade. 26 Specifically, the normal murine mammary gland epithelial cells' (NMuMGs) cell line has been shown to respond to TGF-β and undergo EMT in vitro. 27 The characteristic changes that occur during this transition include a growth inhibitory effect along with changes in morphology and gene expression. These cells typically have cobblestone morphology, express and maintain large amounts of E-cadherin on their surfaces, and lack N-cadherin. These characteristics change to a long, motile fibroblastic morphology, with a loss of E-cadherin and gain of N-cadherin after EMT occurs. Distinct actin stress fibers begin to form in the transformed cells as well. The changes in expression of E- and N-cadherin in response to TGF-β were used to validate the ICW technique.
Materials and Methods
Microfluidic Device Fabrication
Microfluidic devices were fabricated using standard multilayer soft lithography and rapid prototyping techniques. 28,29 In brief, SU-8 100 photoresist (Microchem) was spun as a 250 μm layer on a silicon wafer and exposed to UV light for the channel layer. A second 250 μm layer was spun and exposed for the port layer. The wafer was developed and poly(dimethylsiloxane) (PDMS) was cured under compression over the resulting master mold. Each array contained 192 channels with dimensions 5.75 L × 0.75 W × 0.25 H (mm). Ports were spaced 4.5 mm center to center to facilitate integration with high-throughput liquid handling.
Cell Culture and Seeding
Cells used were NMuMGs, a cell line from ATCC grown in high-glucose Dulbecco's modified Eagle's medium (Gibco) with 10% fetal bovine serum (BioWhitakker), with the addition of 10 μg/mL insulin (Sigma-Aldrich). Cells were passaged by washing with phosphate-buffered saline (PBS) without calcium and magnesium briefly, and then incubated at 37°C with trypsin (Gibco); the resulting suspension was resuspended in the medium to the desired concentration. New flasks were seeded at a surface density of 40,000 cells/cm2 and a volume density of 200,000 cells/mL, and passaged after ∼2 days when 70%–80% confluent.
To seed cells into 96-well plate wells and microchannels, the medium was first added to both (2 μL to channels and 184 μL into wells) and put into the incubator while the cells were being prepared. When the desired cell suspension concentrations were obtained, 2 μL of cell suspension was added to the microchannels, and 16 μL added to the corresponding wells giving equal surface densities, but 6.25 times higher volume densities in microcultures than macrocultures. These were then placed in a humidified incubator at 37°C and 5% CO2 either as is (in the case of the 96-well plate), or in a tray containing PBS for microcultures to minimize evaporation and osmolarity changes.
For linearity assays, the number of cells in the channels or wells must be known, so cells were diluted, seeded, and fixed after attachment, but before significant proliferation. Serial dilutions of cell suspension were seeded into both 96-well plates and microchannels (at least 4 wells per dilution and at least 6 channels per dilution) from the same stock solution. Cells were fixed at 24 h after seeding to ensure attachment (attachment occurs between 12 and 16 h postseeding in microchannels, and somewhat faster in 96-well plates).
Fixation and Staining
Cells were washed once with PBS quickly, fixed with 4% paraformaldehyde in PBS, and incubated on ice for 20 min. Cells were then washed with 3 sequential washes with 0.1% Triton X-100 in PBS for 7 min each wash at room temperature. Blocking buffer (Licor Biosciences; #927-40000) was then added for 60 min at room temperature. The primary antibodies were then diluted into blocking buffer, added to the channels/wells, and incubated overnight at 4°C. This solution was then washed out with PBS with 0.1% Tween-20 twice, and the secondary antibodies diluted into blocking buffer were added for 1 h at room temperature. The channels/wells were then washed with PBS once, and then To-Pro-3 (Molecular Probes) was added at 1:1,000 in PBS, and allowed to incubate at room temperature for 10 min (4′,6-diamidino-2-phenylindole was used for ICC with the same dilution and incubation, from Molecular Probes). Cells were washed twice with PBS, all liquid was removed, and the cells were allowed to dry. PDMS channel tops were removed before scanning.
TGF-β Exposure
Assays of the response of NMuMGs to TGF-β were performed by seeding cells in both macro- and microscale cultures at 40,000 cells/cm2. Cells will be allowed to plate for 24 h, and the medium was changed to the TGF-β-containing medium or control medium (TGF-β from R&D Systems; #240-B). After 48 h of exposure to 100 pM TGF-β or control medium (with a medium change at 24 h for microscale cultures), cells were fixed and stained for E- and N-cadherin for ICW analysis, or imaged using phase-contrast microscopy (for morphology) and fluorescence microscopy (for actin staining and E- and N-cadherin ICC). For the ALH experiments, TGF-β was added at a range of concentrations from 0 to 200 pM and fixed and stained after 48 h of exposure.
Western Blotting
Cells were seeded into 60 mm dishes at 40,000 cells/cm2 and allowed to plate for 24 h. The medium was exchanged at 24 h to either control or 100 pM TGF-β containing medium. After 48 h of exposure, cells were washed briefly with PBS on ice and subsequently lysed with radio immunoprecipitation assay buffer containing a protease inhibitor cocktail (Roche; Complete Mini tablets, # 11836153001). Lysates were sonicated briefly, sodium dodecyl sulfate tris-glycine sample buffer (Invitrogen) and 2% β-mercaptoethanol (Invitrogen) were added, and the samples were boiled for 5 min and centrifuged, and the supernatant was removed. The samples were run on 8% tris-glycine gels (Invitrogen), with molecular weight markers for IR detection (Licor Biosciences; #928-40000). After blocking (blocking buffer from Licor) the blots were incubated overnight at 4°C with primary antibodies to E- (1:2,500) or N-cadherin (1:1,250), and a primary antibody to β-actin (1:1,000). Blots were then washed and incubated with 2 secondary antibodies, 1 for mouse with the 800CW IR dye conjugation (to detect E- or N-cadherin) and 1 for rabbit with the 680 IR dye conjugation (to detect actin) both at 1:15,000. The blots were washed again and, after drying, were scanned on an IR scanner (the Odyssey; Licor Biosciences).
Antibodies
The primary antibody for β-actin was obtained from Cell Signaling (#4970) and used at a 1:1,000 dilution in Western blots and at 1:100 for ICWs. E- (#610182) and N-cadherin (#610921) primaries were obtained from Transduction Labs and were used at 1:1,000 dilution in Western blots and at 1:250 for ICW. A second E-cadherin was obtained from Cell Signaling and used only for the Western blot shown in the supplement, not for any ICC or ICWs (#3195). Secondary antibodies were from Rockland, Inc. (#610-131-003, goat anti-mouse, 800CW IR dye, and #611-131-122 Goat anti Rabbit, 800CW IR Dye conjugated), or Licor Biosciences (#611-130-122-IR Dye 700DX conjugated goat anti-rabbit).
Adaptation of Cell Seeding and Staining Protocols to the High-Throughput Microfluidic Array
Microchannel arrays were addressed via a single-channel ALH (223 Sample Changer and 402 syringe pump with a 250 μL syringe; Gilson). All fluidic manipulation from cell addition and medium replenishment, to fixing and staining (using the same reagents and concentrations as described above) was carried out using passive pumping with drops (3–4 μL) dispensed (1–2 μL at a time) from the ALH. Postinput drop dispensing the equivalent amount of fluid was aspirated from the output also via the ALH. Detailed liquid-handling methods and optimization have been presented previously. 17 From cell seeding through ICW analysis very little user interface was required to perform an automated dose response to TGF-β of NMuMG cells to 48 h of various concentrations (0, 0.1, 0.5, 1, 10, 100, 200 pM).
ICW Image Processing
ICWs were performed on a laser scanner (Odyssey; Licor Biosciences) and data were acquired using Odyssey software. Integrated intensities from each IR channel (700 nm for ToPro3-stained nuclear fluorescence and 800 nm for IR Dye–conjugated secondary antibody fluorescence) obtained from no-cell control wells or channels that underwent all steps in the culture and staining protocols except cell seeding were subtracted from all data to adjust for background fluorescence due to incomplete washing or nonspecific staining of the channel or well walls. Secondary antibody staining from the 800 nm channel was normalized to ToPro-3 nuclear staining to control for cell number, thus obtaining the relative protein level per cell. The data were compared with a no-primary antibody control (that underwent all steps in the protocol except the addition of the primary antibody) to ensure sufficient signal above that obtained by nonspecific binding of the secondary antibody to the cells.
Results
Initial validation of the ICW technique in microfluidic channels was performed by comparing results from microchannels using optimized protocols with those found in 96-well plates using established protocols. Subsequently, an application of the ICW technique in microfluidic devices was tested using the well-established readouts resulting from EMT in NMuMGs in cultures of both scales to determine if comparable results could be obtained. The responses in both macro- and microscale cultures were verified via morphology and actin staining in addition to ICWs for E- and N-cadherin after 48 h exposure to 100 pM TGF-β or control medium. These results were then validated by ICC and also via traditional Western blots, and shown to be quantitatively consistent with ICW results for E- and N-cadherin.
To verify that the nuclear staining control for cell number used in ICWs was in fact linear with cell number, cells were seeded at a range of surface densities likely to be found in cultures, fixed, and stained after attachment but before any significant proliferation. Phase-contrast images of the cells before fixation are shown in Figure 2A for NmuMGs, showing the degree of confluence for each density seeded in each culture type (microchannels or 96-well plates). The measured integrated intensity of a channel or well from the nuclear stain was then compared with the cell density seeded, and the linear correlation determined (Fig. 2B) for a range of typical surface densities between 25,000 and 150,000 cells/cm2. Results showed very close linear correlation between cell number and nuclear-integrated intensity for both culture scales, indicating that the nuclear-integrated intensity measured can be used as a measure of cell number regardless of scale.
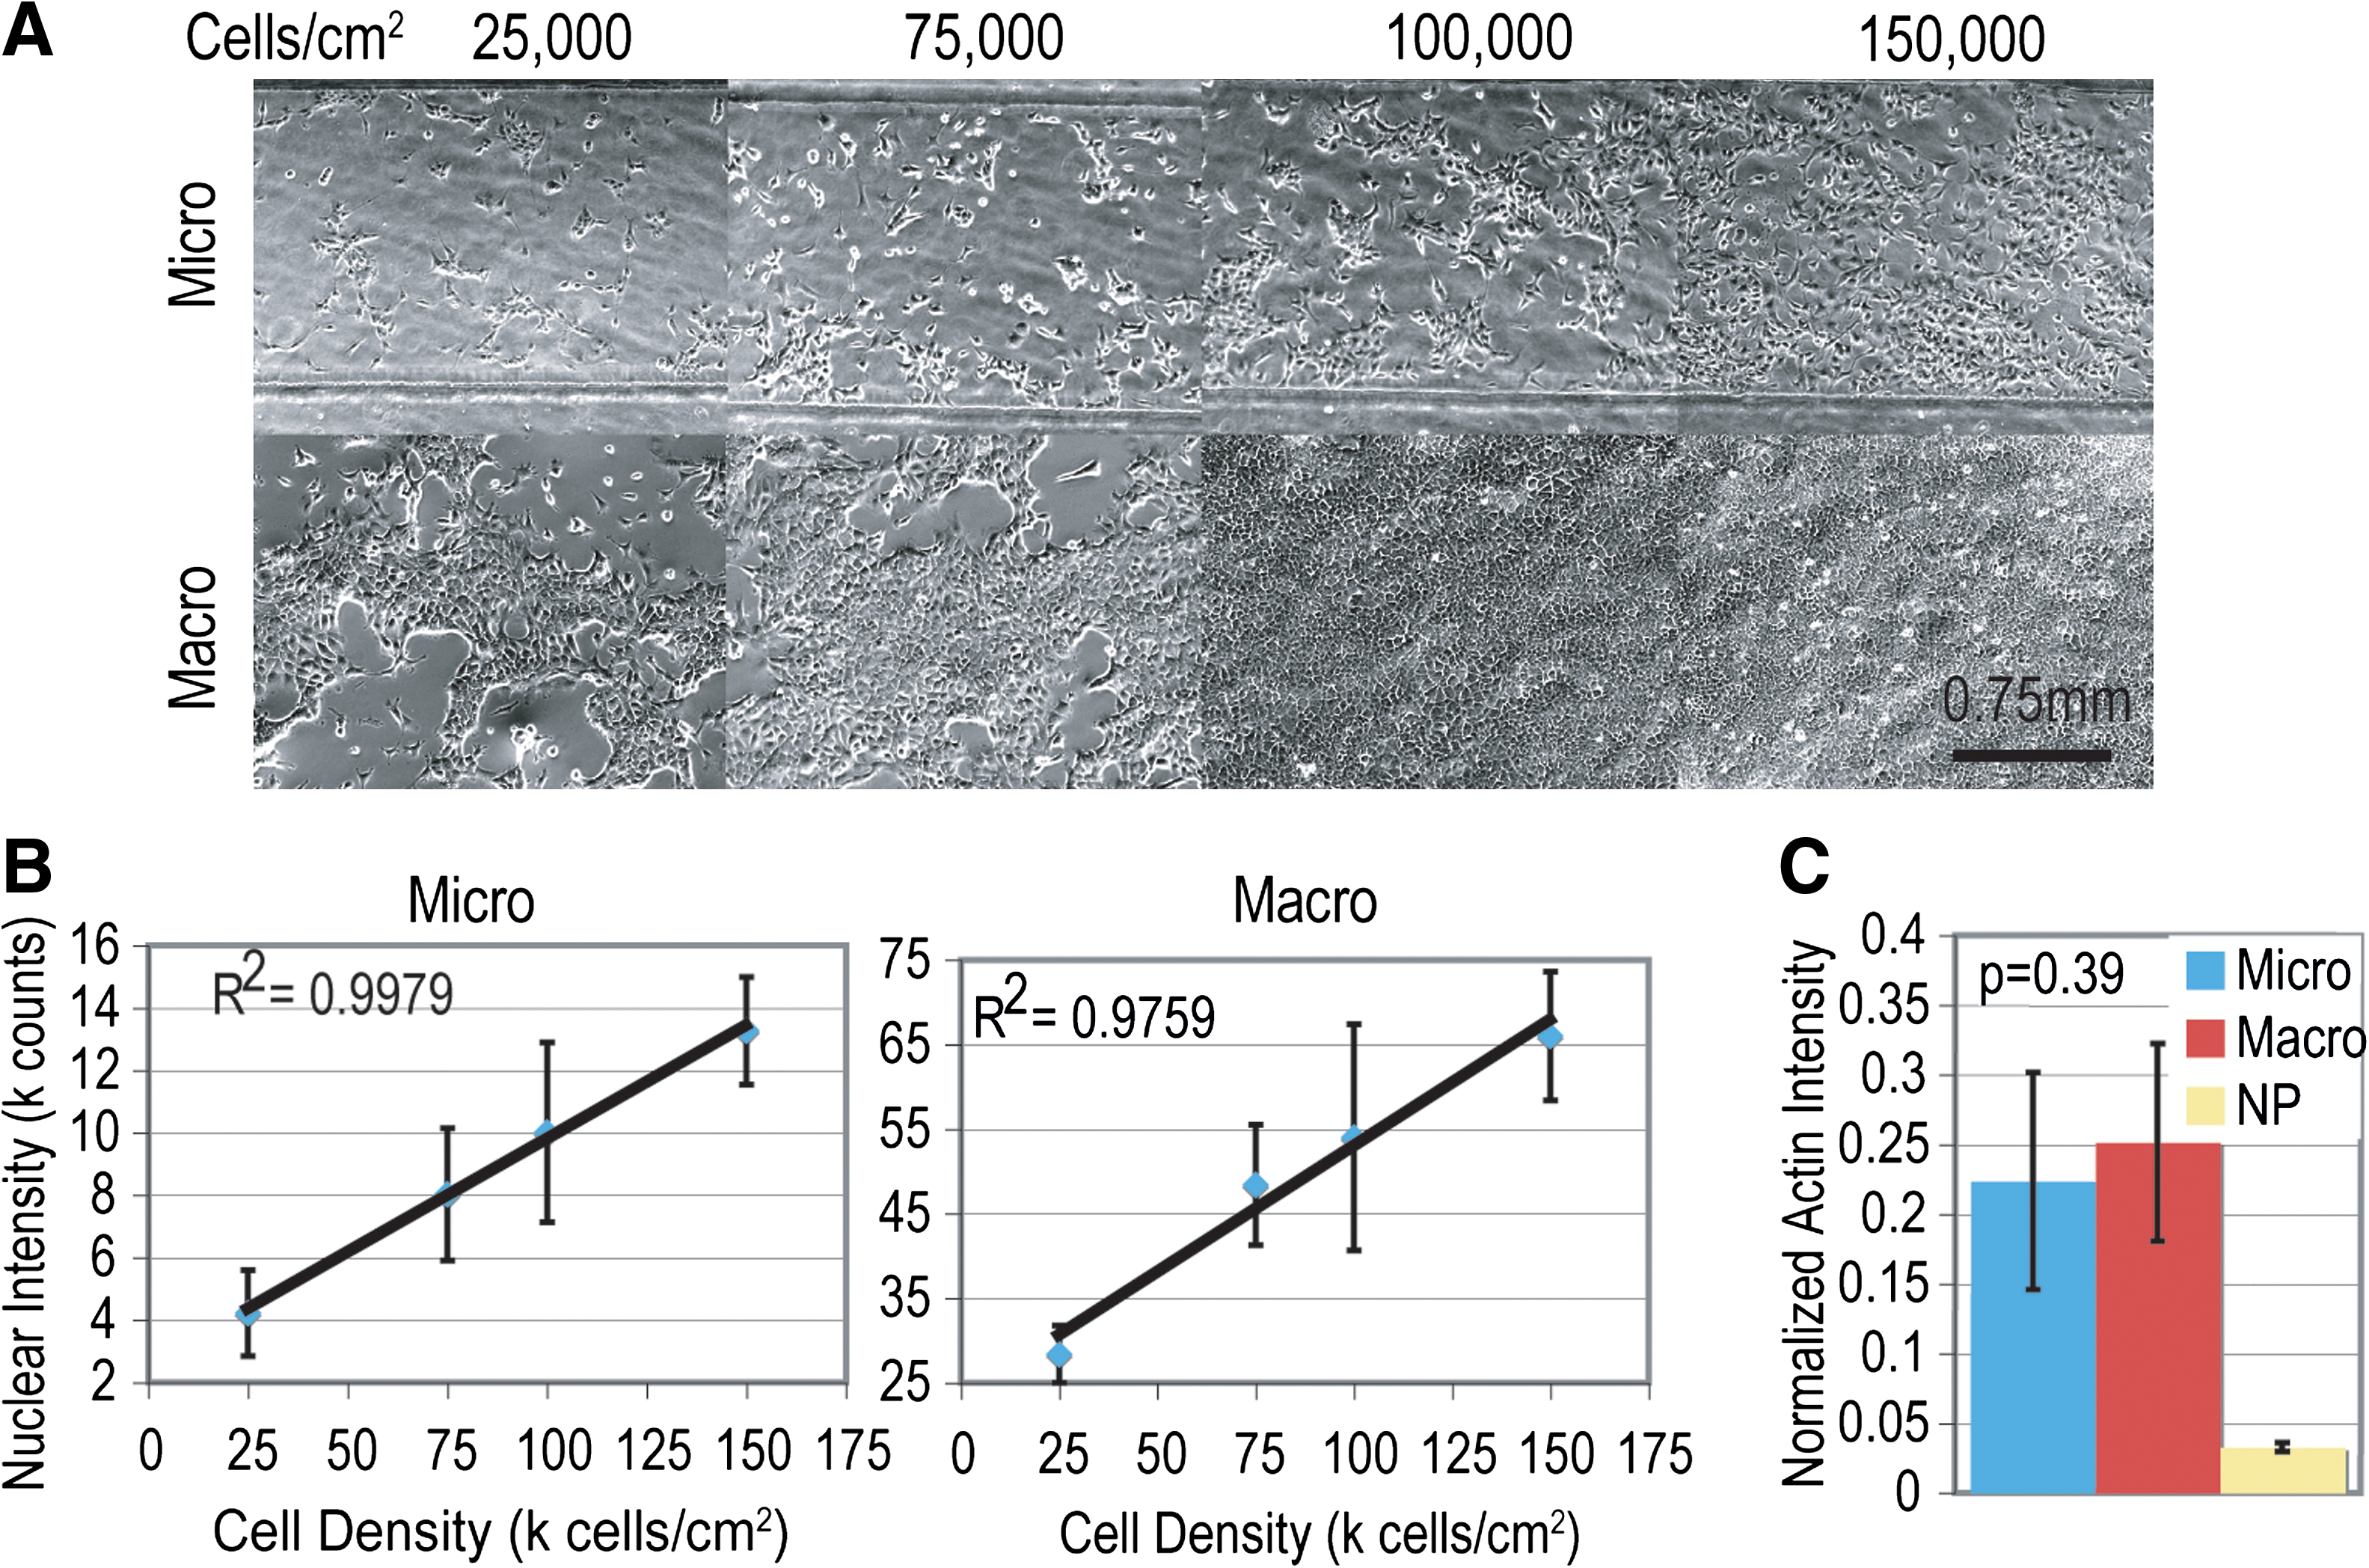
Validation data for NMuMGs in microchannels (micro) and 96-well plates (macro). Phase images of NMuMGs before fixing at a variety of surface densities (
The protocols for performing ICWs have been optimized for use in 96-well plates, but because the volumes used in microchannels are so much lower and have different washing efficiencies, 21 the adaption of the protocols for microchannels must ensure that channels are effectively washed for the readouts to be comparable. Not only does nuclear control staining need to be linear with cell number in cultures of both scales, but also ICC-based results would have to be consistent between them as well. If comparisons are to be made between protein levels in macro- and microscale cultures, then the technique must give the same normalized integrated intensity (normalized to the nuclear intensity, the control for cell number) for a protein that is expressed at the same level in cells in both culture scales (such as actin, a typical loading control in traditional Westerns for these cell types). An ICW for actin was performed to demonstrate that the measured amount of actin per cell is consistent between macro and microscale cultures (Fig. 2C). The data indicate that the normalized actin intensity is in fact the same regardless of culture scale as no significant difference was observed in actin levels (P value of 0.39); thus, normalized integrated intensities determined in either 96-well plates or microchannels can be compared directly.
The morphological responses of NMuMGs to a 48 h exposure to 100 pM TGF-β in microscale cultures were analyzed to ensure that the responses seen in cultures of either scale were similar to those established for macroscale cultures (data not shown). The morphological changes of NMuMGs from the typical cobblestone morphology to elongated fibroblastic morphology along with actin reorganization from mesh-like to stress fibers in microscale cultures were verified via phase microscopy and actin staining.
The success of the ICW technique relies not only upon good antibody specificity but also on the ability of the antibodies to recognize the antigen in the conformation found in fixed and permeabilized cells (nonreduced, nondetergent/heat-denatured conformation, as samples are not boiled with reducing agents and detergents as done in most Western blot protocols, but instead the conformation modified by paraformaldehyde and triton). Recognition of the fixed conformation by the primary antibodies can be verified by ICC as demonstrated in Figure 3A. These images employed the same exposure time and intensity for either treated or untreated conditions, and it can be seen qualitatively that E-cadherin is reduced and N-cadherin is increased in transformed cells as expected. Changes in the levels of a specific protein in response to a positive control treatment known to cause changes in expression or localization (such as TGF-β treatment) can provide an idea of the specificity of the antibody beyond just verification of the expected localization in untreated cells.

ICC and ICWs for E- and N-cadherin in normal murine mammary gland epithelial cells after TGF-β exposure and without (control) in microchannels (micro) and in 96-well plates (macro). Qualitatively, E-cadherin expression is high in control cells and decreases after TGF-β treatment, whereas N-cadherin increases after treatment seen via ICC (
To quantify these changes in E- and N-cadherin expression in NMuMGs after TGF-β exposure, ICWs were performed in both 96-well plates, and microchannels (Fig. 3B). The data shown in Figure 3C indicate that similar magnitude changes occur in E-cadherin regardless of culture scale (1.55-fold decrease in macro, and 1.46-fold decrease in micro), while the increase in N-cadherin in microcultures is nearly half of that seen in macrocultures (0.61 for macro and 0.31 for micro; Fig. 3D). These differences may indicate a difference in sensitivity to TGF-β transformation in cultures of different scales, though the fold reduction in microscale cultures was slightly higher when done in the high-throughput system shown below (0.44-fold change).
Because ICWs do not provide any molecular weight information like a Western blot does, nonspecific staining cannot be eliminated by only analyzing bands of the expected molecular weight. Because of this, the signal that is expected from an ICW would likely be more similar to the total intensity of all the bands in a Western blot than just to the intensity of the specific band of interest. The conformational differences of the proteins in an ICW versus a Western blot (paraformaldehyde fixed vs. reduced and denatured) can affect the specificity of the antibody, which is why antibodies are typically evaluated in specific applications by the manufacturer and rated for those techniques in which they provide accurate results. Despite these differences in conformation, more information regarding the specificity of an antibody can be evaluated using a Western blot. While the Western blot does not necessarily guarantee specificity in ICWs, when combined with manufacturer's specifications, ICC data, and with appropriate controls, this information can be useful in validating the accuracy of an antibody. It is important to note that for any quantitative analysis of proteins using antibodies, these considerations should be taken into account, not only ICWs.
Figure 4 shows Western blots analyzed using the same set of antibodies used in the ICWs and ICC data. With this type of analysis, the normalized intensity from both the specific bands and the total lanes can be obtained (green) and normalized to the normalized intensity of the signal from actin, the loading control (red). The fold change in E- or N-cadherin between untreated (control) and treated cells (100 pM TGF-β for 48 h) was analyzed from both the specific bands (labeled Specific), and also for the total lane (labeled Expected). For both readouts, the ICW fold changes in macroscale ICWs are more similar to the fold change in the expected signals than the specific signals from the Westerns (also performed using macroscale cultures).
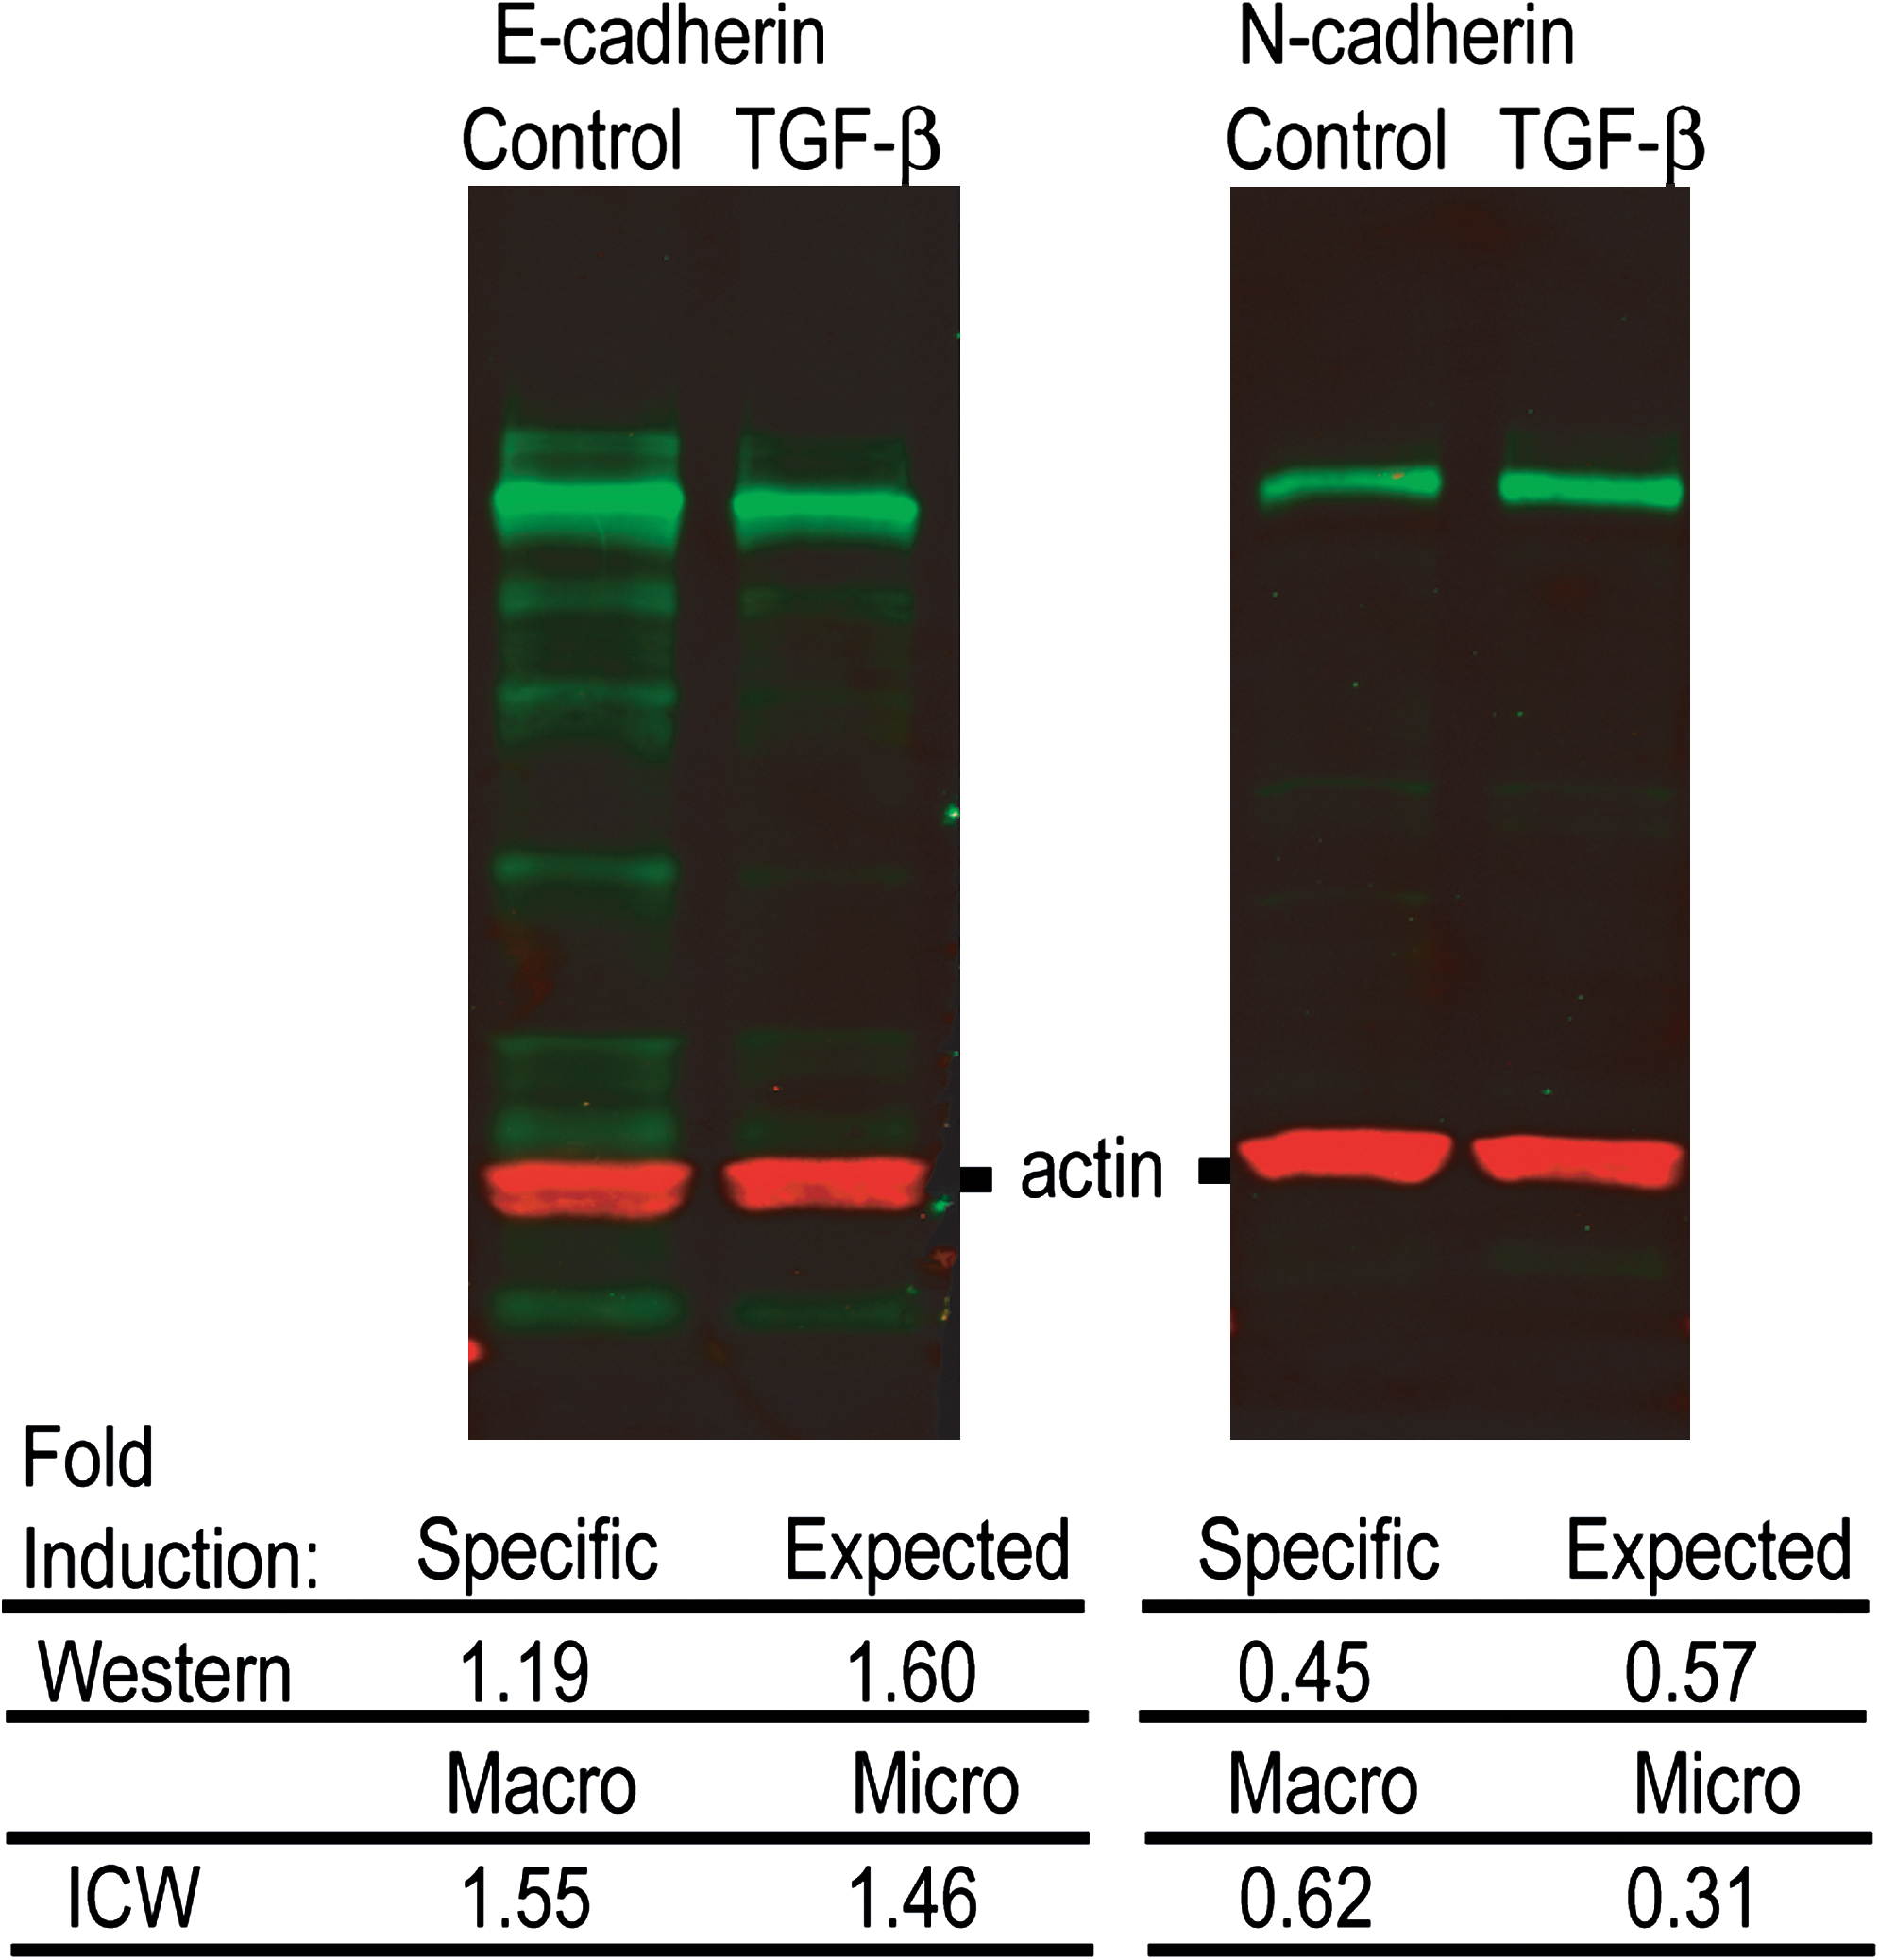
Western blots and quantification for both E- and N-cadherin in control and TGF-β-transformed cells. Red bands are actin loading controls, while green bands are what is detected by the cadherin antibodies (either E- or N-cadherin), contrast has been enhanced to show all staining, including nonspecific staining. Fold inductions (control over TGF-β) were calculated from Western blots either for the specific band corresponding to E- or N-cadherin, or for the entire lane (Expected) along with the ICW results for micro- and macroscale cultures as a comparison. The Macro result for ICWs can be directly compared with the Expected Western blot results, as both are performed on cells grown in a traditional, macroscale culture and thus should respond identically. Differences seen between ICW results in macro- and microscale cultures can be attributed to differences in the culture conditions.
31
ICW, In-Cell Western; TGF-β, transforming growth factor-beta. Color images available online at
Adaptation to a High-Throughput System
The ICW technique for these readouts was evaluated in a high-throughput array of microchannels designed to interface with an ALH. The contents of the microchannels were replaced through a surface-tension-based pumping mechanism called passive pumping, for which only fluid drops on either end of a channel dictate flow (i.e., no syringe pumps or other external pressure sources). 30 Starting with a filled microchannel having a fluid drop on the output (e.g., 4 μL), passive pumping occurs with the addition of a small drop (1–2 μL) of fluid to the input port. The newly added small drop has a higher internal pressure than the preexisting larger output drop and therefore flows to the output replacing the channel volume.
This platform uses an array of 192 microfluidic channels of the same dimensions as those used manually for the previous validation work with the exception of slightly larger output ports. 18 However, all fluid exchanges from cell seeding to final washing after staining are performed via an ALH rather than manual pipetting. The protocols for this setup have been optimized 17 and the results for E- and N-cadherin have been included in Figure 5. Comparable data were obtained with this technique to those obtained manually with microfluidic channels or 96-well plates, which demonstrates the applicability of the technique to this high-throughput platform. This platform allows for automation of pipetting steps using existing liquid-handling equipment, significantly reducing the time spent performing the assay, and reducing the sample sizes via the use of microfluidics. The addition of the ICW technique to the high-throughput microfluidic platform will allow for a wider range of readouts to be studied via a simple-to-analyze method as was done here with the dose response of NMuMGs to TGF-β, showing that the cells respond to doses down to 1 pM.
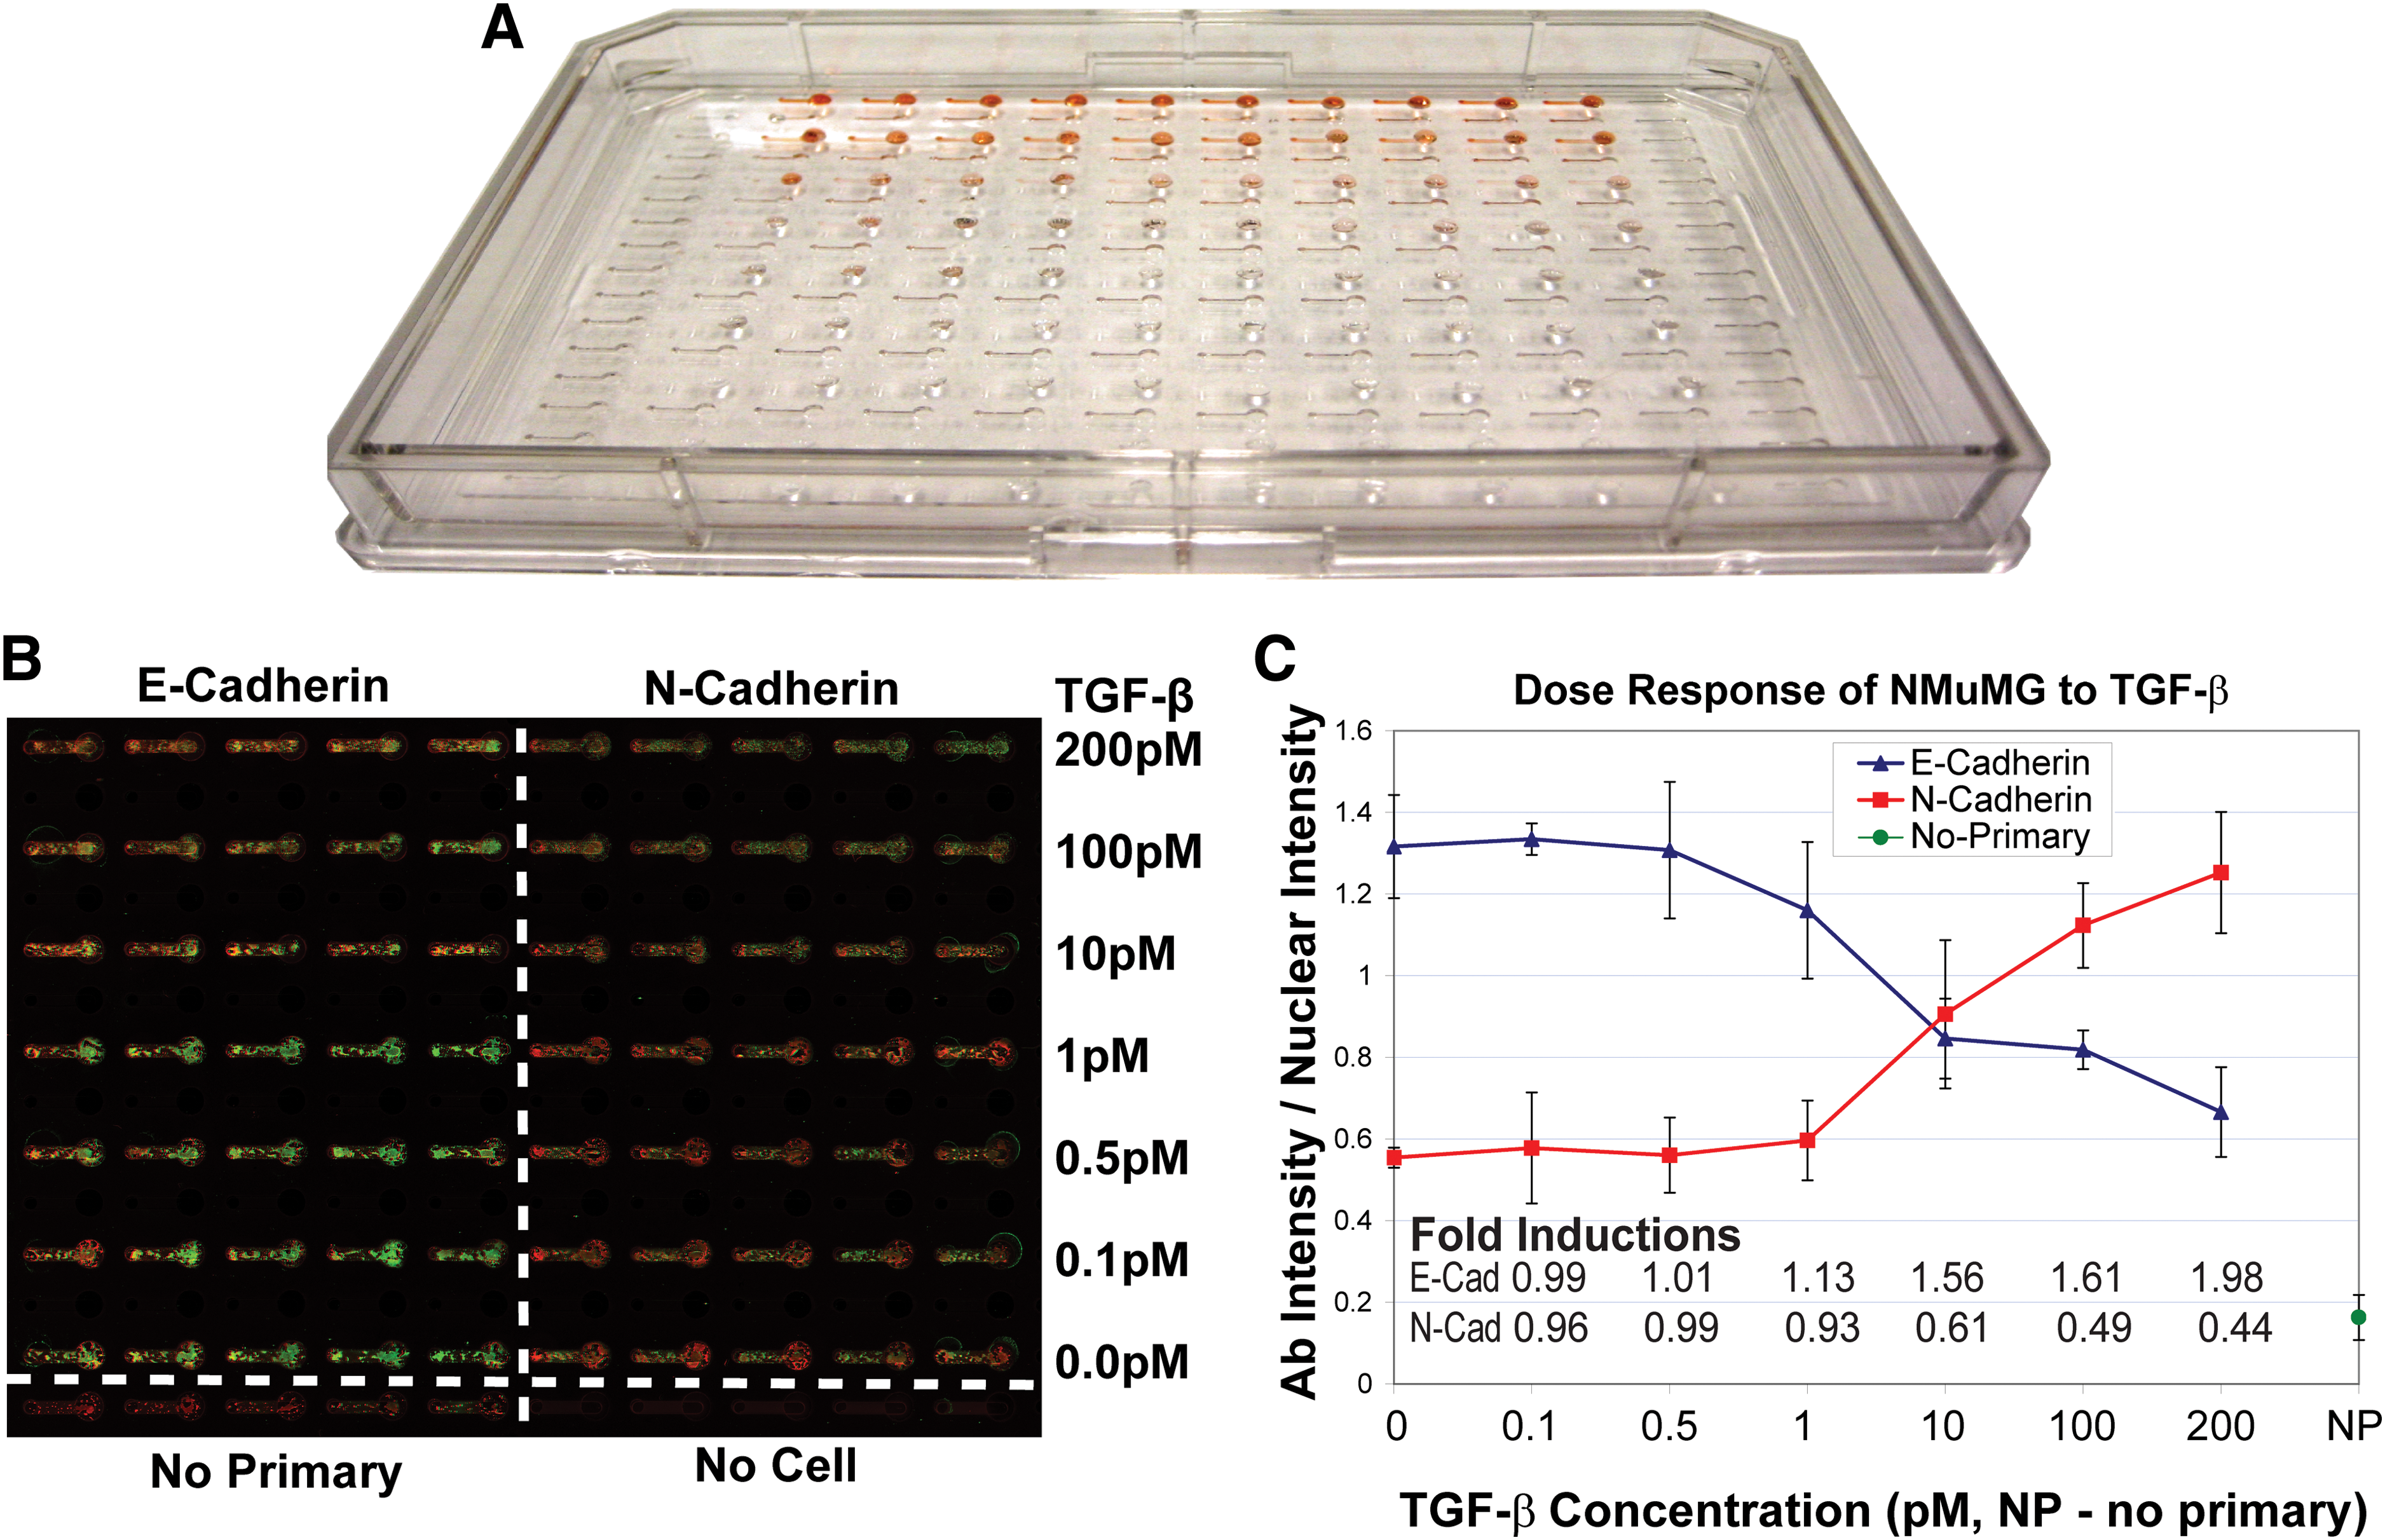
In-Cell Westerns were performed in a high-throughput microfluidic device that integrates with an automated liquid handling system. An example of the device is shown in (
Discussion
While Western blotting cannot be easily adapted to microfluidic cultures (unless large numbers of channels are pooled, or highly overexpressed proteins are of interest), ICW techniques can provide a straightforward means for not only quantifying protein levels, but also doing so in situ. Due to the low reagent volumes in microfluidic cultures, significantly less volume of costly reagents (antibodies and buffers) is required compared with traditional Western blotting, or even macroscale ICW techniques. By doing the assay in situ, less handling and therefore less sample corruption, contamination, and loss occur than using traditional Westerns, and this becomes particularly critical for very small volume samples or low cell numbers.
ICW-based microfluidic assays can be done rapidly due to the relatively short protocols for fixation and staining, and require no other laboratory items (such as gels, buffers, and membranes) than typical ICC reagents and pipettes. Using commercially available laser scanners (often found in many shared laboratory facilities), entire channels with arbitrary geometries can be imaged quickly and analyzed easily. This flexibility could simplify and expand the potential readouts from cocultures of different cell types and cells grown in gradients of soluble factors or in other novel assays performed in microfluidic devices. Using this technique eliminates the need to lyse the cells during which cell types from a coculture 8 may become undesirably pooled, and eliminates the need for flow cytometry to analyze separate populations. A laser scanner also allows entire populations to be assayed rather than the experimenter choosing a representative field for ICC type readouts, and ensures that an accurate, unbiased, quantitative measurement can be taken.
With the ICW technique in hand, the simple microfluidic channels used for this validation study were used with a robotic fluid-handling system to provide a higher throughput expression assay while also reducing reagent costs by 23-fold. Because 8 separate readouts can be performed from the same cell number used in 1 well of a 96-well plate, this microfluidic array can be employed to probe a larger number of replicates or be crucial for rare cell applications where sample size is limited. Additionally the time required by the user to perform the assay is significantly reduced. The entire assay (after the treatment period) from cell prep through analysis takes ∼11 h 45 min with only 15% of that time requiring user interface. Of the hour and 45 min that require user interface, ∼1 h is sample prep, ∼30 min is spent on the equipment (ALH and scanner), while only ∼15 min is spent doing analysis. Previously, before adapting the ICW technique to microfluidics, analysis of the same experimental setup in microdevices performed using automated microscopy and automated image analysis with Image J macros to obtain similar data took ∼20 h with nearly half requiring user interface. Without automated imaging software, this analysis would be prohibitively time consuming (see Table 1 for a summary of assay and analysis run times).
Time (min) Savings to Perform the Automated Epithelial-to-Mesenchymal Transition Assay and Analysis with In-Cell Western
The robot addresses the entire array for a combination of dispensing and aspirating (=90 pipetting steps each). Performing the same tasks by hand pipetting at least doubles the process time with an increased probability of error.
ICW, In-Cell Western.
Integration of current microfluidic culture techniques with existing biological analysis technology will allow to further study the effects of microscale cultures on cellular behavior and widen the available range of cellular readouts for microfluidic biological applications. Currently, many traditional assays require significantly more cell numbers or cell lysate than a typical microfluidic culture device would produce and cannot be easily integrated into microfluidic assays (such as flow cytometry, RT-PCR-based assays, and sequencing). Improving and altering the protocols for other types of readouts to compliment the techniques used for microfluidic assays will be important to better provide accessible and accurate microfluidic versions of existing technology or enable new assays to be performed due to the unique capabilities of microfluidic devices.
Footnotes
Acknowledgments
The authors would like to thank Dr. Michael Hoffmann and Dr. Caroline Alexander and their lab members for their guidance on this project, as well as the MMB lab. Funding sources: D.J.B., National Institutes of Health grants R21CA122672 and K25CA104162, and A.L.P., DOD/BRCP W81XWH-06-1-0487.
Author Disclosure Statement
D.J. Beebe has an ownership interest in Bellbrooks Labs, LLC, which has licensed technology presented in this article.