




Abstract
We have developed a method to measure the amounts of cell surface-expressed membrane proteins with bioluminescence. Dinoflagellate luciferase was expressed on the surface of a mammalian cell as a chimeric fusion protein with a membrane protein of interest. Using a membrane-impermeable substrate to quantify the membrane-displayed luciferase, the expression of the membrane protein on the cell surface was determined. By inclusion of a quenching step for the luminescent activity of luciferase on the cell surface, we were able to monitor the membrane protein expression kinetics by measuring the luminescence recovery from the cell surface after quenching. The reported methods provide a convenient way to monitor the kinetics of expression and transport of membrane proteins to the cell surface. It is applicable to the high-throughput analysis of drugs or drug candidates concerning their effects on membrane protein expression.
Introduction
To study the kinetics of membrane protein expression, one conventional approach is to measure the time of endoplasmic reticulum (ER)-to-Golgi transition by pulse-chase labeling, combined with monitoring any shift in molecular weight resulting from glycosylation, which is thought to be the rate-limiting step. 7 This technique has been useful for studies to determine specific organelle transitions, such as a rate change from ER to Golgi by forward transport signals. 8 However, this pulse-chase labeling method is not applicable for proteins with limited or no glycosylation. Further, membrane proteins undergo a stationary step in their trafficking cascade after exiting trans-Golgi and before cell surface expression. 9 To monitor membrane protein expression kinetics precisely, it is desirable to directly measure the amount of membrane proteins that were newly transported to and expressed on the cell surface.
Sun et al. 10 have developed a new method for monitoring membrane protein expression, a pulse-chase assay measuring function recovery after chemobleaching (FRAC) to probe the transit time of the Kir2.1 potassium channel to the cell surface. They employ a chemical bleaching strategy that irreversibly nullifies targeted cell surface receptors. By monitoring the replenished activity after inactivation, this technology allows for measurement of the time transition of receptor recovery on the cell surface. Hence, they termed this procedure FRAC. The FRAC assay is very sensitive and could be done in a high-throughput manner, but it is applicable only to the ion channel. Many interesting membrane proteins may not have a clearly defined or readily measured activity. Therefore, we develop a more generic method to monitor expression and kinetics of membrane proteins.
As luminescence measurement has high sensitivity, low background, and wide dynamic range, we used this technique to measure membrane protein expression on the cell surface. 11,12 The bioluminescence measurement, by using protein enzymes to catalyze luciferin and emit light, is widely used in assays of biological events, such as reporter gene assays and detection of target molecule localization. 13 –16 Aquorin from jellyfish and luciferase from the firefly, crick beetle, Renilla, and Gaussia princeps are used. Further, luminescence detection protocols are much easier, consisting of live cell washing and addition of substrate, thus enabling higher throughput. The expression of firefly luciferase on the cell surface was reported. 16,17 Luminescence from firefly luciferase on the cell surface was used to measure the local concentration of adenosine 5′-triphosphate (ATP) on the extracellular surface. Santos et al. 18 have successfully captured in vivo imaging of T-cells using a membrane-bound Gaussia princeps luciferase with high sensitivity.
To ensure the measurement of membrane protein expression on a cell membrane, dinoflagellate luciferin is used, a substrate that does not permeate the lipid bilayer or is not absorbed into the cell. 19 We have expressed a luminescent fusion protein containing a dinoflagellate luciferase (DL) fused with the extracellular region of the membrane protein. We have successfully measured membrane protein expression at high sensitivity on the cell surface. By incorporating a step to quench the membrane protein fused to a luminescent protein expressed on the cell membrane, direct measurement of the luminescence activity to monitor proteins that have newly reached the cell surface is possible. Sulfo-NHS-acetate, which chemically and specifically modifies lysine residues, is used as a quenching agent to inactivate luminescent activity of the surfaced proteins. 20 Because sulfo-NHS-acetate is water soluble, it does not penetrate the membrane and does not affect other proteins in the cytoplasm. Thus, the reported system is effective for monitoring the intracellular transport process of a membrane protein to the cell surface. With this system, it becomes possible to simply, rapidly, and quantitatively measure the membrane protein expression process on a cell membrane with high sensitivity, to which application of a high-throughput method was previously impossible.
Materials and Methods
Construction of Expression Vectors
Expression vectors for DL (Fig. 1) were constructed using a pDisplay vector (Invitrogen). The DNA fragment codon of DL active domain 3 (DL3) was humanized via synthesis and ligation into the BglII and PstI sites of the pDisplay vector. The luciferase N-terminus was fused to the murine Ig κ-chain leader sequence, which directs the protein to the secretory pathway, and the C-terminus was fused to the platelet-derived growth factor receptor (PDGFR) transmembrane domain, which anchors the protein to the plasma membrane. The luciferase was displayed on the extracellular side of the plasma membrane. This chimeric recombinant membrane protein contains hemagglutinin (HA) and myc epitopes on the N-terminus and C-terminus of the luciferase, respectively.
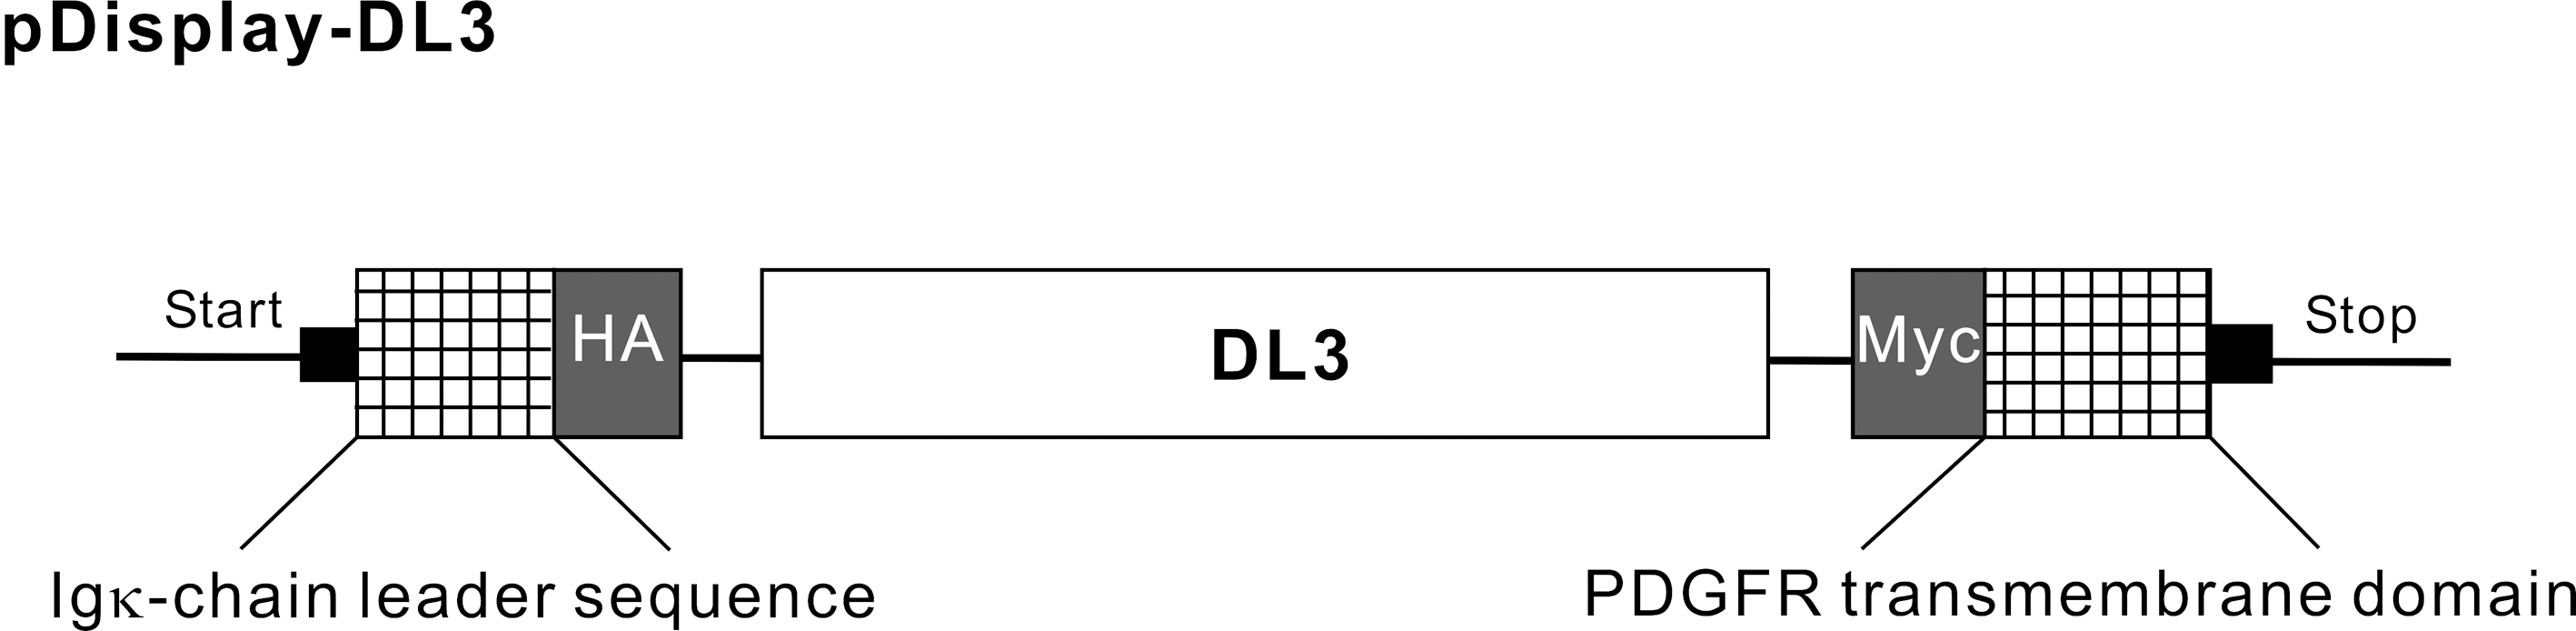
Diagram of expression vector of DL3 on the cell surface. Expression vectors for DL were constructed using pDisplay vector (Invitrogen). The DNA fragment codon of DL3 was humanized by synthesis and ligated into BglII and PstI sites of the pDisplay vector. The luciferase N-terminus was fused to the murine Ig κ-chain leader sequence, which directs the protein to the secretory pathway, and the C-terminus was fused to the PDGFR transmembrane domain, which anchors the protein to the plasma membrane. This fused recombinant membrane protein contains HA and myc epitopes on the luciferase N-terminus and C-terminus, respectively. Abbreviations: DL, dinoflagellate luciferase; DL3, dinoflagellate luciferase active domain 3; HA, hemagglutinin; PDGFR, platelet-derived growth factor receptor.
Cell Culture and DNA Electroporation
CHO-K1 cells were cultured in Dulbecco's modified Eagle's medium (DMEM; Sigma) containing 10% fetal bovine serum (Invitrogen), penicillin streptomycin (Invitrogen), sodium pyruvate (Sigma), MEM nonessential amino acid (Sigma), and
Western Blotting
The transfected cells were resuspended in 100 μL of sodium dodecyl sulfate sample buffer and incubated for 5 min at 95°C. The samples were subjected to 4%–20% gradient sodium dodecyl sulfate–polyacrylamide gel electrophoresis and transferred to a polyvinylidene fluoride membrane. The membrane was blocked with 5% nonfat dry milk in phosphate-buffered saline (PBS) at room temperature for 1 h and immunoblotted for 1 h at room temperature with a mouse monoclonal anti-HA tag antibody (1:1,000 dilution; Cell Signaling). After washing with PBS-T, the membrane was blotted with the horseradish peroxidase-conjugated secondary antibody (Chemicon). Western blots were developed using the Immobilon Western (Millipore) on a Chemistage (Kurabo).
Measurement of Luminescent Emission
The luciferin solution was offered by TOYO B-Net Co., Ltd. Luciferase assay protocol is shown in Table 1. The luciferin concentration was determined spectrophotometrically by absorbance at 390 nm. CHO-K1 were washed with PBS and harvested by incubating with 2% bovine serum albumin (BSA) and 2 mM ethylenediaminetetraacetic acid (EDTA) in PBS for 5 min at room temperature and cells were collected in the tube. DL3 activities were measured by mixing the sonicated transfected cell lysates from 1 × 10⁷ cells and dinoflagellate luciferin in 0.2 M phosphoric acid buffer (pH 5.5) with a Centro LB960 luminometer (Berthold). The dinoflagellate luciferin, which does not permeate the cell membrane, was added to the live transfectant and its luminescence was measured. This procedure makes it possible to exclusively measure the luminescence amounts of the DL3 expressed on the cell membrane surface. The DL3 transfectant was solubilized with 0.1% Triton X-100, and the luminescence emission was measured by adding luciferin (luciferase and luciferin do not deactivate it in 0.1% Triton X-100; data not shown). Bioluminescence from the DL is saturated within a few seconds after adding luciferin and remains stable at least for 10 min. So we measured the bioluminescence at 2 min after adding luciferin. This procedure enables measurement of the amounts of luminescence from the DL3 expressed intracellularly and on the cell surface.
Luciferase assay protocol
BSA, bovine serum albumin; EDTA, ethylenediaminetetraacetic acid; PBS, phosphate-buffered saline.
Membrane Permeability of Luciferin
TRANSIL beads (NIMBUS) allow for functional reconstitution of a well-defined single lipid bilayer on an optimized solid support. The membrane permeability of the substrates was measured by mixing the luciferase. TRANSIL beads (200 μL; 1.52–30 μM) were incubated with 2 μM dinoflagellate luciferin, 0.3 μM
Flow Cytometry Analysis
CHO-K1 cells stably expressing DL3 were washed with PBS and harvested by incubating with 2% BSA and 2 mM EDTA in PBS for 5 min at room temperature. The cells were then washed once with 2% BSA and 2 mM EDTA in PBS and incubated with mouse anti-HA monoclonal antibody (Cell Signaling) on ice for 20 min. The cells were washed once with 2% BSA in PBS and incubated with fluorescein isothiocyanate-labeled goat anti-mouse IgG antibody (Kirkegaard Perry Laboratories) for 20 min on ice. Finally, the cells were washed once with 2% BSA in PBS, and DL3 surface expression was measured by FACS Calibur (BD Bioscience) with CELLQUEST software (BD Bioscience). To study total levels of DL3 chimeras, fixed and permeabilized cells (permeabilization reagent; Beckman Coulter) were stained with the same antibody.
Results
Expression of DL
Expression vectors for DL (Fig. 1) were constructed using pDisplay vector (Invitrogen), which enables the extracellular expression as a fusion protein. The luciferase N-terminus was fused to the murine Ig κ-chain leader sequence that directs the protein to the secretory pathway, and the C-terminus was fused to the PDGFR transmembrane domain, which anchors the protein to the plasma membrane.
CHO-K1 cells were transfected with this fusion vector. The expression of DL was examined with Western blotting (Fig. 2a). The clones with high expression levels were identified to select stable transfectants. The dose-dependent response of DL from the cell lysate of the stable clone on luciferin was measured (Fig. 2b; see Materials and Methods section). This procedure enables measurement of the total luminescence in the DL3-expressing cells. The lack of luminescent activity in CHO-K1 cells has been verified (Fig. 2b).
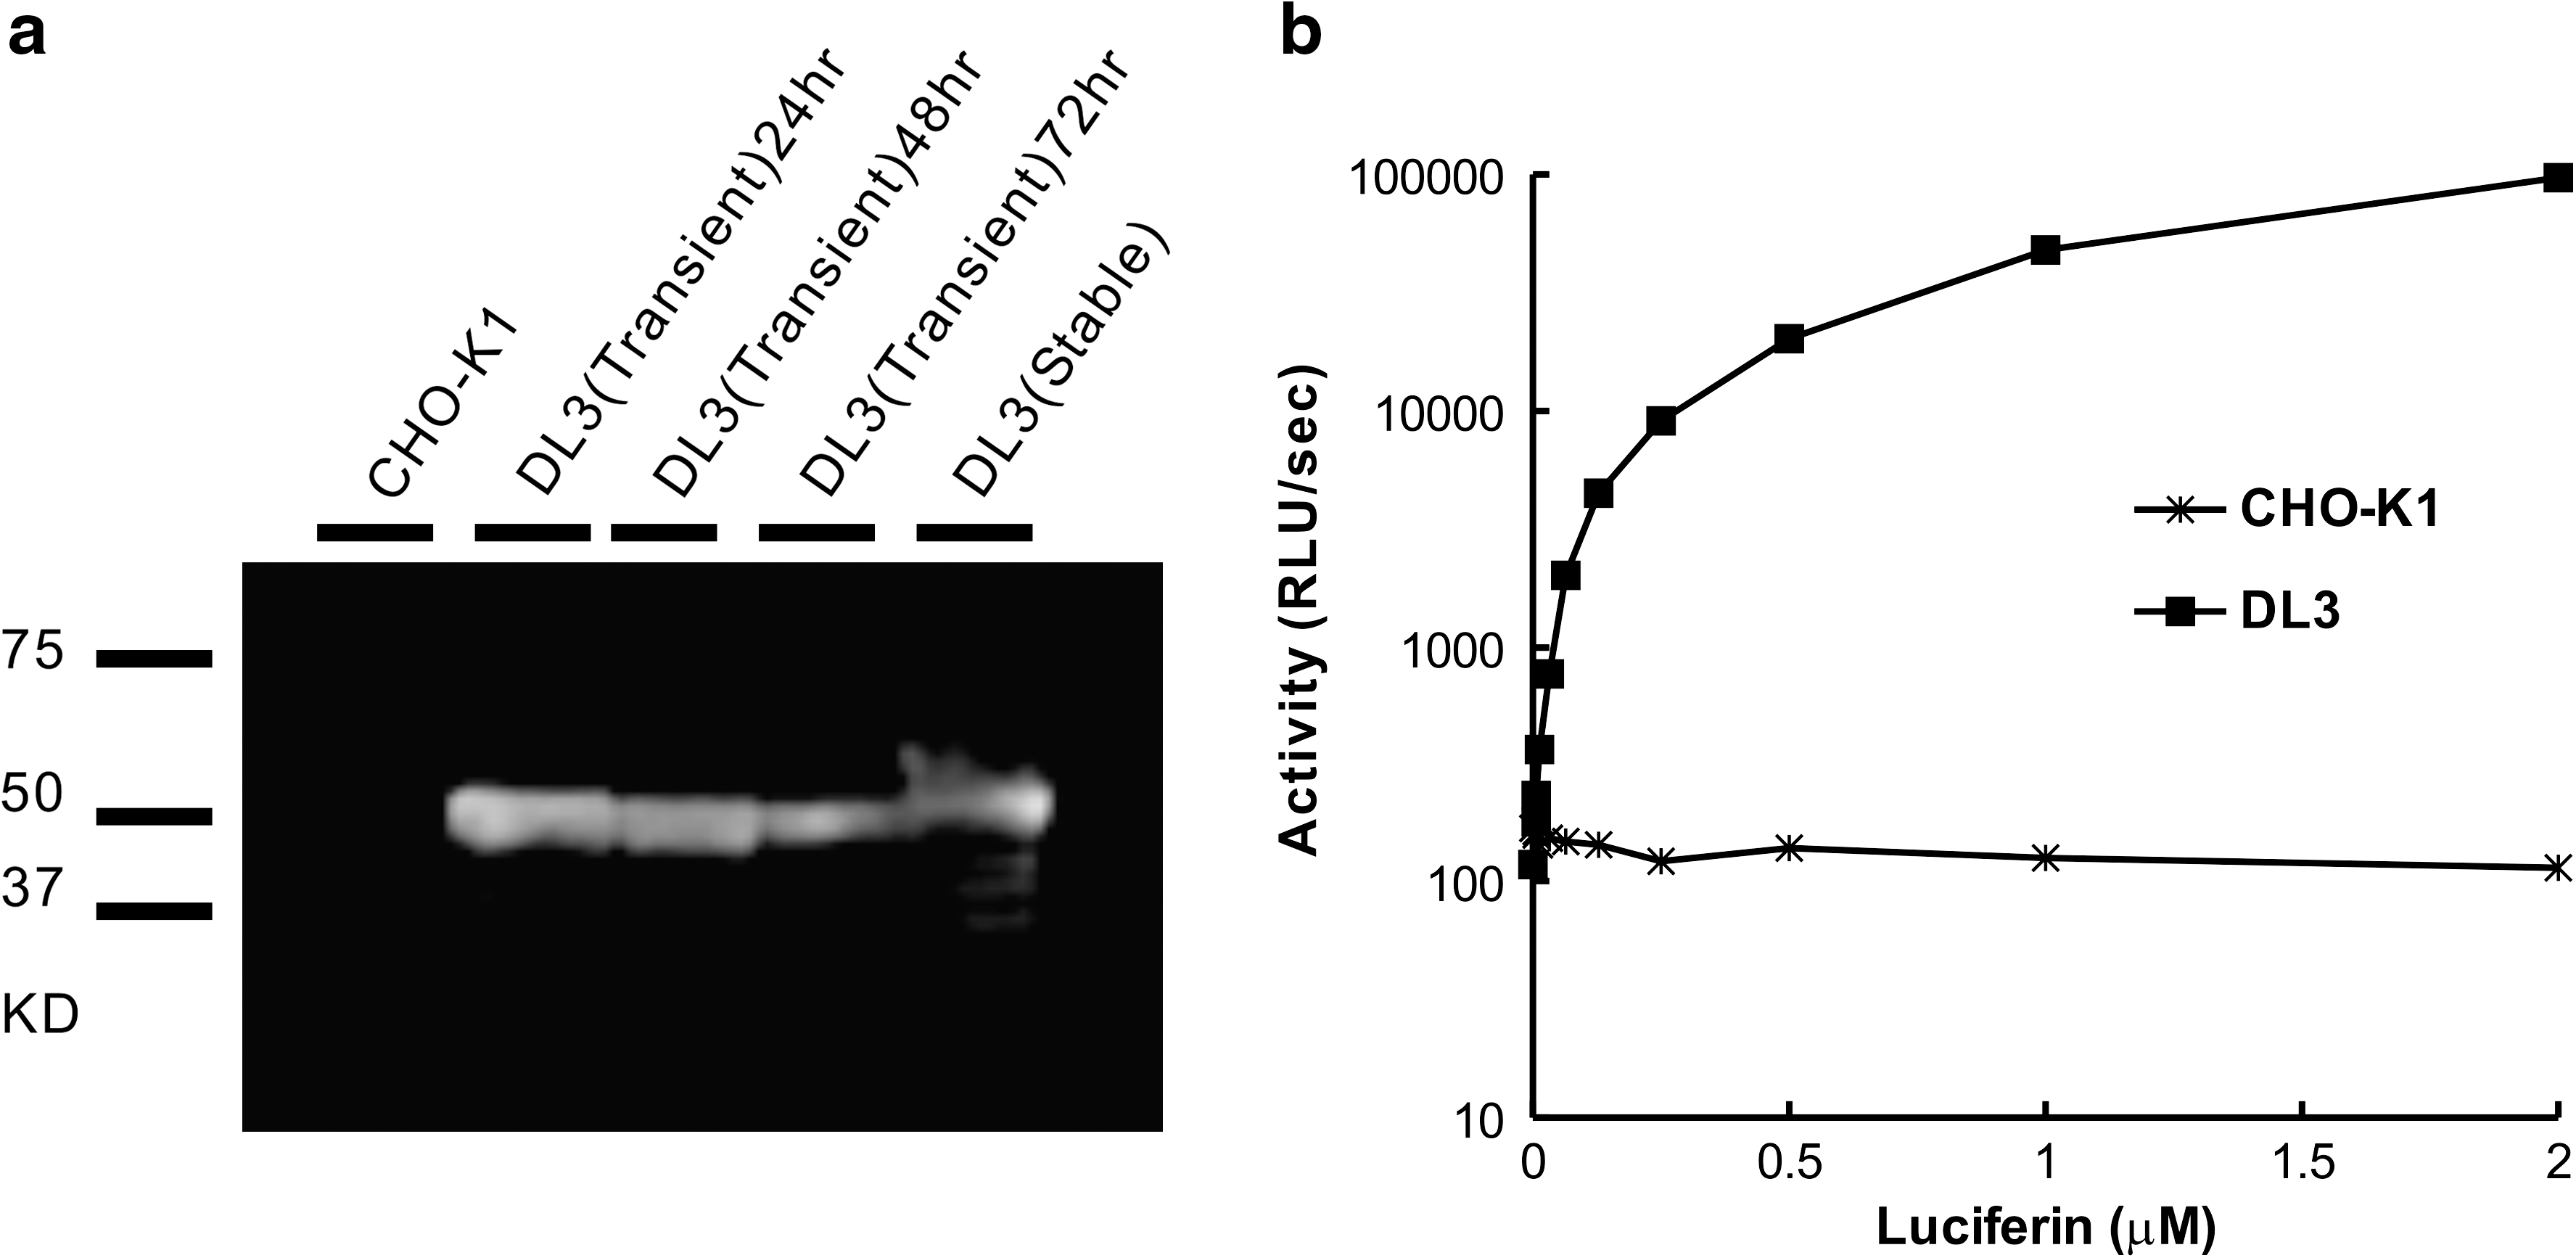
Luminescent activities of membrane-displayed DL3. (
Membrane Permeability of Dinoflagellate Luciferin
Dinoflagellate luciferin has a tetrapyrrole ring from chlorophyll and is water soluble; therefore, it does not permeate into the lipid bilayer of the cell membrane. To confirm the impermeability of dinoflagellate luciferin into the lipid bilayer of the cell membrane, we compared the permeability of several luciferins, using a TRANSIL beads assay (NIMBUS) (Fig. 3). TRANSIL beads from the phosphatidylcholine membrane enable functional reconstitution of a well-defined single lipid bilayer on an optimized solid support. Assays involved incubation of 200 μL of TRANSIL beads (1.52–30 μM) and 1 μL of 2 μM dinoflagellate luciferin, 0.3 μM firefly luciferin, and 1 μM coelenterazine for 5 min at room temperature. The beads were precipitated and the unbound substrate in the supernatant was collected. The amounts of unbound substrates, dinoflagellate luciferin, firefly luciferin, and coelenterazine, were measured with DL3 lysate, firefly luciferase, and recombinant Gaussia luciferase, respectively. Coelenterazine in the assay solution binds tightly with the membrane, resulting in very small amounts of residual luciferin in the aqueous solution. In contrast, the amount of luminescence did not change with the increase in amount of TRANSIL beads, which shows that both the dinoflagellate luciferin and the firefly luciferin have little affinity for the membrane.
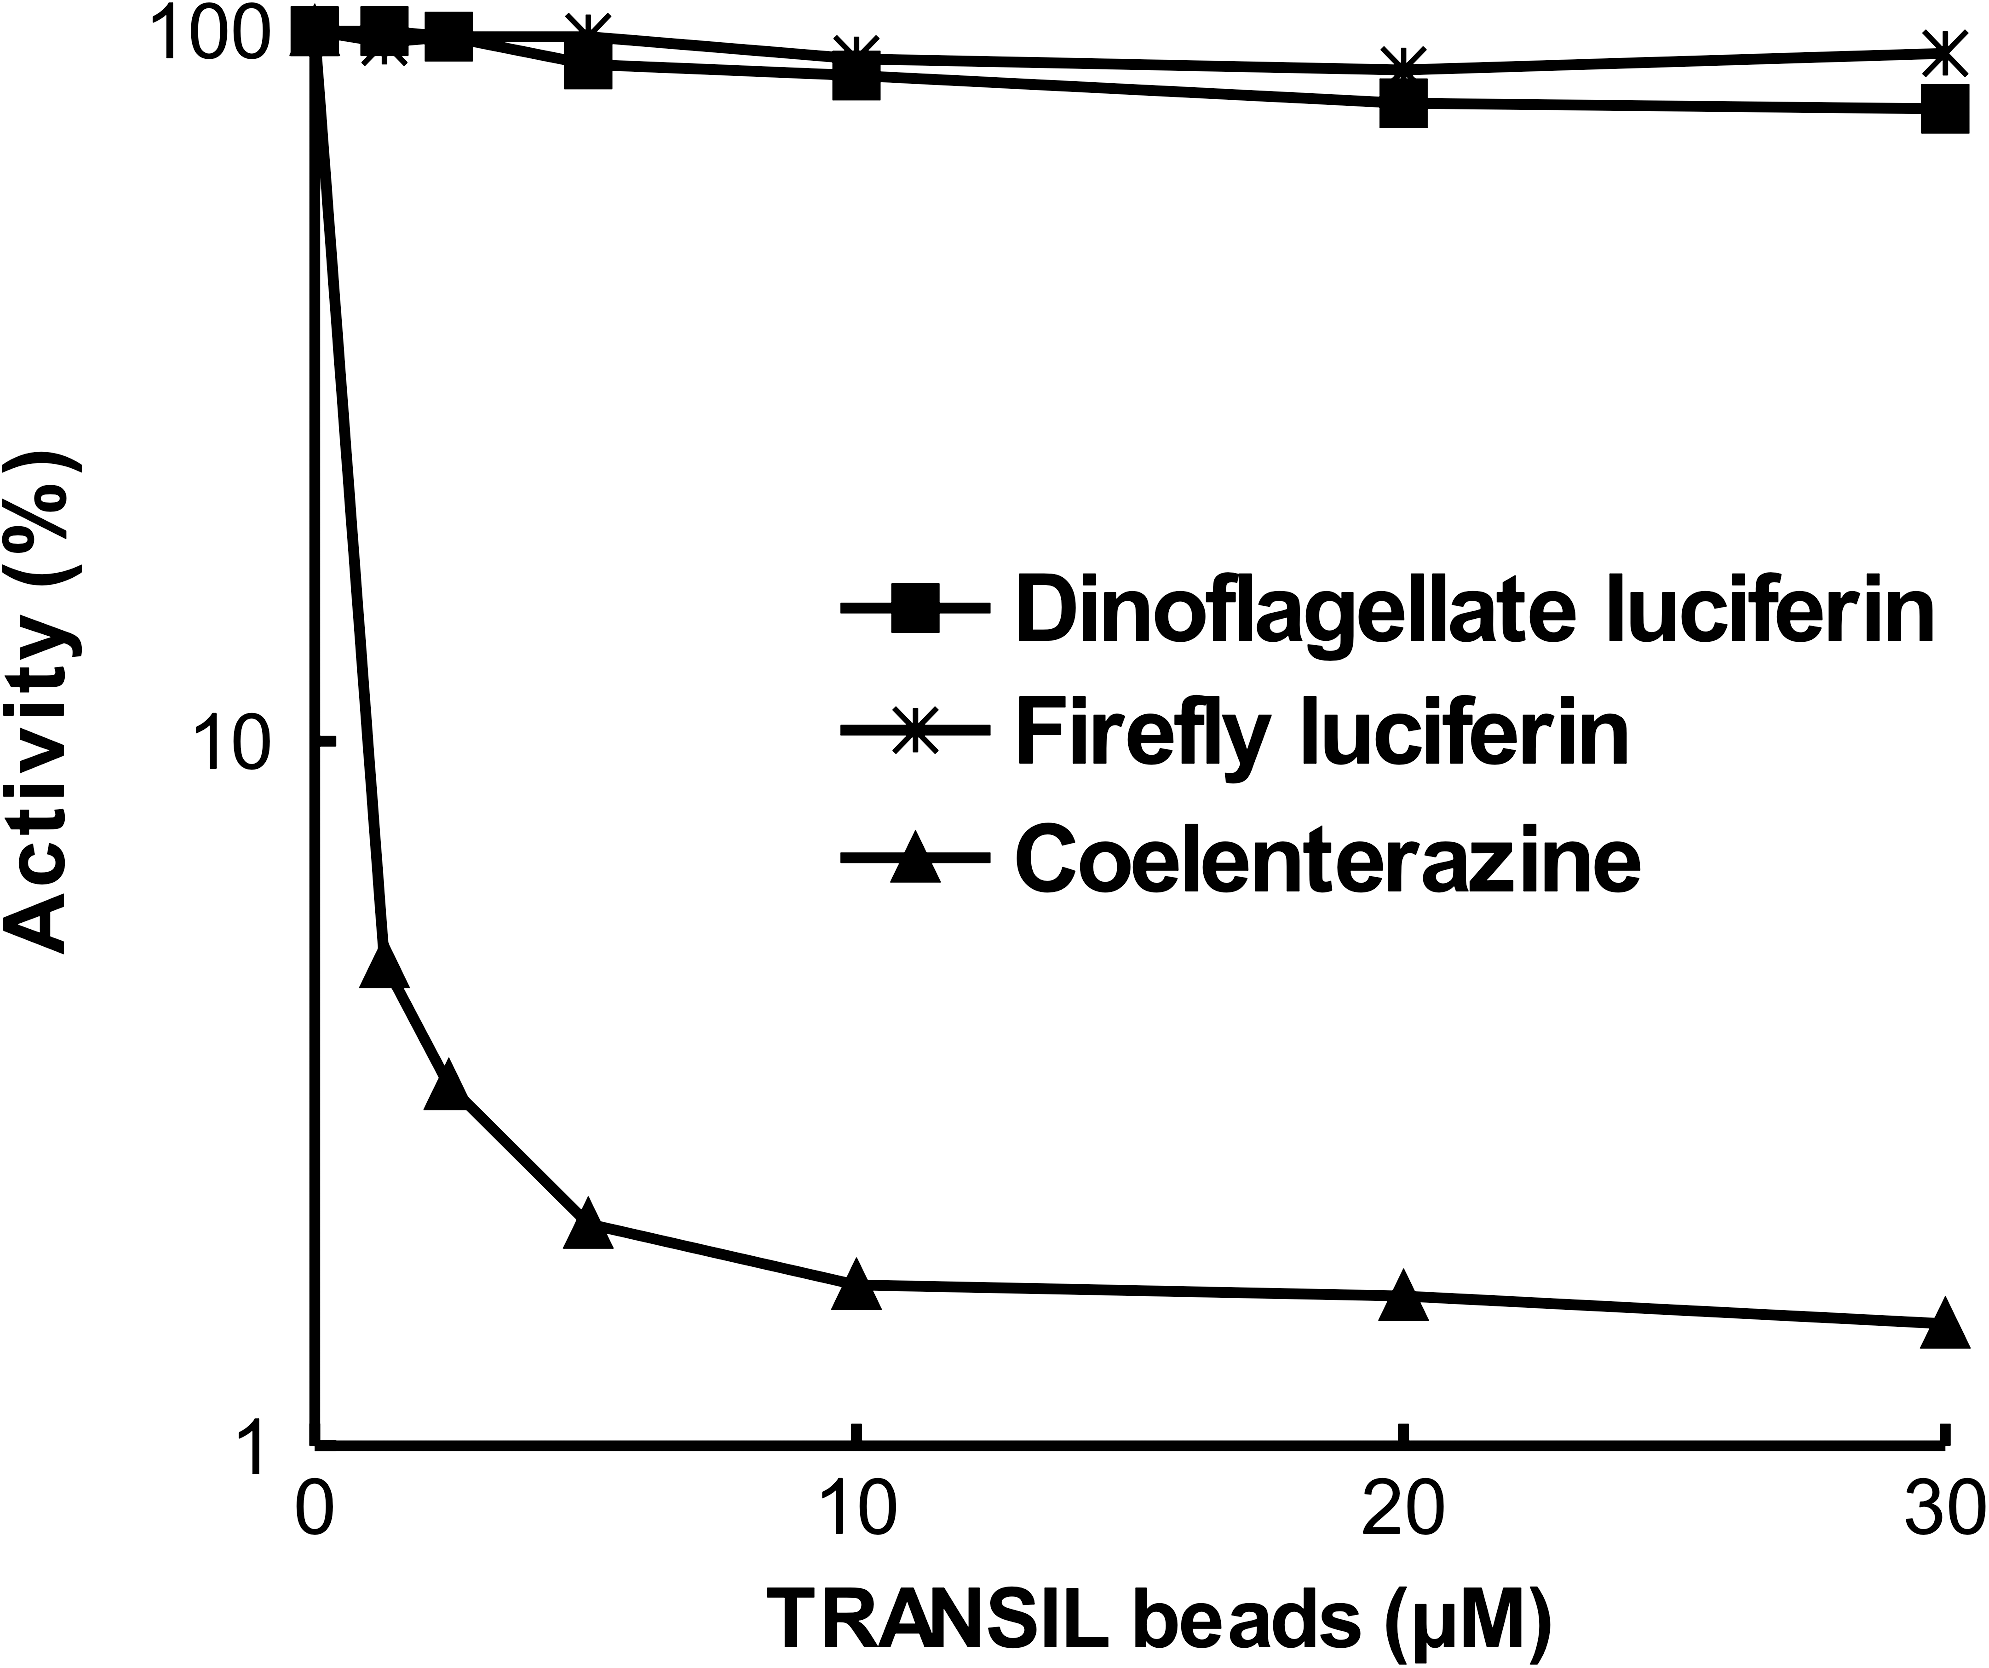
Membrane permeability of dinoflagellate luciferin. TRANSIL beads (NIMBUS) enable functional reconstitution of a well-defined single lipid bilayer on an optimized solid support. The membrane permeability or binding of each substrate was measured by mixing the luciferase. TRANSIL beads (200 μL; 1.52–30 μM) were incubated with the 2 μM dinoflagellate luciferin, 0.3 μM
Expression of DL on the Cell Surface
Surface expression of DL3 in CHO-K1 cells was examined with flow cytometry (Fig. 4a). Stably expressing CHO-K1 cells were reacted with mouse anti-HA monoclonal antibody and fluorescein isothiocyanate-labeled goat anti-mouse IgG antibody. Fluorescence was measured with FACS Calibur (BD Bioscience). The difference between the control sample and the expressing sample was determined. A significant but small difference by flow cytometry compared with nontransfected CHO cells suggests that the surface expression of fusion protein is low.

Expression of luciferase on the cell surface. (
To determine the level of enzymatic activity, the luminescence from living cells was measured (Fig. 4b). Only the transfected cells showed luminescent activity. The dinoflagellate luciferin, which does not permeate the cell membrane, was added to the external solution of live transfectant and the luminescence was measured. This procedure enables exclusive measurement of the luminescence of DL3 expressed on the cell membrane surface. Disruption of the plasma membrane by 0.01% Triton X-100 resulted in a robust signal from membrane-disrupted cells and was considerably larger than that from intact cells. This comparison indicates that 30% of the luminescence is from the luciferase on the cell surface. In the case of intact cells, membrane-impermeable luciferin can react only with cell surface-expressed luciferase. This result supports the idea that the luminescent assay is superior in sensitivity when compared with flow cytometry analysis. Further, the luminescence detection protocol, consisting of cell washing and adding substrate to living cells, is much easier.
Quenching the Luciferase Activity on the Cell Surface Exclusively
To study the quenching of luminescent activity, we measured the effect of the lysate of amino acid modifier sulfo-NHS-acetate, which reacts with the ε-amino groups of lysine at pH 7. The stable transfectant was solubilized with 0.1% Triton X-100 and incubated in PBS with 2 μM of sulfo-NHS-acetate at room temperature (Fig. 5a). After 2 min of incubation, the residual active sulfo-NHS-acetate (0.031–4 μM) was inactivated via addition of Tris buffer. Luminescence activities from the treated DL3 cells were measured. Sulfo-NHS-acetate (2 mM) completely blocked the luminescence activity of DL3 (Fig. 5a). We applied this compound to the living transfectant to quench the surface-displayed luciferase. Sulfo-NHS-acetate was added to the external solution of the live transfectant, which was washed twice after incubation. Membrane-impermeable dinoflagellate luciferin was then added, and its luminescence was measured. The luminescence activities were substantially decreased only in the quenched samples (Fig. 5b). The cells were then disrupted with 0.1% Triton X-100, and the luminescence activities were restored. This luminescence, which resulted from the luciferase inside the cell, was not inactivated with the membrane-impermeable sulfo-NHS-acetate. Therefore, sulfo-NHS-acetate enables preferential quenching of luminescence of the DL3 expressed only on the cell membrane surface.
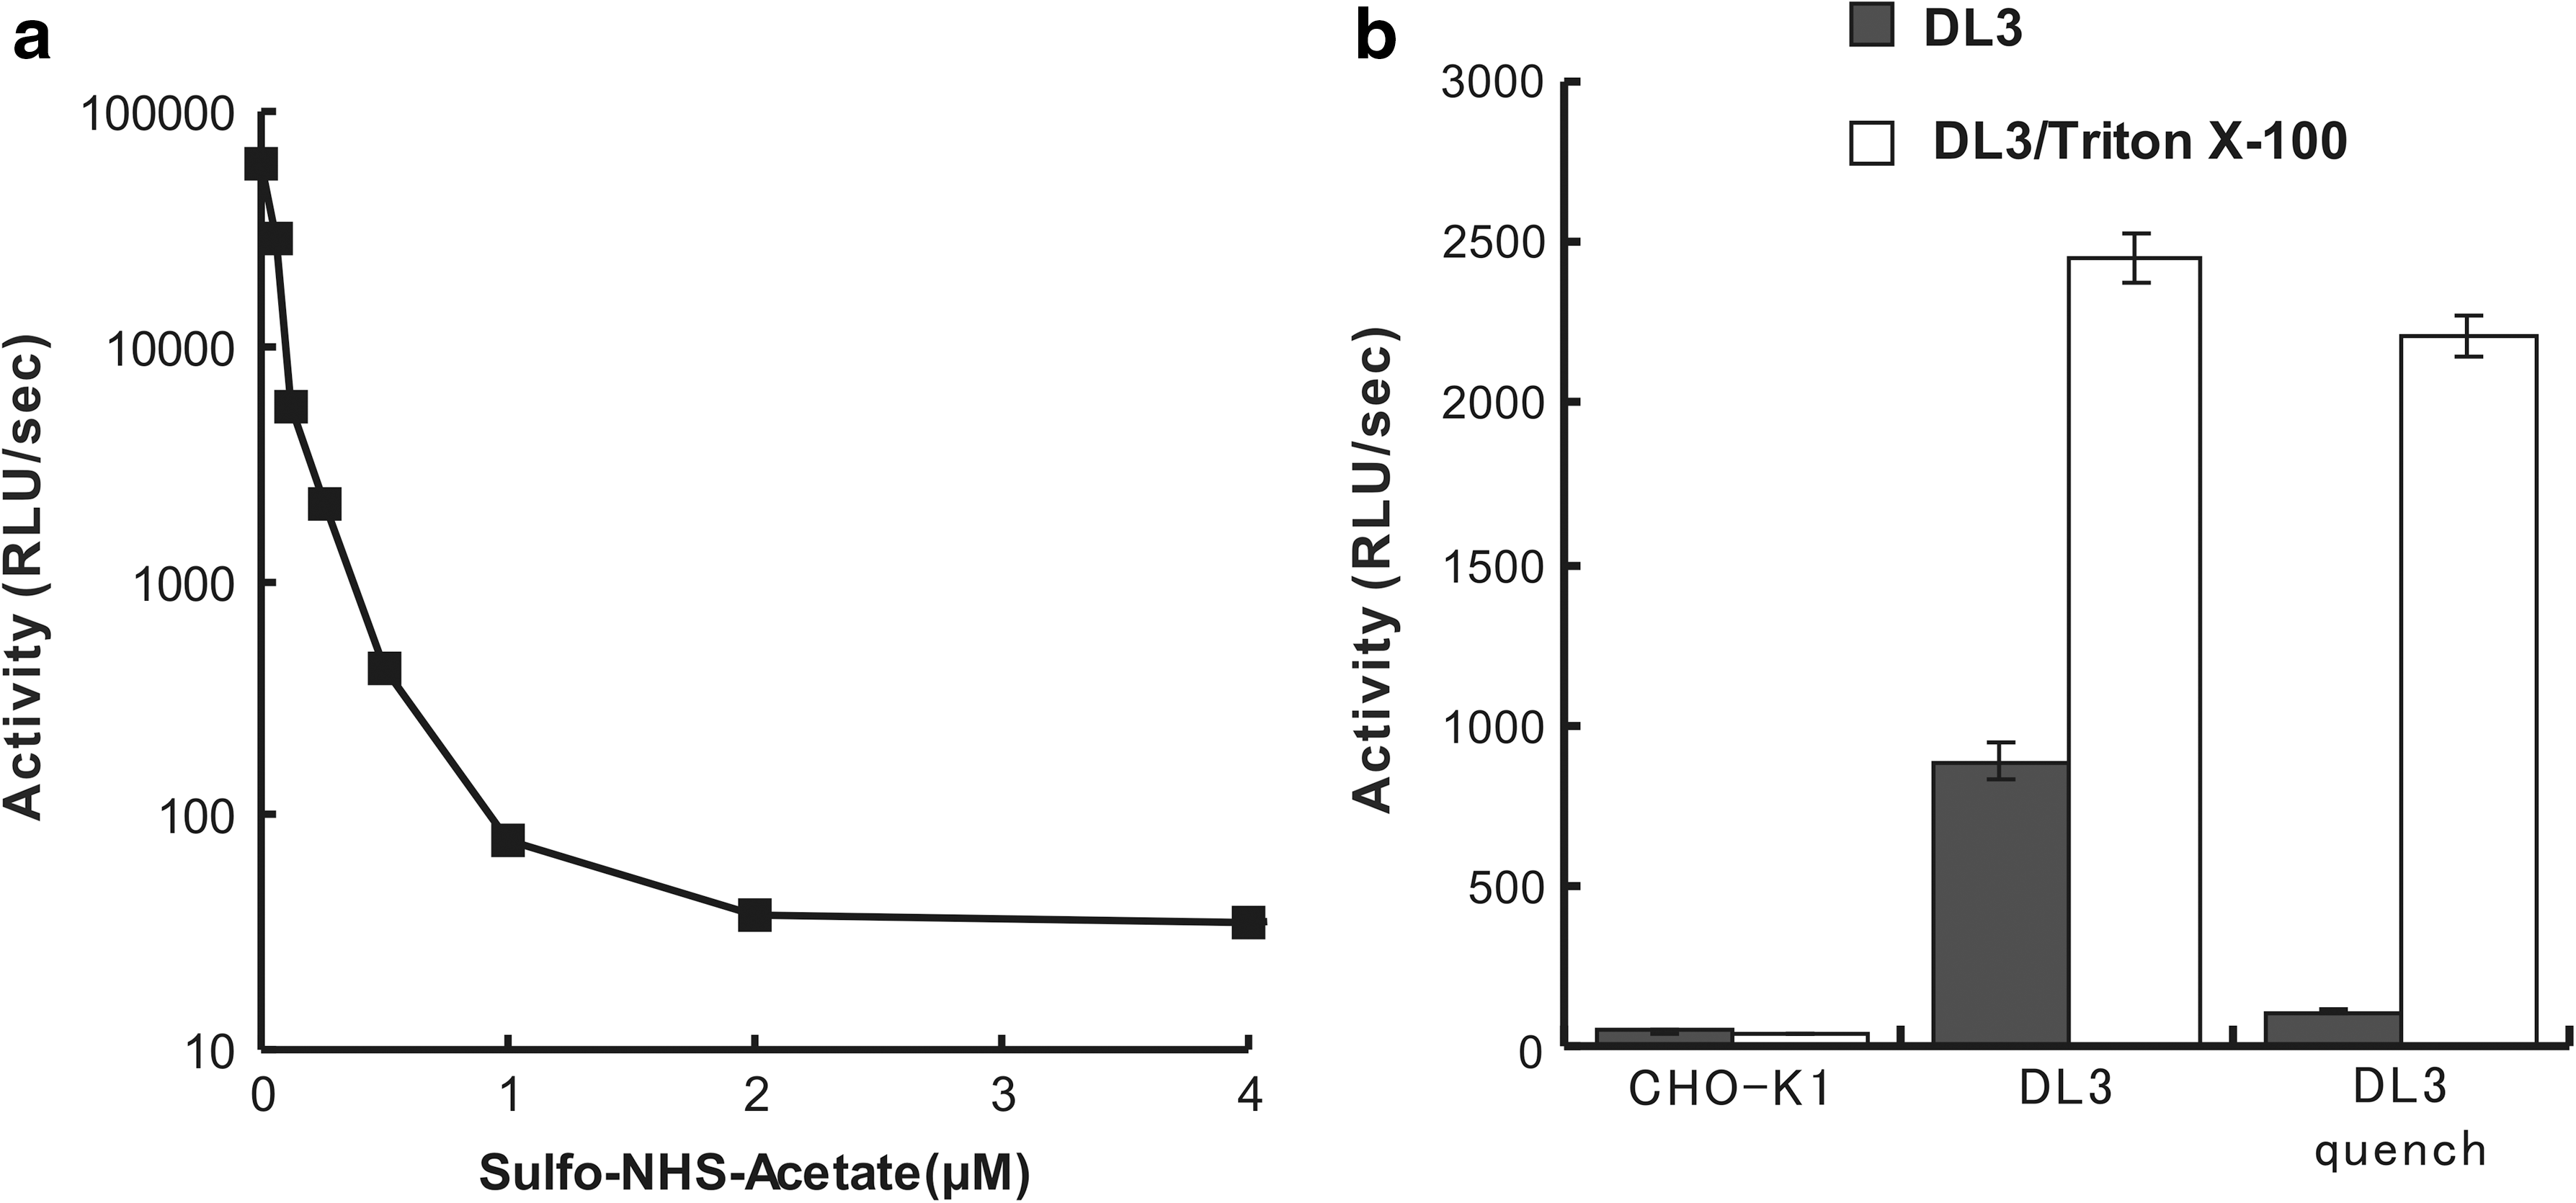
Quenching the luminescence from cell surface-displayed luciferase. (
Kinetic Analysis of Membrane Trafficking
To monitor expression of DL3 on the cell membrane, the above quenching protocol was applied. Luminescence activities of the surface-expressed DL3 were quenched by incubation with 2 μM sulfo-NHS-acetate. After washing out the quenching reagent, we measured the luminescent activities at different time periods. The luminescent activity progressively resumed within 1 h, consistent with the idea that the newly surfaced fusion protein conferred the resumed activities. To further confirm this idea, Brefeldin A (BFA), which interferes with protein transport by inhibiting transport in the Golgi apparatus, was added to the live transfectant after quenching. The activity was recovered partially, up to 60% of the initial level. The cells treated with BFA did not exhibit restored luminescence. In comparison, up to 60% activity was recovered in nontreated cells (Fig. 6). By quenching the luciferase expressed exclusively on the cell membrane, this method is a possible high-sensitivity system that can be used to determine the intracellular transport process of a membrane protein and the time required to reach the cell membrane.
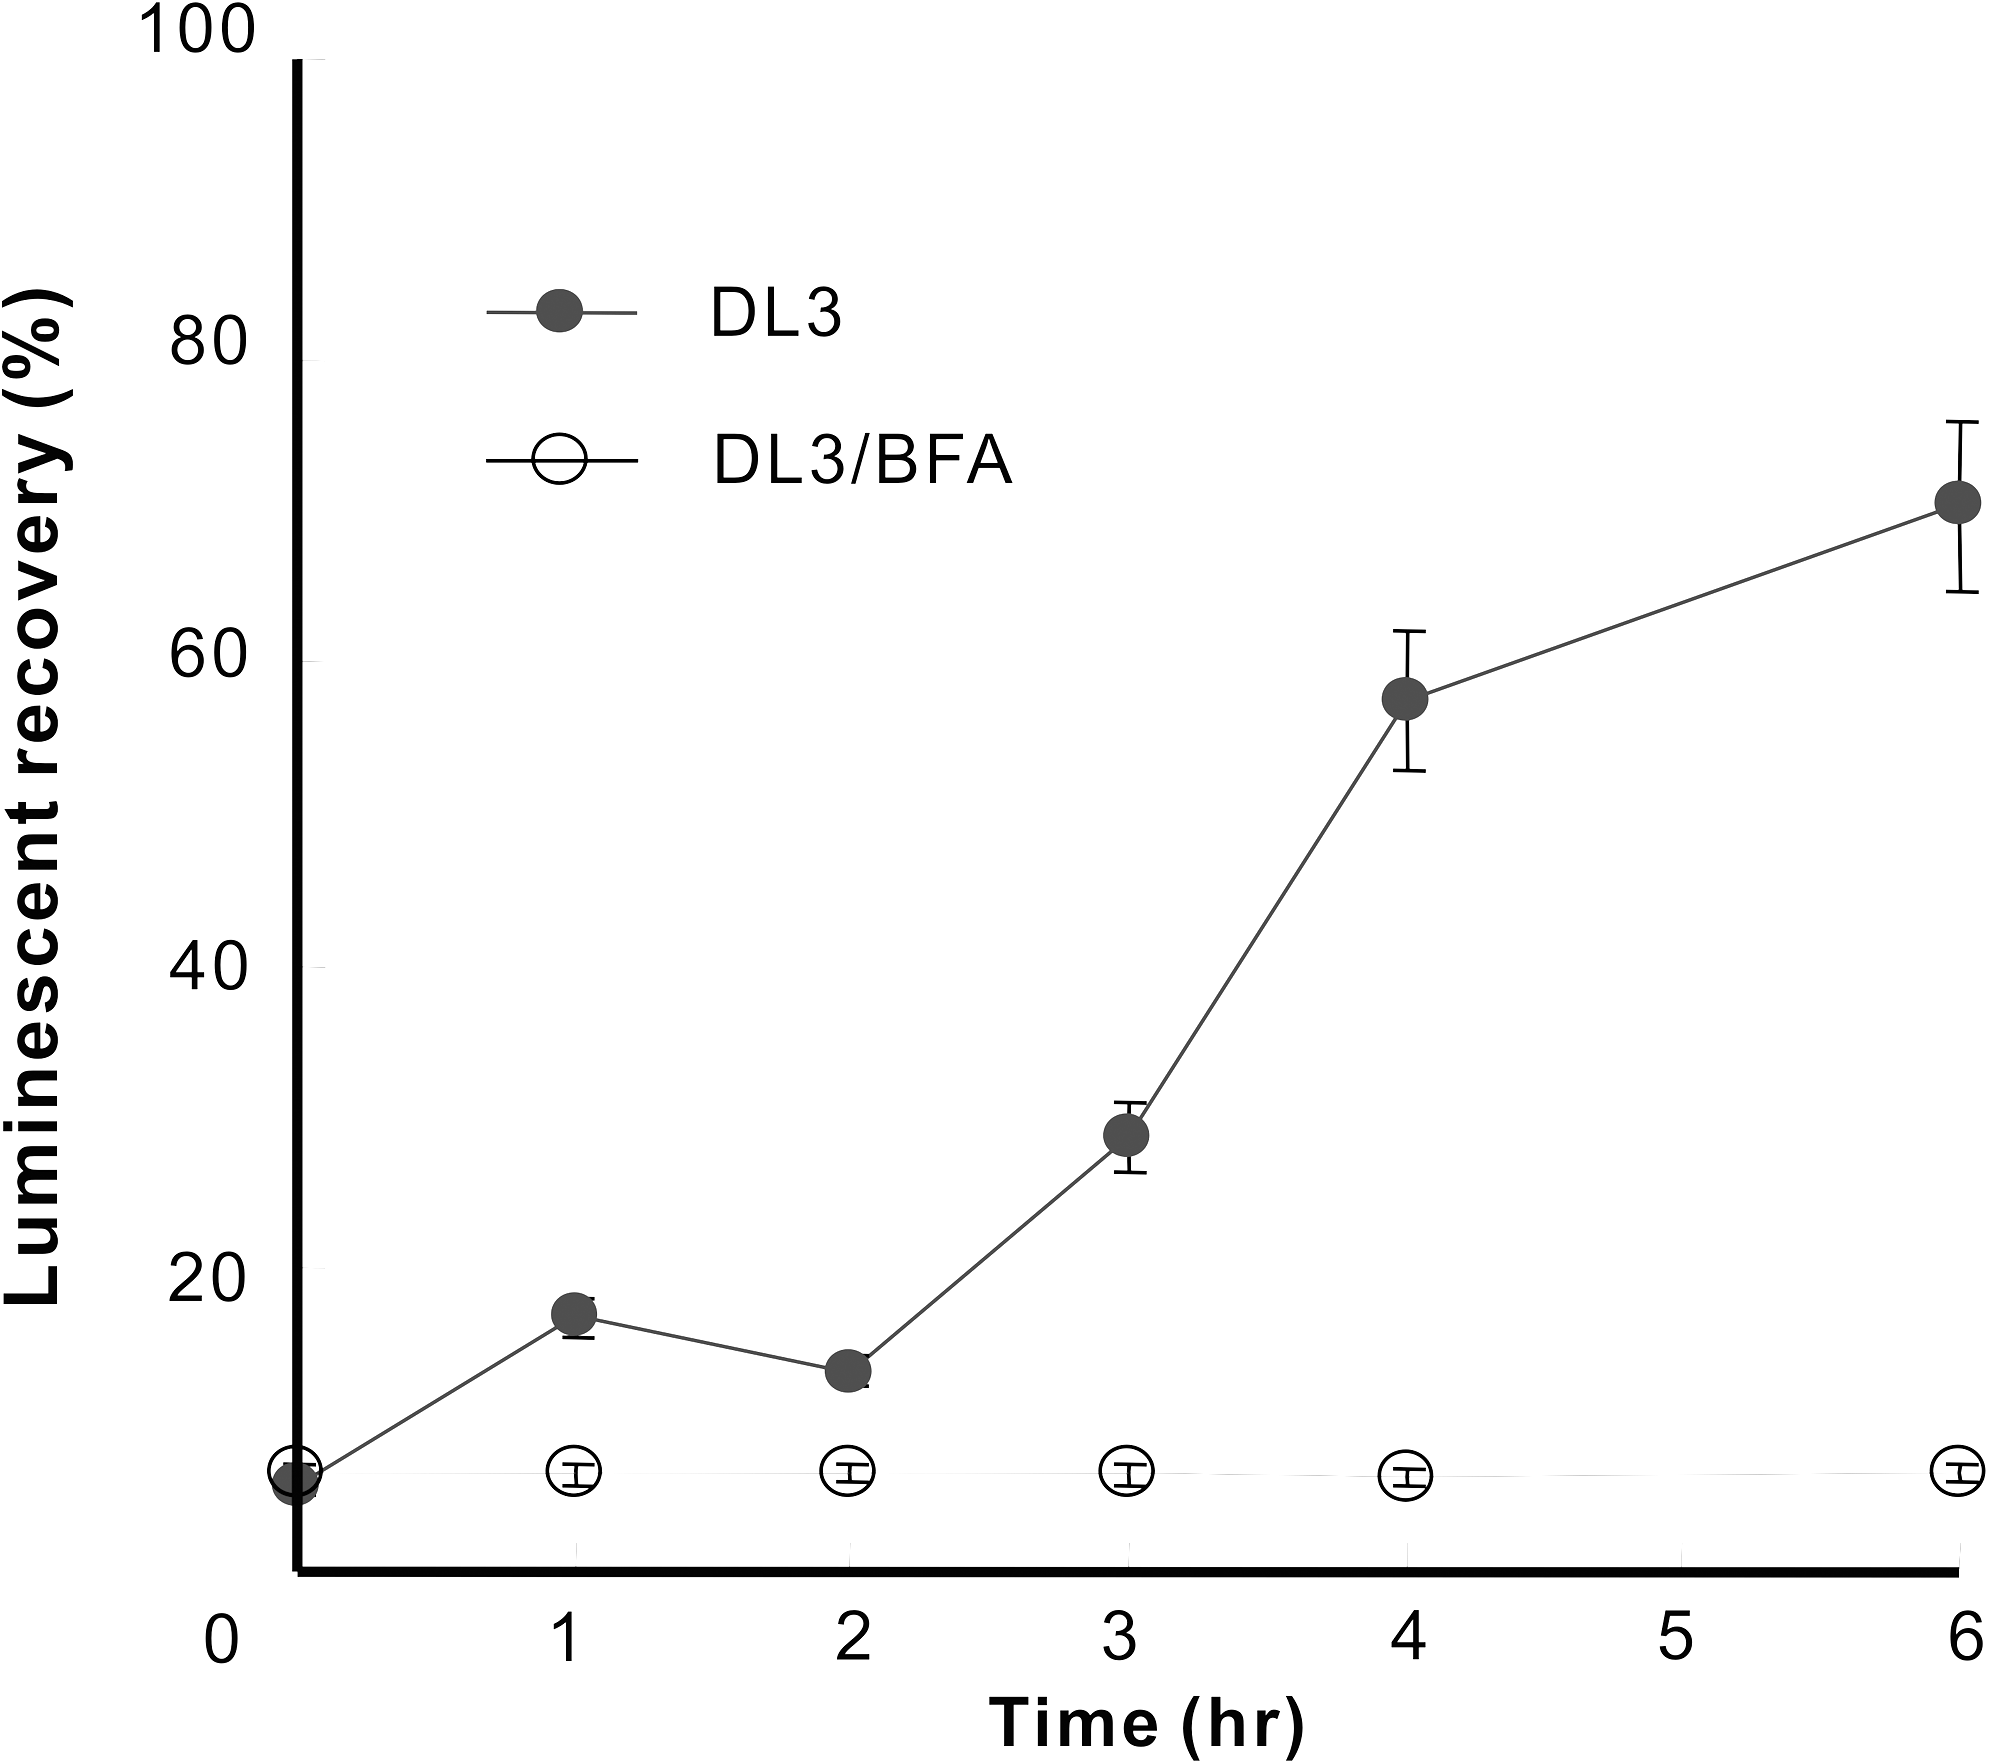
Transport of luciferase to the cell membrane. Stably transfected cells were treated with 2 μM sulfo-NHS-acetate for 2 min and incubated without (∙) or with (○) 1 μM BFA at 37°C. Subsequently, the luminescence activities of DL3 transport to the cell membrane were measured by adding 100 μL of 2 μM dinoflagellate luciferin in 0.2 M phosphoric acid buffer (pH 5.5) with a Centro LB960 luminometer. After sulfo-NHS-acetate treatment, stably transfected cells were measured in a time-dependent manner using this method. Luminescence values represent the mean of 2 replicates. Abbreviation: BFA, Brefeldin A.
Discussion
It is important to know both the amounts and dynamics of cell surface-expressed membrane proteins to help to understand cellular functions. High sensitivity and accuracy are required to measure surface-expressed membrane proteins. However, present techniques have only limited applicability and throughput. The bioluminescence measurement has many advantages over other existing methods, including its high sensitivity, low background, and wide dynamic range.
The expression of firefly luciferase on the cell surface was reported. Protein A from the IgG-binding domain of Staphylococcus aureus was fused with firefly luciferase. 16 This recombinant chimeric protein binds the antimembrane protein antibody and reacts with the cell surface. Measurement of firefly luciferase luminescence on the extracellular surface allows for estimation of the local concentration of ATP released from the cell to the extracellular surface. 16 But this method requires steps cumbersome for high-throughput applications, including expression, purification, and reaction of chimeric proteins. The binding of antibody to cell membrane proteins might cause unexpected signal transduction or alteration in surface expression. The requirement of antibody binding could introduce nonlinear factor to the detection process, thereby affecting the dynamic range of the assay. Pellegatti et al. 17 developed a firefly luciferase–folate receptor chimeric protein that retains the C-terminal glycosyl phosphatidylinositol (GPI) anchor of the folate receptor and successfully expressed this chimeric membrane protein on the cell surface. The luminescence from the cell surface-expressed luciferase was detected to study the local concentration of ATP near the cell surface. This method is simple and quantitative, but the membrane-permeable nature of firefly luciferin prevents the measurement of cell surface-expressed luciferase exclusively. Santos et al. 18 have successfully captured in vivo imaging of T-cells using a membrane-bound Gaussia princeps luciferase with high sensitivity. They developed a new approach to bioluminescent T-cell imaging, using a membrane-anchored form of the Gaussia luciferase enzyme, which they could stably express in both mouse and human primary T-cells. This sensitive imaging technology has applications in in vivo cell-based studies in a wide array of mouse models.
The luminescence from the cell surface-expressed chimeric protein of luciferase and membrane protein shows the amount of the expressed membrane protein with high sensitivity and accuracy; however, it needs to measure the luminescence from the chimeric protein on the cell surface exclusively. It is important to exclude the luminescence from the intracellular luciferase in transit. For this purpose, ideally one would like to make the chimeric membrane protein whose extracellular domain contains the luciferase with some special characteristics, such as inactivity in the cell, but activity outside the cell, or modify its substrate to ensure membrane impermeability. The realization of the former case would be technically difficult. Many kinds of substrate for luciferase are membrane permeable. But we find that the substrate for DL is membrane impermeable, 21 and so we apply the luciferase and luciferin to this measurement for monitoring the cell surface-expressing luciferase. DL catalyzes the oxidation of dinoflagellate luciferin, which has a tetrapyrrole ring from chlorophyll, resulting in an electronically excited species that emits blue light (474 nm). 21 –24 This tetrapyrrole ring prevents the penetration of luciferin into the lipid bilayer of the mammalian cell membrane. We have shown that the dinoflagellate luciferin has little affinity for the phosphatidylcholine-coated beads. This result supports the impermeability of dinoflagellate luciferin to the cell membrane. The luciferase in our system can react only with the luciferin outside the cell, which enables the detection of luciferase on the outer membrane of the cell. Pellegatti et al. 17 used membrane-permeable luciferin, which makes it impossible to conduct a reaction with only the luciferase on the outer cell membrane.
We constructed the expression vector for the chimeric protein of the membrane protein PDGFR and the third domain of the DL. Using this system, we could restrict the measurement to the luciferase. We measured the luminescence from the all luciferase both in the cell and on the cell membrane. When luciferin was applied to the external solution of the live transfected cells, we measured the luminescence from only the luciferase on the cell membrane. These experiments (Fig. 3) show that approximately one-third of the luciferase is expressed on the cell surface, and the remaining two-thirds are in the cell, possibly in the middle of intracellular transport, or standing by in the cell for membrane expression. The difference in protein levels detected by anti-HA antibody versus the activity level may be due to several factors including differential activity of DL during biogenesis and insufficient linearity of FACS or anti-HA binding. Sun et al. 10,25 also estimated that over 80% of K+ channel protein existed inside cells, instead of on cell membranes, in transiently transfected cells. This indicates the importance of the biogenesis pathway.
Sulfo-NHS-acetate, which chemically modifies lysine residues, specifically eliminates the luminescent function of DL. Sulfo-NHS-acetate is water soluble and cannot penetrate the cell membrane. 20 When sulfo-NHS-acetate was applied to the external solution of live transfected cells, the luminescence was quenched completely. After lysis of these cells with Triton X-100, which does not interfere with the luminescence activity, the luminescence was detected again. The detected luminescence resulted from the luciferase in the cells that were not quenched. The difference between the luminescence from the lysate of quenched cells and that from the lysate of unquenched cells is that of membrane-displayed luciferase. This difference was approximately one-third of that from the lysate of unquenched cells. This value is close to the estimation from the lysis experiment (Fig. 5). Sulfo-NHS-acetate inactivates only membrane-displayed luciferase without affecting intracellular luciferase.
The luminescence was recovered, with time, after application of sulfo-NHS-acetate to the external solution of live transfected cells. But the application of BFA, which inhibits protein transport, prevents this recovery completely. As the original luciferase on the cell surface was inactivated by the covalent bonding with the quencher, the recovery was likely due to newly transported luciferase to the cell membrane. The fact that the recovery was perfectly blocked by BFA also supports that this recovery of luciferase activity was due to the newly transported luciferase. Thus, by incorporating a step in which the membrane protein fused to a luminescent protein expressed on the cell membrane is quenched, one could effectively measure the luminescence activity of those monitor proteins that had newly reached the cell surface. Sun et al. 10 showed that the time of recovery of Kir2.1 potassium channel after chemobleaching was about 4–5 h with FRAC. In our system, the time of recovery for the luciferase activity after quenching was also 4–5 h. When the cells were treated with BFA, 26 the activity of cell surface luciferase was not recovered within 5 h, whereas the activity of Kir2.1 was restored about 20% after 3 h in FRAC. They interpreted this recovery as the retaining of the transport vesicles with Kir2.1 after trans-Golgi membranes. In our experiments, vesicles might be transported promptly after trans-Golgi membranes without retaining. The limiting step of transport might depend on the membrane proteins in the vesicles. To know the effect of drugs on the transportation, it is important to also measure the expression amount on the cell surface directly and the kinetics of recovery.
For this bioluminescence assay for monitoring membrane protein expression, one needs to construct the chimeric proteins of DL and the membrane protein for which transport is of interest. 27,28 This chimeric protein might change the membrane protein and modify its folding and function, which might make expression on the cell surface more challenging. To check the versatility of our system, we have constructed the expression vector for chimeric protein with human CD4 and DL. DL3 domain of DL was ligated to the N-terminus of human CD4 and this was cloned into pFLAG-CMV3 (Sigma), in which the signal sequence was preprotrypsin leader sequence. CHO-K1 cells were transfected with this vector. We have confirmed the expression of this chimeric membrane protein by 2 methods, luciferase activity and flow cytometry with anti-FLAG antibody. We also construct the expression vector for chimeric protein, human CD8 and DL, and confirmed its expression (data not shown). In this assay, we use the third domain of DL, whose molecular weight is 40 kDa. However, it is desirable to use a smaller size of luciferase to prevent inhibition of membrane protein expression while still retaining its luminescent enzymatic activities. 29 We made some deletion mutants of DL in an attempt to find the smaller functional region, but have so far been unsuccessful. Gaussia luciferase, a smaller protein whose molecular weight is 20 kDa, has strong luminescence emission; it would be useful as the membrane protein tag. 30 However, the luciferin for this luciferase, coelenterazine, is membrane permeable. It would be interesting to develop a membrane-impermeable substrate for this luciferase. 31,32
We used the CMV promoter for expression of the chimeric membrane protein in CHO-K1 cells. Ohomiya et al. 7,19 studied the effect of promoters on the expression level of DL in mammalian cells. They reported the expression level of DL changes dramatically depending on the cell and promoters. As a result, it would be expected that alternative cells and promoters, such as COS7 cells and CGC promoters, would increase both expression of our chimeric luciferase and sensitivity.
Compared with other existing approaches, in addition to higher throughput, the enzymatic assay allows for signal amplification. Hence, it is likely to be very useful to proteins of low expression. The bioluminescence approach discussed here utilizes its key properties of high sensitivity, low background, and wide dynamic range in our system. 13 This system would be a powerful tool to study the transport of membrane proteins, because the amount of cell surface-expressed membrane proteins are not high for most membrane proteins. Sun et al. 10 developed the FRAC assay to measure membrane trafficking of potassium channels (Kir2.1) by Rb+ efflux through the channel, after inactivating the channel activity with [2-(trimethyl-ammonium)ethyl] methanethiosulfonate bromide (MTSET). They succeeded in monitoring the transport of the ion channel to the cell membrane with high sensitivity. Compared with the FRAC assay, our assay could be applied not only to the ion channels, but also to all kinds of membrane proteins as long as the fusion is active. This method employs a simple protocol and therefore is applicable to the high-throughput analysis of drugs or drug candidates on their effects on membrane protein expression. 15 This assay is conducted under physiologically comparable conditions to the cell. Thus, it might be used in conjunction with cellular signaling or other treatments. Bioluminescence from DL is saturated within a few seconds after adding luciferin and remains stable for at least 10 min. This characteristic is favorable for applying DL to high-throughput screening. We also found that this luminescence could be enhanced and further stabilized by adding nonionic detergent. This bioluminescence measurement is applicable not only to short-time-scale phenomena, but also to the long time-scale.
Footnotes
Acknowledgment
This work was supported in part by the National Institutes of Health (MH084691 and GM078579, to M.L.).
Author Disclosure Statement
No competing financial interests exist.
Abbreviations: ATP, adenosine 5′-triphosphate; BFA, Brefeldin A; BSA, bovine serum albumin; DL, dinoflagellate luciferase; DL3, dinoflagellate luciferase active domain 3; DMEM, Dulbecco's modified Eagle's medium; EDTA, ethylenediaminetetraacetic acid; ER, endoplasmic reticulum; FRAC, function recovery after chemobleaching; GPI, glycosylphosphatidylinositol; HA, hemagglutinin; MTSET, [2-(trimethyl-ammonium)ethyl] methanethiosulfonate bromide; PBS, phosphate-buffered saline; PDGFR, platelet-derived growth factor receptor; RLU, relative light units.