




Abstract
α7 nicotinic acetylcholine receptors (nAChRs) are characterized by relatively low ACh sensitivity, rapid activation, and fast desensitization kinetics. ACh/agonist evoked currents at the α7 nAChR are transient, and, typically, calcium flux responses are difficult to detect using conventional fluorometric assay techniques. One approach to study interactions of agonists with the α7 nAChR is by utilizing positive allosteric modulators (PAMs). In this study, we demonstrate that inclusion of type II PAMs such as PNU-120596, but not type I, can enable detection of endogenous α7 nAChR-mediated calcium responses in human neuroblastoma (IMR-32) cells. Using this approach, we characterized the pharmacological profile of nicotine, epibatidine, choline, and other nAChR agonists such as PNU-282987, SSR-180711, GTS-21, OH-GTS21, tropisetron, NS6784, and A-582941. The rank order potency of agonists well correlated with α7 nAChR binding affinities measured in brain membranes. Inhibition of calcium response by methyllycaconitine in the presence of increasing concentrations of PNU-282987 or PNU-120596 revealed that the IC50 value of methyllycaconitine was sensitive to varying concentrations of the agonist, but not that of the PAM. This format demonstrated the feasibility of this approach for high-throughput screening to identify small molecule, PAMs, which were further confirmed in electrophysiological assays of human α7 nAChR expressed in oocytes.
Introduction
Functionally, α7 nAChRs are characterized by relatively low ACh sensitivity, rapid activation and fast desensitization kinetics in the continued presence of the agonist. Accordingly, techniques such as single-cell imaging had to be adopted to evaluate rapid Ca2+ dynamics. 16 There are also reports showing the functional expression of α7 nAChRs by chimeric approaches or coupling to L-type Ca2+ channels, although these are seldom used in high-throughput functional assays. 7,17,18 A stable expression of functional human α7 nAChRs with cotransfection with RIC-3 in CHO-K1 cell line for the characterization of modulators of α7 nAChRs using Ca2+ flux and/or electrophysiological methods has been reported recently. 19 The discovery of chemically heterogeneous groups of molecules capable of differentially modifying nAChR properties without directly interacting with the ligand binding site prompted us to investigate how such ligands can modify agonist interactions at the α7 nAChR. Allosteric modulators are compounds that interact with the receptor on binding sites that are distinct from those sites identified for acetylcholine and other nicotinic receptor agonists and competitive antagonists. Based on the biophysical nature of allosteric interactions, at least two types of positive allosteric modulators (PAMs) have been recognized: 12,19,20 (1) predominantly affecting only the peak current response (type I profile) such as 5-hydroxyindole (5-HI), NS-1738, and others; (2) both peak current responses and time course of agonist-evoked response (type II profile) exemplified by PNU-120596. In this study, we demonstrate that inclusion of positive allosteric modulators, in particular those that affect receptor desensitization (type II), can enable detection of functional responses using FLIPR in cells natively expressing α7 nAChRs such as human neuroblastoma (IMR-32) cells and rat primary cortical neurons. We further characterized the pharmacology of α7 nAChR agonists, positive allosteric modulators, and antagonists in IMR-32 cells and demonstrated the utility of calcium flux assay in high-throughput screening (HTS) for the identification of novel chemical classes of PAMs, the latter further confirmed by electrophysiological experiments. Further, this approach enabled us to study the native pharmacology of α7 nAChRs using endogenous cells circumventing the need for establishing a stable cell line.
Materials And Methods
Compounds
(−)-Nicotine, epibatidine, choline, TC-2403, A-85380, mecamylamine, methyllycaconitine (MLA), tubocurarine, and α-bungarotoxin, 5-HI, were purchased from commercial sources. GTS-21, OH-GTS-21, PNU-282987, tropisetron, A-582941 (2-methyl-5-(6-phenyl-pyridazin-3-yl)-octahydro-pyrrolo [3,4-c]pyrrole), NS6784, SSR-180711 (4-bromophenyl 1,4diazabicyclo(3.2.2) nonane-4-carboxylate), and NS-1738 were purchased from commercial sources or synthesized in house.
Cell Culture
IMR-32 cells (American Type Culture Collection, Manassas, VA) were grown to confluence in 162 cm2 tissue culture flasks in minimum essential media supplemented with 10% fetal bovine serum, 1 mM sodium pyruvate, 0.1 mM nonessential amino acids, and 1% antibiotic–antimycotic. Cells were dissociated from flasks using cell dissociation buffer and 15,000 cells/well were plated using a Multidrop into 384 black-walled clear-bottom plates and maintained for 48 h in a tissue culture incubator at 37°C under an atmosphere of 5% CO2. Primary rat neonatal cortical neurons were isolated from newborn rat pups (E18) and cultured as described 21 and 10,000 cells/well were plated into a 384 black-walled clear-bottom poly-D-lysine-coated plates and maintained for 72 h in a tissue culture incubator at 37°C under an atmosphere of 5% CO2.
Fluorescence Assays
Changes in cellular Ca2+ levels or membrane potential responses were measured with minor modifications of protocols described previously. 22 A stock solution of the Ca2+ dye (calcium-3 no-wash assay kit; MDS Analytical Technologies, Sunnyvale, CA) was prepared by dissolving each vial supplied by the vendor in Hank's balanced salt solution buffer containing 20 mM HEPES, pH 7.4. The growth medium was removed and cells were loaded with 45 μL of the dye and incubated at room temperature for 2 h. Fluorescence measurements were read at 25°C at an excitation wavelength of 480 nm and an emission wavelength of 540 nm in FLIPR (MDS Analytical Technologies). Baseline fluorescence was measured for the first 10 s and then 15 μL of 5 × concentrations of modulator/test compounds was added to the cell plate and incubated for 3 min. The fluorescence intensity was captured every second for the first 1 min followed by every 5 s for an additional 2 min. This was followed by the addition of appropriate concentrations of agonist and readings were taken for a period of 3 min as described above. Membrane potential assays were carried out using membrane potential assay kit (MDS Analytical Technologies) and the protocol was similar to Ca2+ assay protocol except the assays were performed at an excitation wavelength of 480 nm using an emission filter above 550 nm (Catalog number 0310-4027; Molecular Devices, Sunnyvale, CA). The increase in fluorescence from FLIPR assays was determined (max-min signal) and is expressed as relative fluorescence units normalized to the maximal value. Concentration–response curves were fitted with variable slope sigmoidal curves generated by nonlinear regression analysis (GraphPad Prism, San Diego, CA) to obtain EC50 value. Data are presented as means ± standard error of the mean.
Binding Studies
Assay conditions were similar to those described by Anderson et al. 23 using membrane-enriched fractions from rat or human brain (minus cerebellum). Briefly, membrane-enriched fractions from rat brain were thawed, washed, and resuspended in 30 mL of BSS-Tris buffer (120 mM NaCl, 5 mM KCl, 2 mM CaCl2, 2 mM MgCl2, and 50 mM Tris-Cl, pH 7.4, 22°C). Samples containing 100–200 μg of protein, 5 nM [ 3 H]MLA (25 Ci/mmol; Tocris Bioscience, Ellisville, MO), and 0.1% bovine serum albumin (BSA; Sigma, St. Louis, MO) were incubated in a final volume of 500 μL for 60 min at 22°C. Nonspecific binding was determined in the presence of 10 μM MLA. Bound radioactivity was isolated by vacuum filtration onto Millipore MultiScreen harvest plates FB presoaked with 2% BSA. PerkinElmer MicroScint-20 scintillation cocktail (40 μL) was then added to each well, and bound radioactivity was determined using a PerkinElmer TopCount instrument. In experiments using human brain, EC50 values were compared with the binding affinities for the displacement of [3H]585539. Competition binding curves were fitted with GraphPad Prism software and Ki values were calculated by the Cheng–Prusoff equation.
Electrophysiology
Electrophysiological recordings were conducted using Xenopus laevis oocytes as described earlier. 19 Briefly, isolated oocytes were injected with human α7 nAChR cRNA and kept at 18°C in a humidified incubator in modified Barth's solution and used 2–7 days after injection. Responses were measured by two-electrode voltage clamp using parallel oocyte electrophysiology test station. 24 During recordings, the oocytes were bathed in Ba2+ OR-2 solution (in mM: 90 NaCl, 2.5 KCl, 2.5 BaCl2, 1.0 MgCl2, 5.0 HEPES, 0.0005 atropine, pH = 7.4) and held at −60 mV at room temperature. Test modulators were added for 60 s before application of agonist (1 s at 6 mL/s) and response of the agonist was recorded. The agonist responses obtained in the presence or absence of PAM was normalized to 100 μM ACh without PAM. Data are presented as means ± standard deviation.
Results
Characterization of Responses Evoked by α7 Selective Agonist, PNU-282987
As shown in Figure 1, application of α7 nAChR agonist PNU-282987 alone did not evoke any Ca2+ in IMR-32 cells. Similarly, the α7 modulator, PNU-120596 alone did not evoke any changes in relative fluorescence units compared with baseline. However, pretreatment of cells with the positive allosteric modulator PNU-120596 at 10 μM markedly increased Ca2+ responses when subsequently challenged with the α-7 agonist PNU-282987. The increase in calcium response was observed only with type II modulators, but not with type I such as NS-1738 or 5-HI.
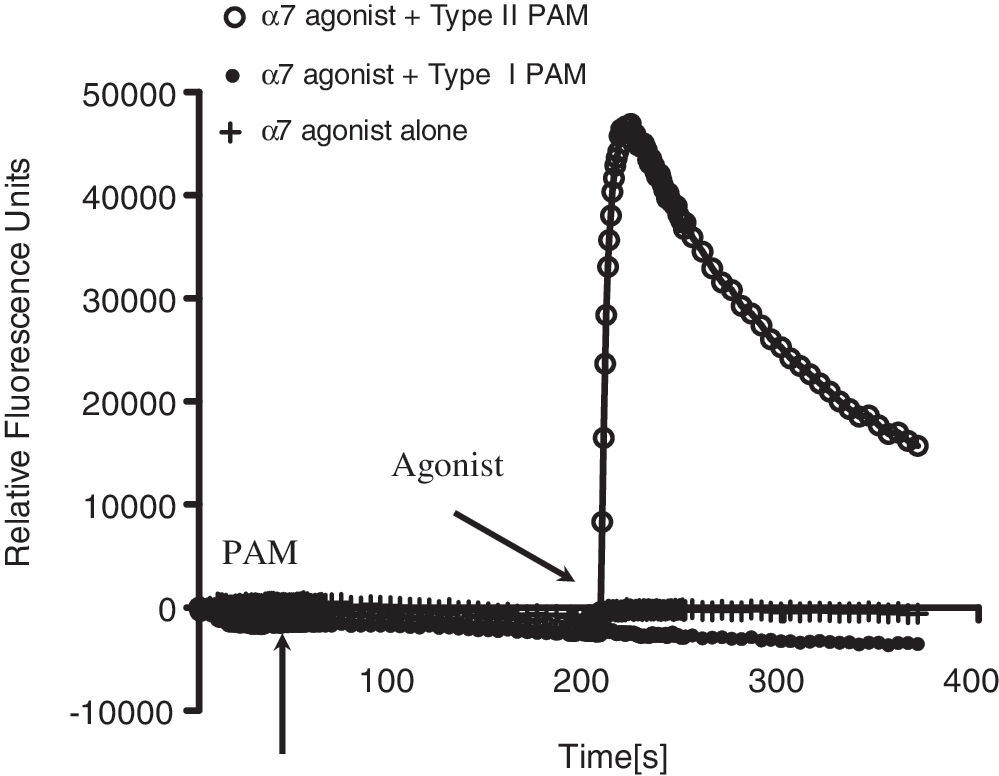
Increases in Ca2+ responses by α7 nicotinic acetylcholine receptor (nAChR) selective agonist in the presence of positive allosteric modulator (PAM) in IMR-32 cells. α7 nAChR selective agonists alone did not evoke any Ca2+ flux by itself, but revealed robust Ca2+ responses in the presence of the PAM, PNU-120596. Such responses were observed with type II PAMs, but not type 1 PAMs (NS-1738).
The responses of PNU-282987 were measured at varying concentrations of the positive allosteric modulator, PNU-120596 (Fig. 2). PNU-282987 did not elicit any calcium response in the absence of PNU-120596. As shown in Figure 2A, at a PAM concentration of 0.3 μM, the observed efficacy is only 30%, and the EC50 of PNU-282987 was 0.18 ± 0.07 μM (n = 8). At higher concentrations of PNU-120596 (1–30 μM), the EC50 of PNU-282987 was shifted to the left with maximal values achieved at 10 μM PAM (EC50 = 0.061 ± 0.01 μM). At any given concentration of PAM, agonist efficacy increases with its increasing concentration and then reaches a plateau. Figure 2B summarizes the relationship of agonist EC50 as a function of test concentrations of the PAM. In addition to the potency, the efficacy of agonist was also increased in a concentration-dependent manner, which was saturable at higher concentrations of the modulator.
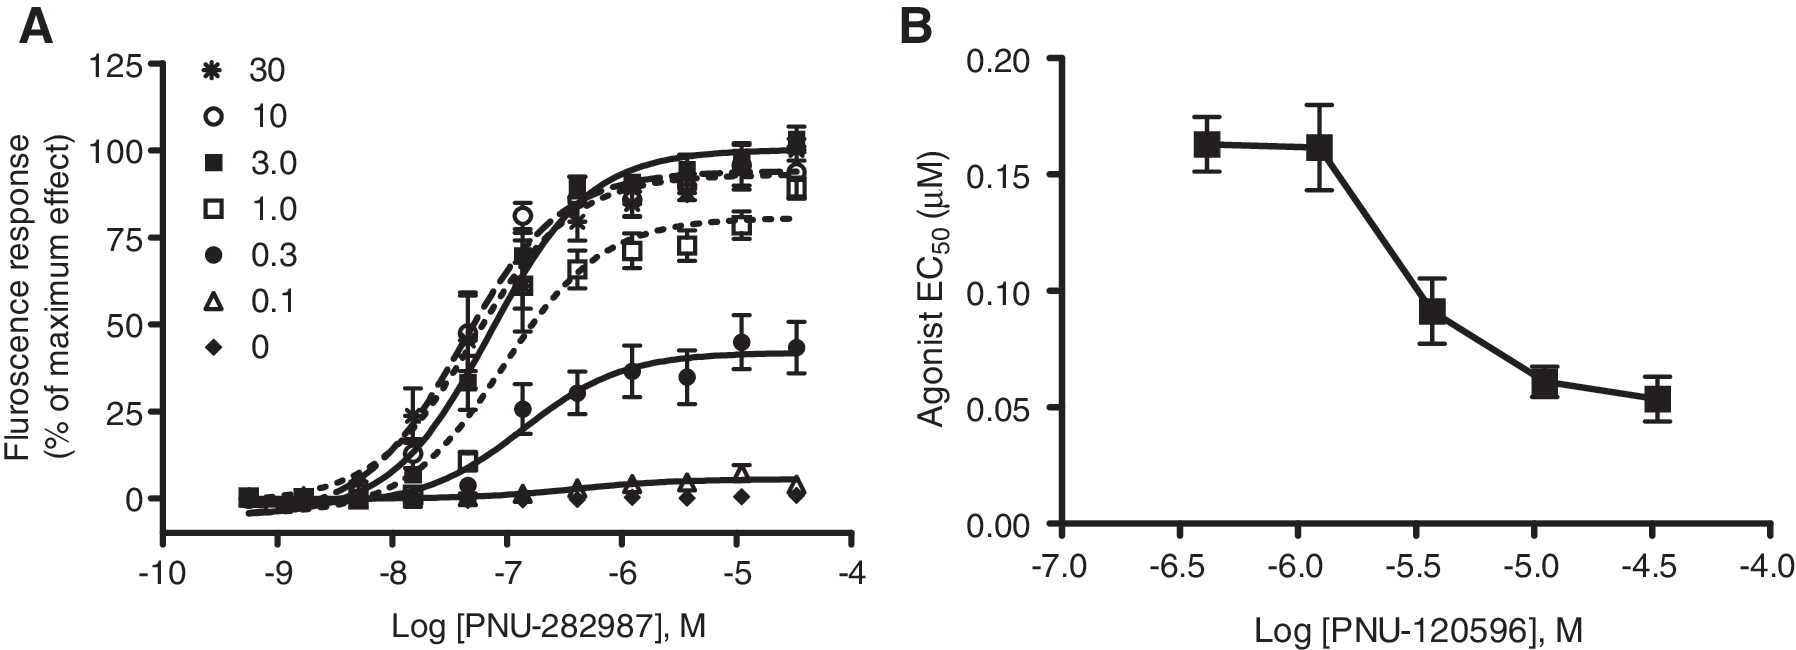
The potency of PAM is dependent on the concentration of the agonist.
Figure 3A shows concentration–response curves of PAM with varying concentrations of the agonist. PAM alone did not elicit a response in the absence of an agonist. The EC50 of PNU-120596 was in the micromolar range (5 μM) at 0.01 μM of agonist and the responses were negligible at lower concentration of agonists (<0.01 μM). However, at agonist concentrations of ≥0.1 μM, the potency of the modulator was left-shifted (as e.g., EC50 = 0.6 μM at 1 μM agonist). Figure 3B illustrates the relationship of PAM EC50 as a function of agonist concentration. As expected, increasing concentrations of agonist resulted in higher potency for the modulator (lower EC50). This study illustrates the property of positive allosteric modulator where the modulator affects the potency of agonist that would progressively approach a limit depending on the cooperative factor. In this case, cooperativity represents the strength and direct interaction between the agonist and allosteric modulator with the receptor.
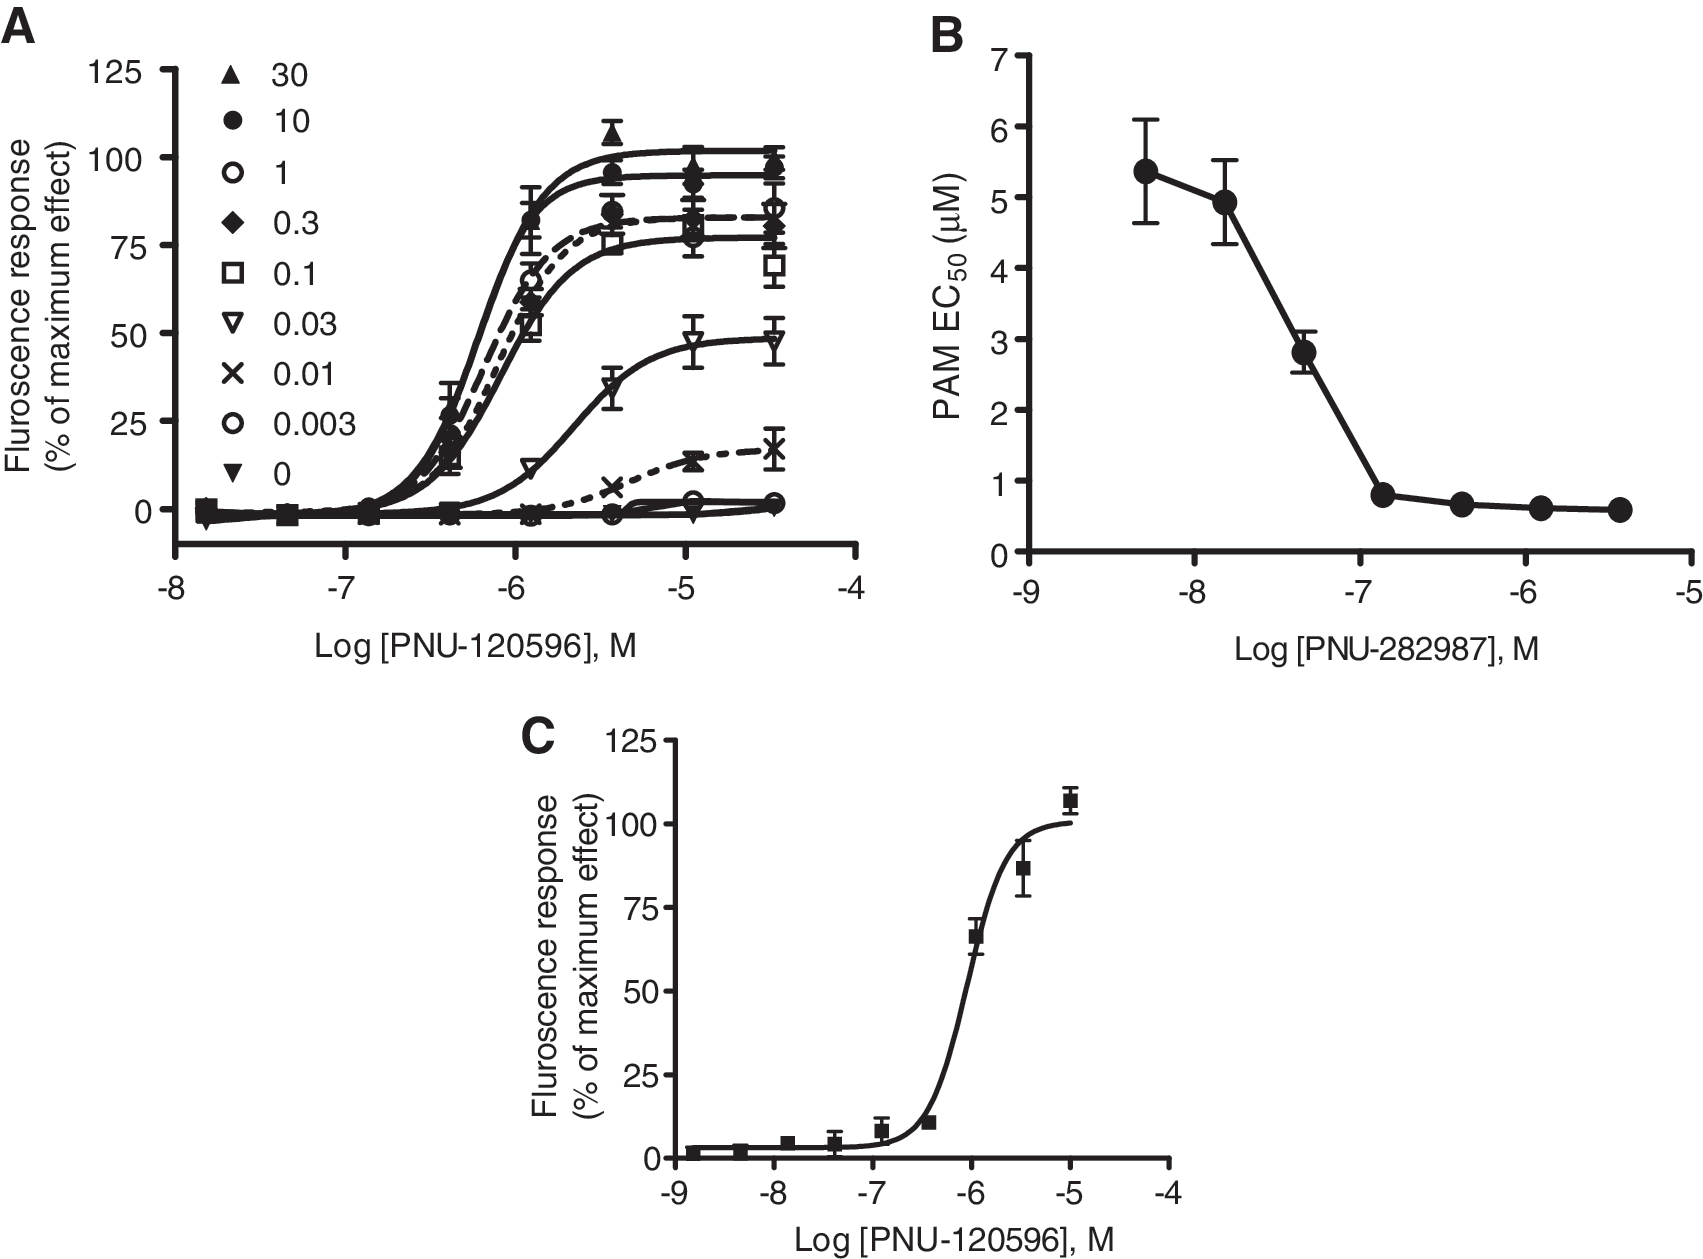
Efficacy and potency of the PAM depends on the concentration of the agonist.
These functional effects were also replicated in a fluorescence-based membrane potential assay. Similar to calcium assay, there was no change in the basal membrane potential when the cells treated with the positive allosteric modulator, PNU-120596, or α7 agonist PNU-282987 alone (data not shown). In the presence of PNU-120596, PNU-282987 elicited a concentration-dependent increase in membrane potential (Fig. 3C). PNU-120596 displayed an EC50 value of 0.65 ± 0.25 μM with 1 μM agonist (Fig. 3C), values similar to the calcium assay. This supports the notion that membrane potential changes indicate a measure of nicotinic receptor activity, and the resulting depolarization may be a trigger for Ca2+ flux responses.
The observed functional effects could also be reproduced in primary cortical neurons. Similar to IMR-32 cells, PNU-282987 elicited a concentration-dependent increase in Ca2+ responses in cortical neurons in the presence of PNU-120596 at 10 μM (Fig. 4). The EC50 value of PNU-282987 (0.023 ± 0.003 μM) was comparable to that observed in IMR-32 cells (0.061 ± 0.01 μM) at 10 μM of PNU-120596.
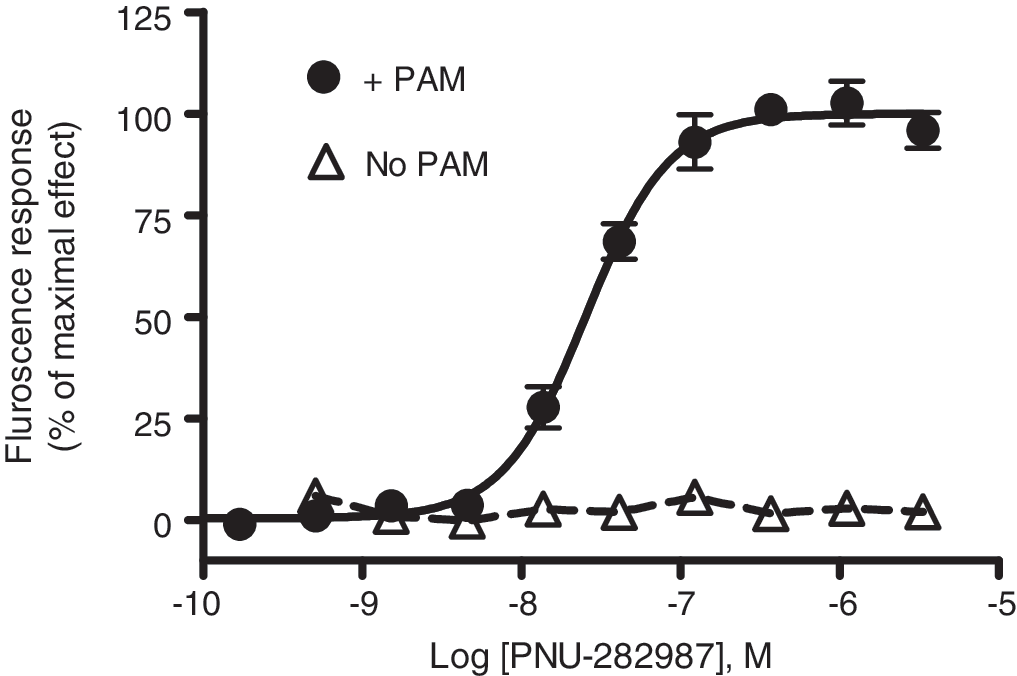
Effect of PAM on the agonist-induced Ca2+ responses in rat primary cortical neurons in culture. PNU-282987 elicited a concentration-dependent increase in Ca2+ responses in cortical neurons in the presence of PNU-120596 (EC50 = 0.023 ± 0.003 μM). The data presented are means ± SEM of n = 3 performed in quadruplicate wells.
Pharmacology of α7 nAChR Agonist Responses
In addition to PNU-282987, other structurally diverse compounds known to activate α7 nAChRs were evaluated in IMR-32 cells. These include SSR-180711, A-582491, tropisetron, GTS-21, OH-GTS-21, NS6784, and choline. In the absence of PAM, no responses were evoked. However, in the presence of PNU-120596 at 10 μM, concentration-dependent Ca2+ responses were evoked with the following rank order potency: PNU-282987 ∼ NS6784 >tropisetron ∼ SSR-180711 > A-582941 ∼ OH-GTS21 > GTS-21 > > choline (Table 1).
Pharmacological Profile of α7 Nicotinic Acetylcholine Receptor Agonists in IMR-32 Cells (in the Presence of PNU-120596 at 10 μM)
Other nAChR agonists such as (−)-nicotine, epibatidine, A-85380, and TC-2403 were also evaluated in the presence and in the absence of PNU-120596 at 10 μM. These nonselective agonists elicited responses in the absence of modulator, attributable to their known interactions with other nAChR subtypes (for example α3-containing nAChRs) that are also expressed in IMR-32 cells (Table 2). These responses were further amplified when assays were conducted in the presence of the PAM. For example, the effect of PNU-120596 on responses evoked by nicotine in IMR-32 cells is shown in Figure 5. Subtraction of traces in the absence and presence of PAM revealed fractional responses attributable to the α7 nAChR component (EC50 value = 2.3 ± 0.53 μM). Similar analysis of responses evoked by epibatidine revealed EC50 values of 15.3 nM. Responses of A-85380 and TC-2403 were also amplified in the presence of the modulator (Table 2).
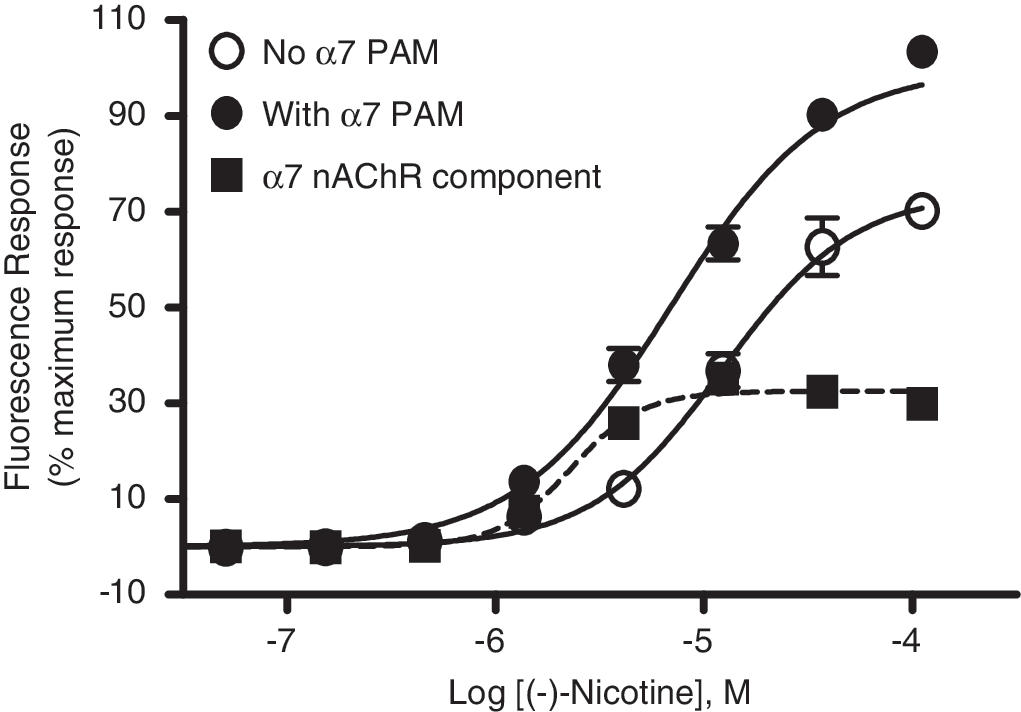
Concentration responses of nicotine in IMR-32 cells in the presence (solid circle) and in the absence of PAM (empty circle). Also shown in a subtracted concentration–response curve (EC50 = 2.29 ± 0.53 μM), defining the α7 nAChR component revealed by PAM. Error bars represent means ± SEM of n = 7 performed in triplicate wells.
Pharmacological Profile of Nicotine and Other Nicotinic Acetylcholine Receptor Agonists in IMR-32 Cells (in the Presence of PNU-120596 at 10 μM)
The percent maximal response obtained by subtracting responses obtained with or without inclusion of α7 nAChR PAM represents the α7 nAChR component.
Pharmacology of α7 nAChR Antagonists
Concentration–response effects of the antagonist MLA were assessed in the presence of varying concentrations of agonists (Fig. 6A). For the antagonist experiments, the modulator was added to the cells along with a coaddition of varying concentration of antagonist followed by agonist in the second addition. The IC50 value of the MLA was dependent on agonist concentration, and shifted with increasing concentrations of the agonist (Fig. 6A). For example, the IC50 value of MLA was found to be 3 nM at 0.3 μM of the agonist concentration, whereas the corresponding value was 86 nM at 30 μM agonist concentration, demonstrating the competitive nature of MLA at the agonist site. However, concentration response of MLA in the presence of varying concentrations of PAM (1, 3, 10, and 30 μM) and with a fixed agonist concentration (1 μM) showed a noncompetitive behavior as shown in Figure 6B. Although the maximal evoked responses were different, MLA was able to inhibit responses in a concentration-dependent manner with similar IC50 values (2–7 nM) irrespective of the concentration of the PAM. This shows that MLA is not competitive to the modulator site and it is competing with the agonist at its orthosteric site.

Agonist and PAM interactions with methyllycaconitine (MLA)
Other compounds such as α-bungarotoxin, mecamylamine, tubocurarine, and DHβE were also evaluated for their antagonist effects (Table 3), and the following rank order of potencies was observed: α-bungarotoxin > MLA > tubocurarine > mecamylamine. DHβE was inactive in inhibiting α7-nAChR-mediated response up to 30 μM (data not shown), but inhibited non-α7 nAChR responses of nicotine with IC50 value in the μM range.
Inhibition of Agonist-Evoked Ca2+ Responses in IMR-32 Cells (in the Presence of PNU-120596 at 10 μM)
Figure 7A shows a correlation plot of agonist EC50 values measured in Ca2+ flux assays versus Ki values of these ligands to displace [3H]MLA binding in rat cortex. The binding affinity of seven reference agonists with their functional EC50 in FLIPR generated a significant correlation (r 2 = 0.75). Similarly, EC50 values of compounds versus the Ki value to displace [3H]585539 binding in human brain (data taken from Anderson et al. 23 ) revealed a correlation coefficient of 0.91 (Fig. 7B).

Correlation of EC50 values of agonists versus binding Ki values.
HTS for α7 nAChR Ligands
Initial validation studies were conducted using a modulator concentration of 10 μM with an α7 agonist concentration of 3 μM that elicited robust fluorescent signal and provided a Z′ value of 0.70. We used the α7 agonist NS6784 (3 μM) along with PNU modulator (10 μM) to evoke calcium response in positive control wells. The properties of NS6784 have been previously characterized by Briggs et al. 25 NS6784 demonstrated an EC50 value of 0.056 ± 0.005 μM with an efficacy similar to PNU-282987 in the calcium flux assay. Similar to PNU-282987, NS6784 displayed α7-mediated calcium response only in the presence of type II inhibitors, not with type I. Screening was performed using a subset library of 120,000 compounds at a screening concentration of 10 μM and at a dimethyl sulfoxide concentration of 0.2%. The maximal tolerable dimethyl sulfoxide concentration in the assay was 0.5%. A detailed protocol for the HTS is outlined in Table 4. In the first addition, the compounds were added to the cells followed by the addition of agonist in the second addition. Compounds that are α7 nAChR PAMs resulted in fluorescence responses only in the second sequence upon addition of α7-selective agonist. Compounds that elicit a Ca2+ response via activation of other endogenous receptors were differentiated by signals obtained in the first addition sequence. The picks from the primary screen were tested in FLIPR in a concentration-dependent manner with NS6784 (at 3 μM). The screen yielded 34 hits with EC50 value < 30 μM. The hit rate from the screen was 0.03% and this was quite low compared with typical HTS campaigns, although several classes of compounds were identified from the screen. The hits from the screen include 4-naphthalene-1-yl-3a,4,5, 9b-tetrahydro-3-H-cyclopenta[c]quinoline-8-sulfonic acid amide (TQS) and pyrrole-sulfonamide analogs such as A-549291. TQS and A-549291 alone did not evoke calcium responses up to the maximum concentration tested (30 μM). In the presence of NS6784, concentration-dependent responses were observed with TQS and A-549291 with EC50 values of 1.0 and 0.33 μM, respectively. These compounds elicited similar EC50 values with PNU-282987 (data not shown). The structure of the reference compounds along with the selected hits identified from the screen is depicted in Fig. 8.

Structure of representative hits and other reference compounds used in this study.
High-Throughput Screening Assay Protocol Table
Positive control, PNU modulator (10 μM) followed by NS6784 (3 μM); negative control, buffer followed by NS6784.
The activity of pyrrole-sulfonamide analogs and TQS was confirmed by two-electrode voltage clamp studies using Xenopus oocytes. Similar to Ca2+ flux assay, A-549291 did not evoke α7 nAChR responses alone. Under similar conditions, ACh and α7 selective agonists such as PNU-282987 were effective in evoking currents. 20 A-549291 at 0.3 and 3 μM potentiated effects when coapplied with a submaximal concentration of ACh (100 μM) by increasing apparent current amplitude and prolonging the time course of responses (Fig. 9A). A-549291 at 3 μM enhanced the peak response of ACh (100 μM) at least by 3-fold. The potency of compound to enhance the ACh response was 0.33 μM (Fig. 9B) which was similar to the EC50 observed in FLIPR. Figure 9C shows the concentration response of ACh in the continued presence of 3 μM A-549291. The potency as well as the amplitude of ACh was modulated with this compound (Fig. 9C). The EC50 of ACh was left-shifted in the presence of A-549291 to 43 μM (EC50 of ACh alone is 137 μM). Similar observations were noticed with other pyrrole-sulfonamide analogs (data not shown) and TQS as previously reported by Grønlien et al. 20 The EC50 of TQS was 3 μM, and was efficacious in amplifying the ACh response by 4-fold with a shift in ACh potency to 19 μM. Therefore, similar to PNU 120596, A-549291 and TQS modified ACh response to a nondecaying or weakly decaying current, characteristic feature of type II modulators.

Enhancement of ACh-evoked α7 current responses by A-549291 measured in Xenopus oocytes.
Discussion
In this study, we demonstrate that inclusion of type II PAMs could enable the detection of α7 nAChR-mediated Ca2+ responses in cells expressing native α7 nAChR subunits in human neuroblastoma (IMR-32) cells and in rat primary cortical neurons. The pharmacology of α7 nAChRs in IMR-32 cells was then characterized using selective agonists, positive allosteric modulators, and antagonists. We further demonstrated the utility of this approach as a high-throughput screen to identify novel positive allosteric modulators.
Identification and characterization of functional pharmacology in cells endogenously expressing α7 nAChRs has been typically challenging. Although direct electrophysiological measurements using two-electrode voltage clamp in Xenopus oocytes or patch clamp in mammalian cells remains the gold standard for most accurate determination of evaluation of biophysical and pharmacological interactions at α7 nAChRs, automated electrophysiology techniques have only recently emerged. 26 Such platforms have not advanced to the point of utility for the HTS of ligand-gated ion channels. However, the activity of ion channel targets, such as the α7 nAChRs, that modulate Ca2+ permeability and/or alter membrane potential can be measured using appropriate Ca2+-sensitive or membrane potential dyes using the FLIPR in a multiwell HTS format. Since agonist-evoked α7 nAChR currents are typically transient, functional Ca2+ responses are difficult to detect due to the slower sampling frequency in FLIPR. Zwart et al. 27 reported a Ca2+ imaging experiment (fura-2) on IMR-32 cells with agonist alone (AR-R17779) showing 4% increases in response over baseline. Strategies to study α7 nAChRs in mammalian cells include overexpression in HEK-293 cell line, 28 coupling to endogenous calcium currents in GH3 cells, 17 and coexpression with ancillary proteins such as RIC-3 20,29 or utilization of various chimeric constructs 30 (e.g., α7/5-HT3). The identification of structurally distinct PAMs that typically do not have intrinsic activity at the receptor, but could amplify responses to agonists have enabled utilization of approaches such as that described in this study, for functional analysis of α7 nAChRs. Initially known PAMs, including BSA, acetylcholinesterase-derived peptide, SLURP-1, and small molecules such as galanthamine and 5-HI, were weak and nonselective. 31 However, more recently, small molecules capable of differentially modulating nAChR properties have emerged. 14
In our study, structurally distinct α7 selective agonists alone did not evoke any functional responses in IMR-32 cells, but revealed robust Ca2+ and membrane potential responses in the presence of positive allosteric type II modulators such as PNU-120596. Since type I PAMs predominantly affect current amplitude and do not affect current decay (agonist-evoked currents decay rapidly within ms time scale), the time resolution of FLIPR imaging is not sensitive to pick these changes. In contrast, type II PAMs such as PNU-120596 32 and TQS 20 prevent the desensitization of the receptors and slow down the current decay. This allows the Ca2+ signal to be detected adequately in the FLIPR assay in IMR32 cells or in primary cortical neurons. The potency of PNU-282987 (EC50 = 0.06 μM) observed with PNU-120596 is similar to the agonist activity observed at the α7/5-HT3 chimeric receptor 15 (EC50 = 0.13 μM). Similarly, the potency of the PAM, PNU-120596, was identical in the calcium and membrane potential assay and our data in IMR-32 cells agreed well with the potency (0.22 μM) observed in SH-EP1 cells expressing a variant of α7. 31 PNU-120596 also enhanced the α7 agonist responses in oocytes expressing α7 nAChRs with an EC50 value of 2.5 μM. 20 As reported earlier, 12 no calcium responses were observed in the presence of type I PAMs such as 5-HI or NS-1738 (Fig. 1), as these compounds do not modify current desensitization kinetics. Our observation in IMR-32 cells is further supported by the study of Roncarati et al., 19 where no Ca2+ influx was measured upon addition of agonists alone or together with allosteric potentiators such as 5-HI in a CHO cell line overexpressed with α7 and RIC-3. In addition to type II PAM effects, type I PAM activity was robustly detected using the FLIPR assay by Dunlop et al. 33 in GH4C1 cells expressing α7 nAChRs. 5-HI produced a leftward shift of the nicotine concentration–response curve in combination with a potentiation of the maximum evoked response to nicotine. In GH4C1 cells, the α7 agonist-evoked signal depends on the involvement of downstream-activated voltage-sensitive Ca2+ channels, and this amplification process may underlie the fluorescence responses detected for both type I and II PAMs. The overexpression of α7 receptors in GH4C1 cells and its preferential coupling to L-type calcium channel might explain the discrepancy in the activity of type I PAMs observed in our study in IMR32 and cortical neurons versus that reported by Dunlop and coworkers.
The activity of PAM is known to be dependent on the measure of affinity of the PAM, and the degree of cooperativity, which is unique to the allosteric–orthosteric ligand pair. 34 In our studies, we used a selective α7 nAChR agonist (PNU-282987) instead of the endogenous transmitter, Ach, or the prototypical agonist nicotine, since these agonists can activate muscarinic and other nAChR subtypes endogenously expressed in IMR-32 cells. When an agonist binds to the receptor in the presence of allosteric modulator, the potency of agonist is modified by a factor denoted by its cooperativity constant (α). As the value of α continues to increase, the concentration of allosteric modulator needed to achieve the maximal response decreases. Similarly, the magnitude of α depends on the agonist concentration used in the assay. In our study, increasing concentrations of the modulator (PNU-120596) increased the potency of agonist by ∼3-fold (Fig. 2). Likewise, the potency of the PAM is also increased about 5-fold with increasing concentrations of the agonist (Fig. 3). Inhibition studies with MLA provide evidence that the PAM binds to a site distinct from the orthosteric site where the agonist/antagonist bind. As shown in Figure 6, the potency of MLA is shifted with increasing concentrations of the agonist, whereas no shift in potency is observed with increasing concentrations of the modulator. A recent publication 35 raised the possibility that MLA may not be a pure competitive antagonist of α7 nAChRs based on the displacement studies carried out with alpha-bungarotoxin as well as its ability to block channel function. Our observations have been further confirmed by the study of Ween et al., 36 where MLA (300 nM) displayed a competitive antagonism, shifting the concentration responses of α7 agonist, NS6784, to the right by 2-log units. This supports the notion that MLA is competitive at the orthosteric, but not at the allosteric site defined by PNU-120596. This was supported by the existence of distinct allosteric binding sites for different profiles of allosteric modulators. 37
In addition to PNU-282987, a number of structurally diverse analogs, including those derived from diamine (A-582941, SSR-180711), tropane (tropisetron), and anabaseine (GTS-21, OH-GTS21), choline, and NS6784 series increased Ca2+ flux responses in the presence of PAM, but not when applied alone (Table 1). Although choline has been described as a selective agonist of α7 neuronal nAChRs, 38 its selectivity for α 7 neuronal nAChRs is not conclusive. In IMR32 cells, under the experimental conditions, choline did not evoke any calcium response up to 1 mM in the absence of modulator, suggesting its interaction with α7 nAChRs. Other ligands such as nicotine, epibatidine, and A-85380 by themselves evoked Ca2+ responses in IMR-32 cells (attributable to interaction with α3-containing nAChRs), but effects were further enhanced in a concentration-dependent manner in the presence of PAM. The potency of selective agonists and nonselective agonists correlated well with the studies reported by Dunlop et al. in GH4C1 cells. 33 The EC50 values for various agonists measured in the presence of PAM show a good correlation with the binding Ki values. Further, PNU-282987-evoked Ca2+ responses were inhibited in a concentration-dependent manner by known α7 antagonists such as α-bungarotoxin and MLA, and to a lesser extent, by d-tubocurarine and mecamylamine.
The assay format utilized here allowed us to conduct a HTS of ∼120K library for identifying positive allosteric modulators. In addition to pyrrole-sulfonamide analogs such as A-549291, and quinoline sulfonic acid amides analog represented by TQS shown in the results, the screen identified novel hits for further characterization. In electrophysiological studies, hits exhibited typical type II profile, evoking increases in apparent peak current, while prolonging desensitization. The potencies of these compounds measured in Ca2+ flux assays were comparable to data from electrophysiological studies conducted in oocytes injected with α7 cRNA. Further characterization of novel pyrrole analogs related to A-549291 identified from this screen has been reported elsewhere. 38 –40 In summary, our studies characterized the functional response of α7 nAChR agonists using type II PAMs and enabled a high-throughput screen that identified novel positive allosteric modulators. Targeting the allosteric binding site of α7 nAChRs by positive allosteric modulators represents an alternative mechanism for selectively modulating the function of α7 nAChRs. Such compounds may have potential for treating a variety of cognitive and neurodegenerative and neuropsychiatic disorders such as Alzheimer's disease and schizophrenia.
Footnotes
Acknowledgments
The authors thank Dr. Pamela Puttfarcken (Neuroscience Research, Abbott Laboratories, Abbott Park, IL) for generously providing the cultured rat cortical neurons.
Disclosure Statement
No competing financial interests exist.