
Abstract
The voltage-gated potassium channel, human Ether-à-go-go related gene (hERG), represents the molecular component of IKr, one of the potassium currents involved in cardiac action potential repolarization. Inhibition of IKr increases the duration of the ventricular action potential, reflected as a prolongation of the QT interval in the electrocardiogram, and increases the risk for potentially fatal ventricular arrhythmias. Because hERG is an appropriate surrogate for IKr, hERG assays that can identify potential safety liabilities of compounds during lead identification and optimization have been implemented. Although the gold standard for hERG evaluation is electrophysiology, this technique, even with the medium capacity, automated instruments that are currently available, does not meet the throughput demands for supporting typical medicinal chemistry efforts in the pharmaceutical environment. Assays that could provide reliable molecular pharmacology data, while operating in high capacity mode, are therefore desirable. In the present study, we describe a high-capacity, 384- and 1,536-well plate, functional thallium flux assay for the hERG channel that fulfills these criteria. This assay was optimized and validated using different structural classes of hERG inhibitors. An excellent correlation was found between the potency of these agents in the thallium flux assay and in electrophysiological recordings of channel activity using the QPatch automated patch platform. Extension of this study to include 991 medicinal chemistry compounds from different internal drug development programs indicated that the thallium flux assay was a good predictor of in vitro hERG activity. These data suggest that the hERG thallium flux assay can play an important role in supporting drug development efforts.
Introduction
Materials and Methods
Materials
FluxOR thallium detection kit (F10017) and E-4031 (PV5366) were obtained from Life Technologies. Dimethyl sulfoxide anhydrous (DMSO) (#276855), astemizole (A2861), sotalol (S0278), cisapride (C4740), haloperidol (H1512), pimozide (P1793), risperidone (R3030), verapamil (V4629), terfenadine (T9652), and ouabain (O3125) were obtained from Sigma-Aldrich (St. Louis MO). MK-499 and 35S-MK-499 were synthesized at Merck Research Labs (Rahway, NJ). All other reagents were obtained from commercial sources and were of the highest purity commercially available.
Compound Plates
Individual compound stock solutions were prepared in 100% DMSO, and distributed into aliquots. Aliquots of these solutions were used in all QPatch, 35S-MK-499 binding, and FluxOR 384-well plate experiments. Half-log dilutions that extended 10 concentrations were manually prepared in 100% DMSO in a 96-well polypropylene plate (#3365; Corning Inc., Corning, NY). The 10-point concentration–response curves were diluted to the final 1× concentration in buffer, maintaining a final vehicle concentration of ≤1%, in a 96-well polypropylene plate (SB43324-NS7; Dot Scientific, Inc., Burton, MI).
Cells
All tissue culture media were from Life Technologies. The HEK293 cell line stably transfected with hERG used for the FluxOR assay was obtained as previously described. 14 HEK293 cells were grown in minimum essential media (MEM) alpha medium (#12561), 10% fetal bovine serum (#16000), 500 μg/mL geneticin (#10131), 1× penicillin streptomycin glutamine (#10378), and 1× MEM nonessential amino acids (#11140), and maintained at 37°C in a 10% CO2 atmosphere. In initial studies, both a CHO-hERG- and HEK-hERG-expressing cell lines were tested in the FluxOR thallium assay, but it was determined that the HEK-hERG cell line gave much better overall performance. Control signals in the CHO-hERG cell line were smaller than those observed in the HEK-hERG cell line, under identical experimental conditions. In addition, background signals in the presence of saturating concentrations of hERG inhibitors were more prominent in the CHO-hERG cell line. As a consequence, the signal-to-noise ratio was significantly higher in the HEK-hERG cell line. The factors contributing to the elevated background signal in CHO-hERG cells are not known, but we have consistently observed this pattern in CHO cells regardless of the expressed channel.
Electrophysiological Assay
hERG was expressed in CHO cells using the Flp-In™ system (Life Technologies). Cells were maintained in F-12 medium containing 10% fetal bovine serum, 100 U/mL penicillin, 100 μg/mL streptomycin, 200 μg/mL hygromycin at 37°C with 5% CO2 and then transferred to a 30°C incubator for 1–3 days before experiments to improve expression levels and current stability. The CHO hERG cell line was used for electrophysiological experiments because it displayed improved seal rates, seal resistances, and current stability on the QPatch relative to the HEK hERG cell line used in the thallium flux experiments. An extensive review of published in vitro potency values for a range of hERG inhibitors 15 shows that there is good agreement between data obtained for hERG expressed in either HEK or CHO backgrounds.
On the day of the experiment, a T175 flask with hERG cells was rinsed three times with 10 mL of Dulbecco's phosphate buffered saline (DPBS) (Ca/Mg free). The Ca/Mg-free medium was poured off and 6 mL of accutase was added to the cells for 10 min at 37°C. The cells were mechanically removed and subjected to centrifugation at 1,400 rpm for 3 min 45 s. Cells were then re-suspended in 10 mL of growth media (conditioned from the original T175 flask), allowed to recover for 30 min, and then pelleted again at 1,400 rpm for 3 min 45 s. Supernatant was discarded and cells were resuspended in 10 mL of saline. Cells were subjected to centrifugation one final time at 1,100 rpm for 4 min, resuspended in 500 μL of saline, and placed in the QPatch for use.
Whole-cell patch-clamp experiments were carried out on the QPatch-HT automated platform (Sophion Bioscience, Ballerup, Denmark) utilizing an external solution containing (in mM): 151 NaCl, 4 KCl, 1.8 CaCl2, 1 MgCl2, 10 HEPES (pH 7.4), and an internal solution containing (in mM) 120 KCl, 1.5 MgCl2, 10 EGTA, 10 HEPES, and 4 ATP. Peak tail currents were measured using Sophion's Assay Software and further data analyses were performed using IgorPro (Wavemetrics, Portland, OR) or GraphPad Prism (GraphPad Software, La Jolla, CA).
35S-MK-499 Binding Assay
The interaction of 35S-MK-499 with membranes prepared from HEK293 cells expressing hERG was determined using a modification of a previously described procedure. 14 Unless otherwise noted, all binding assay reagents were obtained from Perkin Elmer (Waltham, MA). Briefly, the 35S-MK-499 tracer was prepared at ∼50 pM in assay buffer containing (in mM): 70 NaCl, 60 KCl, 1 CaCl2, 2 MgCl2 and 10 HEPES-NaOH (pH 7.4), and 0.25 mL of the diluted tracer was dispensed into a 2 mL, 96-square-well polypropylene deep-well block (#3960; Corning, Inc.). Compounds prepared as described above were added to the appropriate wells. Nonspecific binding was defined in the presence of 1 μM unlabeled MK-499. HEK-hERG membranes diluted in assay buffer were added to the tracer/compound solution and incubation took place for a minimum of 90 min at ambient temperature. The reaction was quenched and the assay block was washed twice with ∼0.5 mL of quench buffer containing (in mM) 130 NaCl, 1 CaCl2, 2 MgCl2, and 10 HEPES-NaOH (pH 7.4). Radioligand bound to hERG was captured on a UniFilter-96 GF/C white, 96-well filtered microplate (#6005174), presoaked with 0.3% bovine serum albumin, using a Filter Mate Universal Harvester (Perkin Elmer, Inc.). The filter plate was allowed to dry completely before sealing the bottom. Each well was treated with 0.025 mL Microscint 0 before sealing the top of the plate and then analyzed for 1 min/well in a TopCount NXT scintillation counter.
FluxOR Thallium Assay (384-Well Plates)
HEK293 cells stably transfected with hERG were plated using a Thermo Scientific Matrix WellMate (Thermo Scientific, Inc., Waltham, MA) at ∼30,000 cells/well on a BioCoat™ flat bottom, poly-D-lysine–coated black-wall, clear-bottom, 384-well plate (#356697; Becton Dickinson, Franklin Lakes, NJ) in 50 μL growth medium, and incubated overnight (16–20 h) at 37°C in a 10% CO2 atmosphere. All liquid handling was done on a Thermo Scientific Matrix PlateMate 2 × 3, unless otherwise noted. Cell growth medium was removed and cells were then incubated with 0.025 mL of a solution containing FluxOR dye loading reagent, prepared according to the manufacturer's instructions in Hank's buffered saline solution (HBSS) containing CaCl2 and MgCl2 (#14025; Life Technologies), pH adjusted to 7.4 by addition of NaOH. After incubation in the dark for 60 min at 25°C, cells were washed once with 0.040 mL of assay buffer solution containing (in mM) 1.3 CaCl2, 0.9 MgCl2, 5.5 Glucose, and 20 HEPES-NaOH (pH 7.4), with different amounts of KCl/NaCl as specifically outlined, and incubated in the dark for 30 min at 25°C with 0.025 mL of the same assay buffer solution containing 2.5 mM probenecid, and 300 μM ouabain, in the absence or presence of test compound. Ouabain was found to further attenuate the background signal determined in the presence of saturating concentrations of hERG inhibitors, suggesting a contribution of the sodium–potassium ATPase pump to the thallium flux signal in the absence of ouabain. At the end of the 30 min incubation period, the plate was placed in a FLIPRTETRA instrument (Molecular Devices, Sunnyvale, CA), illuminated at 490 nm, and fluorescence emission was recorded at 525 nm. After a 30 s baseline reading, 0.00625 mL of a 5× solution containing 15 mM thallium sulfate, with or without 50 mM K2SO4, prepared in the FluxOR chloride-free buffer was added, and fluorescence emission was recorded for an additional 3–6 min, with an exposure time of 0.4 s and a read interval of 3–5 s. The change in fluorescence emission (F/F 0) was calculated by averaging the three readings just before the signal reaching a plateau level, usually from 90 to 120 s (F) and the baseline calculated by averaging the initial four readings usually from 1 to 10 s (F 0) (Table 1).
Protocol for Human Ether-à-go-go Related Gene Thallium Flux Assay in 384-Well Plates
Black-wall, clear-bottom, 384-well poly-D-lysine–coated plates; overnight incubation at 37°C/10% CO2
Invert plate, shake out media, blot on paper towel; 384-well liquid handler for dispense
Stored in bench-top incubator at 25°C
Invert plate, shake out medium, blot on paper towel; wash with assay buffer
10-point, half-log dose–response curves prepared in 96-well; ≤1% vehicle concentration
Stored in bench-top incubator at 25°C
5× solution prepared in Cl−-free buffer, addition with black, 384-well FLIPR Tips
Exposure time of 0.4 s and a read interval of 3–5 s for a total of 60 reads
FluxOR Thallium Assay (1,536-Well Plates)
All cell plating, washing, and dispensing used the GNF bottle valve washer (Genomics Institute of the Novartis Research Foundation, San Diego, CA). HEK293 cells stably transfected with hERG were seeded in Poly-D-Lysine–coated black/clear microplates (8,000 cells/well in 4 μL growth media) and kept in a 37°C/10% CO2 incubator overnight. On the day of the experiment, the growth medium was washed off using wash buffer (1× HBSS/20 mM HEPES/2.5 mM NaOH soluble probenecid), with a final residual well volume of 2 μL. The FluxOR dye loading buffer was added to cells (6 μL/well, prepared using manufacturer instructions), incubated, and protected from light, at ambient temperature (23–25°C) for 90 min. The dye loading buffer was washed off with 60K assay buffer (88.4 mM NaCl, 60 mM KCl, 1.3 mM CaCl2, 0.9 mM MgCl2, 20 mM HEPES, 5.5 mM glucose, and 2.5 mM NaOH soluble probenicid, pH 7.4), with a final residual well volume of 2 μL. Six μL of FluxOR assay buffer (60K Buffer, containing 2.5 mM water soluble probenicid, 300 μM ouabain) was added to each well. Test compounds and controls were added via a 30 nL pintool addition followed by 30 min incubation protected from light, at ambient temperature (23–25°C). The microplate was then read on the FLIPRTETRA illuminated at 490 nm and fluorescence emission was recorded at 525 nm. After a 10 s baseline read, 2 μL thallium stimulant solution (1× FluxOR chloride free buffer, 7.5 mM thallium sulfate) was added to the microplate followed by an additional 380 s read time (Table 2).
Protocol for Human Ether-à-go-go Related Gene Thallium Flux Assay in 1536-Well Plates
Black-wall, clear-bottom, 1,536-well poly-D-lysine–coated plates; overnight Incubation at 37°C/10% CO2
GNF Bottle Valve Washer, each well washed twice, then aspirate volume to 2 μL
Stored in bench-top incubator at 25°C
GNF Bottle Valve Washer, each well washed twice, then aspirate volume to 2 μL
Compounds transferred with GNF pintool, ≤1% vehicle concentration
Stored in bench-top incubator at 25°C
5× solution prepared in Cl−-free buffer, addition FLIPR elastomeric head
Exposure time of 0.4 s and a read interval of 2–5 s for a total of 6 min
Data Analysis
IC50 values for inhibition in the thallium flux and 35S-MK-499 binding assays were determined according to the Hill equation from 10 point dose–response curves, where all parameters were left unconstrained. For determining compound 50% inhibition concentration (IC50) values in the QPatch assay, averaged percent control values were plotted as a function of compound concentration and fitted using a four parameter logistic equation with the minimum fixed at zero and the maximum fixed to 100% of control. Quinidine (100 μM) was added at the end of each experiment as a positive control. Fraction blocked for test compounds was calculated based on the current remaining after two additions of 10 μM agent (1− [remaining current/control current]). To evaluate the quality of the thallium flux data, the Z′-factor was calculated using the following equation:
where SDc and SDn are the standard deviation of the control group (c) and the group in the presence of 1 μM MK-499 (n), and C and N are the means of the two groups, respectively.
Results
Characterization of hERG Block by Automated Electrophysiology
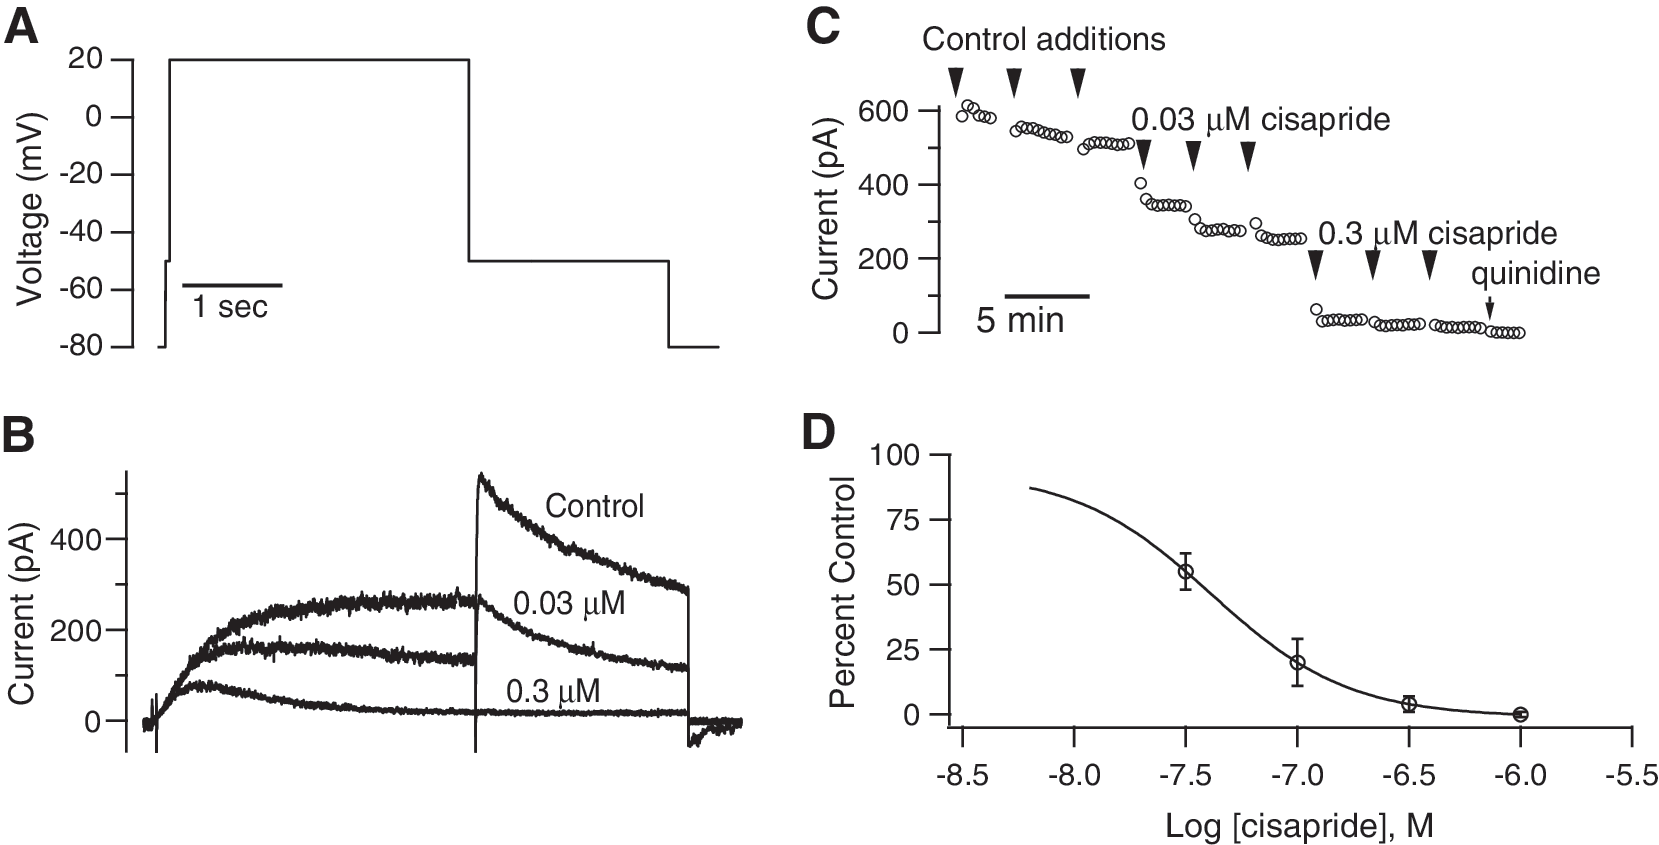
An electrophysiological hERG assay was developed on the Sophion QPatch™ automated patch platform and validated utilizing a number of published standards. The voltage protocol used to elicit hERG tail currents is shown in Figure 1A. Briefly, the membrane potential was voltage clamped at −80 mV, and stepped to −50 mV for 100 ms and then to +20 mV for 3 s. Cells were then stepped back down to −50 mV for 2 s to elicit tail currents, and finally stepped back down to −80 mV. This voltage protocol was repeated once every 20 s. Current measured at the initial step to −50 mV was used as a leak subtraction for the peak tail currents. Figure 1B illustrates hERG currents elicited using this voltage protocol and the resulting inhibition produced by application of 0.03 and 0.3 μM cisapride. An example current versus time plot is shown in Figure 1C. Multiple control saline additions were applied initially to monitor hERG current stability. Each concentration was applied 2–3 times to allow more time for reaching steady state inhibition. For each cell, 2–3 different concentrations were applied to yield a cumulative concentration–response relationship. Figure 1D shows the averaged percent control data for cisapride and resulting fit to a four parameter logistic equation yielding an estimated IC50 of 37 nM (n = 14 cells). Table 3 summarizes the IC50 values for nine hERG standards as determined on the QPatch. These values are in good agreement with published literature values utilizing manual electrophysiology (Table 3, last column) and provide confidence that the QPatch assay can be used to accurately detect inhibitors of hERG, and provide a higher throughput electrophysiological assay for generating additional validation data for the thallium flux assay.
QPatch automated electrophysiology assay for assessing hERG inhibition.
Summary of IC50 Values for Human Ether-à-go-go Related Gene Standards
The last column lists the range of published literature values utilizing manual electrophysiology from HEK and CHO cell lines (compiled from Polak et al. 15 and Roche et al. 24 ). For standards with at least six literature values cited, the high and low values were not taken into consideration to provide a more accurate reflection of the data.
FluxOR Thallium Flux Assay
In a first attempt to establish a functional hERG thallium flux assay, HEK cells expressing the hERG channel were plated in 384-well plates, loaded with the FluxOR dye reagent, incubated with hERG standard inhibitors under normal physiological conditions (i.e., HBSS) for 30 min, placed in the FLIPRTETRA instrument, and assayed for activity after addition of a thallium/high potassium solution to provide final concentrations of 3 and 20 mM, respectively. Figure 2A shows normalized mean control fluorescence traces from 32 wells and traces from the same 384-well plate from 32 wells in which the cells had been preincubated with 1 μM MK-499. Control signals are large and reproducible, and significantly attenuated in the presence of MK-499. The small signal observed in the presence of saturating concentrations of MK-499 likely represents the presence of endogenous potassium pathways, such as potassium transporters or other potassium channel subtypes. Z′-factor values for this plate were 0.91, suggesting that the assay is adequate for HTS operation. Next, seven hERG standards, cisapride, E-4031, haloperidol, MK-499, pimozide, risperidone, and verapamil, were evaluated to determine the assay sensitivity to pharmacological inhibition of the channel. Concentration–response curves for each of the standards were generated and IC50 values were calculated. Figure 2B illustrates normalized mean fluorescence signals from 8 wells in the presence of increasing concentrations of MK-499, and the corresponding concentration–response curve is presented in Figure 2C. The robustness of the data provides a very accurate determination of the IC50 value. This value and those determined for the other hERG standards are presented in Table 4, and compared with values derived from QPatch electrophysiological measurements (see Table 3). It is apparent that under these experimental conditions of the thallium flux assay, there is not a good correlation with electrophysiology. All hERG standards appear to be weaker in the thallium flux assay, and for some compounds, such as E-4031, the differences in potency can be as high as 17-fold. Although pimozide was not evaluated in this study by electrophysiology, data from the literature suggest that this agent should be a potent hERG inhibitor, that is, 1–18 nM potency. 15 The potency of the hERG standards was also evaluated in a binding assay that measures the interaction of 35S-MK-499 with membranes derived from HEK cells expressing the hERG channel. Assays such as this have been traditionally used to evaluate potential hERG liabilities of novel compounds. 8 IC50 values for inhibition of 35S-MK-499 binding by the hERG standards are also presented in Table 4. Again, there is a poor correlation between thallium flux and 35S-MK-499 binding for the structurally unrelated hERG inhibitors. All these data, taken together, suggest that the experimental conditions of the hERG thallium flux assay need to be optimized to increase the sensitivity of the assay to channel inhibitors.

Thallium flux through hERG channels.
Inhibition of Human Ether-à-go-go Related Gene Channels
Inhibition of hERG channels in thallium flux or QPatch electrophysiology, and inhibition of 35S-MK-499 binding to hERG channels were evaluated as indicated under the Materials and Methods section. For thallium flux, HEK cells stably expressing the hERG channel and preloaded with the FluxOR reagent were incubated with or without increasing concentrations of indicated compounds in HBSS, before addition of a thallium sulfate/potassium sulfate solution to provide final concentrations of 3 and 20 mM for thallium and potassium, respectively. IC50 values for inhibition of thallium flux represent the mean of eight determinations ± SD.
HBSS, Hank's buffered saline solution; hERG, human Ether-à-go-go related gene; ND, not determined; SD, standard deviation.
A fundamental difference between the thallium flux assay described above, and electrophysiology or 35S-MK-499 binding resides in the fact that compounds may interact with different conformational states of the channel. In the thallium flux assay, compounds were preincubated under physiological conditions where most of the channels should reside in the closed conformation, whereas in the other assays, compound interaction most likely occurs with open and/or inactivated channel states which are considered to represent the high affinity state for inhibitor interaction. 16 –18 To determine whether the pharmacological sensitivity of the thallium flux assay can be enhanced under conditions where the channel conformation is preferentially shifted toward the open/inactivation state, HEK cells expressing the hERG channel and loaded with the FluxOR dye reagent were incubated for 30 min with hERG inhibitors in solutions containing increasing amounts of potassium chloride (10–120 mM potassium chloride balanced with sodium chloride), before addition of a thallium solution. As potassium chloride is raised and cells are depolarized, more channels will transition from the closed to the open/inactivated state providing a higher affinity substrate for compound interaction. Results corresponding to four of these conditions are presented in Figure 3. In all cases, robust control signals are observed, which are largely attenuated in the presence of 1 μM MK-499. The normalized fluorescence signals and the Z′- and coefficient of variation (CV) factors from the corresponding plates are presented in Table 5. The magnitude of the control fluorescence signal starts to decrease at >60 mM potassium chloride, although even under those conditions, the plate statistics are excellent. Dose–response curves for the hERG inhibitors were generated under all conditions, and the calculated IC50 values are presented in Table 5. For all compounds, there is a trend to higher affinity as the potassium concentration in the preincubation media is increased. For each compound, the shift to higher potency occurs at a defined range of potassium concentrations, but in most cases, the leftward shift in IC50 values appears to level at about 60–100 mM potassium chloride. Because of the above data, and because control signals were consistently higher at 60 mM potassium chloride, we chose this condition for further evaluation. Table 6 summarizes thallium flux data from additional experiments at 60 mM potassium preincubation conditions for those standards of Table 5 and sotalol and verapamil, and the corresponding values for these compounds in QPatch electrophysiology and 35S-MK-499 binding. Figure 4 presents the correlation in IC50 values between the thallium flux assay, and electrophysiology or thallium flux assay and 35S-MK-499 binding for all hERG inhibitors. The solid line represents a 1:1 relationship between the sets of data, whereas the dashed and red lines indicate a 3- and 10-fold separation from unity in either direction. Most compounds fit within the dashed lines indicating good correlation between thallium flux and the other two assays, and in particular with the QPatch assay. Thus, it appears that the determined experimental conditions of the hERG thallium flux assay in 384-well format provide good and reproducible signals, as well as appropriate pharmacological sensitivity for a number of structurally diverse hERG inhibitors.
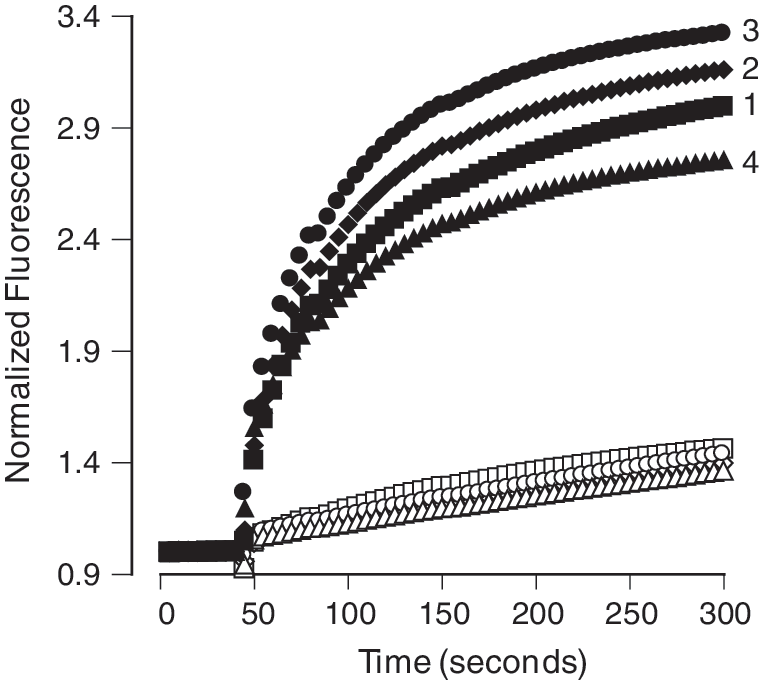
Thallium flux through hERG channels after different preincubation conditions. HEK293 cells stably expressing the hERG channel, and preloaded with the FluxOR reagent were incubated without (closed symbols) or with 1 μM MK-499 (open symbols) in HBSS (▪, □; 1) or in potassium/sodium balanced solutions in which potassium was present at 20 (♦, ◊; 2), 60 (∙, ○; 3), or 120 mM (▴, ▵; 4), as described under the Materials and Methods section. Upon recording the emission of the dye for 30 s, thallium sulfate was added to provide a final thallium concentration of 3 mM, and fluorescence was monitored for an additional 270 s.
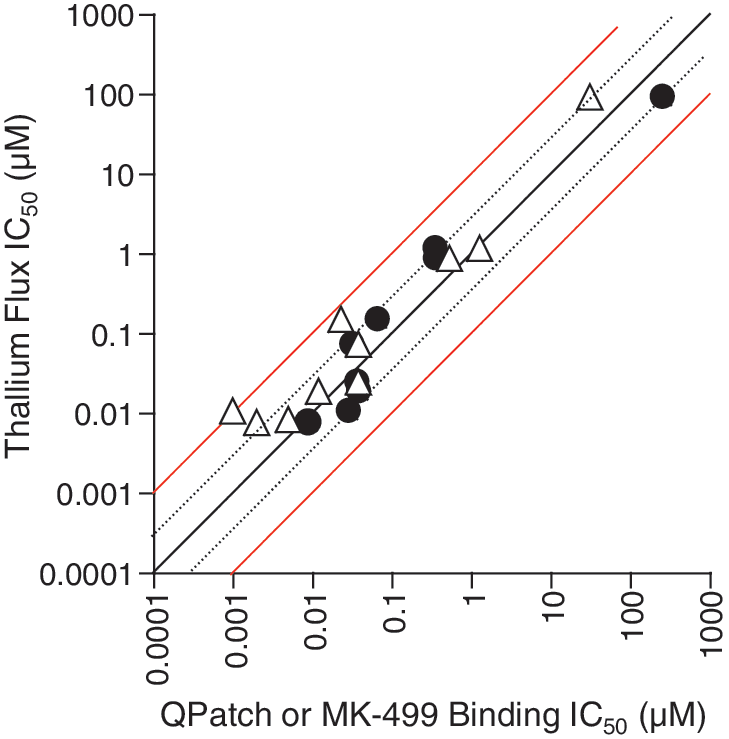
Correlation between inhibition of hERG by thallium flux, and either QPatch or 35S-MK-499 binding. IC50 values for inhibition of thallium flux in 60 mM potassium preincubation conditions are plotted against the IC50 values for inhibition as determined by either QPatch (∙) or by 35S-MK-499 binding (▵) for a number of hERG standards. The solid line represents a 1:1 correlation between values, whereas the dashed and red lines represent 3- and 10-fold difference from unity in either direction, respectively.
Preincubation Conditions and Inhibition of Human Ether-à-go-go Related Gene Channels
Inhibition of hERG channels was evaluated by thallium flux, as indicated under the Materials and Methods section. Cells preloaded with the FluxOR™ reagent were incubated with or without increasing concentrations of indicated compounds in either HBSS or potassium/sodium balanced solutions in which potassium was varied from 10 to 120 mM, before addition of thallium sulfate to provide a final concentration of 3 mM. IC50 values for inhibition represent the mean of at least four determinations ± SD. Control and basal signals, determined in the presence of 1 μM MK-499, are indicated for each experimental condition as well as the number of wells used to calculate the Z′- and CV factors of the corresponding plates.
CV, coefficient of variation.
Inhibition of Thallium Flux Through Human Ether-à-go-go Related Gene Channels After Preincubation at 60 mM Potassium
Inhibition of hERG channels was evaluated by thallium flux, as indicated under the Materials and Methods section. Cells preloaded with the FluxOR reagent were incubated with or without increasing concentrations of indicated compounds in a solution consisting of 60 mM potassium chloride and 80 mM sodium chloride before addition of thallium sulfate to provide a final concentration of 3 mM. IC50 values for inhibition are presented as the mean ± SD with the number of determination indicated between parentheses. IC50 values for inhibition of hERG channels by QPatch electrophysiology (Table 3), and for inhibition of 35S-MK-499 binding to hERG channels are also presented.
Evaluation of Medicinal Chemistry Compounds on the hERG Thallium Flux Assay
To further ascertain the sensitivity of the hERG thallium flux assay, 991 compounds from different internal medicinal chemistry programs were evaluated in the hERG thallium flux and 35S-MK-499 binding assays. Concentration–response curves for each compound were generated, and a correlation plot of the calculated IC50 values between these two assays is illustrated in Figure 5. The solid line represents a 1:1 relationship between both data, whereas the dashed and red lines indicate a 3- and 10-fold separation from unity, respectively. A large majority of compounds can be found between the dashed lines. However, 117 compounds display IC50 ratios larger than 7-fold, and 110 of these compounds are more potent on the 35S-MK-499 binding assay. Of these 110 compounds, 86 were available in sufficient quantity for testing on the QPatch platform. This set of compounds contained ∼28 different structural classes, and 40 compounds were selected to cover the diversity of the set. To clearly distinguish active from inactive compounds, each compound was applied at a single concentration of 10 μM on the QPatch. Fraction blocked for test compounds was calculated based on the current remaining after two additions of 10 μM agent (1− [remaining current/control current]). To more clearly observe the agreement between assays, the expected fraction blocked at 10 μM was calculated for each of the test compounds based on the IC50 values generated from the thallium flux and 35S-MK-499 binding assays. Figure 6 plots the expected fraction blocked at 10 μM for the thallium flux (blue circles) and 35S-MK-499 binding (red circles) assays against the measured fraction blocked at 10 μM from the QPatch assay. The black lines represent a 3-fold difference between the estimated IC50 values. For this set of compounds, which was selected based on the large discrepancies between thallium flux and 35S-MK-499 binding potencies, the thallium flux assay was more predictive of the actual fraction blocked values generated on the QPatch.
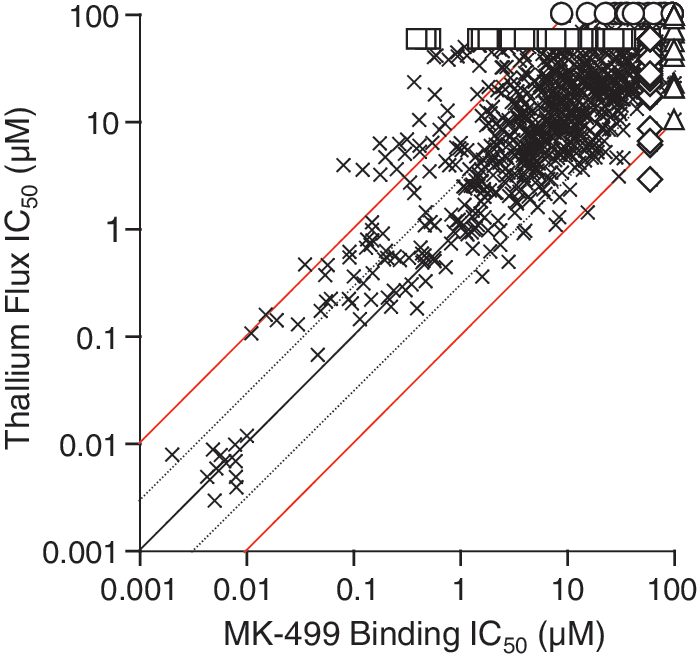
Activity of medicinal chemistry compounds on thallium flux and 35S-MK-499 binding. IC50 values for inhibition of thallium flux in 60 mM potassium preincubation conditions are plotted against the IC50 values of inhibition for 35S-MK-499 binding for 991 compounds representing different chemical entities (x). The solid line represents a 1:1 correlation between values, whereas the dashed and red lines represent 3- and 10-fold difference from unity in either direction, respectively. Thallium flux IC50 > 60 μM (□); 35S-MK-499 binding IC50 > 60 μM (◊); thallium flux IC50 > 100 μM (○); 35S-MK-499 binding IC50 > 100 μM (▵).

Correlation between thallium flux or 35S-MK-499 binding and QPatch assays for discrepant compounds. A subset of compounds showing >7-fold difference in potency between flux and binding assays was evaluated for their ability to block hERG at 10 μM in the QPatch assay. The estimated fraction blocked at 10 μM was calculated for each compound using the Hill equation with n
H = 1: y = 1/(1 + (IC50/[Drug])), where y is the expected fraction blocked, [Drug] = 10 μM, and IC50 values are from the thallium flux () or 35S-MK-499 binding ( ) assays. For graphing purposes, IC50 values >50 or 100 μM were considered to be 50 or 100 μM, respectively, when calculating expected block. For the QPatch data, n values ranged from 2 to 8 cells per compound. Solid black lines represent 3-fold disagreement between estimated IC50 values.
FluxOR Thallium Flux Assay in 1,536-Well Plates
The thallium flux hERG assay was then miniaturized to 1,536-well plate format as described under the Materials and Methods section. Preincubation with the 60 mM potassium solution was also incorporated into the miniaturized format. However, the steps involving removal of growth media and dye loading solutions were modified so that the wells were washed twice with a 10 μL volume of the appropriate wash buffer to remove most traces of the growth media or dye loading solution. A 2 μL volume was needed in the wells at all wash steps to protect the cells from being aspirated from the plate. Validation of the 1,536-well plate hERG thallium flux assay included the titration of MK-499 and the evaluation of signal consistency across a whole plate. Figure 7A shows the fluorescence signal of wells stimulated with the thallium sulfate solution or HBSS buffer. In the presence of thallium, the fluorescence signal is 4-fold larger, and can be attenuated in the presence of increasing concentrations of MK-499 (Fig. 7B). The corresponding dose–response curve is presented in Figure 7C from which an IC50 value of 4.4 nM for MK-499 can be calculated. This value is within 3-fold of that obtained in the 384-well format thallium flux assay (11 nM, Table 6), under identical experimental conditions. The fluorescence signals across a whole 1,536-well plate showed a CV of 5.5%, and a Z′-factor of 0.85. When using 1 μM of MK-499 as a positive control, the signal to background ratio was 2.7-fold (Fig. 7D). These data indicate that the assay is robust enough for a 1,536-well plate format fully automated screen, and sensitive enough to identify compounds affecting hERG channel activity. For this purpose, the 1,536-well hERG thallium flux assay was used to evaluate a set of 25,000 compounds on a robotic system, as part of a counter screen assay. These compounds were run in triplicate in the thallium flux hERG assay at a concentration of 7.5 μM. The average S:B ratio across the plates was 2.9-fold, with an average Z′-value of 0.78, and an average plate CV for plates containing compounds of 28%. Within this set, 26% of compounds showed >65% inhibition in the hERG thallium flux assay and were considered active on the hERG channel. These compounds were eliminated from the confirmed list of compounds on the primary target of interest. Ultimately, the thallium flux hERG assay helped to identify compounds that were more selective for the primary target under investigation.

Thallium flux through hERG channels in a 1,536-well format. ), unstimulated ( ), or the MK-499 titration (
 ) wells, where F represents the maximum fluorescence value after addition of thallium, and F
0 refers to the fluorescence value before thallium addition.
) wells, where F represents the maximum fluorescence value after addition of thallium, and F
0 refers to the fluorescence value before thallium addition.
Discussion
In the present study, a functional, high-capacity, fluorescence-based assay has been established for the hERG channel. This assay makes use of the ability of thallium to permeate through open hERG channels, and provides a direct measurement of channel activity. Importantly, with the use of appropriate assay conditions, the inhibitory activities of a number of structurally unrelated hERG inhibitors were shown to be almost identical to those determined in electrophysiological recordings with the QPatch platform, or in traditional radioligand binding assays, such as those using 35S-MK-499. In addition, the evaluation of 991 medicinal chemistry compounds from different drug development programs strongly suggested that the thallium flux assay was a good predictor of hERG activity. Since the assay can operate with fidelity in 1,536-well format, these data, taken together, support the notion that the hERG thallium flux assay could contribute to drug development efforts by identifying potential hERG liabilities of new chemical entities in a timely fashion, thereby supporting SAR efforts in real time.
The high cost and length of time associated with the development of a new drug requires that major safety issues be identified at the early stages of compound development. Data on the interaction of a novel compound with the hERG channel are requested by regulatory agencies before final approval of the drug. Although these data are to be provided in the form of conventional, manual patch clamp electrophysiology, such assays are not feasible when evaluating the numerous compounds that medicinal chemists prepare during the lead optimization process because of the tedious manual assay procedure. In addition, because the hERG channel is quite promiscuous in terms of its interaction with many structurally diverse chemical entities, and the structure–activity relationships for inhibition are often unpredictable, it is desirable to determine the hERG activity of as many compounds as possible in support of medicinal chemistry efforts. To accomplish this goal, different assays have been implemented to profile compounds for hERG affinity. 8,19,20 Traditional radioligand binding assays, although able to operate in high-throughput mode, do not provide functional information on the compounds identified in the assay, and can also miss other compounds whose binding sites are not coupled to the site where the probe radioligand binds. Nonetheless, such assays are widely used for compound evaluation. Automated electrophysiology platforms for hERG provide a direct readout of channel activity, 21 –23 but the throughput is still limited because of the time involved in performing assays; in addition, the cost of consumables can be quite substantial. Thus, the need exists for a high-throughput, low-cost, functional hERG assay that can provide reliable information on the interaction of a given compound with the channel. In this context, the recently introduced thallium-sensitive fluorescence dyes provide a venue with which to accomplish such a task. 10,12 The major advantage of this new technology resides in the operation of the assay in 384- or 1,536-well plate format and the use of a plate reader that can process plates in a short period, ∼10 min. Moreover, the assay should provide a direct readout of channel activity. One of the critical features of such an assay is its ability to reproduce the molecular pharmacology of the hERG channel, as determined in electrophysiological experiments. In a recent publication, a number of hERG inhibitors were found to display reduced potency in a thallium flux assay when compared to automated (overall average shift of ∼15-fold), and conventional (overall average shift of 117-fold) electrophysiology. 13 In fact, for some compounds, such as pimozide and astemizole, the shifts in IC50 values between thallium flux and conventional electrophysiology assays were reported to be 1,282- and 224-fold, respectively. These data were interpreted to show that the thallium flux assay was not an appropriate means to identify hERG liabilities. However, the data presented in this article provide a different conclusion. By modifying the conditions under which compounds are pre-equilibrated with the channel, it is possible to shift their affinities to values that are quite consistent with those derived from electrophysiological methods. Under the optimal assay conditions, that is, in the presence of 60 mM KCl, a higher channel population will reside in the open and/or inactivated states, which are believed to provide the high affinity conformation(s) for inhibitor interaction. 18 Despite the presence of high potassium at the time of thallium exposure, fluorescence signals are robust and not much different than those obtained when compound preincubation took place under physiological potassium concentrations. The excellent correlation between the IC50's in the thallium flux, QPatch, and 35S-MK-499 binding assays for a number of standard hERG inhibitors provides a strong validation for the assay. Further validation was provided by the good correlation between thallium flux data and QPatch measurements after evaluation of 991 medicinal chemistry compounds in thallium flux and 35S-MK-499 binding assay protocols. Whether or not these findings would extend when testing many more compounds and other diverse chemical entities remains to be determined. Specific compound properties, such as those related to hydrophobicity, solubility in aqueous buffers, fluorescence interference, and adsorption to plate surfaces could play a role in the estimated potency, and contribute to shifts in affinity between different assay format platforms.
Although assay development was done in a 384-well platform, the FLIPRTETRA instrument also allows the processing of 1,536-well plates, and previous work has illustrated the feasibility of using this high density plate format in a homogeneous thallium flux assay using cells transduced with BacMam hERG. 11 In this study, where the use of a fluorescence quenching agent eliminated the necessity of wash steps, and the slope of increase in fluorescence intensity during the first 30 s was used to calculate assay parameters, U-2 OS cells were found to provide better assay windows than HEK293, CHO, or HeLa cells. However, compound preincubation was only attempted in phosphate-buffered saline, and the correlation in potency with QPatch electrophysiology was less optimal than in the present study. Although we did not evaluate all standard hERG inhibitors in 1,536-well format, IC50 values for the MK-499 hERG standard are quite comparable to those of 384-wells, and the signal-to-noise ratio is robust and very constant across the plate(s) despite the use of wash steps. These findings suggest that the ultrahigh throughput hERG thallium flux assay could be used to screen entire chemical libraries to identify the hERG liabilities of the different structural classes of compounds contained within. Such information could be important when deciding the strategy to proceed when hits are identified after a large screening campaign. However, a need still exists for an ultrahigh capacity automated patch clamp platform that would provide more mechanistic information on compound-hERG interactions. Until such new technology becomes available, it will be necessary to follow up positives from the thallium flux assay by electrophysiological studies to gain insights into the mechanism of action of the newly identified hERG inhibitors.
Footnotes
Acknowledgments
The authors thank J. Karczewski for constructing the CHO-hERG cell line used for the QPatch studies, and Serena Xu for assistance with the MK-499 binding experiments.
Disclosure Statement
No competing financial interests exist.