Sowa MB, Chrisler WB, Zens KD, Ashjian EJ, Opresko LK. Three-dimensional culture conditions lead to decreased radiation induced cytotoxicity in human mammary epithelial cells. Mutat Res 2010;687:78–83.
Abstract: For both targeted and nontargeted exposures, the cellular responses to ionizing radiation have predominantly been measured in two-dimensional (2D) monolayer cultures. Although convenient for biochemical analysis, the true interactions in vivo depend upon complex interactions between cells themselves and the surrounding extracellular matrix. This study directly compares the influence of culture conditions on radiation-induced cytotoxicity following exposure to low-LET ionizing radiation. Using a 3D human mammary epithelial tissue model, we have found a protective effect of 3D cell culture on cell survival after irradiation. The initial state of the cells (i.e., 2D vs. 3D culture) at the time of irradiation does not alter survival, nor does the presence of extracellular matrix during and after exposure to dose, but long-term culture in 3D that offers significant reduction in cytotoxicity at a given dose (e.g., ∼4-fold increased survival at 5 Gy). The cell cycle delay induced following exposure to 2 and 5 Gy was almost identical between 2D and 3D culture conditions and cannot account for the observed differences in radiation responses. However, the amount of apoptosis following radiation exposure is significantly decreased in 3D culture relative to the 2D monolayer after the same dose. A likely mechanism of the cytoprotective effect afforded by 3D culture conditions is the downregulation of radiation-induced apoptosis in 3D structures.
Goodman TT, Ng CP, Pun SH. 3-D tissue culture systems for the evaluation and optimization of nanoparticle-based drug carriers. Bioconjug Chem 2008;19:1951–1959.
Abstract: Nanoparticle carriers are attractive vehicles for a variety of drug delivery applications. To evaluate nanoparticle formulations for biological efficacy, monolayer cell cultures are typically used as in vitro testing platforms. However, these studies sometimes poorly predict the efficacy of the drug in vivo. The poor in vitro and in vivo correlation may be attributed in part to the inability of two-dimensional (2D) cultures to reproduce extracellular barriers, and may also be due to differences in cell phenotype between cells cultured as monolayers compared to cells in native tissue. To more accurately predict in vivo results it is desirable to test nanoparticle therapeutics in cells cultured in 3D models that mimic in vivo conditions. In this review we discuss some 3D culture systems that have been used to assess nanoparticle delivery and highlight several implications for nanoparticle design garnered from studies using these systems. While our focus will be on nanoparticle drug formulations, many of the systems discussed here could, or have been, used for the assessment of small molecule or peptide/protein drugs. We also offer some examples of advancements in 3D culture that could provide even more highly predictive data for designing nanoparticle therapeutics for in vivo applications.
Commentary:Traditional cell-based assays for high-throughput screening employ cells in suspension or as a monolayer contained in the wells of microtiter plates. Distributing cells on a surface in this manner represents a 2D culture system, but cells found in tissues grow naturally in complex 3D matrices. Perhaps not surprisingly, cells can show profound differences in both phenotype and drug responses in 2D versus 3D systems. One example is increased resistance to radiation for cells grown in 3D cultures, which is illustrated by Sowa et al. In this article, both 2D and 3D culture systems were used to examine the survival of a mammary epithelial cell line (184A1) in response to X-ray radiation. Increasing the X-ray dose from 0 to 9 Gy and monitoring cell survival over 10 days showed ∼500% increase in cell survival at high X-ray doses for cells grown in 3D culture (see first figure). The underlying mechanism of protection from radiation in 3D growth is not understood but may be due to changes in apoptosis rate. Preliminary FACS studies monitoring live, dead, and apoptotic cell populations have suggested a lower rate of apoptosis in 3D compared to 2D cultures. The 2008 review (available in Pub. Med. Central Oct 2009) describes several methods to create 3D cell culture systems (see second figure). The focus in this review is on how 3D cellular matrices can influence the effectiveness of nanoparticulate formulations intended to be used as drug delivery vehicles. The use of 2D culture systems to evaluate drug delivery formulations is often not predictive because several 3D barriers are absent in 2D culture systems such as the pore size and tortuosity of interstitial spaces. Formation of spheroids can be promoted by growing cells in spinner flasks, as suspension within hanging drops, or in plates coated with a matrix such as Matrigel. Cell spheroids can grow as large as several millimeters and may be useful models of solid tumor growth. Studies have shown that nanoparticles >100 nm do not penetrate such spheroids, which has implications in the use of retrovirus as well as certain adenoviruses showing particles ∼100 nm. As well, the surface charge of the spheroids plays a role, with the more neutral nanoparticles penetrating deeper into the spheroid than those with higher surface charges. Several areas where 3D culture systems can be improved are also discussed such as the use of different cell types in cocultures and direct culturing of ex vivo tissues. The latter should conserve a highly biologically relevant 3D cellular matrix and exhibit more predictive phenotype responses. Continued development and evaluation of 3D culture systems should help us determined if these yield results that are more predictive of in vivo studies. Contributed by Doug Auld.
Surviving fraction as a function of days postexposure for mammary epithelial cultures. Surviving fractions were measured as a function of dose for 184A1 cells grown in two-dimensional (2D) and 3D cultures. Bars represent the average number of cells from 3 dishes. Error bars represent one standard deviation above and below the mean.
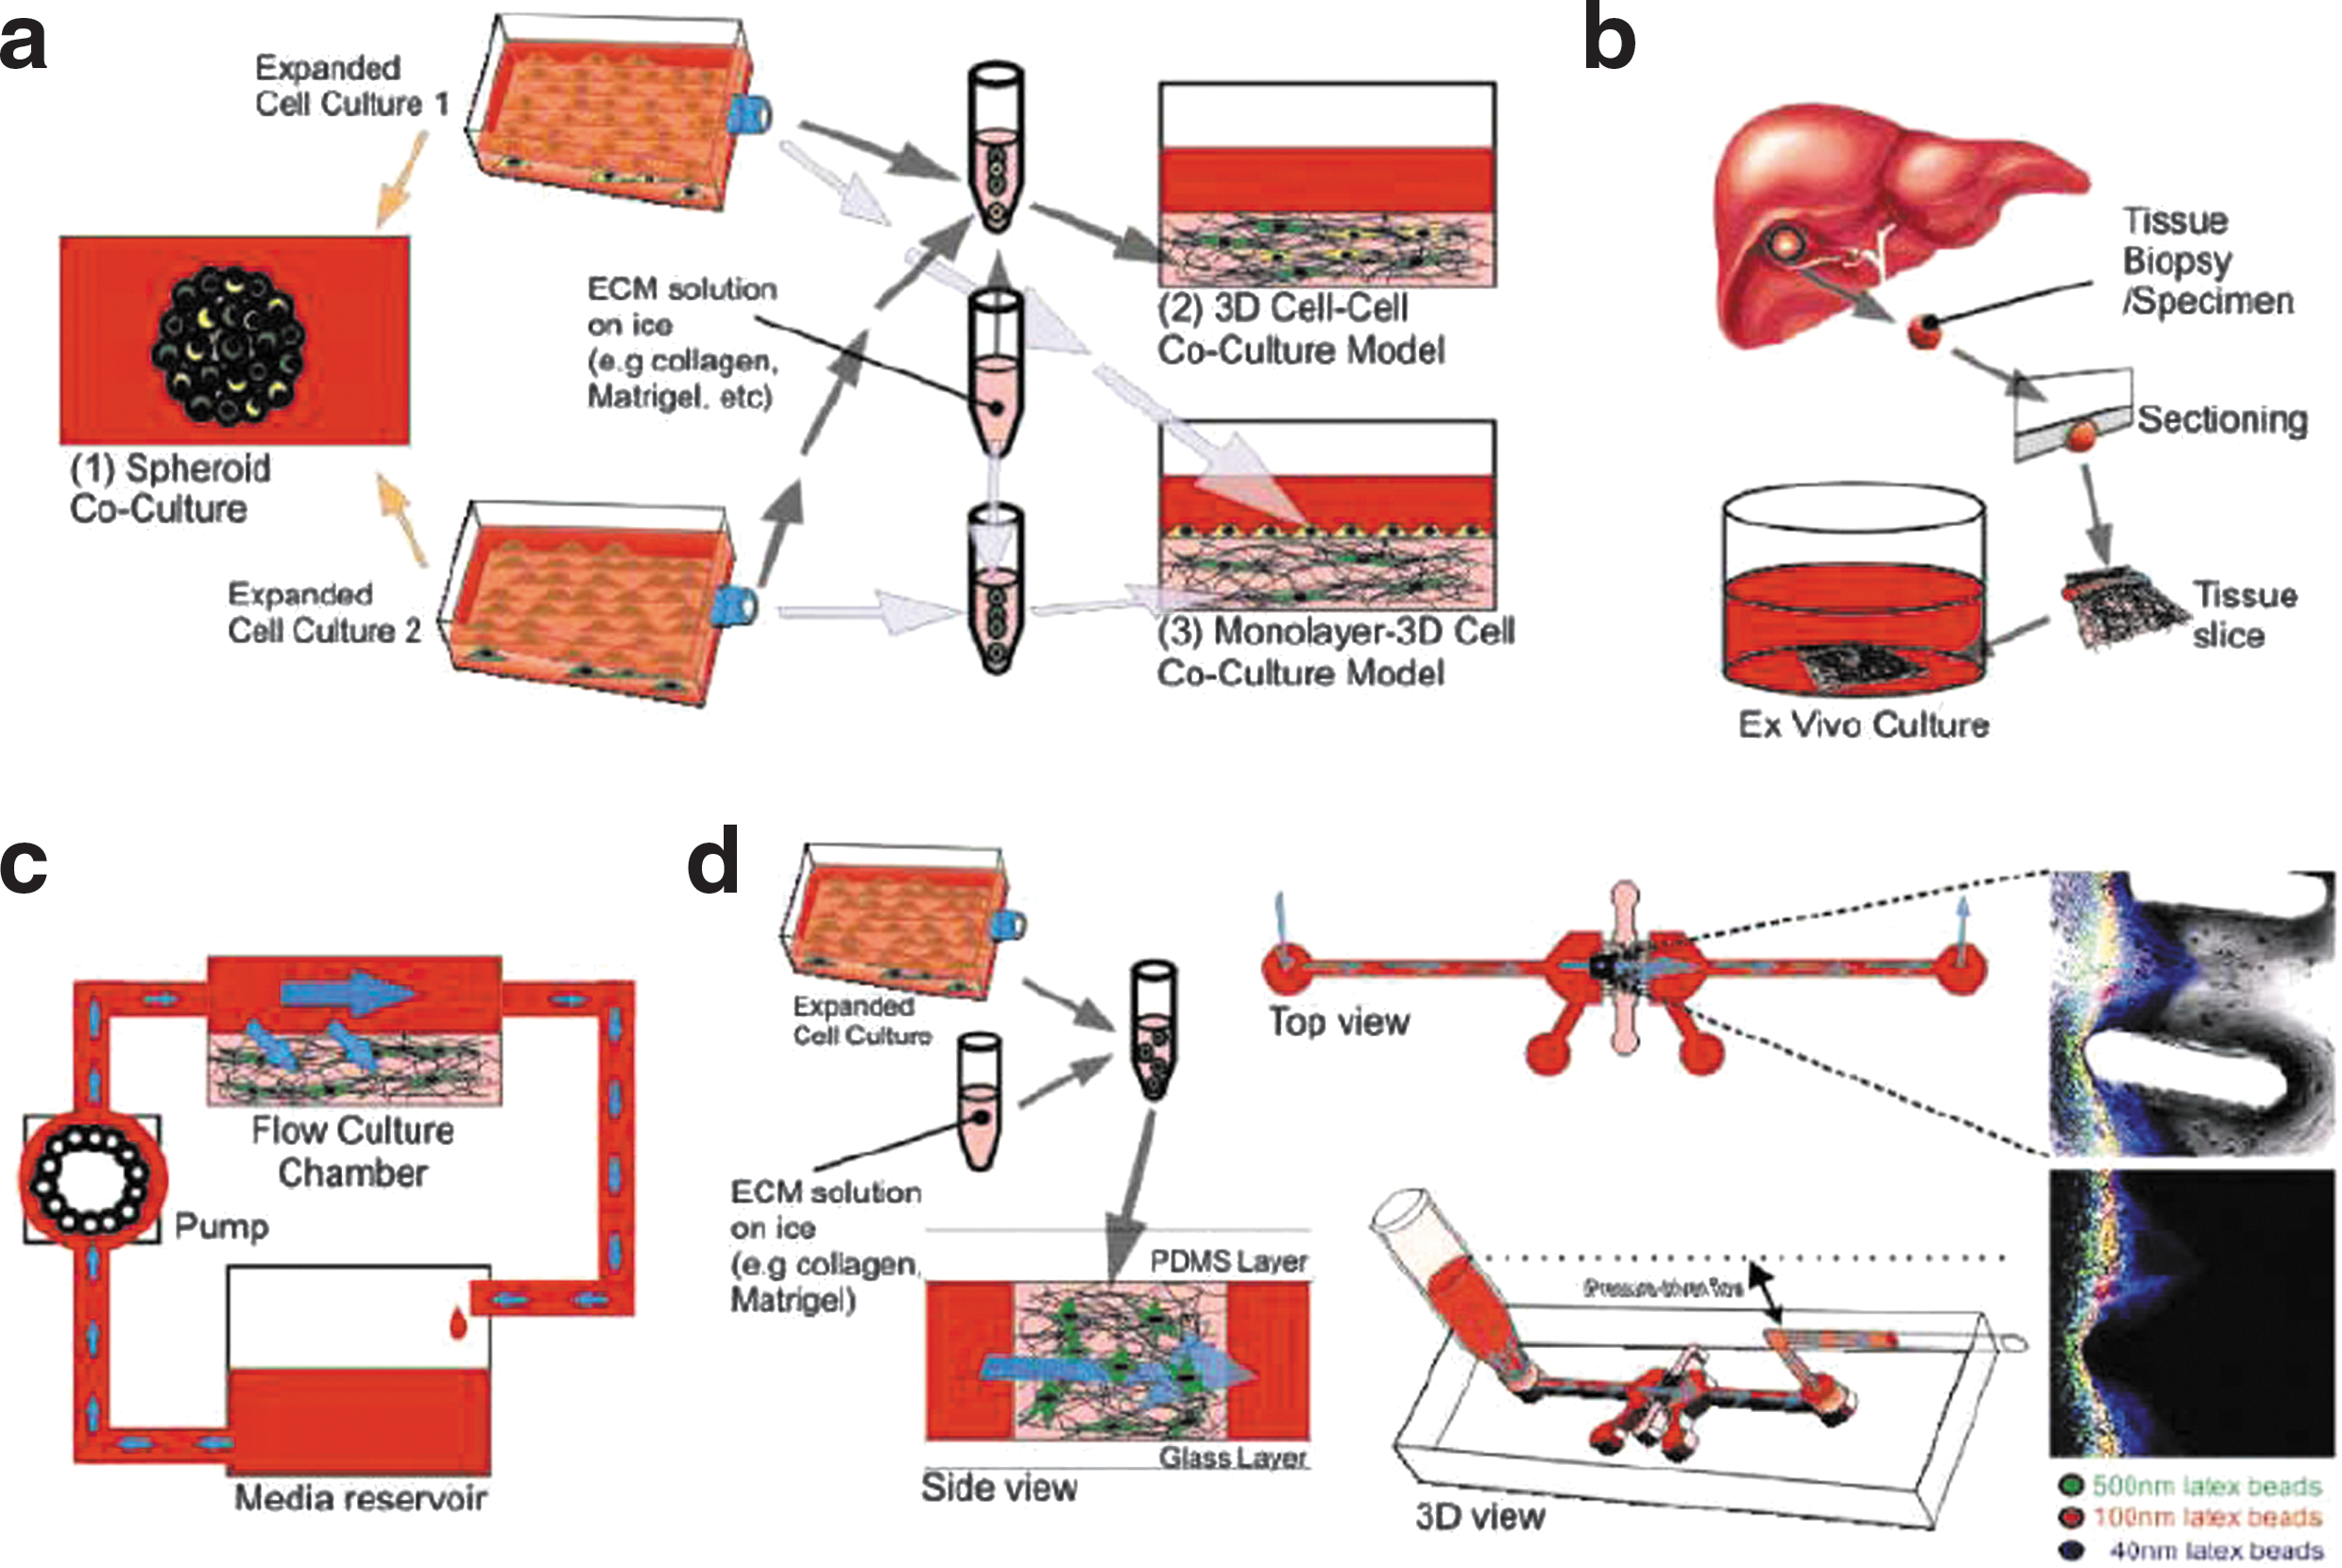
Examples of advanced 3D models. (a) Some variations of coculture models: (1) spheroid coculture models, (2) cell–cell coculture in extracellular matrix (ECM), and (3) cell monolayer on 3D cell-ECM coculture model. (b) Ex vivo models: one version where samples of tissues such as the liver were harvested, sectioned, and cultured on 2D substrates for screening. (c) A typical setup of 3D perfusion cell-ECM culture models where medium flow is driven over the cell-ECM by a pump from a reservoir. (d) A short-term perfusion system developed by Ng and Pun for nanoparticle penetration studies.
Getting Stats on Surefire
Osmond RIW, Das S, Crouch MF. Development of cell-based assays for cytokine receptor signaling, using an AlphaScreen SureFire assay format. Anal Biochem 2010;403:94–101.
Abstract: The signal transducers and activators of transcription (STAT) proteins are a small family of signaling proteins that are crucial for cytokine and growth factor receptor-mediated signaling in various blood cell types. Despite their central role in immune and hematopoietic cellular regulation, there are relatively few options for monitoring receptor-mediated JAK/STAT signaling events in a cell-based format, without the need for cellular transfections or labor-intensive methodology. Indeed, traditional methods such as the Western blot or ELISA remain a standard method for determining the phosphorylation status of endogenous STAT proteins. Here we present data for the rapid detection of endogenous receptor-mediated phosphorylation of multiple STAT proteins using the bead-based AlphaScreen SureFire technology. With 3 different cell lines (human acute monocytic leukemia THP1 cells, human erythroleukemic TF-cells, and human T lymphocytic Jurkat cells), we have optimized a rapid and homogeneous methodology for monitoring endogenous, receptor-mediated signaling via STAT1, STAT3, or STAT5 phosphorylation, in response to several agonists. These assays, which can be tailored for both standard research applications and high-throughput drug-screening applications, afford quantitative data for receptor-mediated signaling mechanisms in an endogenous, cellular environment.
Commentary:Perkin Elmer's partnership with TGR Biosciences has lead to the adaptation of AlphaScreen®technology to measuring phosphorylated proteins from whole-cell lysates (AlphaScreen SureFire®technology; see also Binder et al. ADDT 2008;6:27–37 for applications of AlphaScreen). SureFire enables chemiluminescent detection of phosphorylated proteins in a “no wash” format, which greatly improves the throughput of the assays relative to traditional ELISA-based formats. The detection is sufficiently sensitive to measure endogenous levels of phosphoproteins in cell lysates. In the assay, donor and acceptor beads are configured so that one bead type (either donor or acceptor) is coated with a capture antibody to the protein of interest, whereas the other bead type displays the antibody to the phosphorylated epitope. The SureFire assay enables 96-well or 384-well assays for phosphoproteins that are usually detected using much more labor- and time-consuming procedures such as Western blots or ELISAs (see
figure
). Here the authors used this technology to measure endogenous cytokine receptor activation of STAT phosphorylation in 3 different cell lines. In one version of the SureFire assay the lysate is assayed in a separate plate that can be a 384-well plate. In such larger volume assays (e.g., 25–100 μL) only 4 μL of lysate is used for the assay, which enables parallel screening of multiple phosphorylation events. Receptor activation of STAT1, STAT3, and STAT5 was readily measured from the same lysate (for another multiplexed application see also Arcand et al., Biochemistry 2010;49:3213–3215). In another version the assay is performed in a single plate that could enable high-throughput applications. In this format 10,000 cells/well ofTHP1 orTF1 cells were required to measure STAT5 phosphorylation, while 50,000 cells/well were required to detect phosphorylation of STAT5 in Jurkat cells, which points to the cell culture burden that should be considered when configuring SureFire forHTS applications. This article illustrates the evolution of phosphoprotein detection assays from Western blots to HTS assays. Contributed by Doug Auld.
Comparison of general procedures for the detection of STAT protein phosphorylation using nonadherent cells. For Western blot assays (A), lysates are prepared, separated by SDS-PAGE, and transferred to a membrane. The membrane is blocked and exposed to primary and secondary-HRP-conjugated antibodies, with extensive intervening washes. Signal is developed by exposure to a HRP substrate, followed by exposure to film or a luminometer. For standard ELISA applications (B), lysates are prepared and transferred to an ELISA plate. Depending on the ELISA brand used, after an incubation, the plates are typically washed, incubated with HRP-conjugated antibodies, then washed again, before the addition of a HRP substrate for detection. For the AlphaScreen SureFire transfer assays (C), lysates are prepared and transferred to a 384-well ProxiPlate for assay. For the AlphaScreen SureFire single-plate assays (D), cells are seeded in a 384-well OptiPlate, and are stimulated, lysed, and assayed in the same well. For both AlphaScreen SureFire assays, reagents are added to the lysates in two separate additions, and the signal is detected with an AlphaScreen-enabled plate reader, such as an EnSpire, EnVision, or Fusion alpha plate reader.
Introducing Eluc: A New Luciferase Reporter
Nakajima Y, Yamazaki T, Nishii S, Noguchi T, Hoshino H, Niwa K, Viviani VR, Ohmiya Y. Enhanced Beetle luciferase for high-resolution. PLoS ONE 2010;5:e10011.
Abstract: We developed an enhanced green-emitting luciferase (ELuc) to be used as a bioluminescence imaging (BLI) probe. ELuc exhibits a light signal in mammalian cells that is over 10-fold stronger than that of the firefly luciferase (FLuc), which is the most widely used luciferase reporter gene. We showed that ELuc produces a strong light signal in primary cells and tissues and that it enables the visualization of gene expression with high temporal resolution at the single-cell level. Moreover, we successfully imaged the nucleocytoplasmic shuttling of importin α by fusing ELuc at the intracellular level. These results demonstrate that the use of ELuc allows a BLI spatiotemporal resolution far greater than that provided by FLuc.
Commentary:This article describes a new luciferase isolated from the Brazilian click beetle Pyrearinus termitilluminans. The luciferase uses adenosine triphosphate and D-luciferin as substrates but shows a pH insensitive blue-shifted luminescent emission spectrum (λmax = 538 nm) relative to other beetle luciferases such as Photinus pyralis luciferase (FLuc; λmax approximately 560 nm). A codon-optimized version of the cDNA encoding the luciferase was constructed, termed “ELuc” by the authors, which showed enhanced expression in mammalian cells. For comparison of live cell expression, ELuc was fused to a PEST element to create a destabilized luciferase and the same PEST sequence was used to create a destabilized enzyme of the commonly used FLuc [using the luc(+) DNA construct from Promega]. Expression of these destabilized luciferases in live NIH3T3 cells under the control of a circadian clock gene promoter showed an oscillating response for both luciferases, but ELuc showed a 14-fold higher signal than FLuc (see
figure
). The brighter luminescence of ELuc than that of FLuc is thought to be due to the codon optimization and the longer half-life of the destabilized ELuc compared to FLuc (t1/2 = 4 h and <1 h, respectively). The brightness of ELuc was sufficient to allow single-cell detection, which was demonstrated using ELuc expressed under the control of the mBmal1 clock gene in rat primary astrocytes. Expression of ELuc in the mammalian suprachiasmatic nucleus (SCN) could be observed in real time using a luminescent microscope with 10 min exposure time. In comparison, detection of FLuc bioluminescence can require exposure times of 30-60 min in SCN tissue slices. Additionally, intracellular protein trafficking could be monitored by fusing the C-terminus of ELuc to the nuclear protein importin α. Transient expression of this construct in NIH3T3 cells followed by monitoring the bioluminescence at 4 min intervals with 3 min exposure showed periodic movement of the protein from cytosol to nucleus. Therefore, despite the blue-shifted luminescence of ELuc, the enhanced expression provides a reporter that can be applied to image primary cells with high spatial and temporal resolution. As well, ELuc could be coexpressed with luciferases showing red-shifted luminescence to monitor multiple events in cells. Thus, ELuc should be a useful reporter for both in vitro and in vivo assays. Contributed by Doug Auld.
Comparison of the characteristic properties of firefly luciferase (FLuc) and enhanced green-emitting luciferase (ELuc) in NIH3T3 cells. (A) Photomultiplier recording of mPer2 transcriptional oscillation in NIH3T3 cells expressing destabilized ELuc (green filled circles) and FLuc (orange filled circles). The reporter plasmids mPer2- dELuc or mPer2-dFLuc were cotransfected with pCMV-CLuc and cells were stimulated with 100 nM of dexamethasone. The respective luciferase activities were normalized to CLuc activity. Error bars indicate the standard deviation (n = 4). The inset shows recordings in the case that the peak values of the curves were set to 1. Schematic drawings of the reporter plasmids are shown on the left. (B) Western blot analysis of FLuc and ELuc in NIH3T3 cells. The expression plasmids pCMV-Flag::FLuc or pCMV-Flag::ELuc were transfected into NIH3T3 cells, which were harvested and disrupted 48 h later. Both luciferases were detected using the anti-Flag M2 antibody. Tubulin was used as an internal control. The positions of molecular weight markers are indicated on the left margin of each panel. (C) Stability of destabilized FLuc (orange filled circles) and ELuc (green filled circles) in NIH3T3 cells. NIH3T3 cells were independently transfected with SV40-dFLuc or SV40-dELuc and the culture medium was replaced with Dulbecco's modified Eagle's medium (DMEM) supplemented with 10% FBS and 100 mM cycloheximide. After 20 min (time = 0), incubation was continued in DMEM supplemented with 10% FBS and 100 mM cycloheximide. At the indicated times, cells were disrupted and luciferase activity was measured. Error bars indicate the standard deviation (n = 6). (D) Emission spectra of FLuc (orange line) and ELuc (green line) in viable cells. NIH3T3 cells seeded in 35 mm dishes were transfected with pGVC2 (for FLuc) or pCMV-ELuc and incubated for 48 h. To obtain the spectra, the culture medium was replaced with DMEM without phenol red supplemented with 10% FBS and 200 mM D-luciferin, and incubated for 12 h. Spectra were then measured. (E) Kinetics of light production by purified FLuc (orange filled circles) and ELuc (green filled circles) exposed to D-luciferin, adenosine triphosphate, and Mg2+. The peak values were set to 1. Error bars indicate the standard errors (n = 3).
Assay for Adenylation
Wilson DJ, Aldrich CC. A continuous kinetic assay for adenylation enzyme activity and inhibition. Anal Biochem 2010; doi: 10.1016/j.ab.2010.04.033.
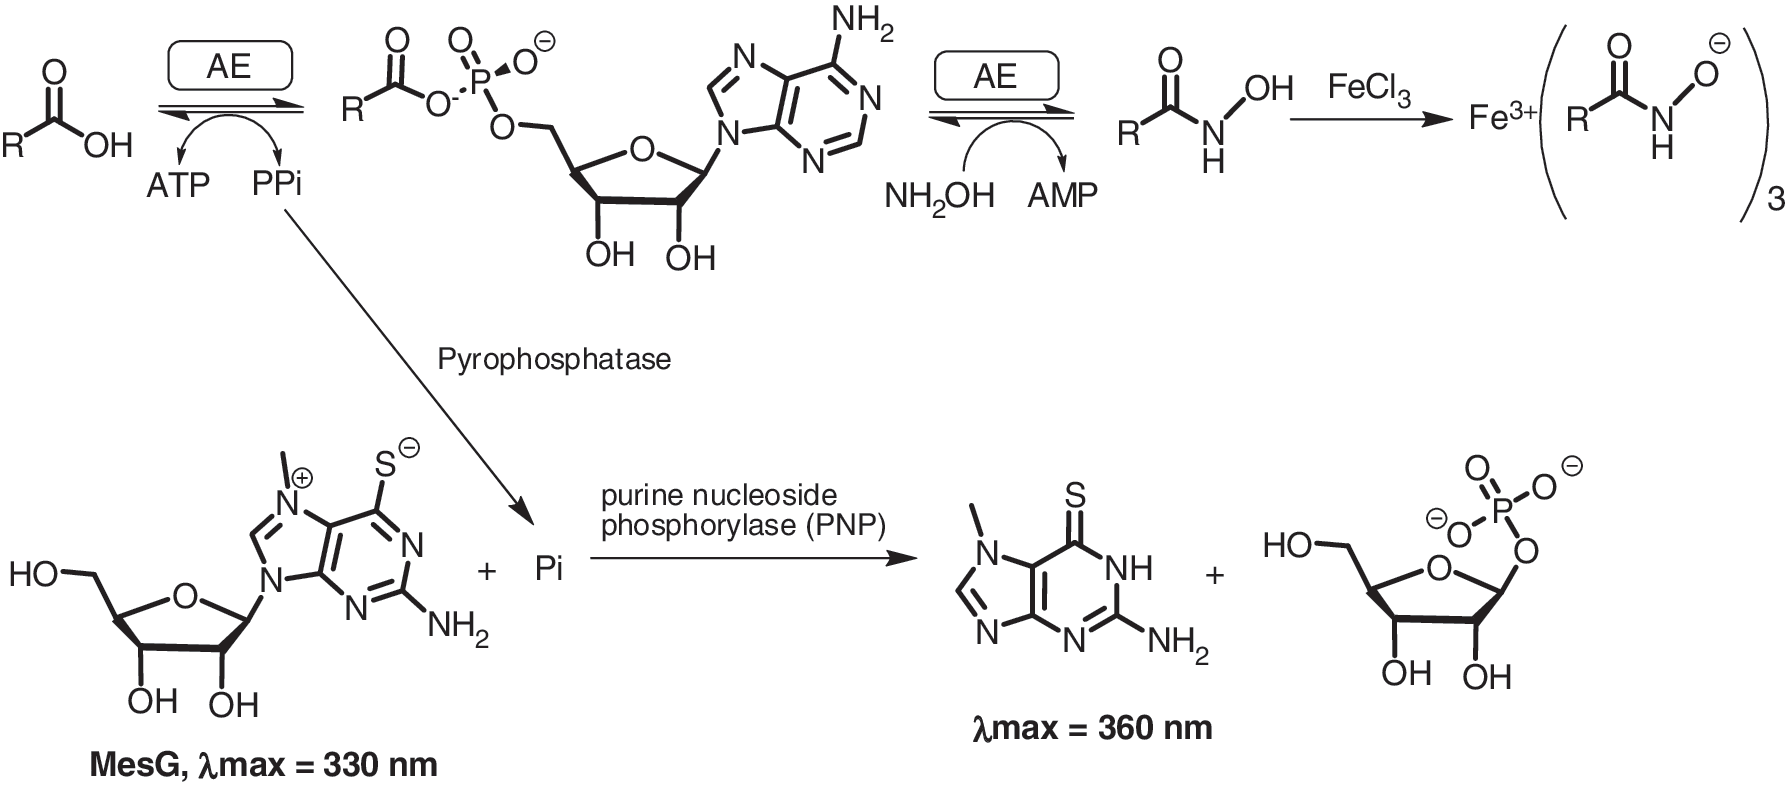
Abstract: Adenylation/adenylate-forming enzymes catalyze the activation of a carboxylic acid at the expense of adenosine triphosphate (ATP) to form an acyl-adenylate intermediate and pyrophosphate (PPi). In a second half-reaction, adenylation enzymes catalyze the transfer of the acyl moiety of the acyl-adenylate onto an acceptor molecule, which can be either a protein or a small molecule. We describe the design, development, and validation of a coupled continuous spectrophotometric assay for adenylation enzymes that employs hydroxylamine as a surrogate acceptor molecule leading to the formation of a hydroxamate. The released pyrophosphate from the first half-reaction is measured using the pyrophosphatase–purine nucleoside phosphorylase coupling system with the chromogenic substrate 7-methylthioguanosine (MesG). The coupled hydroxamate–MesG assay is especially useful for characterizing the activity and inhibition of adenylation enzymes that acylate a protein substrate and/or fail to undergo rapid ATP-PPi exchange.
Commentary:Enzymes that utilize ATP to catalyze the adenylation of substrates have essential roles in biology, including the synthesis of fatty acids and the aminoacylation of tRNAs with their cognate amino acids. Certain adenylate-forming enzymes can be assayed measuring an ATP-PPi (inorganic pyrophosphate) exchange reaction, which occurs in the absence of the adenylate accepting substrate, but this is typically performed in an assay using radioactivity with separation steps. In addition to the low-throughput of the exchange reaction, certain enzymes do not readily release PPi which prevents detection of activity by the ATP-PPi exchange assay. This article describes a 96-well (100 uL assay volume) absorbance-based kinetic assay, which should be useful for both screening and mechanism of action studies of adenylate forming enzymes. The assay measures adenylate formation using a strong nucleophile, hydroxylamine, which promotes turnover of the adenylation intermediate and build up of PPi. Pyrophosphatase is added to form inorganic phosphate, which, in the presence of MeSG and a purine nucleoside phosphorylase, forms ribose-1-phosphate and the chromogenic product: 7-methylthioguanine (λmax = 360 nm; see
figure
). This absorbance-based method shows a more robust signal than detection of the hydroxamate product with a FeCl3 reagent (see
figure
). The continuous assay was used to measure adenylation formation by several enzymes, including enzymes such as FadD28, which binds PPi very tightly, thus preventing ATP-PPi exchange assays. Direct determination of hydroxamate has also been unsuccessful for FadD28 as the long lipid chain product fails to show strong absorbance. However, the hydroxamate-MesG coupled assay allowed steady-state parameters to be measured for FadD28. The coupled assay was also used to measure the KI of tight-binding multisubstrate adduct inhibitors against several adenylate-forming enzymes. The radioactive ATP-PPi exchange assay could be used for some enzymes in the study to compare the steady-state parameters to those obtained in the hydroxamate-MesG-coupled assay. This showed that the specificity constant (kcat/KM) values were in agreement between the 2 formats. Overall, the continuous assay described here should be useful in the screening and characterization of adenylate-forming enzymes. Contributed by Doug Auld.
Hydroxamate formation assay. In the absence of the native acceptor the tightly bound acyl adenylate can be released with hydroxylamine forming the acyl hydroxymate and releasing AMP. Product formation may then be monitored by coupling the release of PPi to the cleavage of the UV indicator MesG in a continuous format. Addition of Fe allows for end point monitoring of the hydroxamate. (adenylation enzyme).
Zero-mode Waveguides: Watching Protein Being Made
Uemura S, Echeverriá Aitken C, Korlach J, Flusberg BA, Turner SW, Puglisi JD. Real-time tRNA transit on single translating ribosomes at codon resolution. Nature 2010;464:1012–1018.
Abstract: Translation by the ribosome occurs by a complex mechanism involving the coordinated interaction of multiple nucleic acid and protein ligands. Here we use zero-mode waveguides (ZMWs) and sophisticated detection instrumentation to allow real-time observation of translation at physiologically relevant micromolar ligand concentrations. Translation at each codon is monitored by stable binding of transfer RNAs (tRNAs)—labeled with distinct fluorophores—to translating ribosomes, which allows direct detection of the identity of tRNA molecules bound to the ribosome and therefore the underlying messenger RNA (mRNA) sequence. We observe the transit of tRNAs on single translating ribosomes and determine the number of tRNA molecules simultaneously bound to the ribosome, at each codon of an mRNA molecule. Our results show that ribosomes are only briefly occupied by 2 tRNA molecules and that release of deacylated tRNA from the exit (E) site is uncoupled from binding of aminoacyl-tRNA site (A-site) tRNA and occurs rapidly after translocation. The methods outlined here have broad application to the study of mRNA sequences, and the mechanism and regulation of translation.
Commentary:The ZMW technology was first featured here over a year ago when the team from Pacific Biosciences published this innovative detection platform and its application to real-time DNA sequencing (Science 2009;32:133–138 and ASSAY 2009;7:16–19). ZMW is a nanophotonic structure that permits the excitation of a sample within a tightly confined volume, thereby allowing detection of a single fluorescence emission event occuring within the detection space against the high background of fluorescent species present in the bulk sample. Here, Joseph Puglisi and colleagues, together with collaborators from Pacific Biosciences, take the ZMW technology to the world of protein synthesis. The authors use fluorescently labeled tRNAs in conjunction with a ZMW detection platform to detect the codon-dependent tRNA recruitment and ribosome-site-specific engagement in real time (see
figure
). Three colors were used to label 3 different amino-acid-charged tRNAs in these experiments: fMet-tRNAfMet was labeled with Cy3 and served to test the initial engagement of a charged tRNA onto the ribosome (the latter being attached to the ZMW surface), Phe-tRNAPhe was labeled with Cy5 and represented the second amino acid to be added, while Lys-tRNALys was Cy2-labeled and was the third amino acid within the initial polypeptide sequence. Initiation of translation by fMet-tRNAfMet was detected by an initial pulse of Cy3 fluorescence, while the recruitment of the downstream tRNAs and construction of the polypeptide were detected by pulses resulting from the fluorescence resonance energy transfer (FRET) events taking place between the labeled tRNA already occupying a ribosome site or the termination of FRET upon the departure of a labeled tRNA from the ribosome (see
figure
, panel b). To monitor all of the above processes in real time, the ZMWs were illuminated with 488, 532, and 642 nm excitation sources simultaneously. Using this system, the authors were able to distinguish and evaluate the rates of the each distinct step involved in the biosynthesis of the 13-amino-acid model peptides Met-(Phe-Lys)6 and Met-(Phe-Lys-Lys)4 (Fig. 3 of the article). The timing of the steps and fidelity of amino acid incorporation were also studied under different reagent conditions and in the presence of inhibitor of the elongation complex. These results are information-rich and should spur numerous follow-on studies based on this technology. Contributed by Anton Simeonov.
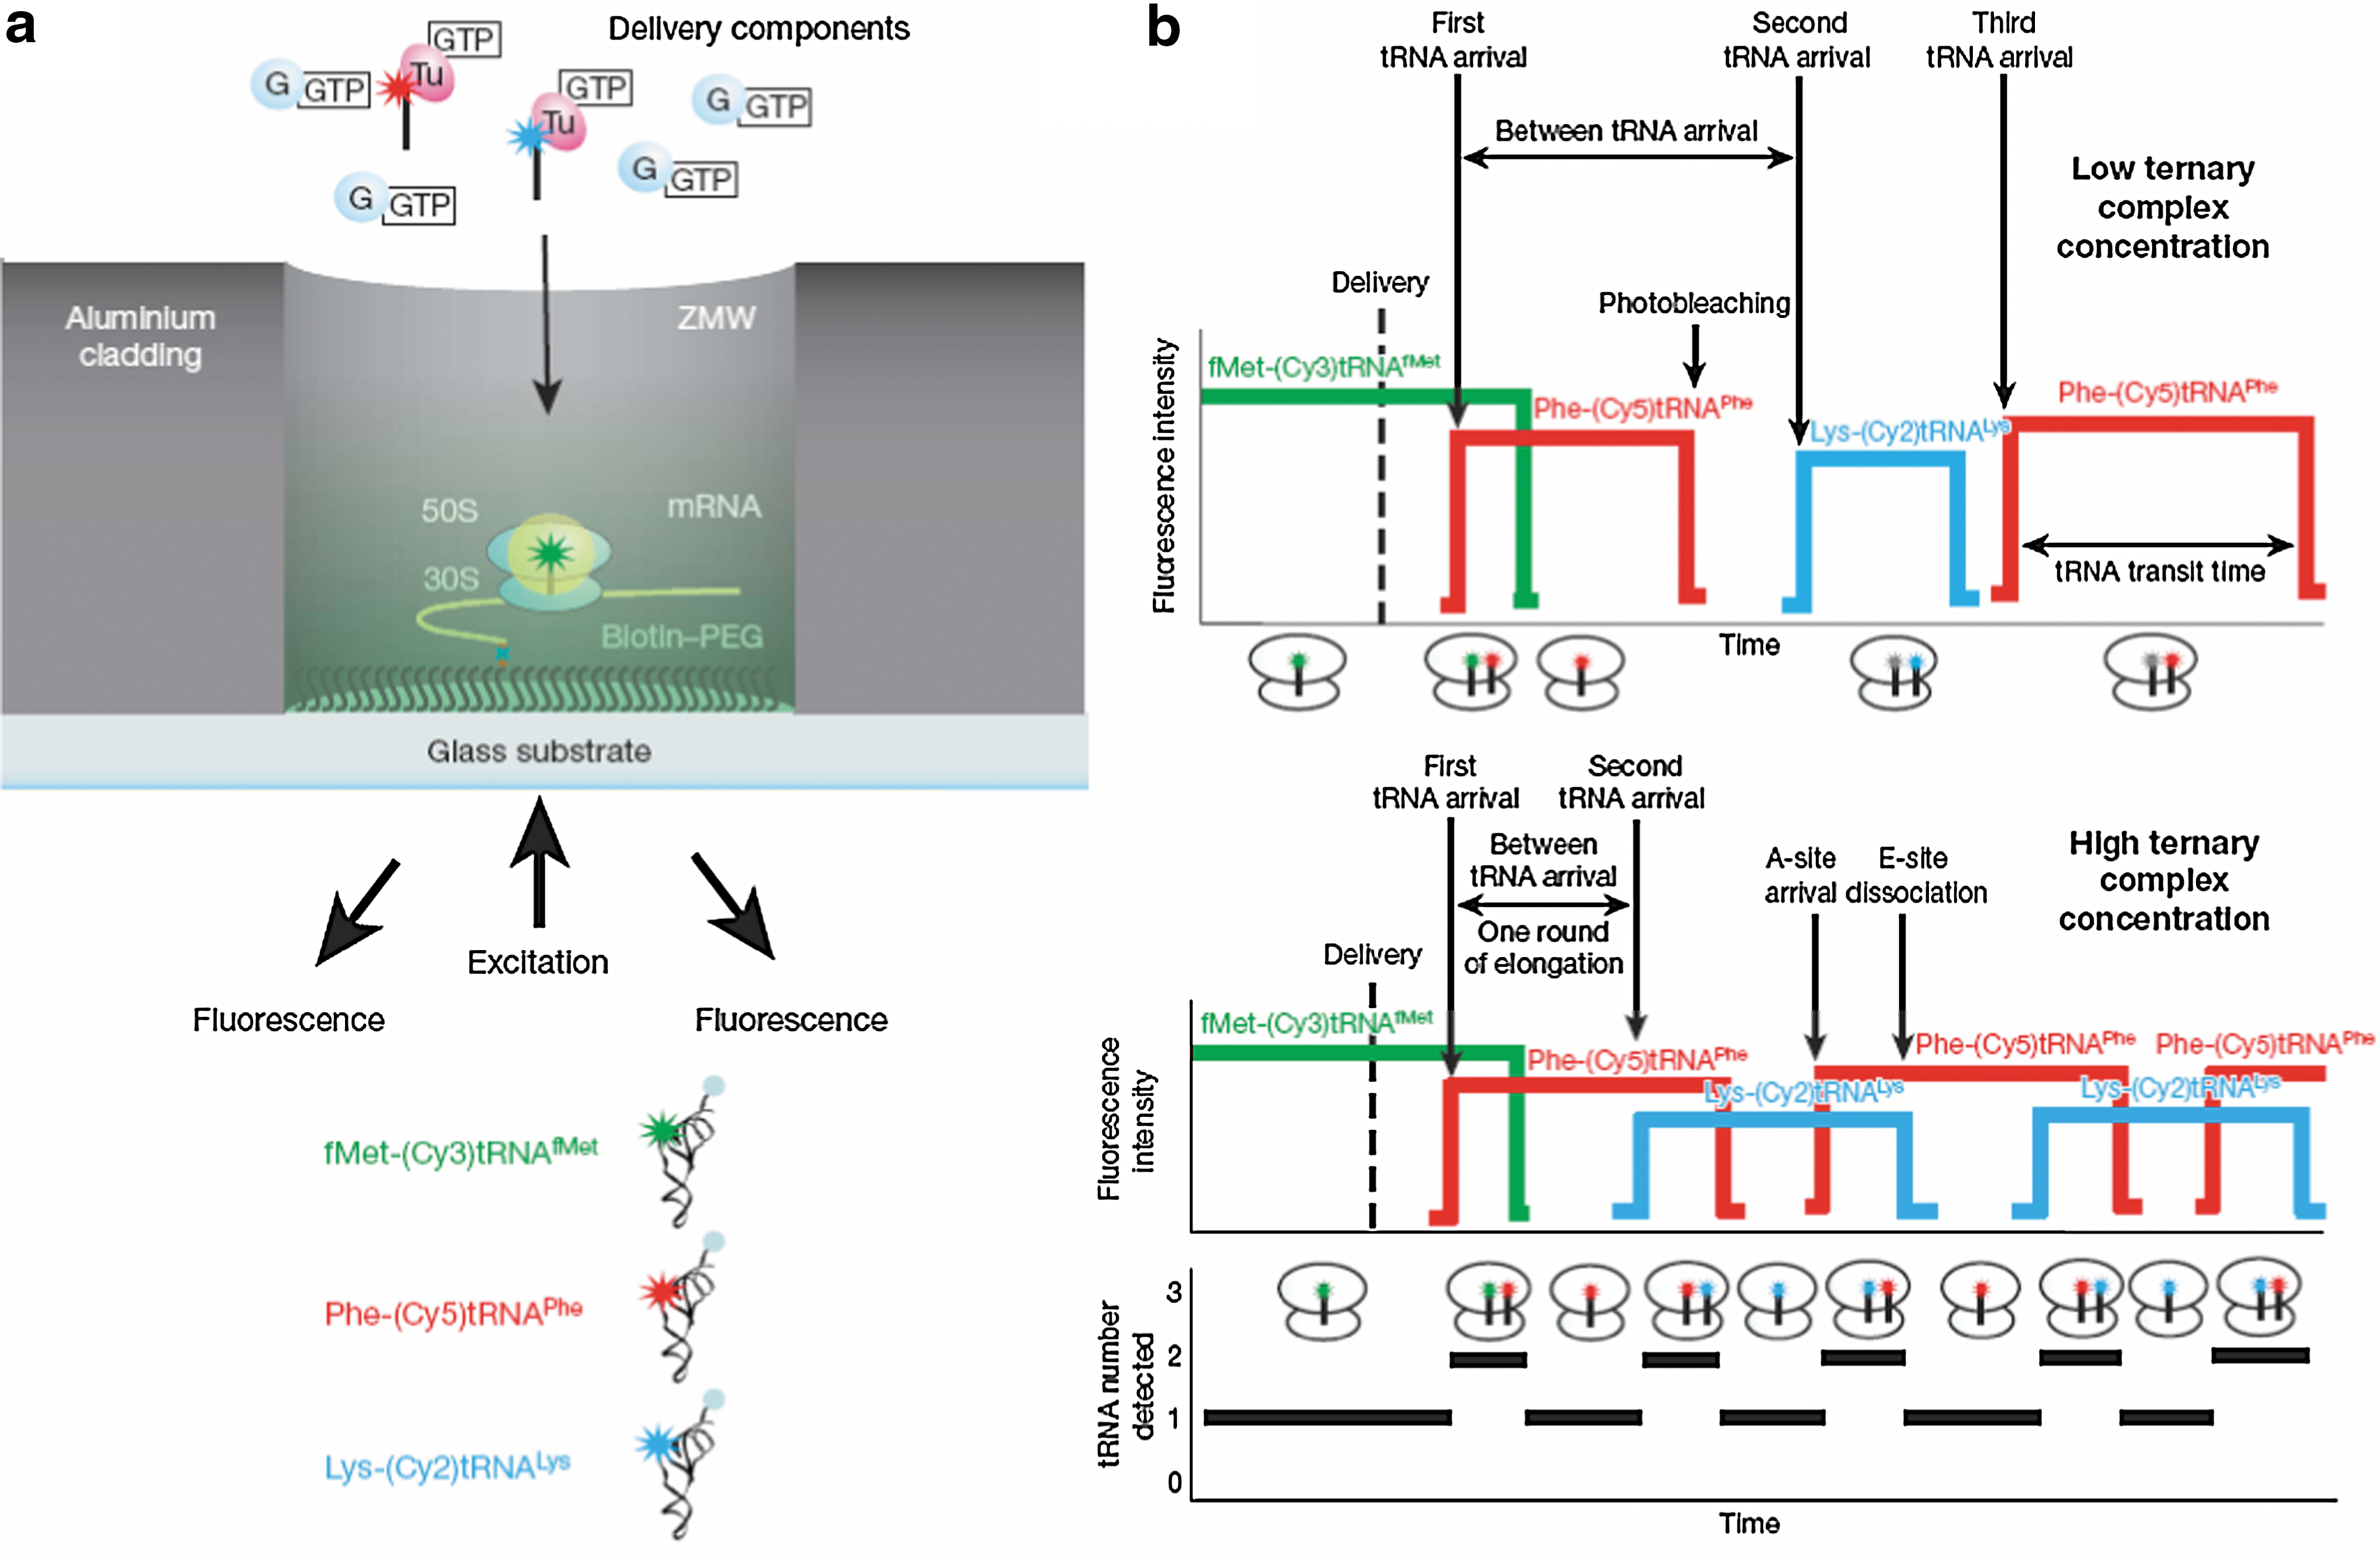
Translation in zero-mode waveguides (ZMWs) (Uemura et al.). (a) Experimental setup. ZMWs are cylindrical nanostructures with varying diameters (∼50–200 nm). The aluminium side wall and quartz bottom surfaces are derivatized to allow specific biotin–streptavidin interactions on the quartz surface and to block nonspecific interactions of molecules with ZMWs. Ribosomal complexes are specifically immobilized in the bottom of derivatized ZMWs using biotinylated mRNAs. Ternary complexes Cy5-labeled Phe-tRNAPhe-EF-Tu(GTP) and Cy2-labeled Lys-tRNALys-EF-Tu(GTP), along with EF-G(GTP), are delivered to a ZMW surface-immobilized, initial ribosome complex containing Cy3-labelled fMet-tRNAfMet. Fluorescence is excited by illumination at 488, 532, and 642 nm, and Cy2, Cy3, and Cy5 fluorescence are simultaneously detected using previously described instrumentation. (b) Expected signal sequence. Initiation complexes are detected by fluorescence of fMet-(Cy3)tRNAfMet bound at an initiation codon. Fluorescent tRNAs are delivered as ternary complexes. Arrival of Phe-(Cy5)tRNAPhe or Lys-(Cy2)tRNALys at the ribosomal A site is marked by a red or blue fluorescent pulse. At low concentrations of ternary complex, tRNA arrival times are slow (much longer than 1 s), and Cy5- or Cy2-labeled tRNAs can photobleach on the ribosome while waiting for translocation. In the absence of photobleaching, the length of a pulse represents the transit time of that tRNA on the ribosome. At high concentrations of ternary complex, tRNA arrival times are fast (much less than 1 s), and fluorescent pulses are overlapped, which indicates simultaneous occupancy by 2 tRNA molecules. The tRNA occupancy count is shown below the schematic trace.
Zero-mode Waveguides: Real-Time Detection of Dna Methylation
Flusberg BA, Webster DR, Lee JH, Travers KJ, Olivares EC, Clark TA, Korlach J, Turner SW. Direct detection of DNA methylation during single-molecule, real-time sequencing. Nat Methods Adv Online Publ 2010;7:461-465.
Abstract: We describe the direct detection of DNA methylation, without bisulfite conversion, through single-molecule, real-time (SMRT) sequencing. In SMRT sequencing, DNA polymerases catalyze the incorporation of fluorescently labeled nucleotides into complementary nucleic acid strands. The arrival times and durations of the resulting fluorescence pulses yield information about polymerase kinetics and allow direct detection of modified nucleotides in the DNA template, including N6-methyladenine, 5-methylcytosine, and 5-hydroxymethylcytosine. Measurement of polymerase kinetics is an intrinsic part of SMRT sequencing and does not adversely affect determination of primary DNA sequence. The various modifications affect polymerase kinetics differently, allowing discrimination between them. We used these kinetic signatures to identify adenine methylation in genomic samples and found that, in combination with circular consensus sequencing, they can enable single-molecule identification of epigenetic modifications with base-pair resolution. This method is amenable to long read lengths and will likely enable mapping of methylation patterns in even highly repetitive genomic regions.
Commentary:The triumph of zero-mode waveguide (ZMW) continues unabated: in this recent Nature Methods communication, the team from Pacific Biosciences demonstrates the real-time detection of methylated bases during DNA sequencing. Determining the specific sites of methylation within a DNA sample is expected to provide crucial information in a wide range of epigenetic studies, including those related to disease progression and embryonic development; however, the widely used method of bisulfite sequencing carries multiple drawbacks. The ZMW detection is the core technology used by this team and was introduced in the previous commentary (see above) and in an earlier contribution to these pages (ASSAY 2009;7:16–19). With DNA polymerase immobilized onto ZMWs, one can detect the approach of a fluorescently labeled deoxynucleotide triphosphate (dNTP) and the brief stalling of a correct nucleotide during the covalent incorporation of the nucleobase into the growing DNA strand, and by recording the sequence of colors (corresponding to each of the 4 dNTPs) passing by each ZMW to ultimately derive DNA sequence information for the sample. Here, advantage was taken of the fact that ZMWs permit not only the detection of stalled and incorporated nucleotides based on emission wavelength but also the precise timing of fluorescence pulses. Thus, the authors hypothesized that if DNA polymerase encounters a methylated or similarly modified template base, the kinetics of complementary base incorporation would be affected and result in a delay in nucleotide utilization that could be used to flag modifications to the template bases relative to a wild-type background. Sequencing templates containing methylated A and C bases, as well as 5-hydroxymethylated C, were tested using the ZMW sequencing instrument. As anticipated, significant delays preceding the incorporation of a complementary base opposite a modified template base were observed (see
figure
). The delays (termed interpulse duration or IPD) occurred with different modified template bases and in different sequence contexts (Fig. 2 of the article). Consistent with a binding model where the polymerase resides on the template both before and after the incorporation event, changes in IPD were observed for several incorporation steps surrounding the modified base. By sequencing the same DNA after it was subjected to PCR amplification (the latter resulting in the loss of methylation information), one could establish the methylation sites of the original sample unambiguously. Having established the detection of modified base using a homogeneous template, the authors moved to apply this approach to the sequencing of a mixed-population sample containing methylated and nonmethylated template bases (Fig. 4 of the article), as well as Escherichia coli–derived DNA samples isolated from a DNA adenine methyltransferase-positive strain (Fig. 5 and Table 1 of the article). With this demonstration of direct methylation sequencing of a genomic DNA sample, and given the availability of the ZMW platform as a standalone instrument, it is anticipated that the present report will lead to a rapid testing of the method by additional laboratories and in a more sophisticated sample context. Contributed by Anton Simeonov.
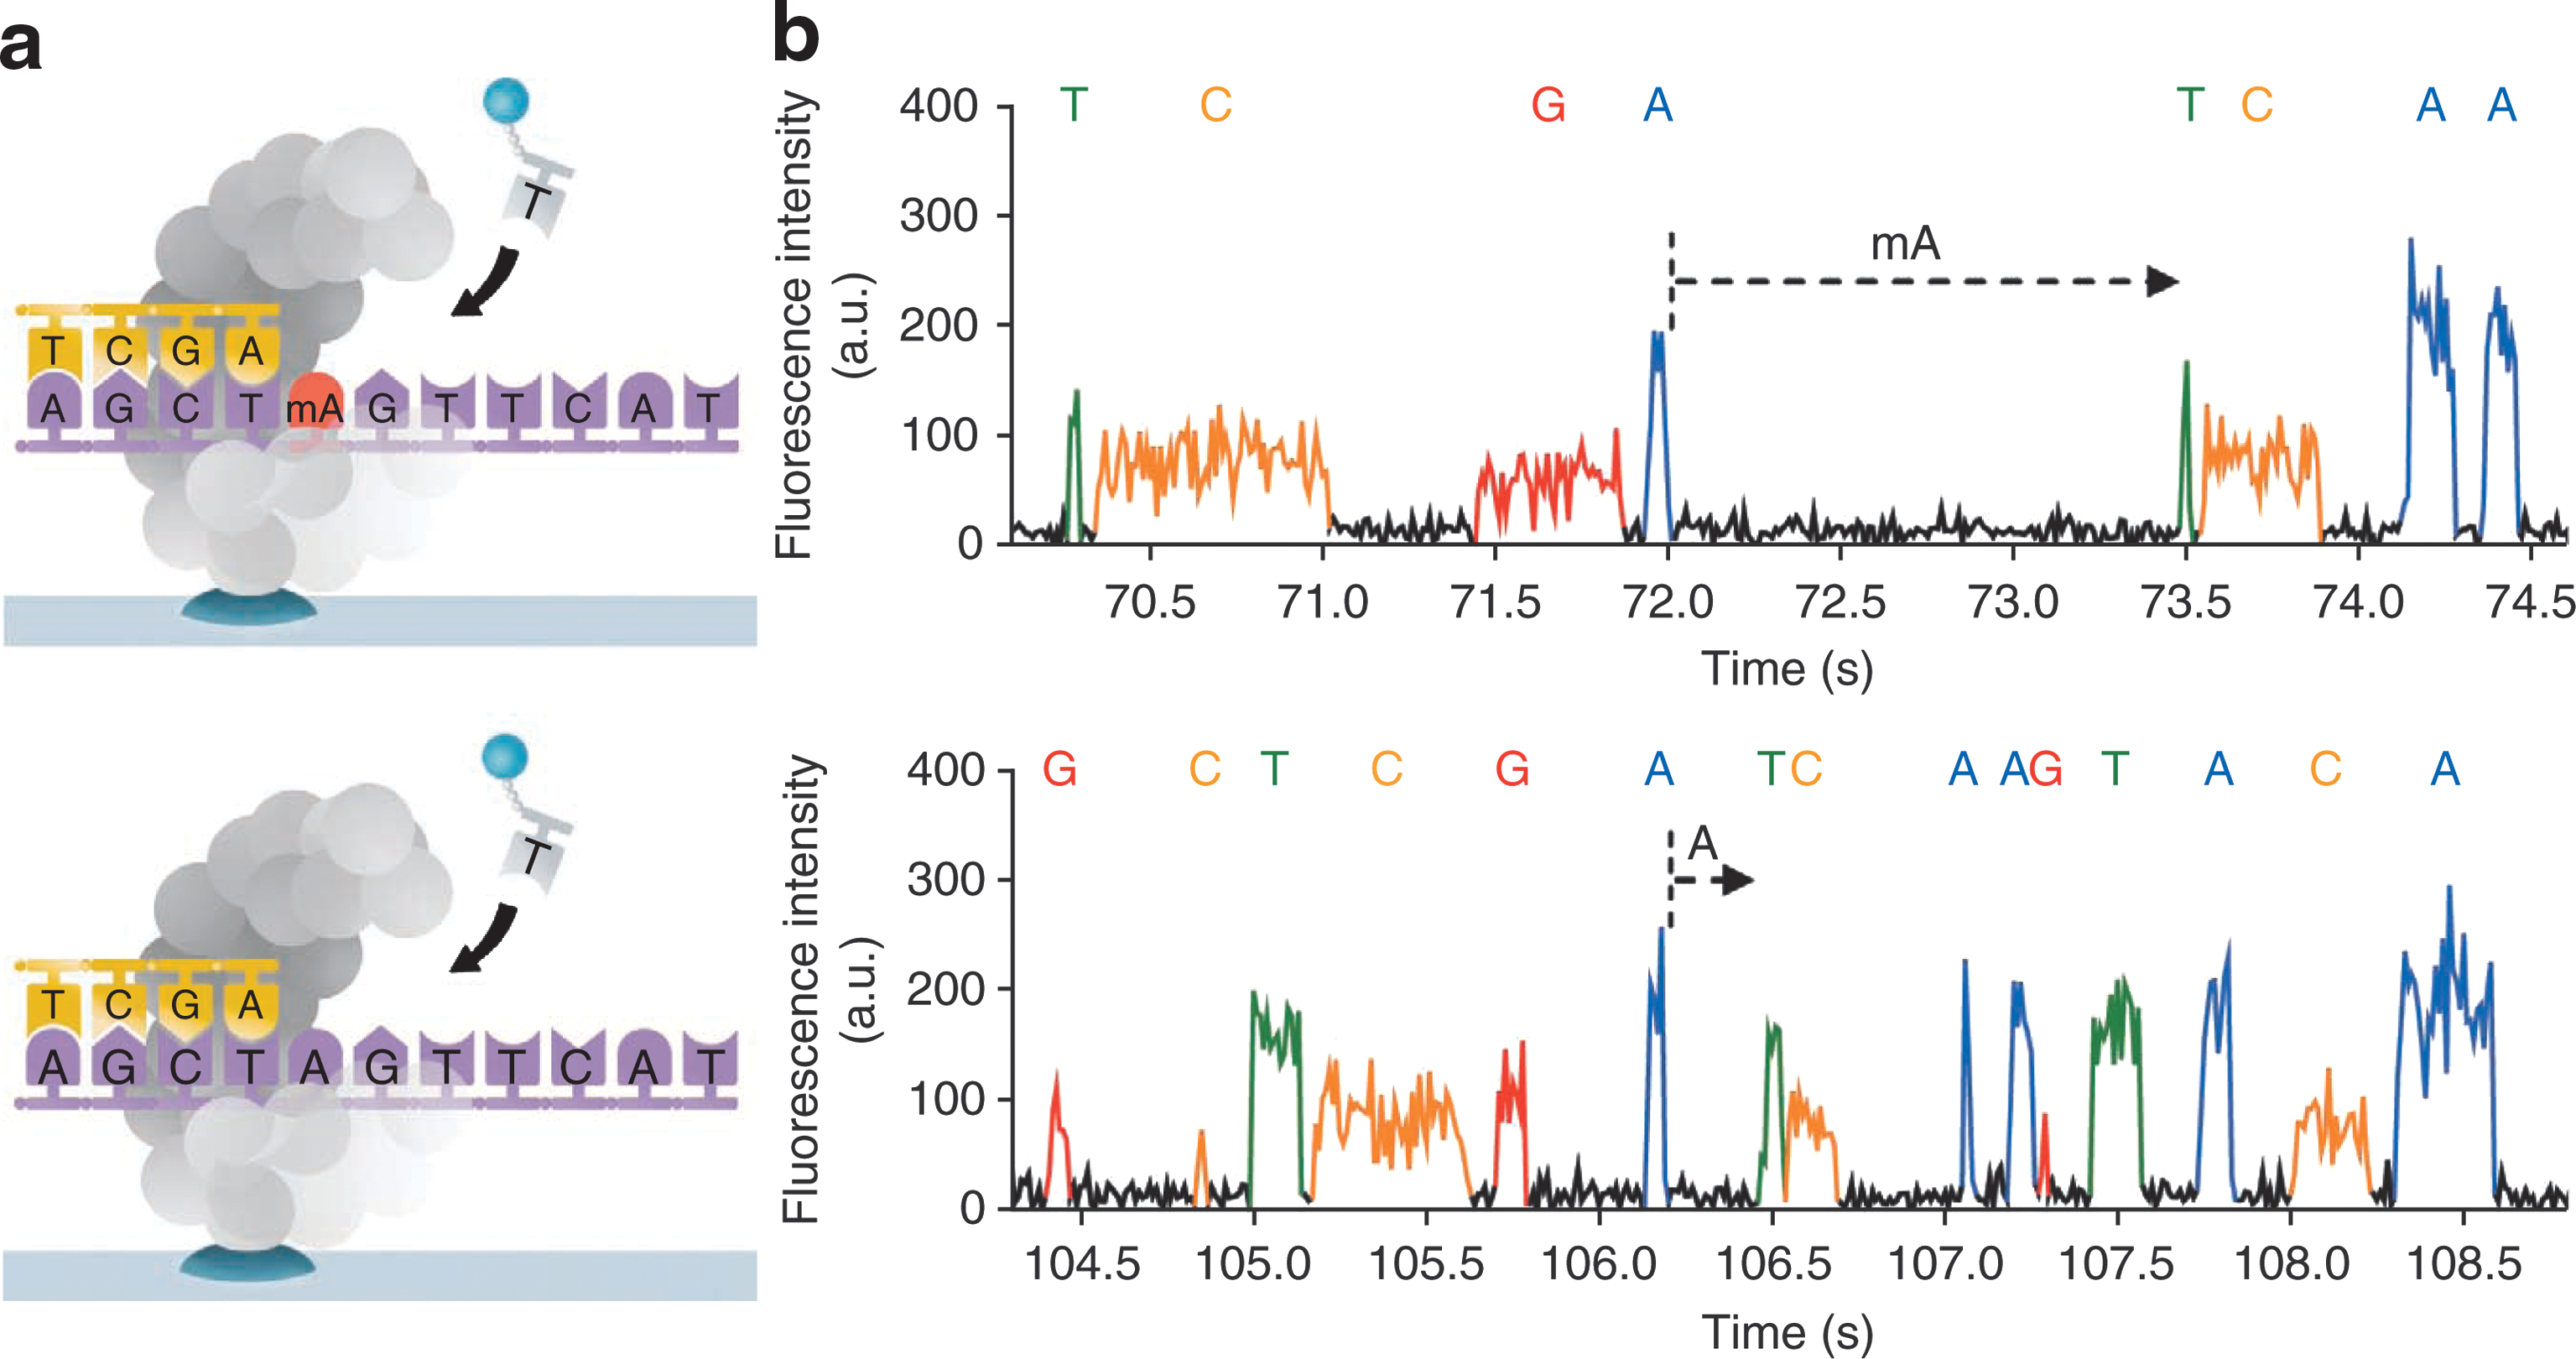
Principle and corresponding example of detecting DNA methylation during single-molecule, real-time (SMRT) sequencing. (a) Schematics of polymerase synthesis of DNA strands containing a methylated (top) or unmethylated (bottom) adenine. (b) Typical SMRT sequencing fluorescence traces for samples in a. Letters above the fluorescence trace pulses indicate the identity of the nucleotide incorporated into the growing complementary strand. Dashed arrows indicate the interpulse duration (IPD) before incorporation of the cognate thymine. For this typical example, the IPD is about 5 times larger for mA in the template compared to adenine.
Stickier than Streptavidin
Chivers CE, Crozat E, Chu C, Moy VT, Sherratt DJ, Howarth M. A streptavidin variant with slower biotin dissociation and increased mechanostability. Nat Methods 2010;7:391–393.
Abstract: Streptavidin binds biotin conjugates with exceptional stability but dissociation does occur, limiting its use in imaging, DNAdna amplification, and nanotechnology. We identified a mutant streptavidin, traptavidin, with more than 10-fold slower biotin dissociation, increased mechanical strength, and improved thermostability; this resilience should enable diverse applications. FtsK, a motor protein important in chromosome segregation, rapidly displaced streptavidin from biotinylated DNA, whereas traptavidin resisted displacement, indicating the force generated by FtsK translocation.
Commentary:The applications of the biotin-streptavidin system have been numerous and highly successful, yet there are instances of experimental settings where improved properties of this classic affinity pair are needed. A major deficiency has recently been associated with the “leakiness” of the interaction: under conditions brought about by some modern applications such as nanoparticle attachment or imaging under low endosomal pH, the affinity of the pair worsens, leading to a lack of association between biotin and streptavidin and/or accelerated off rate of the complex. The increased off rate presents a particular problem during tracking of longer lived protein interacting pairs within the endosome or lysosome, making the half-life of the biotin-streptavidin shorter than that of the system under observation and rendering the experiment impossible. Here, Chivers and colleagues evolve streptavidin rationally by generating a collection of mutants containing randomized amino acids only within several key sites considered by the authors to be important for locking the biotin's carboxyl group in place and preventing its dissociation. Conversely, streptavidin amino acid residues responsible for interactions with the main biotin ring structure were left unmutated as those have been shown in previous studies to have been naturally selected for maximal binding. The resulting protein, termed traptavidin, possessed an off rate over 10-fold lower than that of the native biotin-streptavidin pair. Measurement of these very slow off rates was performed by first preincubating a nanomolar concentration of fluorescein-labeled biotin with an excess of streptavidin (low micromolar concentration) to form the complex. Then, an excess of unlabeled biotin was added (concentration in the order of hundreds of micromolar), ensuring that for every event of fluorescein-biotin leaving, the binding site an unlabeled counterpart would immediately occupy the latter, making reengagement of the labeled species impossible. To monitor this process, the authors used the previously noted change in fluorescence intensity of fluorescein upon its incorporation into the biotin-streptavidin pair: a release of the labeled probe was detected continuously as an increasing signal from which the off rate could be calculated (see
figure
, panel c). Because the dissociation was taking place on the scale of hours, the off rate measurements at low pH where fluorescein is nonfluorescent were performed by taking aliquots of the dissociation reaction and rapidly adjusting their pH back to neutral before measuring fluorescence (see
figure
, panel d). In further assessment of traptavidin's properties, the authors also established its improved thermal stability and the increased thermal stability of the corresponding affinity pair (Fig. 2 in the article). Finally, in a direct demonstration of utility in a highly demanding experiment, traptavidin enabled monitoring of strand translocation of the helicase-type molecular motor FtsK, whose function is thought to include chromosome dimer separation just before bacterial division to ensure that chromosomes are faithfully distributed to the 2 daughter cells. With traptavidin, the authors were able to track this fast translocation process (Fig. 3 in the article). In addition to a dramatically slower off rate and improved stability, traptavidin could be produced easily by recombinant methods; all these features make it a good candidate to replace streptavidin. Contributed by Anton Simeonov.
Traptavidin has a slower dissociation rate from biotin conjugates compared to streptavidin. (a) PyMOL images showing the residues mutated to produce traptavidin (S52G,R53D) in structures of streptavidin with biotin (1mk5) and without biotin (1swa). Biotin is shown as spheres of van der Waals radius. Ser52 and Arg53 are green. Without biotin, the L3/4 loop is disordered and does not give clear electron density. (b) Streptavidin and traptavidin off rates, measured by binding the proteins to [3H]biotin, then adding excess nonradioactive biotin and determining the fraction of [3H]biotin remaining bound after varying times at 37°C and pH 7.4. (c) Dissociation rates of traptavidin, streptavidin, and avidin at pH 7.4. The proteins bind to biotin–4-fluorescein, quenching its fluorescence; upon addition of excess free biotin, biotin–4-fluorescein dissociates, and the increase in fluorescence was measured at 37°C. (d) Traptavidin and streptavidin dissociation rates at pH 5.0, analyzed as in c. Error bars, 1 SD (n = 3). Some error bars are too small to be visible.
Aggregates Ingested
Doak AK, Wille H, Prusiner SB, Shoichet BK. Colloid formation by drugs in simulated intestinal fluid. J Med Chem 2010;53:4259–4265.
Abstract: Many organic molecules form colloidal aggregates in aqueous solution at micromolar concentrations. These aggregates promiscuously inhibit soluble proteins and are a major source of false-positives in high-throughput screening. Several drugs also form colloidal aggregates, and there has been speculation that this may affect the absorption and distribution of at least 1 drug in vivo. Here we investigate the ability of drugs to form aggregates in simulated intestinal fluid. Thirty-three biopharmaceutics classification system class II and class IV drugs, spanning multiple pharmacological activities, were tested for promiscuous aggregation in biochemical buffers. The 22 that behaved as aggregators were then tested for colloid formation in simulated intestinal fluid, a buffer mimicking conditions in the small intestine. Six formed colloids at concentrations equal to or lower than the concentrations reached in the gut, suggesting that aggregation may have an effect on the absorption and distribution of these drugs, and potentially others, in vivo.
Commentary:That a large fraction of members in any small molecule screening library form colloidal-size aggregates in solution and thereby have the ability to nonspecifically affect the corresponding screening assay results has been well-established, thanks to the almost decade-long research by Brian Shoichet, colleagues, and collaborators. Among the recent studies were 2 large-scale profiles of the public Molecular Libraries Small Molecules Repository, using AmpC beta-lactamase (a hydrolase) and cruzain (a cysteine protease) as reporters: in both profiles the aggregators contributed about 95% of the hits, clearly burdening the post-HTS hit validation process. These studies, along with others, confirmed that inclusion of detergent into the assay milieu drastically reduced the effect of promiscuous aggregators; however, a small number of “detergent-hardy” aggregators remained and a firm list of aggregators could not be established due to the context-dependent nature of the process. The persistent nature of the aggregation assay interference led Shoichet and collaborators to pursue the study reported in the present article: the team asked whether drugs indicated for oral dosing will form colloidal aggregates under conditions corresponding to those experienced by the drug during ingestion. First, 33 drugs were tested for colloid formation by particle analysis and detergent-conditional inhibition of the model enzyme cruzain. Two-thirds of the drugs tested formed colloidal particles as determined by particle analysis and also displayed detergent-sensitive enzyme inhibition (see
figures
). The authors then proceeded to test the 22 colloid formers in a fed-state simulated intestinal fluid, a buffer formulation (acetate pH 5.0 with added sodium taurocholate and lecithin) designed to mimic the medium within the intestine following food ingestion. Out of the 22 drugs that formed aggregates in regular biochemical buffers, 6 (Table 2 in the article) were shown to exist as colloids (see
second figure
) in the fed-state-simulated intestinal fluid. In addition to particle analysis, the colloid formation in this environment was confirmed by cosedimentation of added enzyme: aggregates formed by compounds in solution have been previously shown to sequester protein molecules and consequently to enrich them in the pellet upon centrifugation. While the results presented in this article do not directly prove the existence of colloidal drug particles in the human intestine, this first-of-a-kind study does make a strong case for the need to conduct detailed investigations into the physical state of drugs and drug candidates when considering in vivo absorption and distribution properties. Contributed by Anton Simeonov.
Chemical structures of drugs tested for aggregation in biochemical buffers.
Negative stain electron microscopy of colloid-forming compounds. (A) Phosphate buffer is shown with homogeneous background without particulates. (B) Itraconazole in phosphate buffer forms large colloids, whereas under the same conditions methylene blue (C) and delavirdine mesylate (D) form small and intermediate-sized colloids, respectively. (E) Negatively stained FeSSIF reveals only low-contrast lipid and detergent structures based on the taurocholate and lecithin content. Itraconazole (F), methylene blue (G), and delavirdine mesylate (H) retain their colloid-forming ability in FeSSIF, forming colloids similar to those seen in phosphate buffer. The contrast for panels B, C, D, G, and H was adjusted nonlinearly by using a high-pass Fourier filter to reduce the intensity of the negative stain. Scale bar = 100 nm.
Trypanosoma Brucei N-Myristoyltransferase/TbHKs: Silver Bullet(s) for Ancient Scourges?
Frearson et al. N-myristoyltransferase inhibitors as new leads to treat sleeping sickness. Nature 2010;464:728–734.
Abstract: African sleeping sickness or human African trypanosomiasis, caused by T. brucei spp., is responsible for 30,000 deaths each year. Available treatments for this disease are poor, with unacceptable efficacy and safety profiles, particularly in the late stage of the disease when the parasite has infected the central nervous system. Here we report the validation of a molecular target and the discovery of associated lead compounds with the potential to address this lack of suitable treatments. Inhibition of this target—T. brucei N-myristoyltransferase—leads to rapid killing of trypanosomes both in vitro and in vivo and cures trypanosomiasis in mice. These high-affinity inhibitors bind into the peptide substrate pocket of the enzyme and inhibit protein N-myristoylation in trypanosomes. The compounds identified have promising pharmaceutical properties and represent an opportunity to develop oral drugs to treat this devastating disease. Our studies validate T. brucei N-myristoyltransferase as a promising therapeutic target for human African trypanosomiasis.
Sharlow et al. A target-based high throughput screen yields Trypanosoma brucei hexokinase small molecule inhibitors with antiparasitic activity. PLoS Negl Trop Dis 2010;4:e659.
Abstract:Background: The parasitic protozoan Trypanosoma brucei utilizes glycolysis exclusively for adenosine triphosphate (ATP) production during infection of the mammalian host. The first step in this metabolic pathway is mediated by hexokinase (TbHK), an enzyme essential to the parasite that transfers the gamma-phospho of ATP to a hexose. Here we describe the identification and confirmation of novel small molecule inhibitors of bacterially expressed TbHK1, 1 of 2 TbHKs expressed by T. brucei, using a high-throughput screening assay.
Methodology/Principle Findings: Exploiting optimized high-throughput screening assay procedures, we interrogated 220,233 unique compounds and identified 239 active compounds from which 10 small molecules were further characterized. Computation chemical cluster analyses indicated that 6 compounds were structurally related while the remaining 4 compounds were classified as unrelated or singletons. All 10 compounds were approximately 20–17,000-fold more potent than lonidamine, a previously identified TbHK1 inhibitor. Seven compounds inhibited T. brucei blood stage form parasite growth (0.03 ≤ EC50 < 3 μM) with parasite specificity of the compounds being demonstrated using insect stage T. brucei parasites, Leishmania promastigotes, and mammalian cell lines. Analysis of 2 structurally related compounds, ebselen and Substance ID (SID) 17387000, revealed that both were mixed inhibitors of TbHK1 with respect to ATP. Additionally, both compounds inhibited parasite lysate-derived HK activity. None of the compounds displayed structural similarity to known hexokinase inhibitors or human African trypanosomiasis therapeutics.
Conclusions/Significance: The novel chemotypes identified here could represent leads for future therapeutic development against the African trypanosome.
Commentary:Human African trypanosomiasis (HAT), also known as sleeping sickness, is a parasitic disease prevalent in Sub-Saharan African regions, covering 36 counties and affecting 60 million people. Several epidemics occurred in the past century in Africa, with the most recent one reported in Uganda in 2008. The disease is caused by protozoa of 2 sub-species of the parasite Trypanosoma brucei, and is transmitted by the bites of infected tsetse flies. Although fewer new cases are reported per year, precise figures for current incidence and prevalence are difficult to obtain due to lack of surveillance and diagnostic expertise. Thus, HAT remains an important public health problem. Early stage of the infection denotes the proliferation of the parasites in the blood and lymphatic system, followed by late-stage disease where the central nervous system is ultimately invaded. Four drugs are registered to treat HAT: suramin and pentamidine are administered for the early stage treatment, whereas melarsoprol and eflornithine are for the later stages (Rodgers, J Neuroimmunology 2009;211:16–22). These drugs are applied for different forms of HAT, and they lead to undesirable adverse effects, such as toxicity and fatal encephalopathy, or present difficulty in administration. Despite recent treatment improvements made through nifurtimox-eflornithine combination therapy, new trypanocidal drugs or adjunct therapies are called for. Two complementary articles are highlighted here. In both, the researchers utilized target-based approach by focusing on enzymes that are essential for the survival of the parasite but distinct enough to avoid the attack of the host isozyme(s). Two parasite enzymes are featured, T. brucei N-myristoyltransferase (TbNMT) and T. brucei hexokinase (TbHK), both of which have been validated and are considered as attractive targets for therapeutic intervention. Compounds that emerged as top/confirmed hits from screening of libraries in 384-well format were further optimized and characterized using several methods. In the article by Sharlow et al., a screen of 220,223 unique compounds at a single concentration was performed against TbHK1, the first enzyme in glycolysis, through which ATP is exclusively generated by bloodstream form (BSF) T. brucei. In this screen, a coupled enzymatic assay was adapted: phosphorylation of glucose to glucose-6-phosphate (G6P) catalyzed by rTbHK1 in the presence of Mg2+ and ATP, and subsequent conversion of G6P into 6-phosphoglucono-γ-lactone by glucose-6-phosphate dehydrogenase (G6PDH) in the presence of NAD+. Absorbance remained stable for up to 5 h and was measured after the addition of stop reagent. The TbHK1-G6PDH coupled assay was optimized and validated, and showed high reproducibility between duplicate screens using the Library of Pharmacologically Active Compounds (LOPAC)set (see
first figure
). An assay for the coupling enzyme was also implemented as a counter-screen to eliminate false-positives. Of the 10 compounds confirmed for IC50 < 50 μM, 6 were classified as structurally related (cluster 1) and 4 were singletons (see
table
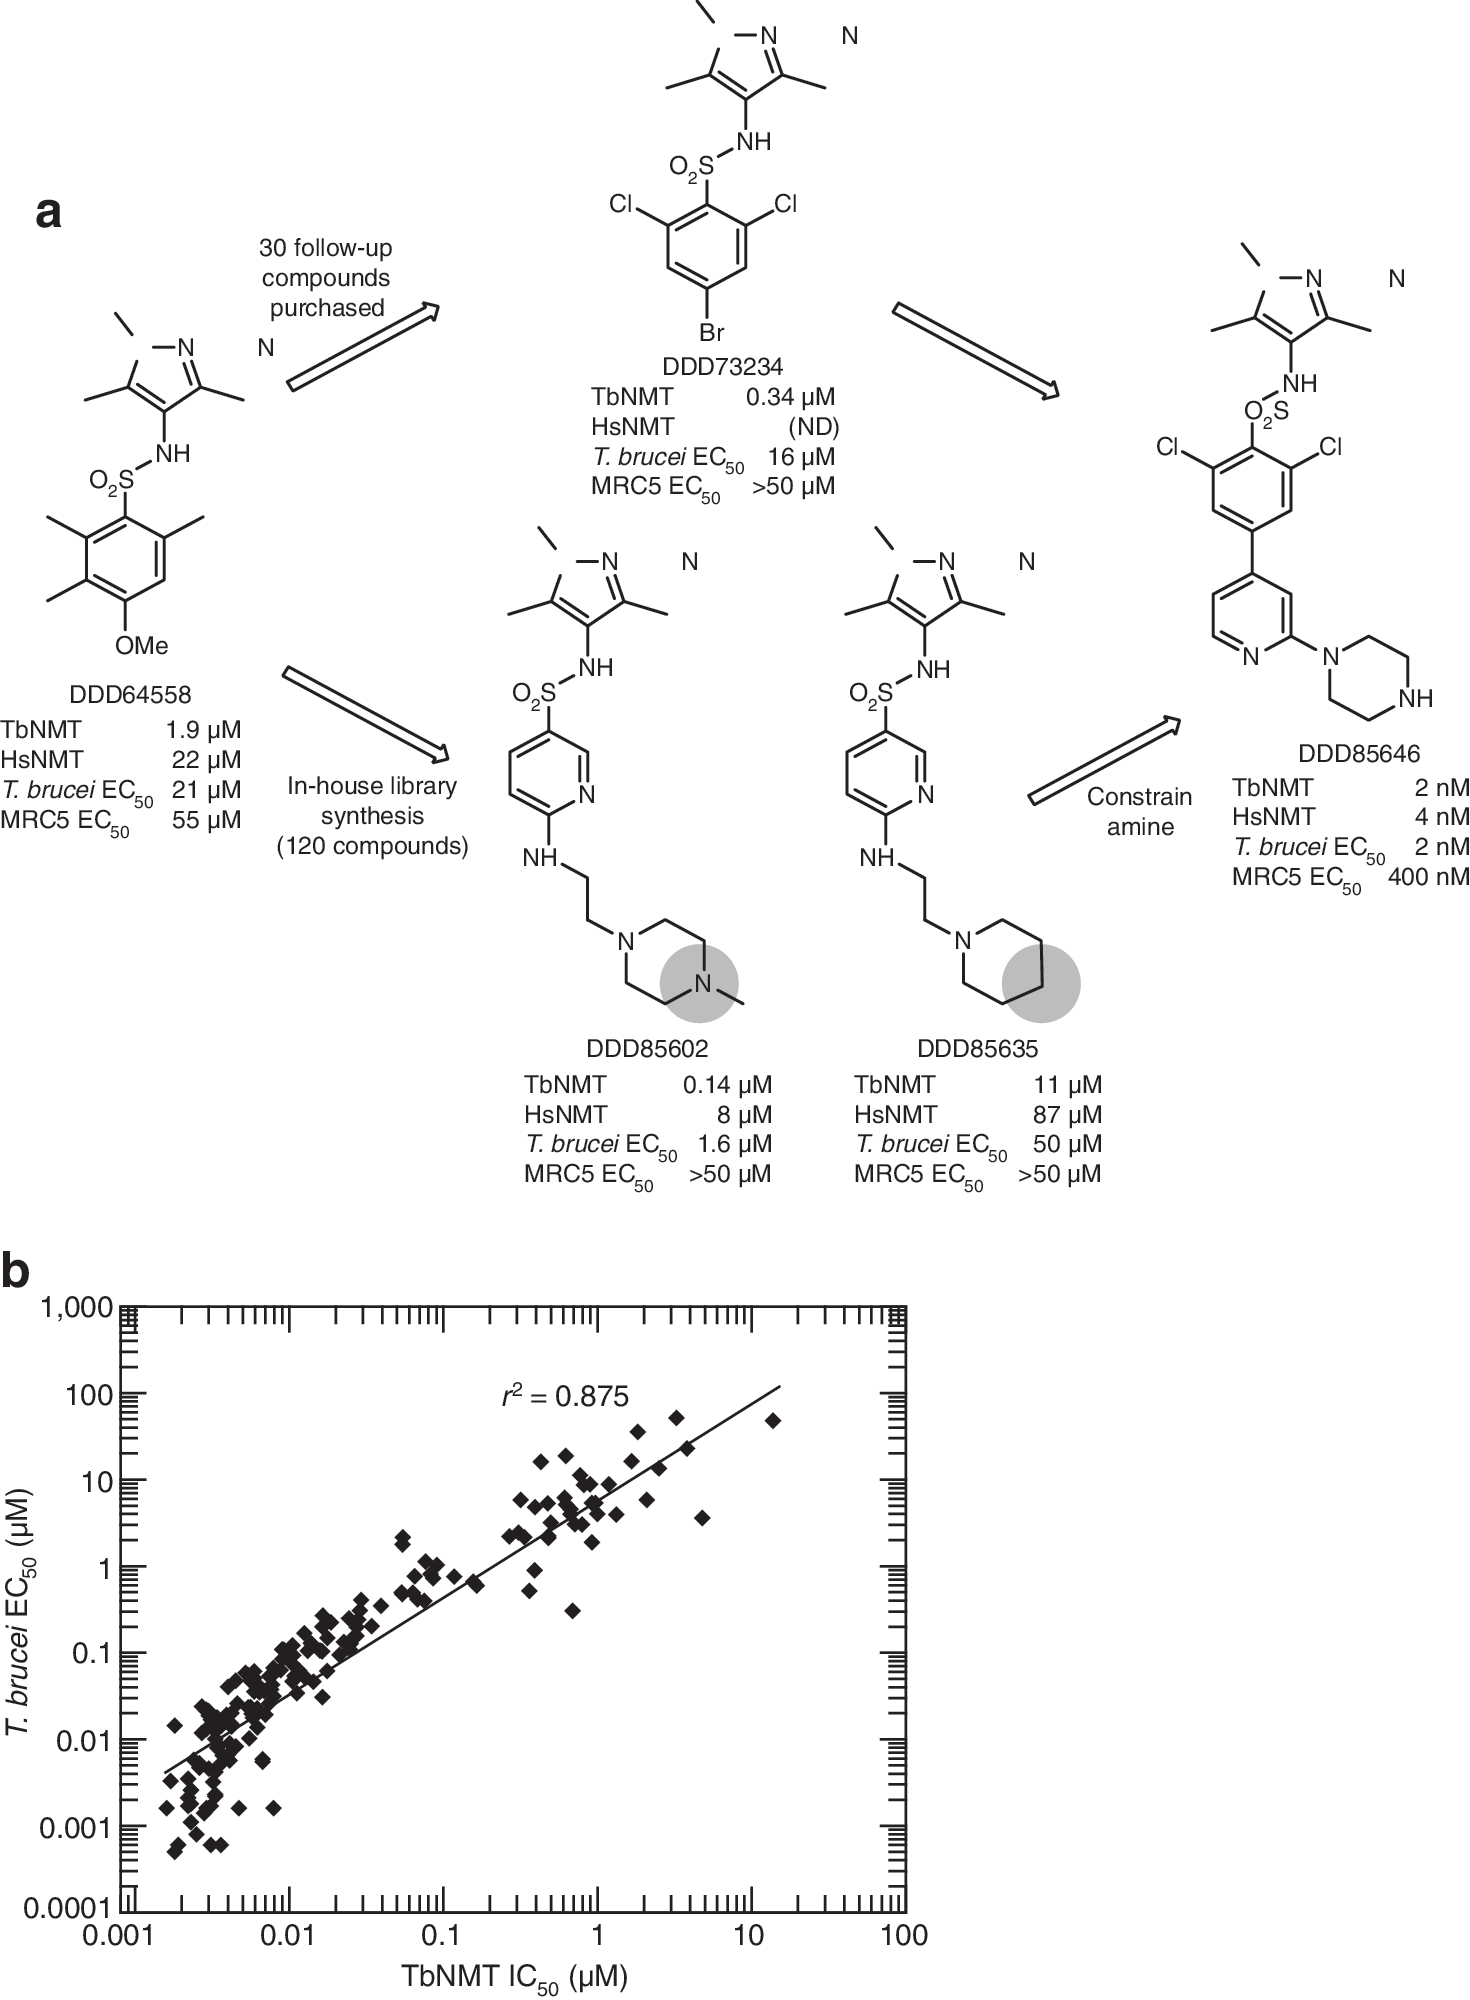
). Additional specificity and viability tests includedan in vitro selectivity assay against human glucokinase (hGlk), and effects on cell growth using BSF, procyclic form parasites, Leishmania promastigote, and human cell lines. Significant parasite selectivity was obtained as at least 400-fold difference in toxicity between human cell lines and parasites for the most potent compounds. In the article by Frearson et al., a pyrazole sulphonamide scaffold with the lead compound DDD85646 (see
second figure
, panel a) was identified through a screen of 62,000 compounds against TbNMT(1), an enzyme predicted to be responsible for N-myristoylation of over 60 proteins in T. brucei. A scintillation proximity assay was applied in the screen, which followed the 2-substrate reaction that occurs in protein N-myristoylation: a high-affinity complex formation between TbNMT and myristoyl-CoA in the absence of substrate peptide and the release of free CoA and myristoylated peptide upon the addition of the TbNMT substrate (biotinylated CAP5.5) (Panethymitaki et al., Biochem 2006;396:277–285). By integrating the data from both the TbNMT enzymatic assay and the TbNMT proliferation assay in which resazurin was used as an indicator for metabolic activity, a tight correlation was obtained between IC50 and EC50 for compounds spanning over 10,000-fold potency range (see
second figure
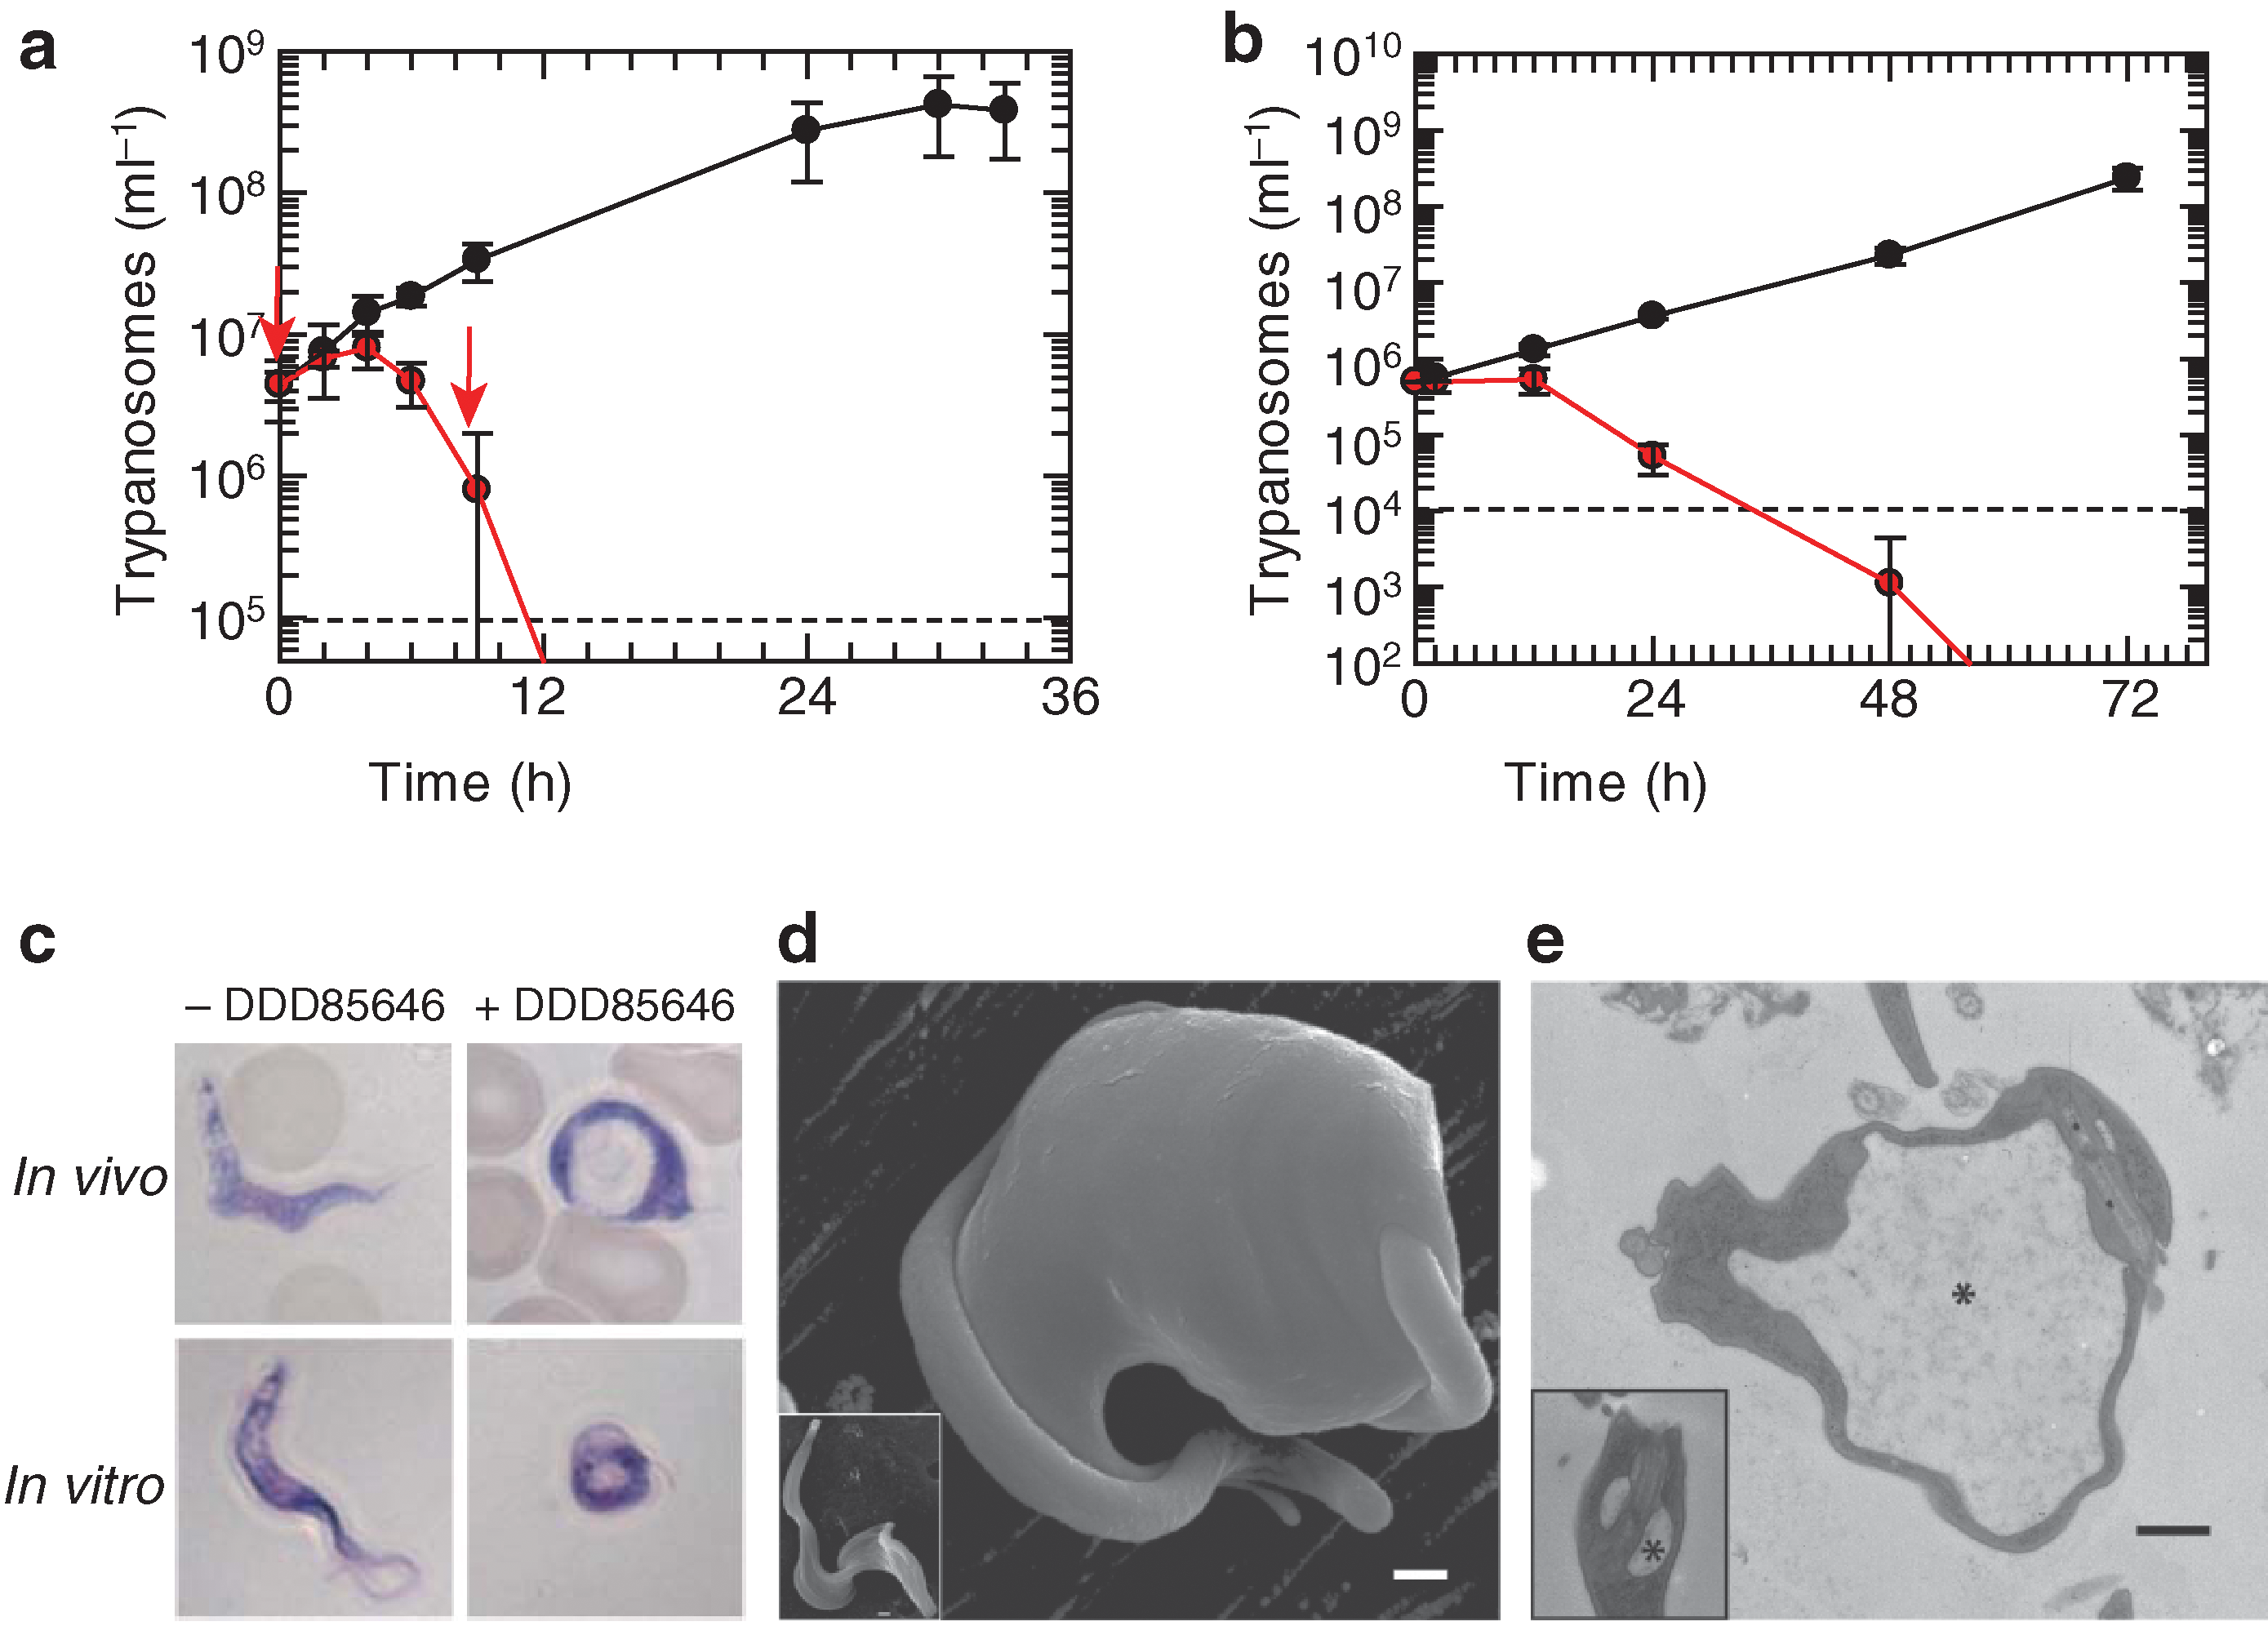
, panel b). The accurate assessment of some of the most potent compounds may have been affected by the limit of the enzyme concentration utilized in the assay (5 nM). A larger selectivity window was observed at the cellular level than in the in vitro assay, which may be explained by the more complex cell biology of the parasite. In addition to exhibiting promising bioavailability and efficacy, the lead molecule DDD85646 also affected rapid killing of trypanosomes both in vivo and in vitro, and the “BigEye” phenotype was captured upon additional microscopic examinations (see
third figure
). Crucially, metabolic labeling and surface plasmon resonance (SPR)analysis were also performed to provide evidence that the inhibitor acts “on target” and binds to the peptide substrate pocket of the enzyme. HAT is 1 of the 4 target diseases currently supported by the Drugs for neglected diseases initiative. The 2 featured articles represent some of the most recent progress in target-based HAT therapeutics development. Although additional optimization and studies are needed for the lead compounds to meet requirements as anti-HAT agents, the present studies represent a major new step toward the control of this ancient African scourge. Contributed by Wendy Lea.
Validation of the HTS by Library of Pharmacologically Active Compounds (LOPAC) screening. Plot of percent inhibition for duplicate screen of the 1,280 LOPAC compounds. LOPAC compounds (blue), minimum control, which should equal, ∼100% inhibition of signal readout (red), IC50 control compounds (yellow), and maximum control compounds, which should equal, ∼0% inhibition of signal readout (green), are indicated.
Identification of N-myristoyltransferase (NMT) lead series inhibitors. (a) Chemical evolution of DDD85646 from the initial high-throughput screening hit DDD64588. Combining the structure–activity relationships from the 2 strategies led to the development of the potent compound DDD85646. Potencies were determined for all compounds synthesized against recombinant Trypanosoma brucei (Tb)NMT and human isozyme NMT (HsNMT), as well as against bloodstream form T. brucei and MRC5 proliferation in vitro. ND, not determined. (b) Correlation between the inhibition of recombinant TbNMT and bloodstream form T. brucei proliferation for 175 members of the pyrazole sulphonamide series. Data shown are replicates of between 2 and 22 independent potency determinations using 10-point curves. Robustness of TbNMT and trypanosome proliferation assays are exemplified through routinely reported parameters of Z′ (0.703 ± 0.050, n = 169 and 0.695 ± 0.095, n > 1,000 for TbNMT and trypanosome assays, respectively) and reproducible potencies of standards (DDD73498 [TbNMT assay] pIC50 = 6.52 ± 0.14, n = 276 and pentamidine [trypanosome assay] pEC50 = 8.37 ± 0.41, n = 497), where p is the negative logarithm of the IC50 and EC values. r2 is the square of the linear regression correlation coefficient.
TbNMT inhibitors have rapid trypanocidal effects in vitro and in vivo. (a) Parasitaemia in mice (n = 53 per group) with (red) or without (black) DDD85646 treatment (50 mg/kg, oral, twice a day). Arrows represent dose administration times. Data are mean ± s.d. (b) T. b. brucei proliferation in culture determined by counting motile parasites in the presence (red) or absence (black) of 50 nM DDD85646. Data are mean ± s.d. for 3 determinations. (c) Blood smears of infected mice and culture samples were stained by Giemsa and observed by light microscopy. Treated cells showed typical BigEye phenotype. (d) Scanning electron micrograph of T. brucei treated with 10 nM DDD85646 for 24 h. Inset shows an untreated control cell. (e) Transmission electron micrograph of sagittal section of flagellar pocket of T. brucei treated with 5 nM DDD85646 for 72 h. Inset shows a section of flagellar pocket of an untreated control cell. Asterisks mark flagellar pockets. Dashed lines, cell detection limits. Scale bars = 500 nm.
Table 1 from Sharlow et al., PLoS Negl Trop Dis 2010;4(4):e659.
As of 09/03/09. Number of bioassays in which the compound was tested/number in which the compound was active/number in which the compound has been confirmed as an inhibitor.