Jackrel ME, Cortajarena AL, Liu TY, Regan L: Screening libraries to identify proteins with desired binding activities using a split-GFP reassembly assay. ACS Chem Biol 2010;5:553–562.
Abstract: Designer protein modules, which bind specifically to a desired target, have numerous potential applications. One approach to creating such proteins is to construct and screen libraries. Here we present a detailed description of using a split-GFP reassembly assay to screen libraries and identify proteins with novel binding properties. Attractive features of the split-GFP based screen are the absence of false positives and the simplicity, robustness, and ease of automation of the screen. Here, we describe both the construction of a naïve protein library, and screening of the library using the split-GFP assay to identify proteins that bind specifically to chosen peptide sequences.
Commentary:This article describes the use of a bifurcated GFP reporter system to probe protein-protein interactions (PPIs) in cells. The authors constructed a PPI library based on the tetratricopeptide repeat (TPR) domains present in the C-terminal tails of Hsp70 and Hsp90. These TPR domains are small (34 amino acid) sequences that naturally act as a “cradle” by forming elongated superhelical structures which binds peptide sequences in their extended conformation (see
figure
). Codon-swapping was used to randomize seven positions in the TPR domain in a manner where all 19 codons were mixed to provide an equal representation amino acids (Cys was omitted) at each of the seven positions. The split GFP approach involved linking the TPR domain library to one half of the GFP and a target sequence to other half. One target sequence used in this study was DSS1, a 70 amino acid protein that binds to the tumor suppressor protein BRCA2. The library was expressed in E. coli and screened for TPR sequences that promoted interaction with DSS1 by detecting reassembly of the GFP with FACS. The use of E. coli required optimization of the FACS sorting protocol which showed that a sorting rate of 20K events/sec was sufficient to achieve a population 100% enriched in GFP + clones. Selectivity was testing by swapping TPR constructs from the anti-DSS1 screen with those selected from an anti-Myc screen. No increase in GFP fluorescence was observed in the swapped libraries suggesting that the TPR domain interactions were specific for the target proteins. Sequencing of 56 unique clones from the anti-DSS1 screened showed a clear consensus sequence for the TPR domain suggesting recognition of single epitope in the DSS1 protein. In contrast, an anit-Myc screen did not yield any consensus sequence suggesting recognition of multiple epitopes. The binding of the selected TPR domains was confirmed by circular dichroism and surface-plasmon resonance analysis. Many TPR variants were found to bind to their target proteins in the high μM range, but some improvement in affinity could be achieved by error-prone PCR (improving binding in one case from 108 to 20 μM). The ability to detect weak binding interactions suggest a low false negatives rate. Engineering protein binding modules could provide assay reagents, acting as alternatives to antibodies, to measure intracellular protein-protein interactions. Contributed by Doug Auld.
TPR scaffold and library design. The TPR2A structure (PDB ID 1ELR (7)) is shown with the residues randomized in this work (K229, N233, Y236, N264, K301, K305, and N308) depicted as green sticks. The Hsp90 peptide is shown as a blue ribbon.
Dose-Response Drops
Sowa MB, Chrisler WB, Zens KD, Ashjian EJ, Opresko LK: Three-dimensional culture conditions lead to decreased radiation induced cytotoxicity in human mammary epithelial cells. Mut Res 2010;687:78–83.
Abstract: We used a droplet-based microfluidic system to perform a quantitative cell-based reporter gene assay for a nuclear receptor ligand. Single Bombyx mori cells are compartmentalized in nanoliter droplets which function as microreactors with a >1000-fold smaller volume than a microtiter-plate well, together with eight or ten discrete concentrations of 20-hydroxyecdysone, generated by on-chip dilution over 3 decades and encoded by a fluorescent label. The simultaneous measurement of the expression of green fluorescent protein by the reporter gene and of the fluorescent label allows construction of the dose-response profile of the hormone at the single cell level. Screening ∼7500 cells per concentration provides statistically relevant data that allow precise measurement of the EC50 (70 nM ± 12%, α = 0.05), in agreement with standard methods as well as with literature data.
Commentary:Philipus Aureolus Paracelsus (1493–1541), often referred to as the father of toxicology, recognized that a substance poisonous qualities depends on the dose. Dose-response relationships were later quantified in the Hill equation (1910) and today it is widely appreciated that compounds show complex concentration-response relationships in biological systems. Despite this fact, the majority of high-throughput screens used to define the starting point of drug discovery efforts employ only a single concentration leading to both false positives and negatives. This article describes a method to enable titration based screening of cell-based assays using microfluidics (see
figure
). A reporter gene assay resulting in the expression of GFP is used and the cells are coencapsulated with agonist which is presented at ten discrete concentrations. The fluorescence of the cell droplets is measured for all concentrations of ligand simultaneously in microfluidic chips using laser-induced fluorescence. The GFP signal reports on the agonist activity while the concentration of agonist in the droplet can be determined using a fluorescent dye encapsulated in the drop which encodes the concentration. Reproducible EC50 values were obtained which were in agreement with values obtained in standard microtiter plates. The current protocol performs best when suspension cells are used to express the reporter, although modification of the protocol to include microcarrier beads could enable use of adherent cells. The droplet assay requires only 7,500 cells per concentration point. With an injection rate of 60 Hz, EC50 values can be generated in 30 minutes. The throughput could be improved by increasing the injection rate to 2 kHz which would allow a concentration-response curve (CRC) to be collected in approximately 6 sec. By comparison, titration-based screening in 1536-well plates against a chemical library as large as 350K compounds is routinely applied to both biochemical and cell-based assays at the NIH Chemical Genomics Center (see Michael S, et al. ADDT 2008;6:637-658). In this system a seven point CRC can be generated at rate of approximately 1 CRC/sec. Improvement of the microfluidic throughput could enable reporter assays without cell culture burden inherent to larger volume microtiter plates assays. Contributed by Doug Auld.
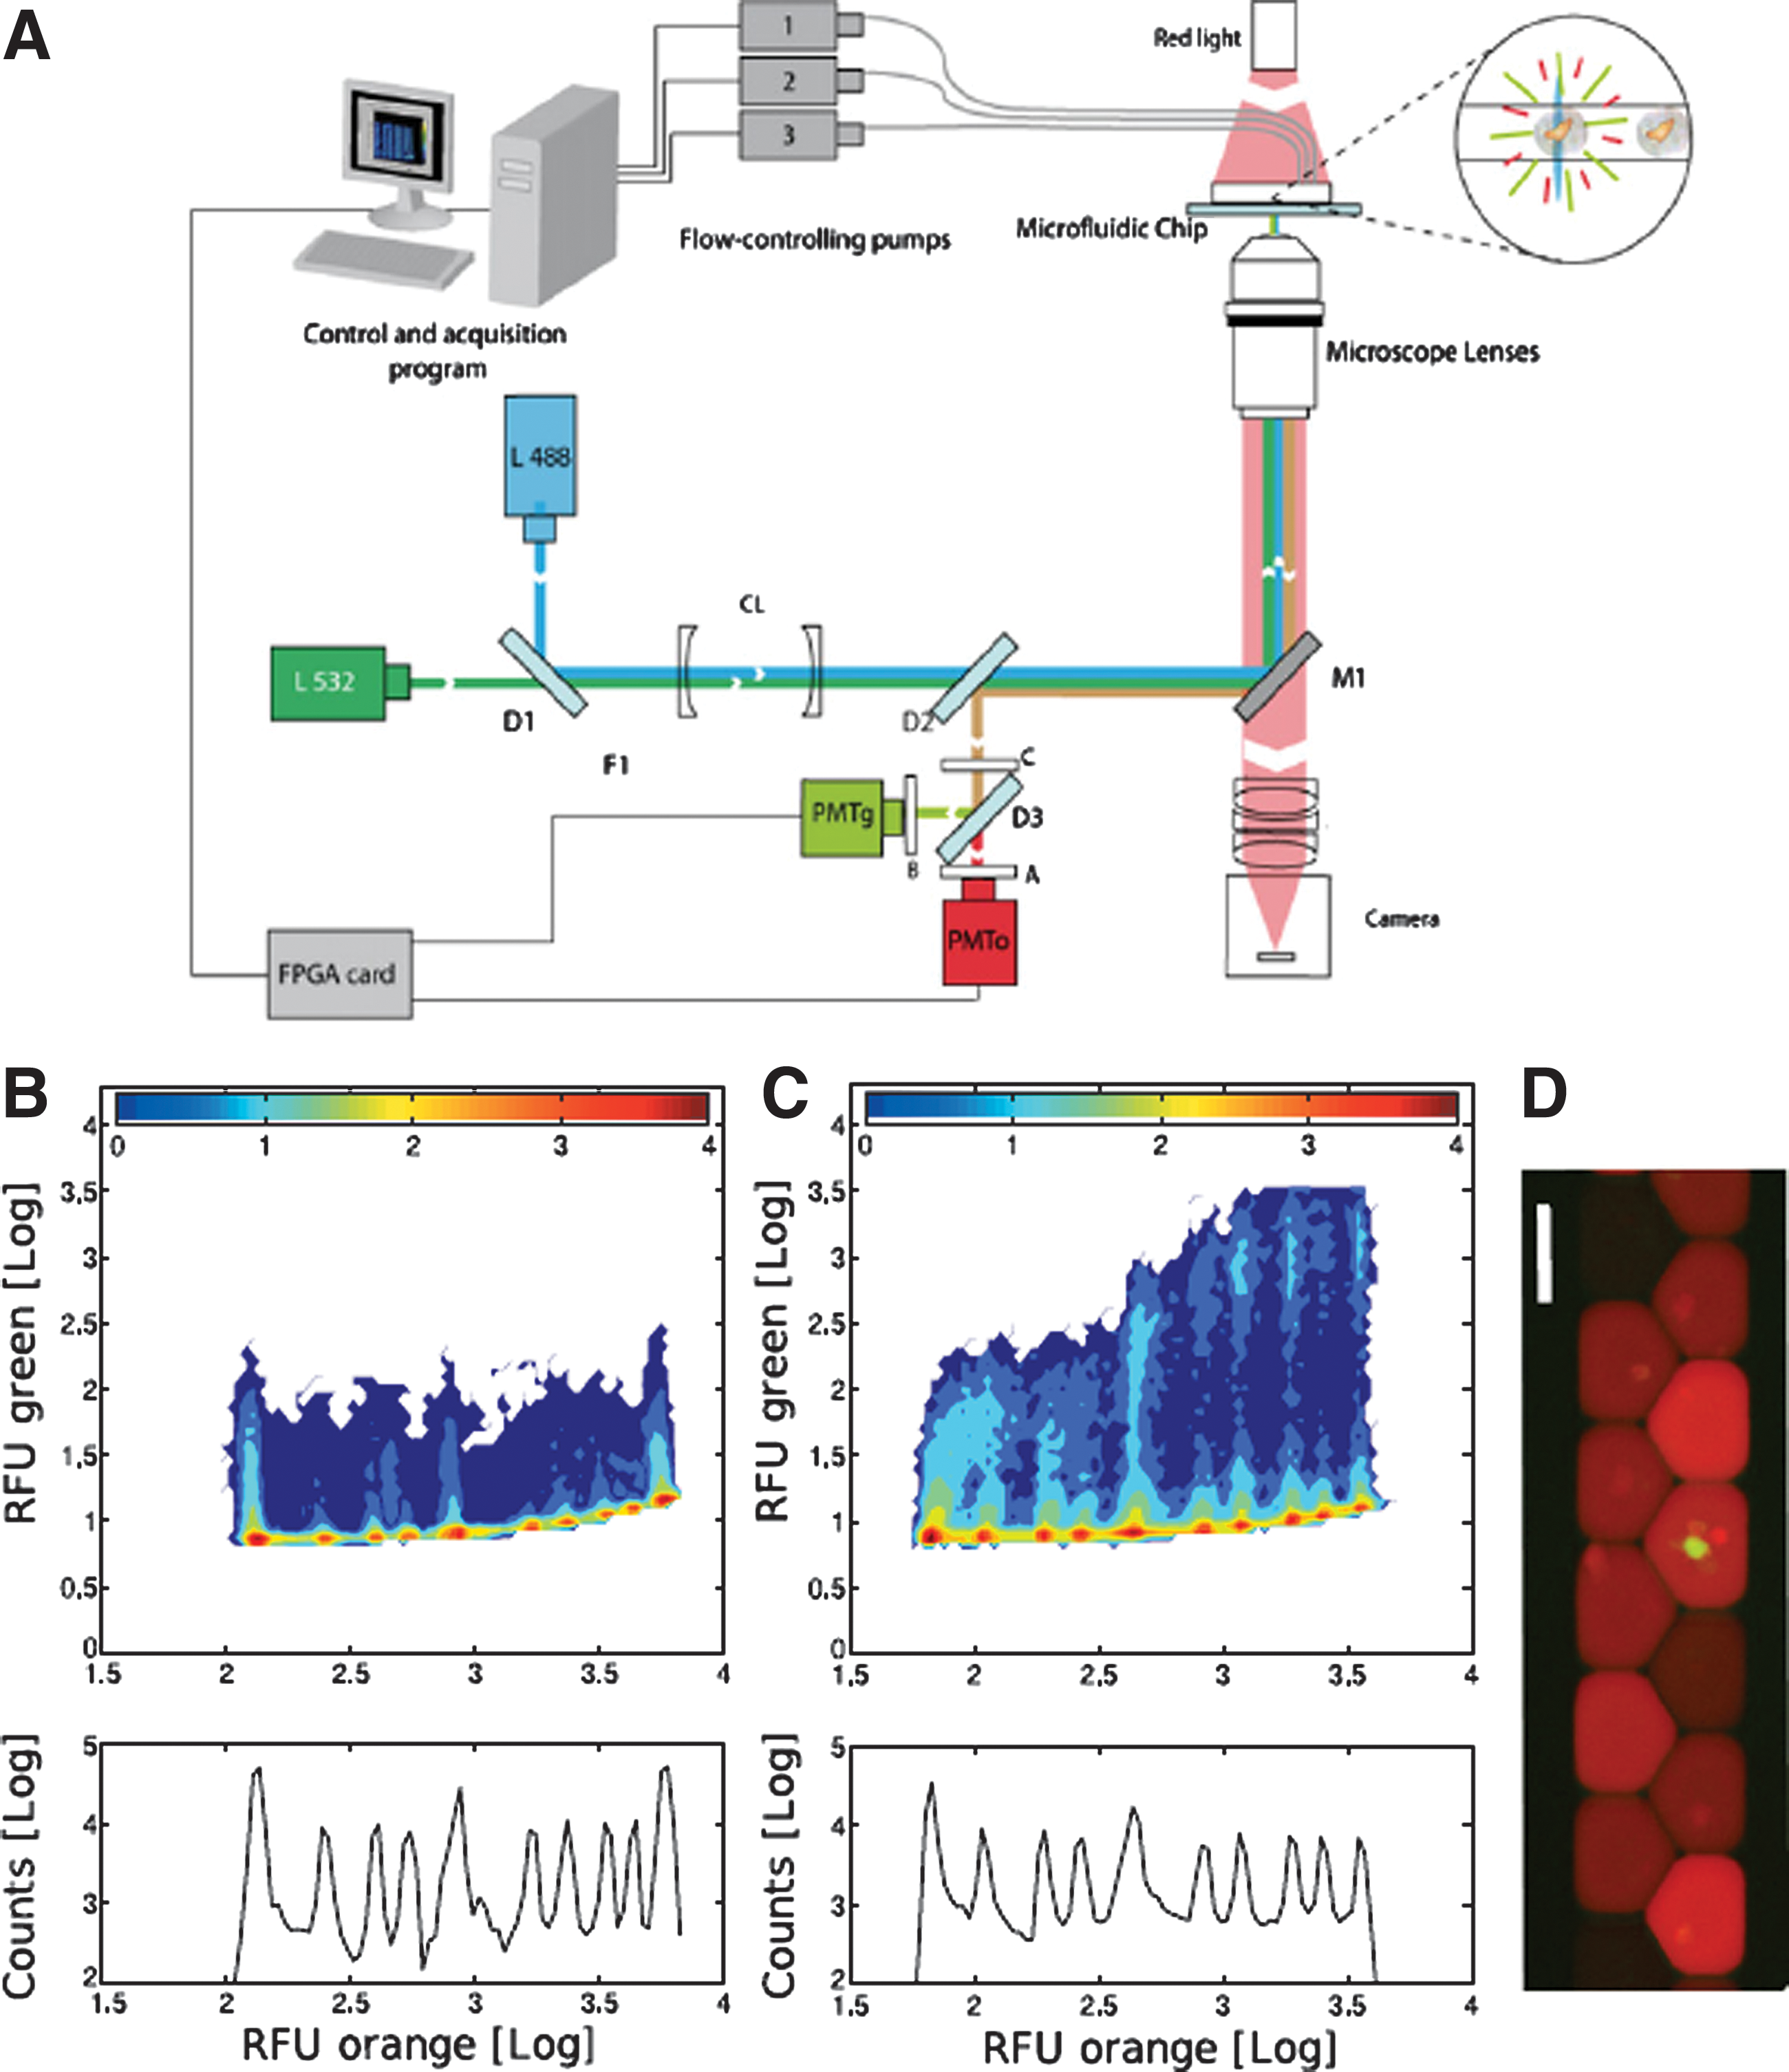
Fluorescence measurement and data analysis. (A) A sketch of the fluorescence setup used for the detection of cell GFP fluorescence in droplets labeled by the fluorescent dye dextran Texas red (DTR). The setup is based on fluorophore excitation by two lasers (blue L488 and green L532) focused in the microfluidic channels. Emission is measured simultaneously on two photomultiplier tubes (PMT) in the green and orange windows of the light spectrum (see Experimental Procedures of the article for details of the optical components). (B) Two-dimensional histogram of droplet/cell fluorescence measured at droplet production. On the x-axis, the histogram reveals the ten levels of concentration of DTR encoding the ten levels of 20E (see Table S1 and Figure S1 of the article). The y-axis represents GFP fluorescence. (C) Two-dimensional histogram of droplet/cell fluorescence after incubation; a second green fluorescent population is visible for the highest concentration of DTR and 20E representing the concentration-dependent response of the cells. The counts (bottom panels) are the logarithm of the number of cells detected at different levels of orange fluorescence (RFU). (D) Epifluorescence microscopy of droplets upon reinjection showing the green fluorescence (GFP) of the cell in the droplet and various orange intensities of the droplet corresponding to different concentrations of DTR and 20E. DTR concentrations span an ∼100-fold concentration range; the dark droplets correspond to low concentrations of DTR and the brighter droplets to higher concentrations of DTR. The scale bar represents 100 μm.
Probes on Wheels
Workman P, Collins I: Probing the probes: Fitness factors for small molecule tools. Chem Biol 2010;17:561–577.
Abstract: Chemical probes for interrogating biological processes are of considerable current interest. Cell permeable small molecule tools have a major role in facilitating the functional annotation of the human genome, understanding both physiological and pathological processes, and validating new molecular targets. To be valuable, chemical tools must satisfy necessary criteria and recent publications have suggested objective guidelines for what makes a useful chemical probe. Although recognizing that such guidelines may be valuable, we caution against overly restrictive rules that may stifle innovation in favor of a “fit-for-purpose” approach. Reviewing the literature and providing examples from the cancer field, we recommend a series of “fitness factors” to be considered when assessing chemical probes. We hope this will encourage innovative chemical biology research while minimizing the generation of poor quality and misleading biological data, thus increasing understanding of the particular biological area, to the benefit of basic research and drug discovery.
Commentary:The application of small molecules to probe biological questions has become a common practice in academic research. This has been largely enabled by the funding and availability of chemical biology laboratories possessing industrial scale resources to produce chemical probes. As with the early days of the Human Genome Project, questions are currently being asked pertaining to the quality of the data and tools produced by these efforts. This article by Workman and Collins suggest a series of guidelines to help evaluate the “fitness” of chemical probes based on four important areas—chemical properties, biological potency, biological selectivity, and context of use (see
figure
). While the authors incorporate certain properties commonly found in drugs, the authors are also careful to state that rules for probes can be considerably more flexible as their intended use can vary widely. However, certain “drug-like” properties are generally useful such as solubility and cell penetration, both of which are required to make probes useful in cell-based assays. Evidence-based guidelines place the potency of fit chemical probes in the range of <100 nM and the probe should have related analogs that establish structure-activity relationships. At least one of these structurally related compounds should be an inactive analog which can be extremely useful for determining the selectivity of the chemical series and aid in the interpretation of phenotypic assay results. Completing the probe wheel is “context” which includes the availability of the chemical probe. Proper validation of chemical probes requires that the probe is provided to the research community in an unrestricted open access manner to broadly test their fitness in a range of biological assays. It is important to emphasize that the quality of assay data around the chemical probe must be highly reproducible and also be available in an unrestricted manner. In this way, high quality chemical probes will populate the literature and yield new biological insights, while poor chemical probes should go quickly extinct. The review gives several examples which illustrate the evolution of compounds from probes to leads to drugs. For example, the natural product staurosporine is accompanied by hundreds of literature citations and has been a useful tool in the validation of biochemical protein kinase assays as well as studying cell-based signal transduction pathways. While staurosporine has many liabilities along the probe wheel, the authors emphasize that it is important to consider the intended purpose of the probe before passing judgment on its usefulness. Studying the promiscuous effects of staurosporine has lead to uncovering the role of several kinases in, for example, cell cycle regulation. The class of receptor tyrosine kinase inhibitors known as tyrphostins were some of the first compounds to probe the ATP pocket of protein kinases, demonstrating that it is possible to obtain selectivity through binding to the ATP site. This has inspired a large number of highly potent ATP-competitive inhibitors. Further Darwinian examples of probe evolution are illustrated for PI3K inhibitors. The early PI3K probes such the natural product Wortmannin or synthetic leads such as LY294002, which score low in either potency and/or selectivity categories, were still useful in understanding the role of PI3K in pathogenesis. Currently, a highly potent Class I PI3K inhibitor, GDC-0941, is in clinical trails for treatment of cancer. Indeed, all drugs are probes but not all probes can be drugs, and it is important to keep the desired purpose in mind when determining the fitness of chemical probes. Contributed by Doug Auld.
Fitness factors for chemical probes grouped into four distinct areas. Chemical properties, biological potency, biological selectivity, and context of use (A), that encompass suggested criteria for evaluating the suitability of chemical probe compounds for exploratory biology (see Bael JB and Holloway GA: J Med Chem 2010;53:2719–2740; Cohen P: Biochem J 2009;425:53–54; Edwards AM, et al.: Nat Chem Biol 2009;5:436–440; Frye SV: Nat Chem Biol 2010;6:159–161; Inglese J, et al.: Nat Chem Biol 2007;3:466–479; Kodadek T: Nat Chem Biol 2010;6:162–165; McGovern SL, et al.: J Med Chem 2003;46:4265–4272; Oprea TI, et al.: J Comput Aided Mol Des 2007;21:113–119; Rishton GM: Drug Discov Today 2003;8:86–96). Threshold values that have been suggested in the literature are tabulated for each of the criteria (B), and a comparison of these properties for drugs, leads, and probes can be found in Table 1 of the article. We suggest that although not all probes can, or need to, reach these thresholds in every case, consideration of the criteria will allow a robust assessment of whether the probe is fit-for-purpose, and foster an appreciation of the risk carried forward if significant criteria are not met.
Evolving Aptamer Patterns
Ruff KM, Snyder TM, Liu DR: Enhanced functional potential of nucleic acid aptamer libraries patterned to increase secondary structure. JACS 2010;132:9453–9464.
Abstract: The in vitro selection of nucleic acid libraries has driven the discovery of RNA and DNA receptors (aptamers) and catalysts with tailor-made functional properties. Functional nucleic acids emerging from selections have been observed to possess an unusually high degree of secondary structure. In this study, we experimentally examined the relationship between the degree of secondary structure in a nucleic acid library and its ability to yield aptamers that bind protein targets. We designed a patterned nucleic acid library (denoted R*Y*) to enhance the formation of stem-loop structures without imposing any specific sequence or secondary structural requirement. This patterned library was predicted computationally to contain a significantly higher average folding energy compared to a standard, unpatterned N60 library of the same length. We performed three different iterated selections for protein binding using patterned and unpatterned libraries competing in the same solution. In all three cases, the patterned R*Y* library was enriched relative to the unpatterned library over the course of the 9- to 10-round selection. Characterization of individual aptamer clones emerging from the three selections revealed that the highest affinity aptamer assayed arose from the patterned library for two protein targets, while in the third case, the highest affinity aptamers from the patterned and random libraries exhibited comparable affinity. We identified the binding motif requirements for the most active aptamers generated against two of the targets. The two binding motifs are 3.4- and 27-fold more likely to occur in the R*Y* library than in the N60 library. Collectively, our findings suggest that researchers performing selections for nucleic acid aptamers and catalysts should consider patterned libraries rather than commonly used Nm libraries to increase both the likelihood of isolating functional molecules and the potential activities of the resulting molecules.
Commentary:Aptamers are artificial single-stranded nucleic acids (ssDNA or ssRNA) that are engineered to bind to various molecular targets with high specificity and high affinity due to their well-defined 3-D structures. SELEX (systemic evolution of ligands by exponential enrichment) is the in vitro selection procedure to generate aptamers, and recent advancement in automated aptamer acquisition makes aptamers suitable for high-throughput screens. In addition to their specific inhibitory effect against various target classes, aptamers are advantageous as they can be easily produced and synthetically modified, and exhibit no intrinsic toxicity or immunogenicity. Aptamer technology is thus considered an efficient and cost effective approach and complementary to genetic methods in target validation (Blank et al.: Curr Opin Chem Biol 2005;9:336-342). Besides being research tools for protein function study, aptamers have also exhibited therapeutic effects and can advance to become drugs themselves. Pegaptanib/Macugen was approved by the FDA in late 2004, and a further eight aptamers are currently undergoing clinical evaluations. These are prominent examples of aptamer-based therapeutics for the treatment of cancer, ocular and haematological diseases (Keefe et al.: Nat Rev Drug Discov 2010;9:537-550). Herein, an article by Ruff et al. is highlighted as their design of a patterned nucleic acid aptamer library (containing alternating purines and pyrimidines with the aim of promoting higher degree of secondary structure formation without the imposition of specific sequence requirements) represents a promising development in the field of aptamer-based molecular library evolution. In three in vitro competitive selections for binding to streptavidin, IgE, and VEGF, this patterned aptamer library was shown to possess enhanced secondary structure and contain higher fraction of sequences with activity or binding potency. The authors first created a pure patterned library RY based on an unpatterned N60 library by alternating purines (R) and pyrimidines (Y) and inserting intervening stretches of an equimolar mixture of nucleotides between RY regions. The RY library was further modified to formulate a patterned library R*Y* by the incorporation of at least a small percentage of every base at every position (for example, R* denotes a nucleotide mixture in the ratio of 45:5:45:5 A/C/G/T instead of an equimolar mixture of only A and G for R). This series of strategies were aimed to balance the enhancement in secondary structure formation with sufficient sequence flexibility to support common secondary structural motifs in aptamers. First, through DNA sequencing and restriction digestion, the authors found that the patterned R*Y* library was enriched relative to the unpatterned N60 library over the course of selection in all three binding experiments (see table). Second, through a filter-binding assay, the patterned library was identified to yield both a higher fraction of final actives and actives with better or comparable potency. The predicted insufficiency in sequence flexibility in the RY library corresponded well with the few or lack of surviving clones found towards the end of IgE and VEGF selection. Lastly, the authors determined the consensus binding motif for streptavidin and IgE using site-directed mutagenesis (see
figure
for streptavidin binding) and found that the patterned library had a higher likelihood of producing such motifs than the unpatterned counterpart. The increased occurrence of binding motifs in the patterned library was attributed to the high probability of stem and loop formation in that library. Taken together, these three lines of evidence indicate the importance and benefits of incorporating enhanced secondary structures in aptamer libraries. Researchers are encouraged to exploit patterned nucleic acid libraries and other hybridization methods to accelerate the discovery and development of aptamer-based therapeutics. Contributed by Wendy Lea.
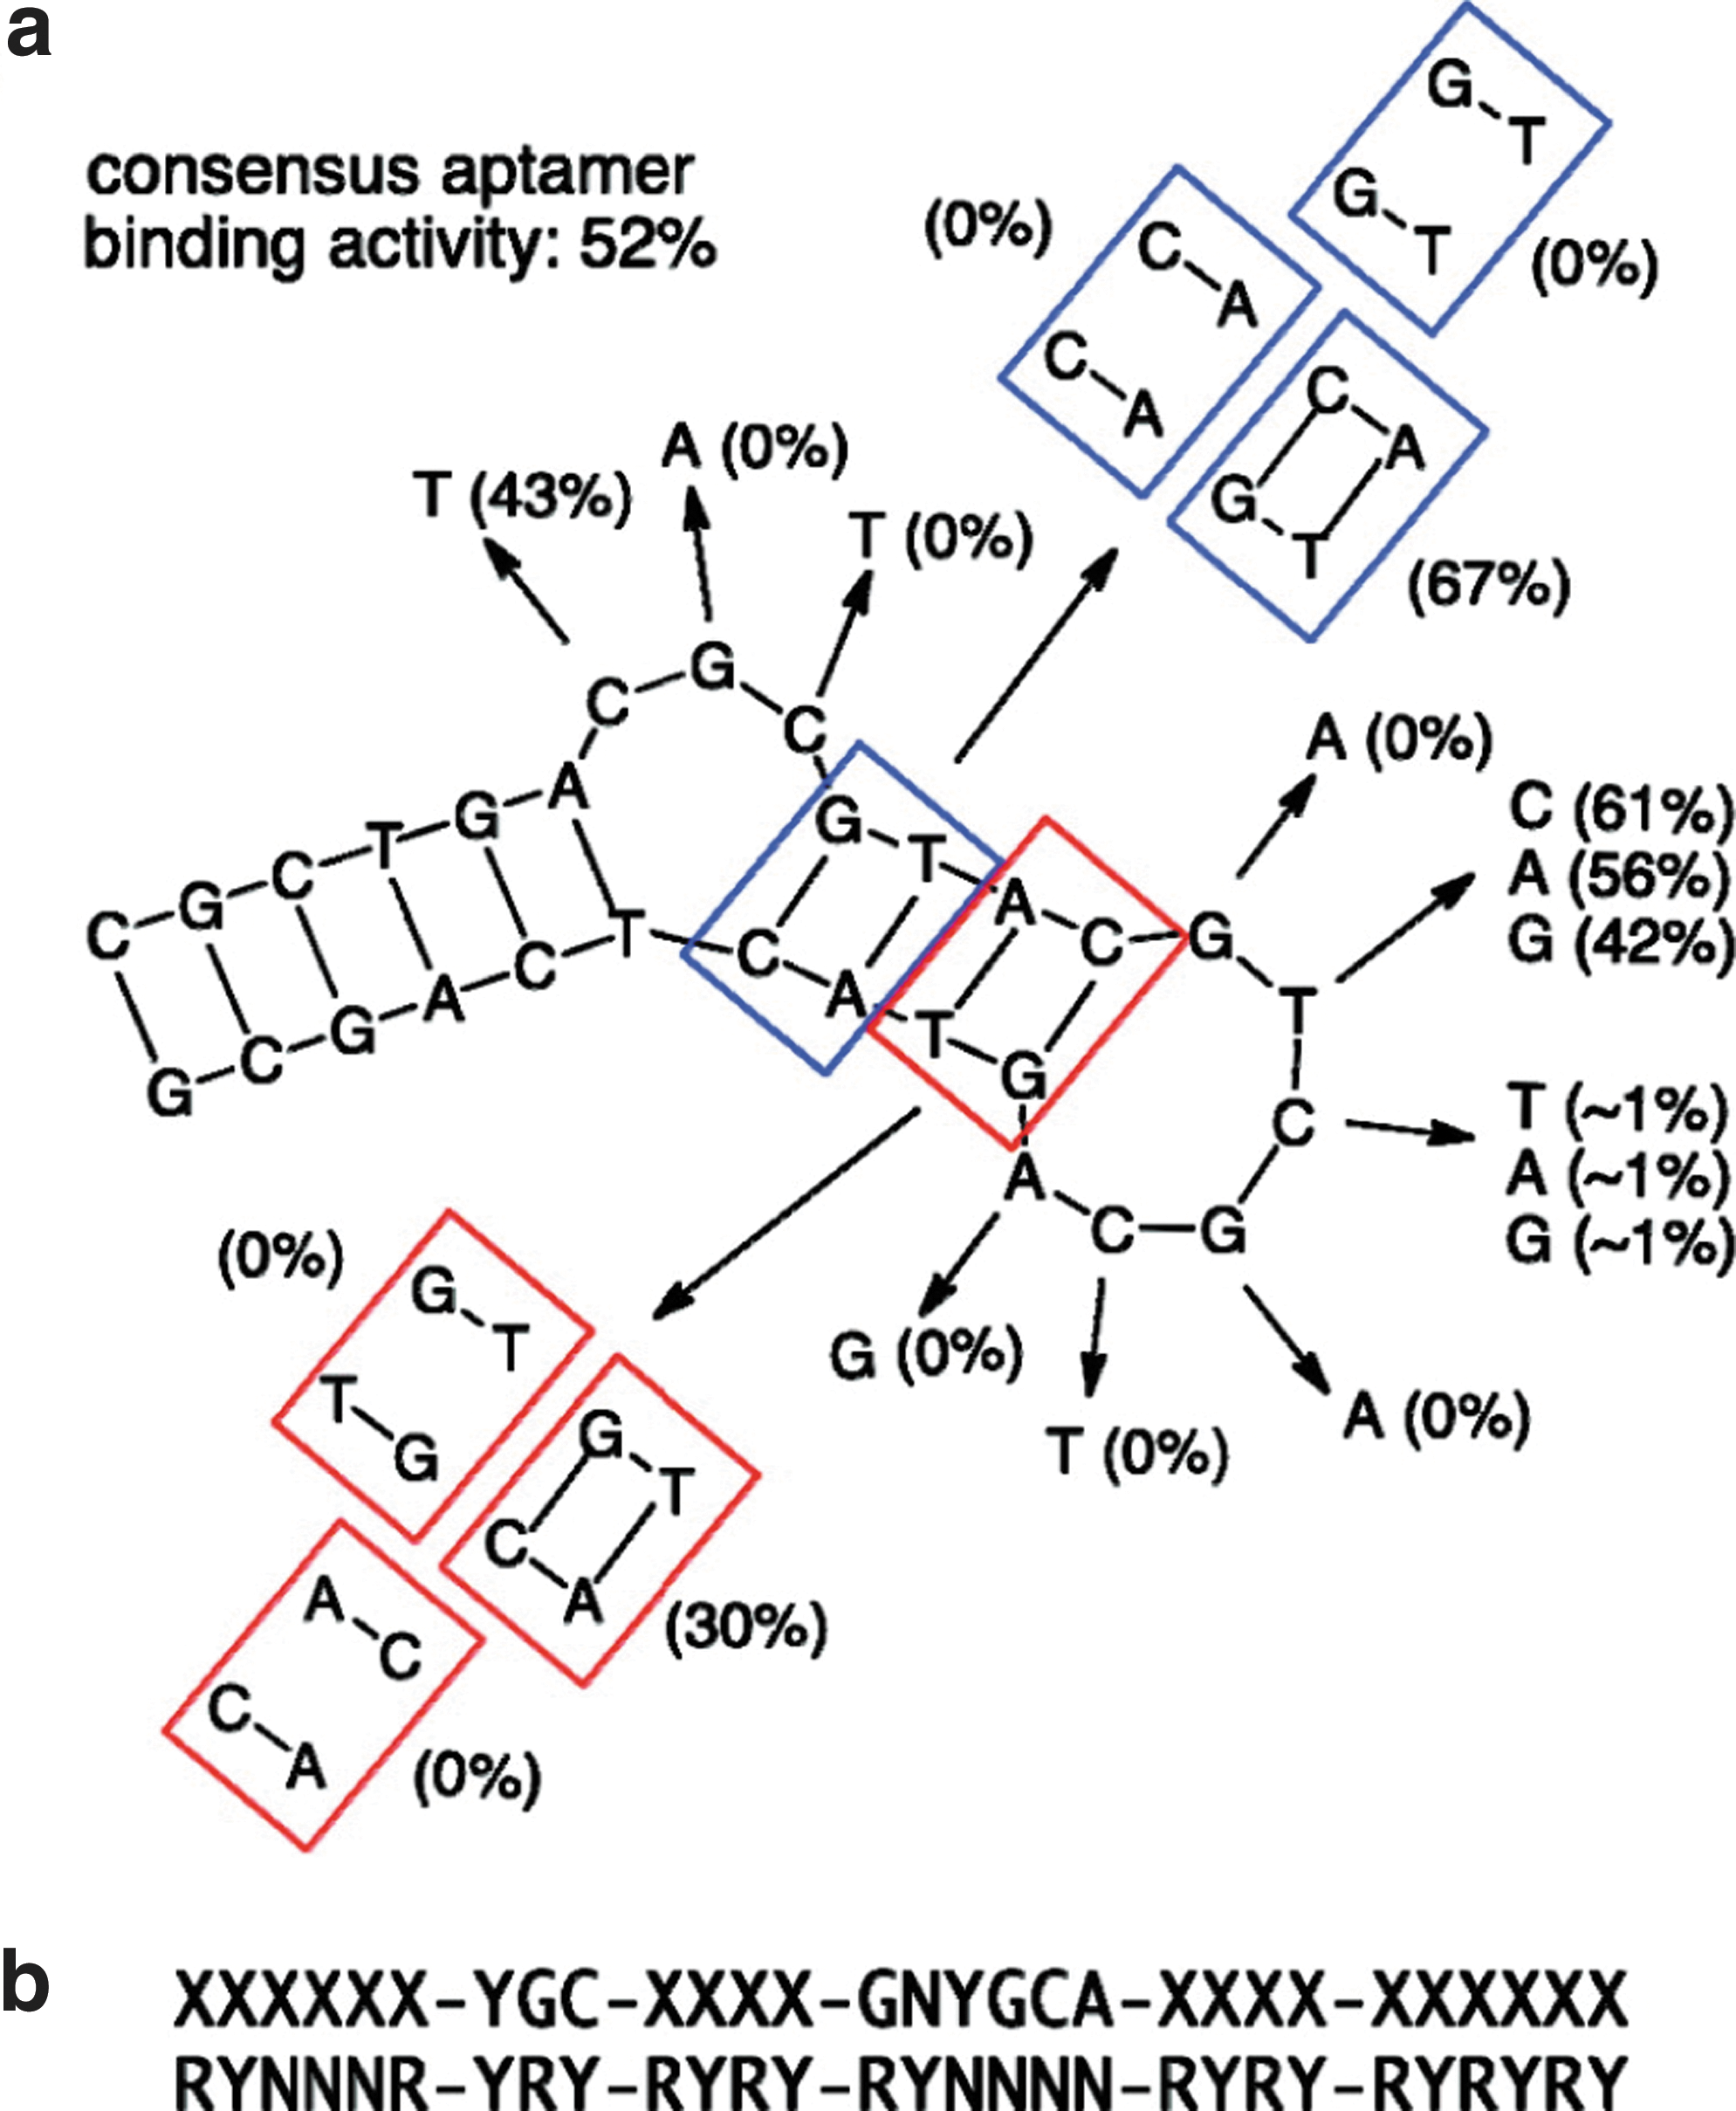
Streptavidin binding motif analysis. (a) The binding activities of point mutants (listed in parentheses) reveal a consensus set of binding motifs. (b) The most likely frame for this consensus sequence in the R*Y* library is shown.
The round 10 pool for the streptavidin selection contained a significant fraction (∼25%) of DNA not cleaved by treatment with restriction endonucleases.
: Because of a mutation in the R*Y*-specific tag sequence among a significant fraction of the pools surviving round 9 and round 10, restriction enzyme digestion could not be used to assess the final N60:R*Y* ratio for the VEGF selection.
Hold Fascin and Stay Put
Chen L, Yang S, Jakoncic J, Zhang JJ, Huang X-Y: Migrastatin analogues target fascin to block tumour metastasis. Nature 2010;464:1062–1066.
Abstract: Tumor metastasis is the primary cause of death of cancer patients. Development of new therapeutics preventing tumor metastasis is urgently needed. Migrastatin is a natural product secreted by Streptomyces, and synthesized migrastatin analogs such as macroketone are potent inhibitors of metastatic tumor cell migration, invasion and metastasis. Here we show that these migrastatin analogs target the actin bundling protein fascin to inhibit its activity. X-ray crystal structural studies reveal that migrastatin analogs bind to one of the actin-binding sites on fascin. Our data demonstrate that actin cytoskeletal proteins such as fascin can be explored as new molecular targets for cancer treatment, in a similar manner to the microtubule protein tubulin.
Commentary: Forward chemical genetics experiments continue to yield impressive results by relating cellular or tissue phenotypes back to cellular targets. Often, this is facilitated by the screening of natural products for activity in cell-based screens which is how Migrastatin was discovered as an agent that impaired the migration of several tumor cells in vitro. Given the devastating effect that cancer metastasis has on disease outcome, the mechanism by which this naturally occurring agent obstructs cancer cell migration was of great interest. In this letter by Huang and coworkers, a biotin-conjugated version of the core macroketone sub-structure (which is known to retain the key phenotypical effect) was utilized to isolate the cellular target via well-known affinity enrichment techniques and proteomics (see
figure
). The outcome was the isolation of the protein fascin, an actin bundling protein. Several experiments confirmed that macroketone inhibited fascin-induced bundling of F-actin polymers and the authors went on to show that this natural product bound to fascin by means of an X-ray structure. This structure gave the investigators insight into both the binding of fascin to macroketone but also to actin. Several mutants were examined which confirmed that macroketone bound at a site critical for acting binding. Interestingly, one mutation (at His 474) was found that affected binding to macroketone but not actin. This mutant was used to great effect to show that macroketone blocked cellular migration via its interaction with fascin and not some other cellular target. Fascin was further validated as an important target associated with cancer metastasis via a series of shRNA studies both in vitro and in vivo. In one key study, NOD-SCID mice were injected with GFP and luciferase expressing MDA-MB-231 cells with either control shRNA or fascin shRNA. The control shRNA expressing cells were shown to metastasize and proliferate while the fascin shRNA cells failed to colonize effectively. Finally, the authors performed an in-depth analysis of protein levels and microarray data from patient samples to confirm that overexpression of fascin is associated with an aggressive cancer phenotype. The work by Huang and coworkers is an example of the tremendous insight that can be garnered by researchers who engage forward chemical genetics and undoubtedly fascin is now being assessed within the pharmaceutical community as a new target of interest thanks to this well performed study. Contributed by Craig Thomas.
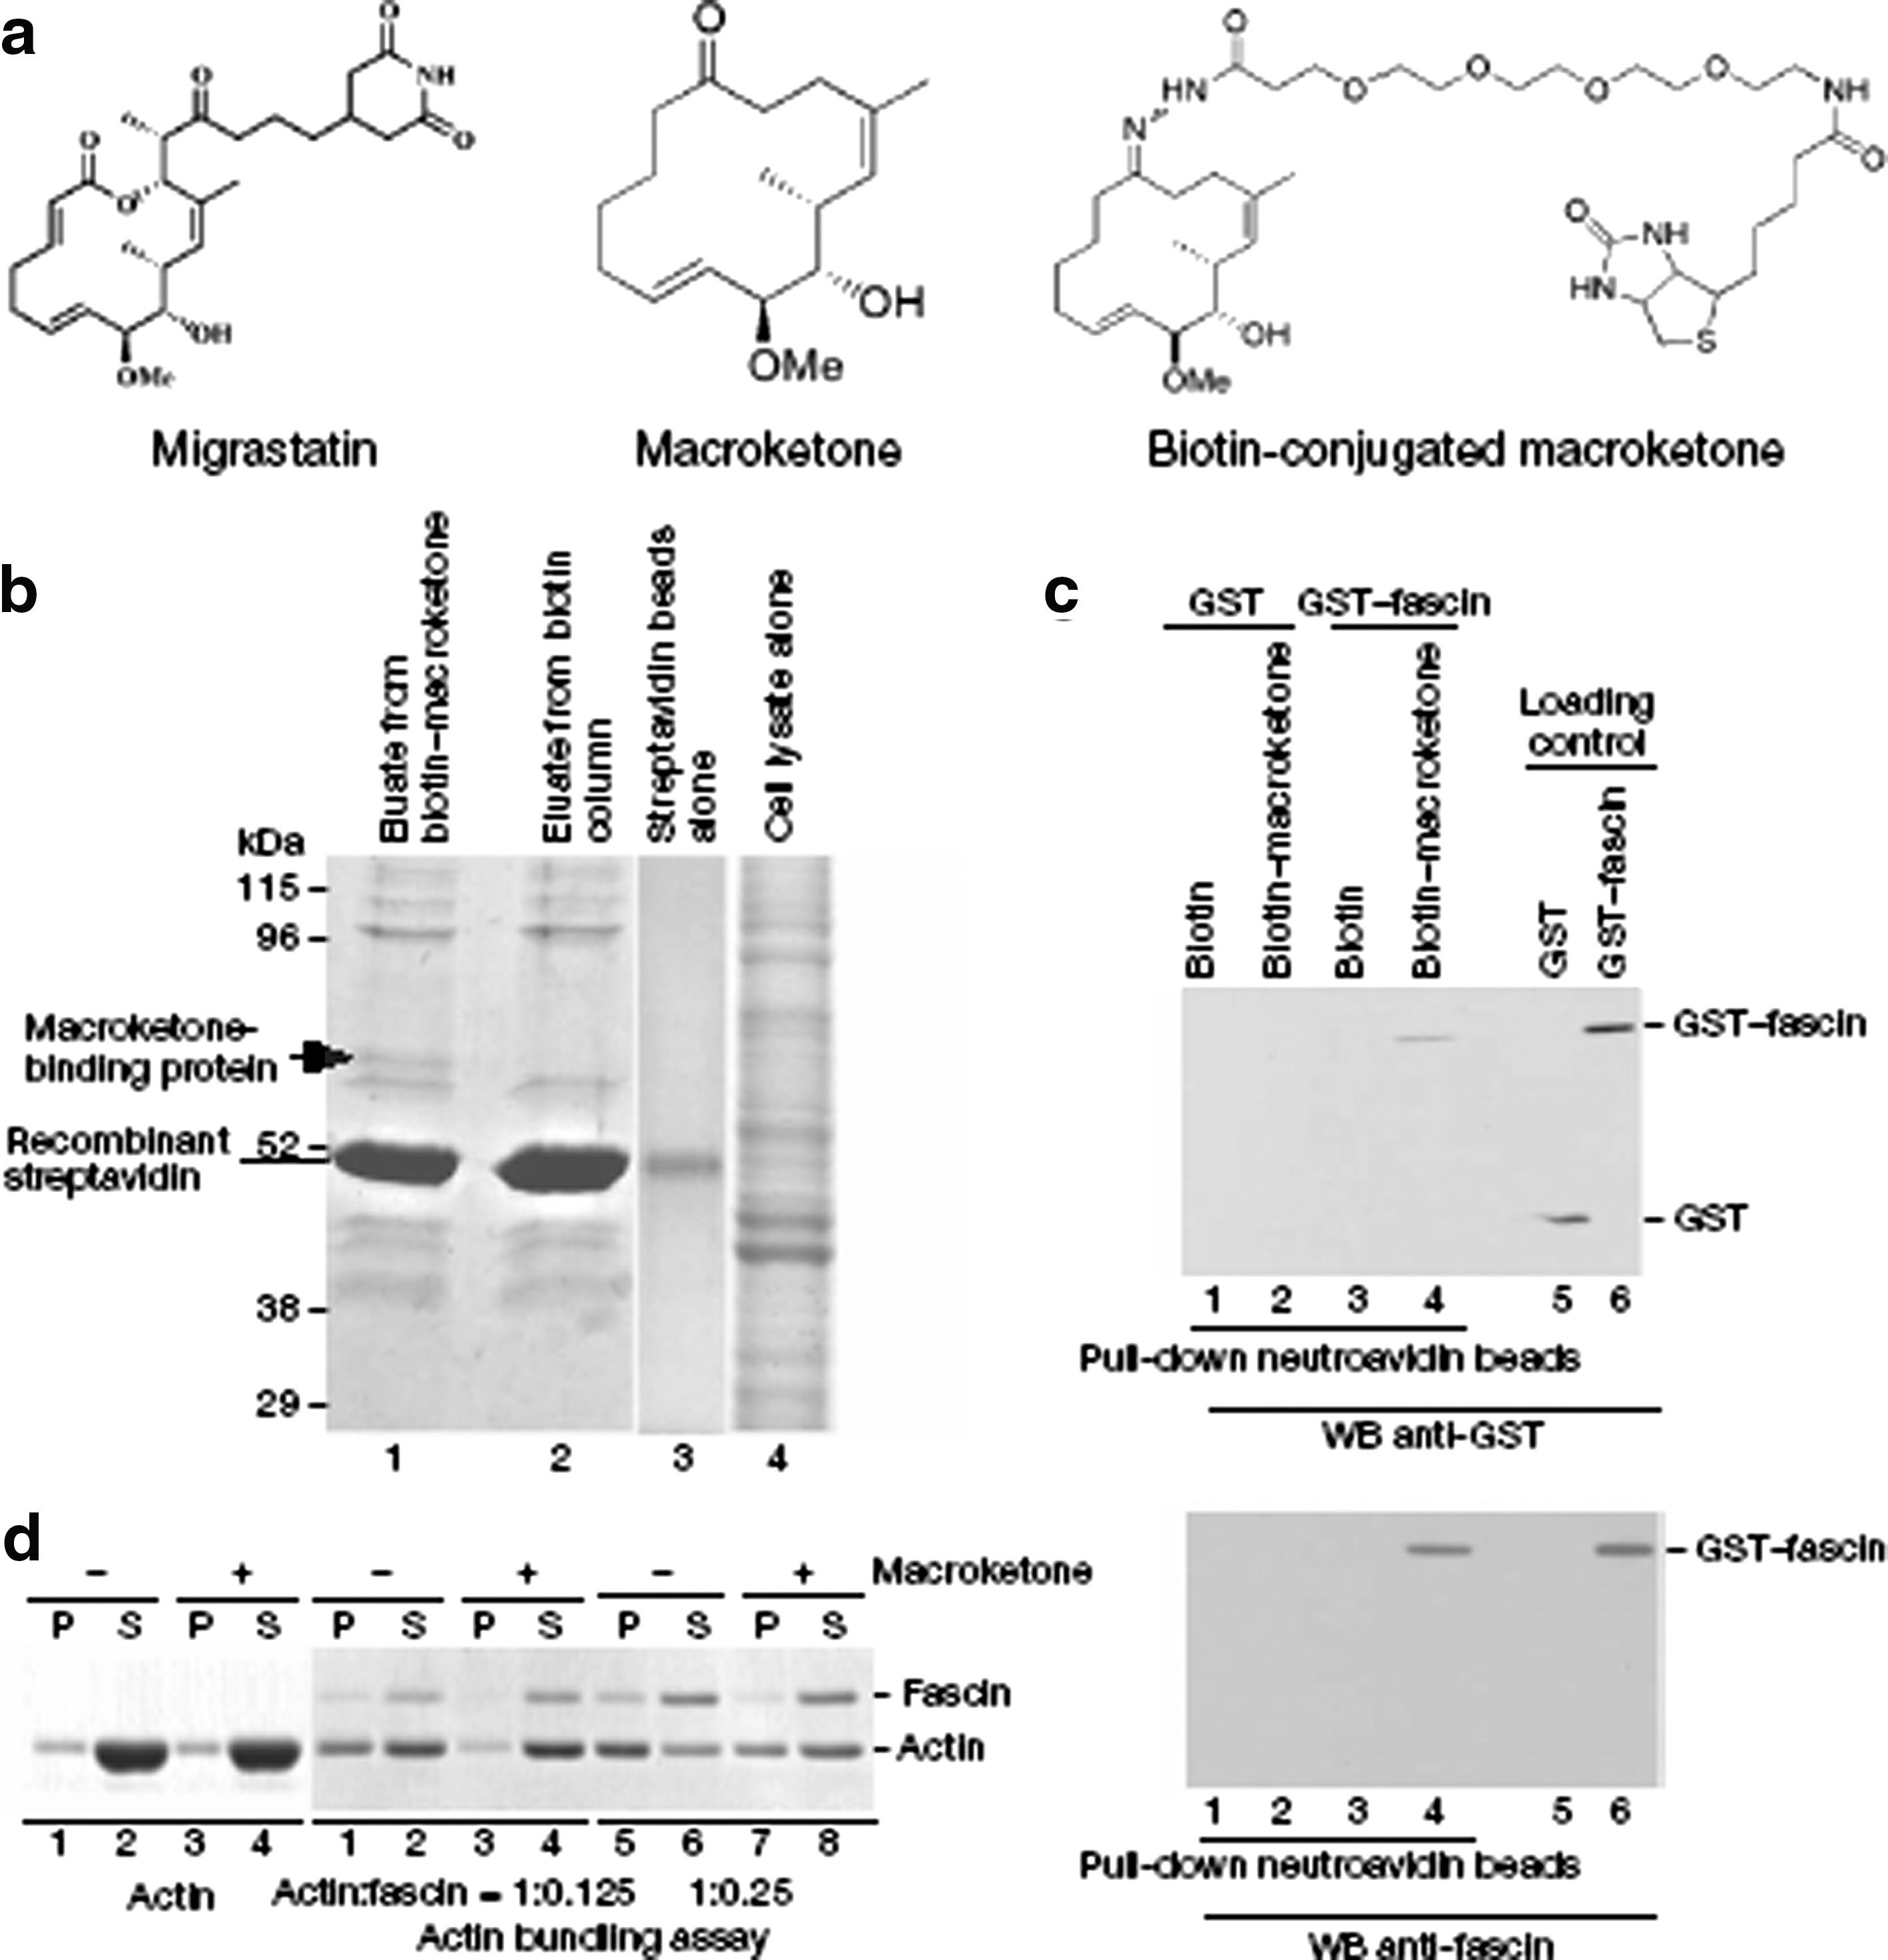
Identification of fascin as a macroketone target. (a) Diagram of the structures of migrastatin, one of its analogues (the macroketone core) and the biotin-conjugated macroketone core. (b) Coomassie blue stain of the SDS–PAGE gel after protein affinity purification. The arrow indicates the band identified as mouse fascin 1. (c) Direct interaction of fascin with macroketone. Neutroavidin-agarose beads with biotin-conjugated macroketone (10 mM) or biotin (10 mM) were mixed with GST–fascin or GST. WB, western blot. Data are representative of three experiments with similar results. (d) Assay of the actin bundling activity with a low-speed cosedimentation assay. Polymerized F-actin (1 mM) was incubated with 0.125 mM or 0.25 mM purified fascin in the presence or absence of macroketone (10 mM). Supernatants (S) or pellets (P) were analysed by SDS–PAGE followed by Coomassie blue staining. The result shown is representative of five experiments with similar outcomes.
Acidic Pet
Ogawa M, Kosaka N, Regino CAS, Mitsunaga M, Choyke PL, Kobayashi H: High sensitivity detection of cancer in vivo using a dual-controlled activation fluorescent imaging probe based on H-dimer formation and pH activation. Mol Biosyst 2010;6:888–893.
Abstract: The key to improving the sensitivity of in vivo molecular imaging is to increase the target-to-background signal ratio (TBR). Optical imaging has a distinct advantage over other molecular imaging methods in that the fluorescent signal can be activated at the target thus reducing background signal. Previously, we found that H-dimer formation quenches fluorescence of xanthene fluorophores, and among these, TAMRA had the highest quenching ratio. Another approach to lowering background signal is to employ pH activation based on the photon-induced electron transfer (PeT) theory. We hypothesized that combining these two strategies could lead to greater quenching capacity than was possible with either probe alone. A pH-sensitive fluorophore, pHrodo or TAMRA was conjugated to the cancer targeting molecules, avidin (Av) and trastuzumab (Tra). As expected, both pHrodo and TAMRA formed H-dimers when conjugated to avidin or antibody and the dimerization resulted in efficient fluorescence quenching. In addition, pHrodo conjugated probes showed pH-dependent fluorescence activation. When the probes were used in an in vivo animal model, fluorescence endoscopy with Av-pHrodo depicted tumors with high TBR 1 h and 2 h after injection. Av-TAMRA also visualized tumors 1 h and 2 h after the injection, however, TBR was lower due to the background signal from non-specific binding 1 h after the injection as well as background fluorescence from the unbound agent. Thus, we demonstrate that a dual-controlled activatable optical probe based on the combination of H-dimer formation and pH activation can achieve high TBR at early time points during in vivo molecular imaging.
Commentary:Ogawa and colleagues combine two distinct methods in fluorescence optical imaging to design a cancer detection system characterized with low background emission in combination with excellent signal increase when the imaging probe is bound to its target. The authors build on their earlier studies of rhodamine-based fluorophores (specifically, the carboxytetramethylrodamine TAMRA) where they have shown that when TAMRA is attached to a cancer-detecting protein (antibody or another type) it tends to self-dimerize forming self-quenched H-dimers. In turn, these low-fluorescence dimers dissociate when the labeled probe molecule is internalized and reaches its target, and this step is accompanied by a fluorescence intensity increase; however, some background fluorescence is still detectable with these self-quenched probes. The authors also capitalize on the recent development of a range of photon-induced electron transfer probes (PeT, see for example Urano et al., Nature Medicine 2009;15:104-109) which remain dark/quenched when in neutral pH conditions but become highly fluorescent when in low-pH environment. Here, the authors combine these two techniques to derive a synergistic probe, named pHrodo (see
first figure
), possessing a very low fluorescence background which “lights up” when bound to its cancer marker in the low-pH environment of the lysosome. To compare the performance of pHrodo with a previously used fluorophore, the authors carried TAMRA through all the experiments in parallel with pHrodo. The two dyes were coupled onto two proteins, avidin and trastuzumab, which target D-galactose receptor and the HER2 antigen, respectively. Initial biophysical characterization of avidin-TAMRA and trastuzumab-pHrodo (Figure 2 of the article) confirmed that both probes existed as self-quenched H-dimers but that only trastuzumab-pHrodo wasalso further activated at low pH. Experiments in 3T3 HER2-positive cells demonstrated that both probes were internalized after binding their targets (adding excess unlabeled trastuzumab inhibited the uptake of the pHrodo-labeled counterpart). Lastly, fluorescence endoscopy imaging was performed using the two conjugates (Figure 4 of the article and
second figure
here): while fluorescence background was detectable with the avidin-TAMRA probes, the trastuzumab-pHrodo probe remained dark in healthy tissues and only elicited signal with the tumor tissue, allowing a clear target detection at 1-2 hours post-injection. The results presented here represent an initial proof of concept; additional work, particularly experiments with different tumor-detection proteins, needs to be done before the utility of pHrodo is fully established. Contributed by Anton Simeonov.
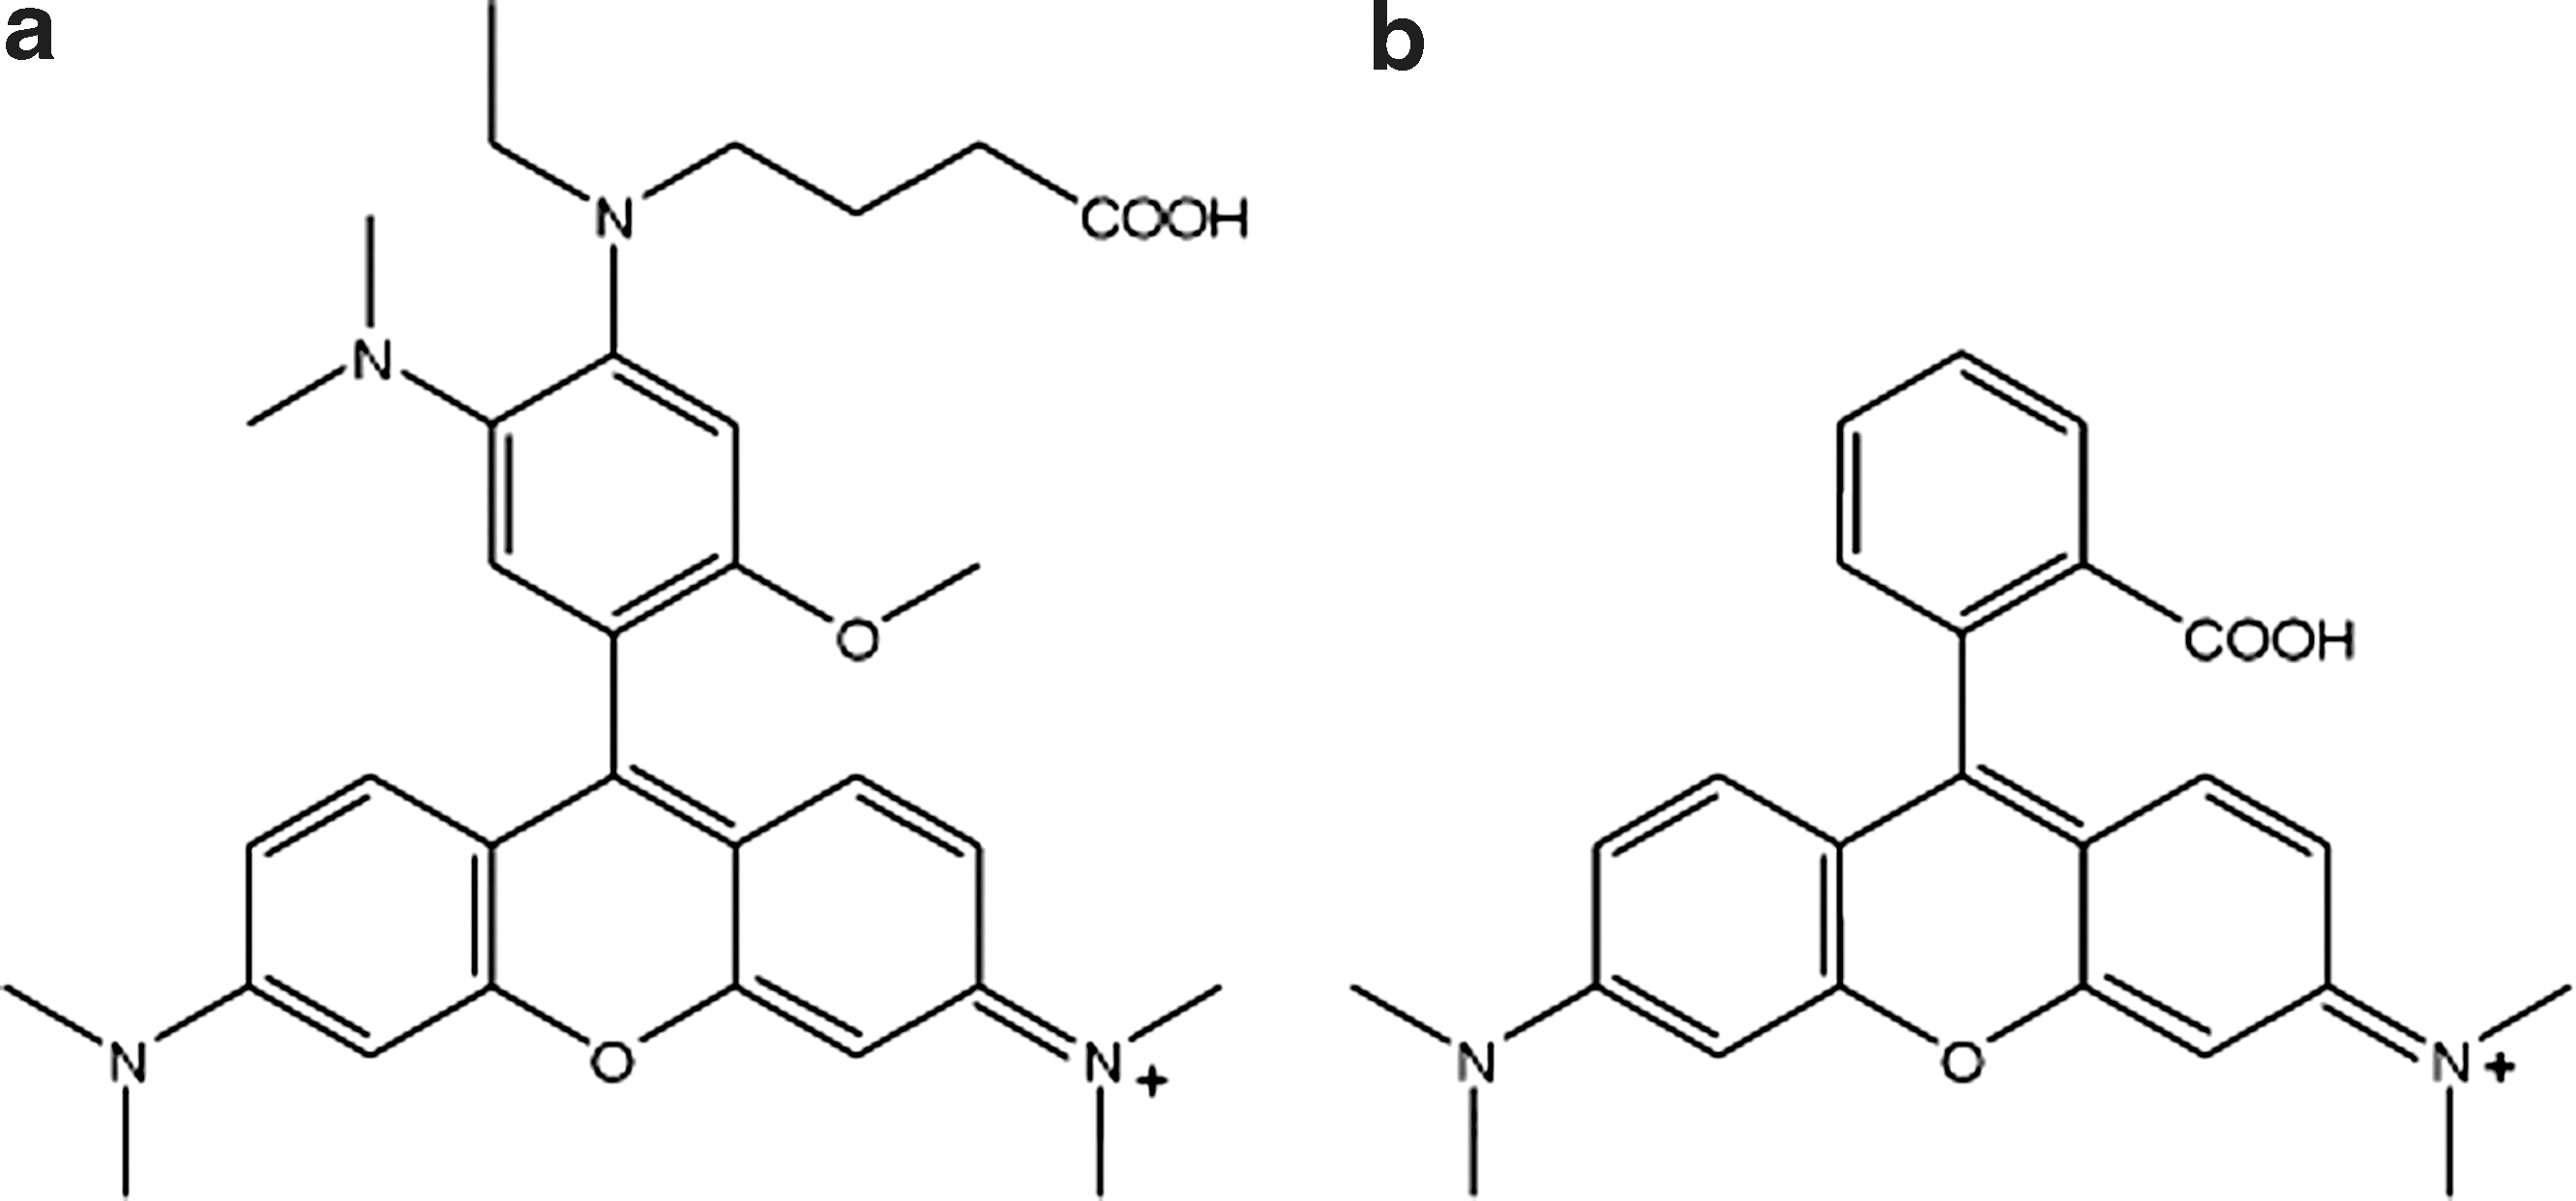
The proposed structure of pHrodo (a) and the structure of TAMRA (b).
Fluorescence spectral images of the peritoneal cavity for Av-pHrodo (a) and Av-TAMRA (b). The results were consistent with endoscopic images. Tumors were detected with a low background signal for Av-pHrodo, but the injectate fluorescence was detected with Av-TAMRA at 1 h after the injection.
RT-Kinase Assay
Sun H, Mitchell K, Lee L: Real-time fluorogenic kinase assay using protein as substrate. Anal Biochem 2010;10.1016/j.ab.2010.06.046
Abstract: A real-time fluorogenic kinase assay using myelin basic protein (MBP) as a substrate is reported. MBP is part of a non-covalent complex with a negatively charged, dye-labeled lipopeptide ((N-heptadecanoyl)-K(dye2)-linker-EEIYGEF–amide). The complex is about 20x less fluorescent than the free lipopeptide. The MBP/lipopeptide complex serves as a protein substrate for several Ser/Thr kinases. We infer that the observed fluorescence increase upon addition of kinase and ATP is due to the phosphorylation of MBP, which decreases the affinity of MBP with the negatively charged, dye-labeled lipopeptide. Several protein kinases (PKC βII, MAPK Erk1, and Erk2) were tested with the assay. The assay exhibited a five-fold fluorescence increase over background, provided kinetic values comparable to literature values (apparent Km ATP), and produced inhibitor constants comparable to literature values for a typical inhibitor, staurosporine.
Commentary:A large variety of high-throughput assays exists for assaying protein kinases with either fluorescence or bioluminescent methods. However, the most of these assays are performed in an endpoint mode and often require the use of coupling enzymes to detect the ATP substrate or ADP product of the enzymatic reaction. This article describes the use of myelin basic protein (pI∼10), a well utilized protein substrate for Ser/Thr kinases, to provide a homogenous continuous assay for Ser/Thr kinases. A fluorescent dye-labeled negatively charged lipopeptide (net charge −5) was synthesized and shown to bind to the positively charged MBP protein with high affinity (KD = 10 nM). Further, the fluorescence of the peptide (λex = 485 nm; λem = 535 nm) is efficiently quenched when bound to MBP (95% reduction in fluorescence when bound). The assay was used to monitor kinase activity for several different kinases. Following incubation with kinase, a 4-5 fold increase in fluorescence is observed. Analysis by MALDI-TOF confirmed phosphorylation of MBP and it is hypothesized that the increase in fluorescence is due to release of the negatively charged lipoprotein from the phosphorylated MBP (see Assay Scheme). The assay was shown to accurately measure the apparent KM for ATP by determining the initial reaction velocities through following the fluorescent signal. As well, using PKC, the IC50 for staurosporine was determined to be 10 nM, which agrees with literature values. The assay method described in this article should be widely applicable to protein kinases capable of using MBP as a substrate. The method described here is one of the only protein kinase assay formats described to date that exploits the protein substrate, without the use of antibodies, and could be expanded to other protein kinases with proper design of additional lipopeptides. Contributed by Doug Auld.
Double Flash
Zurn A, Klenk C, Zabel U, Reiner S, Lohse MJ, Hoffmann C: Site-specific, orthogonal labeling of proteins in intact cells with two small biarsenical fluorophores. Bioconjugate Chem 2010;21:853–859.
Abstract: The fusion of fluorescent proteins to proteins of interest has greatly advanced fluorescence microscopy, but is often limited by their large size. Here, we report site-specific, orthogonal labeling of two cellular proteins in intact cells with two small fluorescent dyes: fluorescein arsenical hairpin binder, FlAsH, and its red analogue, ReAsH, which bind to tetracysteine motifs. Development of a sequential labeling method to two different motifs, CCPGCC and FLNCCPGCCMEP, allowed site-specific labeling with FlAsH and ReAsH, respectively. Using the cell surface receptor for para thyroid hormone and its cytosolic binding protein, β-arrestin2, we show their selective visualization in intact cells and analyze their interaction by colocalization and fluorescence resonance energy transfer (FRET). We propose that this method may be widely applied to label intracellular proteins and to study their interactions in intact cells with minimal disturbance of their function.
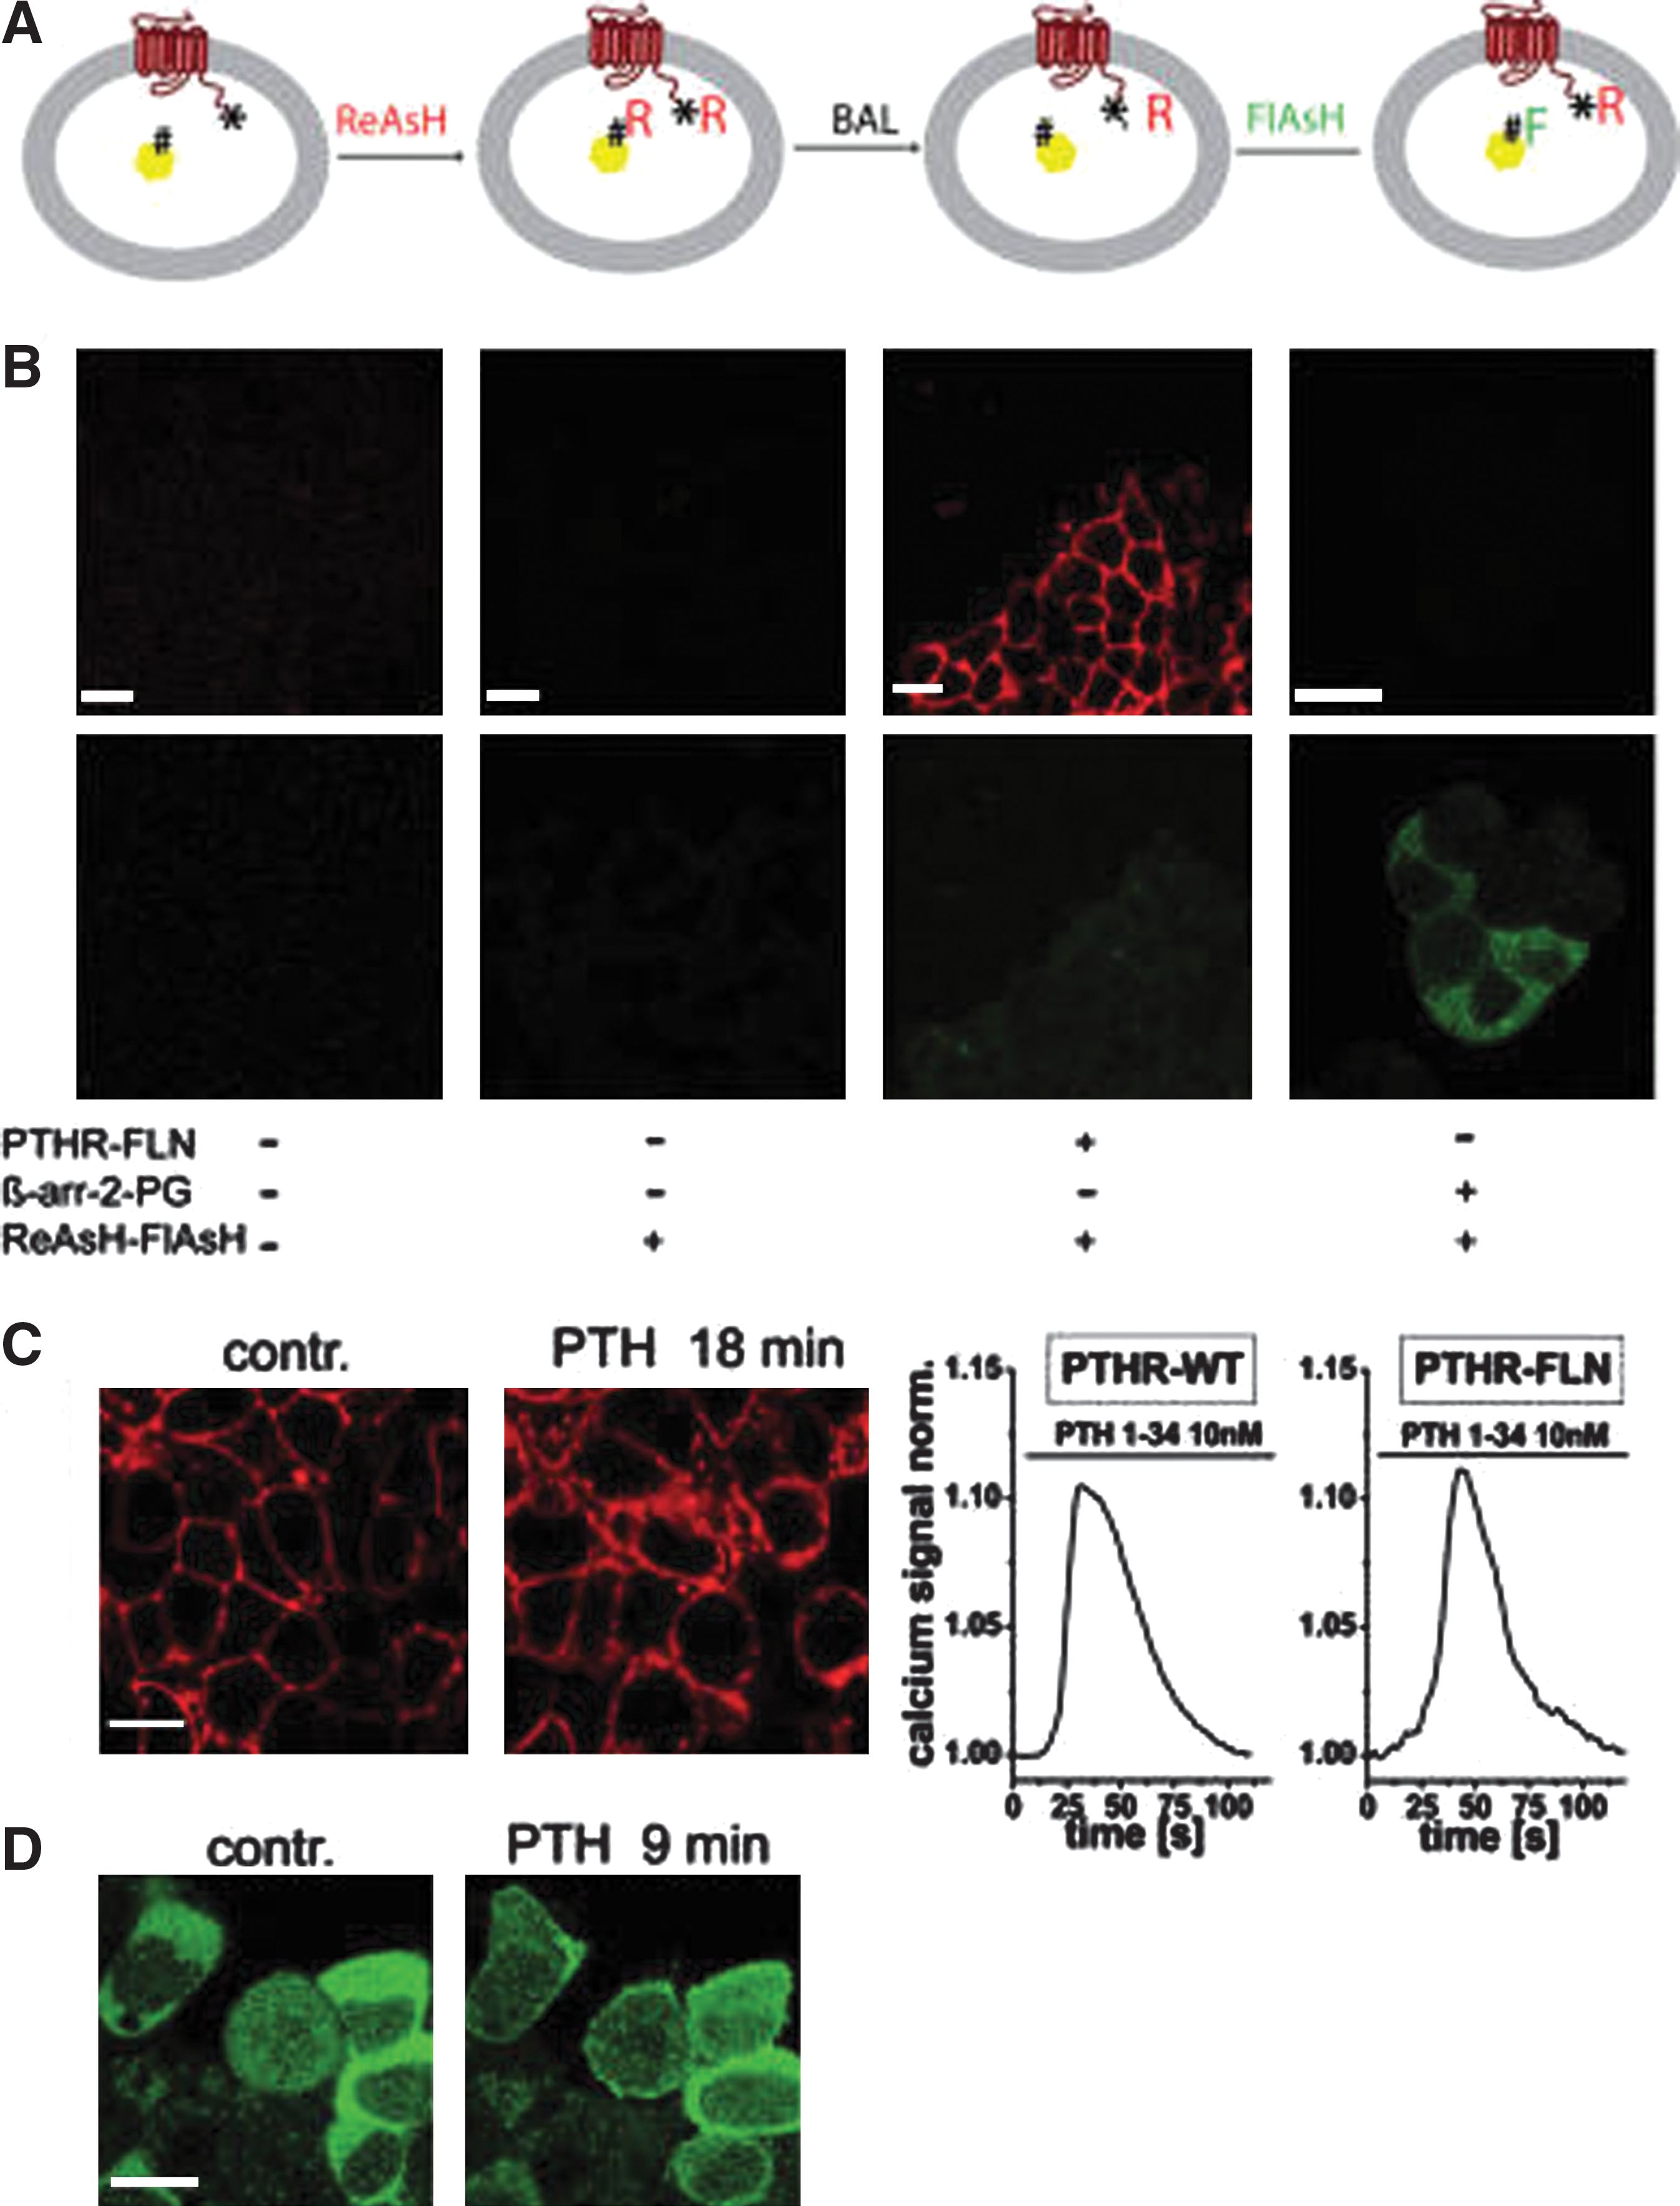
Commentary:First introduced by Tsien and colleagues in 1998 (Griffin, Adams, and Tsien (1998) Science 281, 269-272), the arsenical tetracysteine binders FlAsH and ReAsH have found numerous applications as site-specific covalent labeling molecules for proteins in vitro and in vivo. FlAsH delivers fluorescein, while ReAsH delivers resorufin, through covalent modification by an arsenic-based core of specific tetracysteine motifs which can be genetically encoded at the protein termini of choice. Two key advantages of this technique are the use of small fluorophores that do not perturb the folding of the protein of interest (unlike the green fluorescent protein tag where a sizable label, a protein itself, is added to the protein being followed) and the absence of any appreciable linker between the fluorophore and the protein which allows for more precise set-up of fluorescence resonance energy transfer (FRET) studies. The availability of two different-color tags allows in principle for a dual labeling of proteins in cells; however, the site- and color-specific labeling has been hampered by the similar affinities of FlAsH and ReAsH toward the initially established CCPGCC tetracysteine sequence (denoted “PG”). Here, the authors first evaluated three different tetracysteine sequences, the minimal CCPGCC motif and two extended sequences FLNCCPGCCMEP (FLN) and HRWCCPGCCKTF (HRW) (see
first figure
). In addition to reaction with the FlAsH and ReAsH ligands, the authors compared the degree of “stripping off” afforded by the addition of dimercaptopropanol (denoted “BAL” in the article), known to be capable of reversing the labeling with arsenicals. These studies determined that there was a distinct order of preference during labeling and reversal: the PG sequence was stripped most easily, that is, it retained the labeling ligands the weakest, whereas the FLN sequence was stripped only with high concentrations of dimercaptopropanol; similarly, FlAsH was harder to strip off than ReAsH. After performing additional concentration and reaction time optimization experiments the authors established a labeling protocol where the protein or cells are first treated with ReAsH to label both the PG and FLN sites (themselves placed on corresponding proteins of interest). Then, application of specific concentration of BAL results in removal of ReAsH from the weak PG sites, with ReAsH being retained at the high-affinity FLN site. Lastly, addition of FlAsH results in only tagging with fluorescein the stripped PG sites, leaving the resorufin labels on the FLN sites intact. This results in achieving fluorophore- and site-specific labeling of two different proteins within the same cell or sample. The authors demonstrated the new strategy by labeling of PTH receptor and β-arrestin 2 in intact cells (Figure 2 of the article): by applying the proper controls it was shown that the β-arrestin2-PG was indeed labeled with fluorescein and PTH receptor-FLN was only labeled with resorufin, as designed. The functional integrity of the two proteins post-labeling was also confirmed (see
second figure
). Additionally, a FRET between the two fluorophores within the cell was detected and was consistent with the expected interaction between β-arrestin and PTH receptor (Figures 3 and 4 of the article). Due to the small size of the tetracysteine motifs presented here and the relative simplicity of the labeling protocol, it is anticipated that studies focusing on additional protein interacting partners will follow up soon. Contributed by Anton Simeonov.
Characterization of FlAsH and ReAsH binding motifs in A2A-adenosine receptors. (A) Schematic representation of the different constructs. CFP or YFP were attached C-terminally after the indicated amino acid position. The 12-amino-acid tetracysteine motifs are denoted “FLN”for FLNCCPGCCMEP and “HRW” for HRWCCPGCCKTF. The 6-amino-acid tetracysteine motif CCPGCC is denoted “PG”. Additional numbers denote the sites (amino acid number) of motif insertion. IL and CT denote intracellular loops and C-terminus, respectively. (B) Fluorescence emission spectrum of FlAsH-labeled A2A-FL3-CFP (construct #5) and disruption of FRET by increasing concentrations of BAL (0–4 mM), measured with 436 nm excitation. (C) Reduction of ReAsH and FlAsH binding to the different tetracysteine motifs by BAL. Shown is the fraction of the indicated motifs occupied by the respective label (FlAsH green curves, ReAsH red curves) as a function of the BAL concentration used to displace binding. Data are derived from experiments as shown in (B). Symbols denote: open circle, A2A-Fl3-YFP (construct #6), filled circle, A2A-Fl3-CFP (construct #5); open diamond, A2AHRW-YFP (construct #4); filled diamond, A2A-HRW-CFP (construct #3); open triangle, A2A-FLNYFP (construct #2); filled triangle, A2A-FLN-CFP (construct #1). Data are representative measurements of three independent experiments. IC50 values are given in Supporting Information Table 1 of the article.
Specific labeling of the PTH receptor and β-arrestin2 in intact cells with ReAsH and FlAsH. (A) Schematic representation of the labeling protocol. Initially, the FLNCCPGCCMEP motif in the PTH receptor (*) as well as the CCPGCC motif in β-arrestin2 (#) were both covalently labeled with ReAsH (R). In a washing step with BAL, ReAsH was selectively removed from the CCPGCC motif in β-arrestin2. Finally, the latter motif was again labeled with FlAsH (F). (B) Specificity and completeness of labeling. The upper row of panels shows the ReAsH emission (594 nm laser line excitation, 600-700 nm emission); the lower row shows the FlAsH fluorescence (514 nm laser line excitation, 520-560 nm emission). The panels (from left to right) show nontransfected HEK cells before (left) and after (second from left) the labeling protocol [as depicted in (A)], HEK cells expressing only the PTH receptor construct (second from right) or the β-arrestin2 construct [both labeled as depicted in (A)]. (C) Functional integrity of the ReAsH labeled PTH receptor. The left panels show receptor internalization in HEK cells in response to PTH (1 μM, 18 min; right) compared to unstimulated controls (left). The right panels show Ca2+-responses to PTH (measured with Fura-2) in HEK cells transiently expressing wild-type or FLNCCPGCCMEP labeled receptors. (D) Functional integrity of FlAsH-labeled β-arrestin2. HEK cells transiently expressing unlabeled PTH receptors and FlAsH-labeled β-arrestin2 were stimulated with PTH (1 μM, 9 min; right) to induce translocation of β-arrestin2 to the plasma membrane. White scale bars represent 10 μm.
A Reagent with Paramagnetic Appeal
Moy FJ, Lee A, Gavrin LK, Xu ZB, Sievers A, Kieras E, Stochaj W, Mosyak L, McKew J, Tsao DHH: Novel synthesis and structural characterization of a high-affinity paramagnetic kinase probe for the identification of non-ATP site binders by nuclear magnetic resonance. J Med Chem 2010;53:1238–1249.
Abstract: To aid in the pursuit of selective kinase inhibitors, we have developed a unique ATP site binder tool for the detection of binders outside the ATP site by nuclear magnetic resonance (NMR). We report here the novel synthesis that led to this paramagnetic spin-labeled pyrazolopyrimidine probe (1), which exhibits nanomolar inhibitory activity against multiple kinases. We demonstrate the application of this probe by performing NMR binding experiments with Lck and Src kinases and utilize it to detect the binding of two compounds proximal to the ATP site. The complex structure of the probe with Lck is also presented, revealing how the probe fits in the ATP site and the specific interactions it has with the protein. We believe that this spinlabeled probe is a valuable tool that holds broad applicability in a screen for non-ATP site binders.
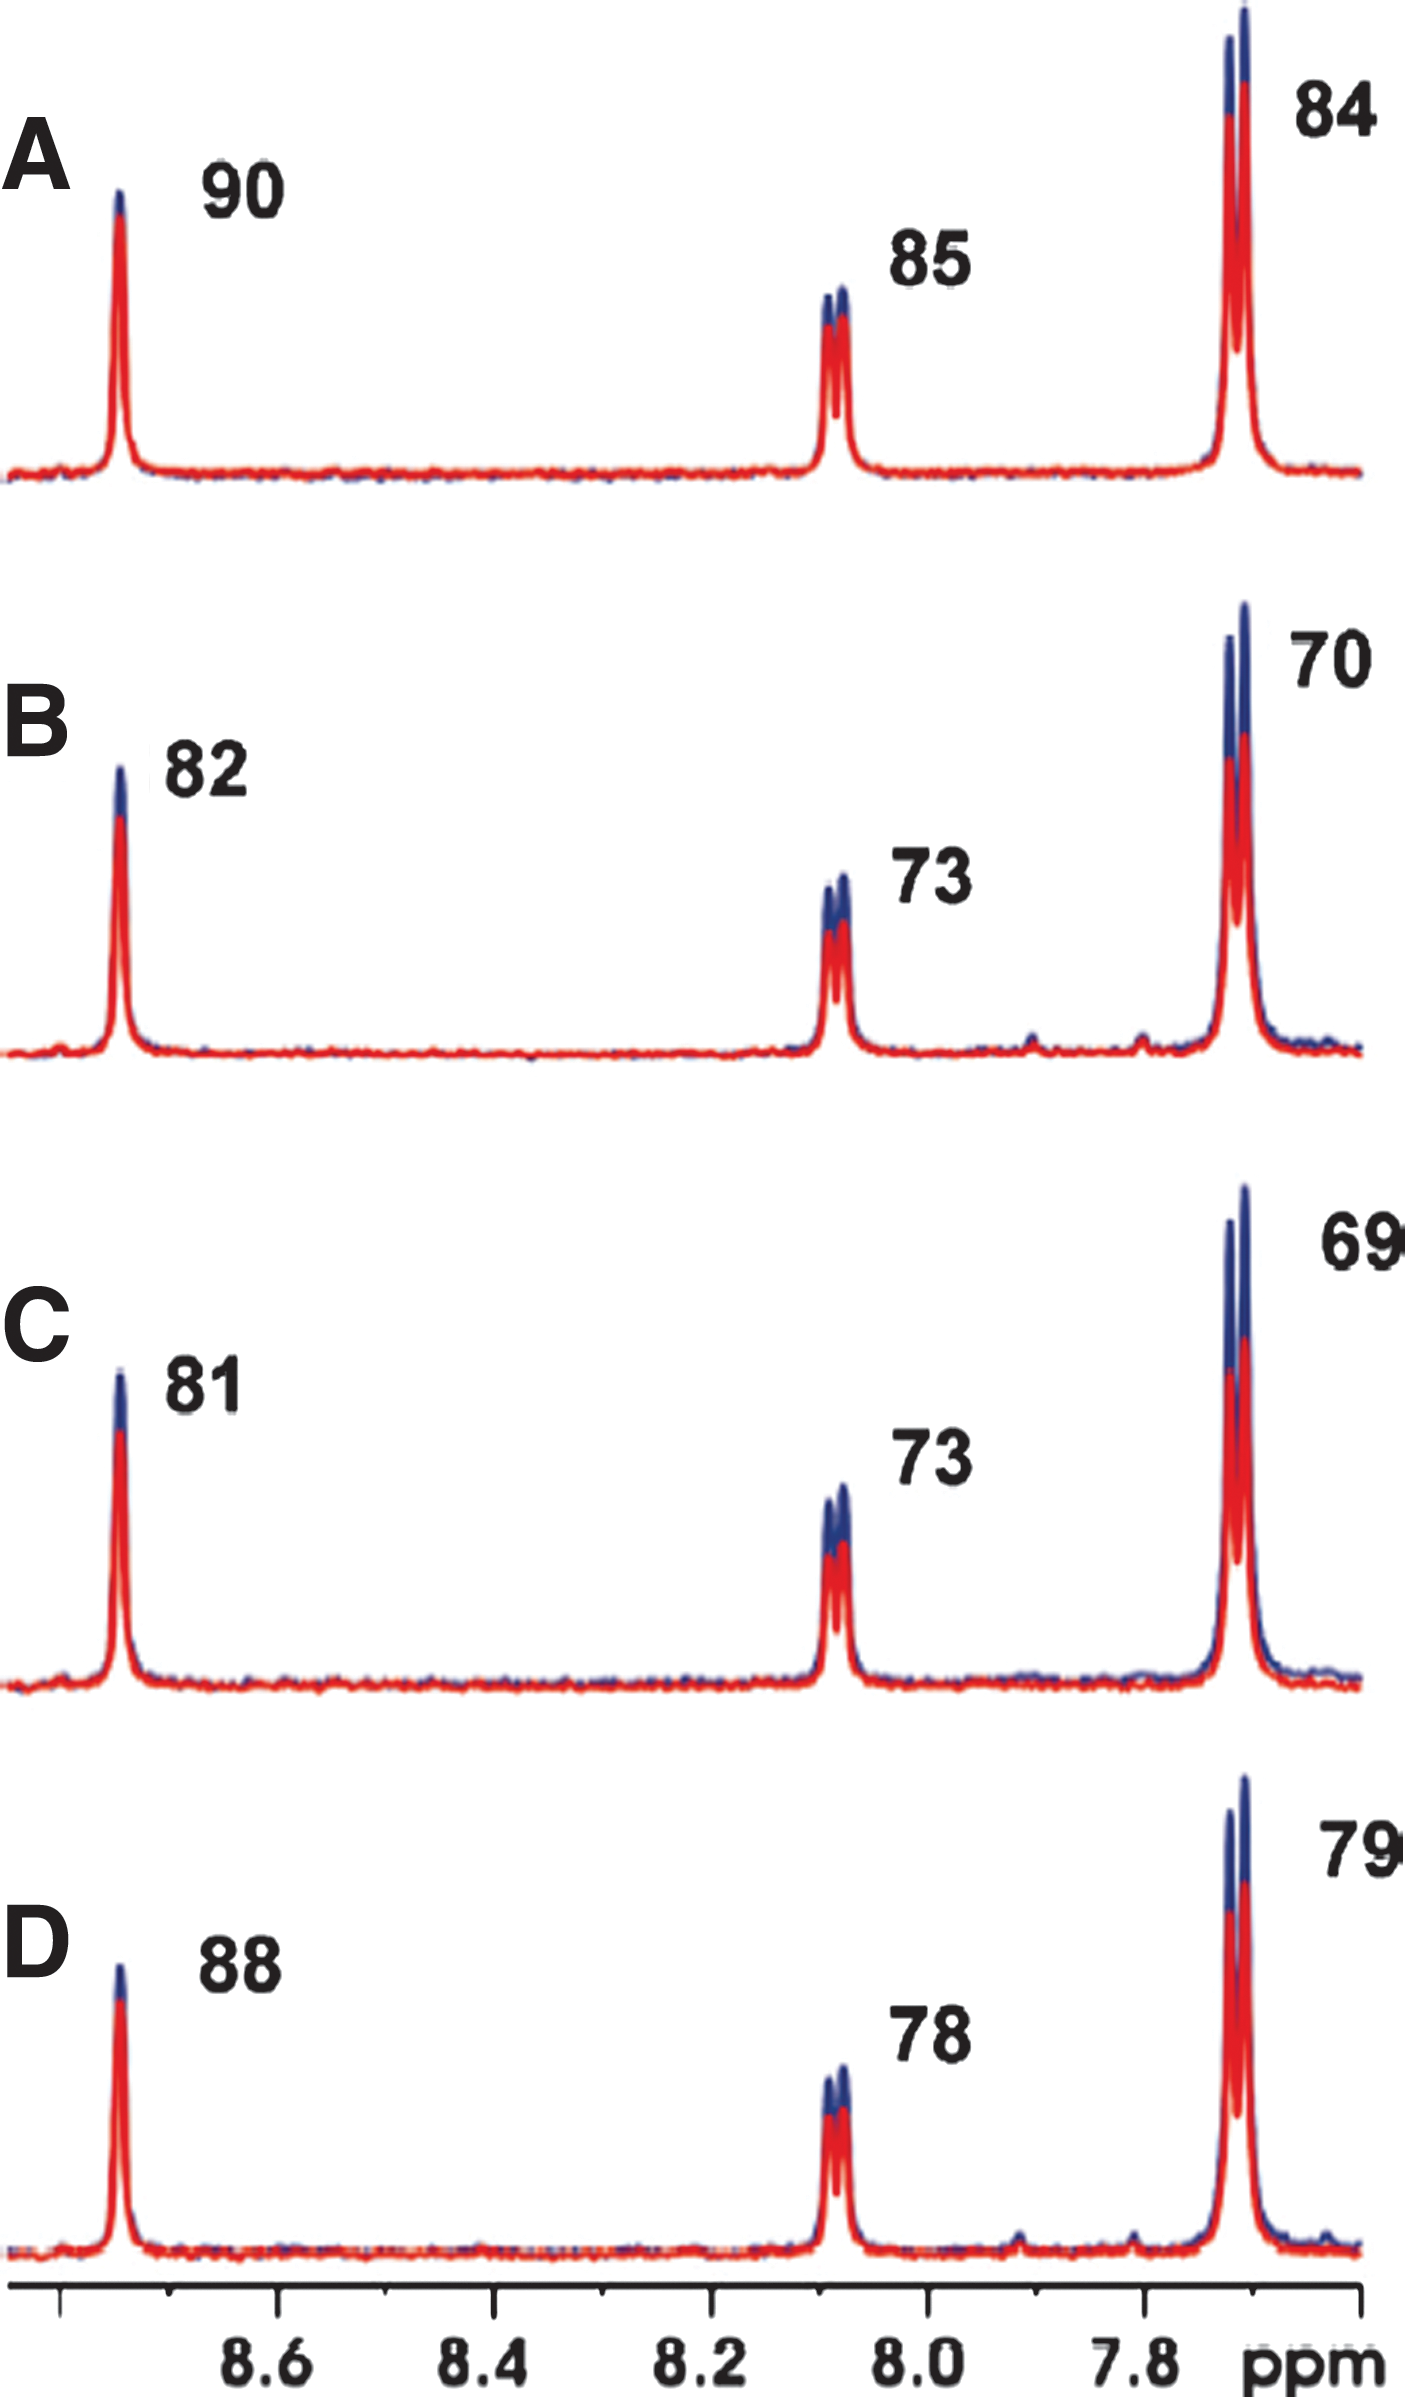
Commentary: Looking outside the ATP binding site of kinases for ligands in hopes of finding small molecule inhibitors with a greater degree of selectivity is a well-known strategy. Numerous tools and techniques have been reported seeking out type II kinase inhibitors including several clever ‘DFG out’ screening methods that have been reviewed in this journal. This contribution by Tsao and coworkers offers a new paramagnetic probe for NMR based evaluation of small molecules as non-ATP site binding agents for selected kinases. The authors utilize a pyrazolopyrimidin-7-amine core and the well-known spin-probe TEMPO as their rationally designed paramagnetic probe. An efficient synthesis of this reagent is presented as well as a table of IC50 values versus a collection of kinases. Happily, this agent had low-nanomolar inhibitory potential versus several kinases in the TK branch of the human kinome including Src and Lck. NMR is an incredibly sensitive technique for screening the binding affinity and binding orientation of ligands and proteins and high-throughput NMR techniques continue to improve. This technique is particularly useful when using paramagnetic tools like the TEMPO radical which can relax neighboring protons up to 25 angstroms away. The authors demonstrate that NMR can track binding of their reagent to Lck via titration and following the elimination of signal intensity of the reagent. Relaxation experiments further validated this novel reagent via the comparative peak intensity of type II inhibitors that bind proximal to the paramagnetic probe at 10 and 200 ms intervals. The initial experiment was done using Src and a known, albeit weak, non-ATP competitive Src inhibitor (KX-01). The primary experiment demonstrated that KX-01 (cmpd 3) bound to Src effectively (see
figure
, panels A and B). Additionally, the peak-ratio change associated with the 10 and 200 ms signals when the paramagnetic probe (cmpd 1) was added in comparison the reduced (and non-paramagnetic) version of the same molecule (cmpd 2) (see
figure
, panels C and D) highly suggest that 1 and 3 bind simultaneously to Src. Taken together, these studies offer a compelling proof of concept study for a novel, ATP competitive paramagnetic probe of selected kinases that can identify weakly binding type II kinase inhibitors. This reagent could be used in HTS settings to identify new leads as well as fragment based approaches due to its ability to find small molecule binders in the mM concentration range. Contributed by Craig Thomas.
T1ρ partial aromatic spectra at 10 (blue) and 200 ms (red) of (A) 100 μM 3, (B) 100 μM 3 and 6 μM Src, (C) 100 μM 3, 6 μM Src, and 10 μM 1, and (D) 100 μM 3, 6 μM Src, and 10 μM 2. Comparison of relaxation intensity ratios of T1ρ spectra of panels (A) and (B) shows that 3 binds to Src giving a 8-14% unit reduction. The 5-10% unit reduction in relaxation intensity ratios of T1ρ spectra of panels (C) and (D) is due to PRE.
Stretched and Barcoded
Reisnera W, Larsen NB, Silahtaroglu A, Kristensenb A, Tommerup N, Tegenfeldt JO, Flyvbjerg H: Single-molecule denaturation mapping of DNA in nanofluidic channels. PNAS 2010;10.1073/pnas.1007081107.
Abstract: Here we explore the potential power of denaturation mapping as a single-molecule technique. By partially denaturing YOYO®-1- labeled DNA in nanofluidic channels with a combination of formamide and local heating, we obtain a sequence-dependent “barcode” corresponding to a series of local dips and peaks in the intensity trace along the extended molecule. We demonstrate that this structure arises from the physics of local denaturation: statistical mechanical calculations of sequence-dependent melting probability can predict the barcode to be observed experimentally for a given sequence. Consequently, the technique is sensitive to sequence variation without requiring enzymatic labeling or a restriction step. This technique may serve as the basis for a new mapping technology ideally suited for investigating the long-range structure of entire genomes extracted from single cells.
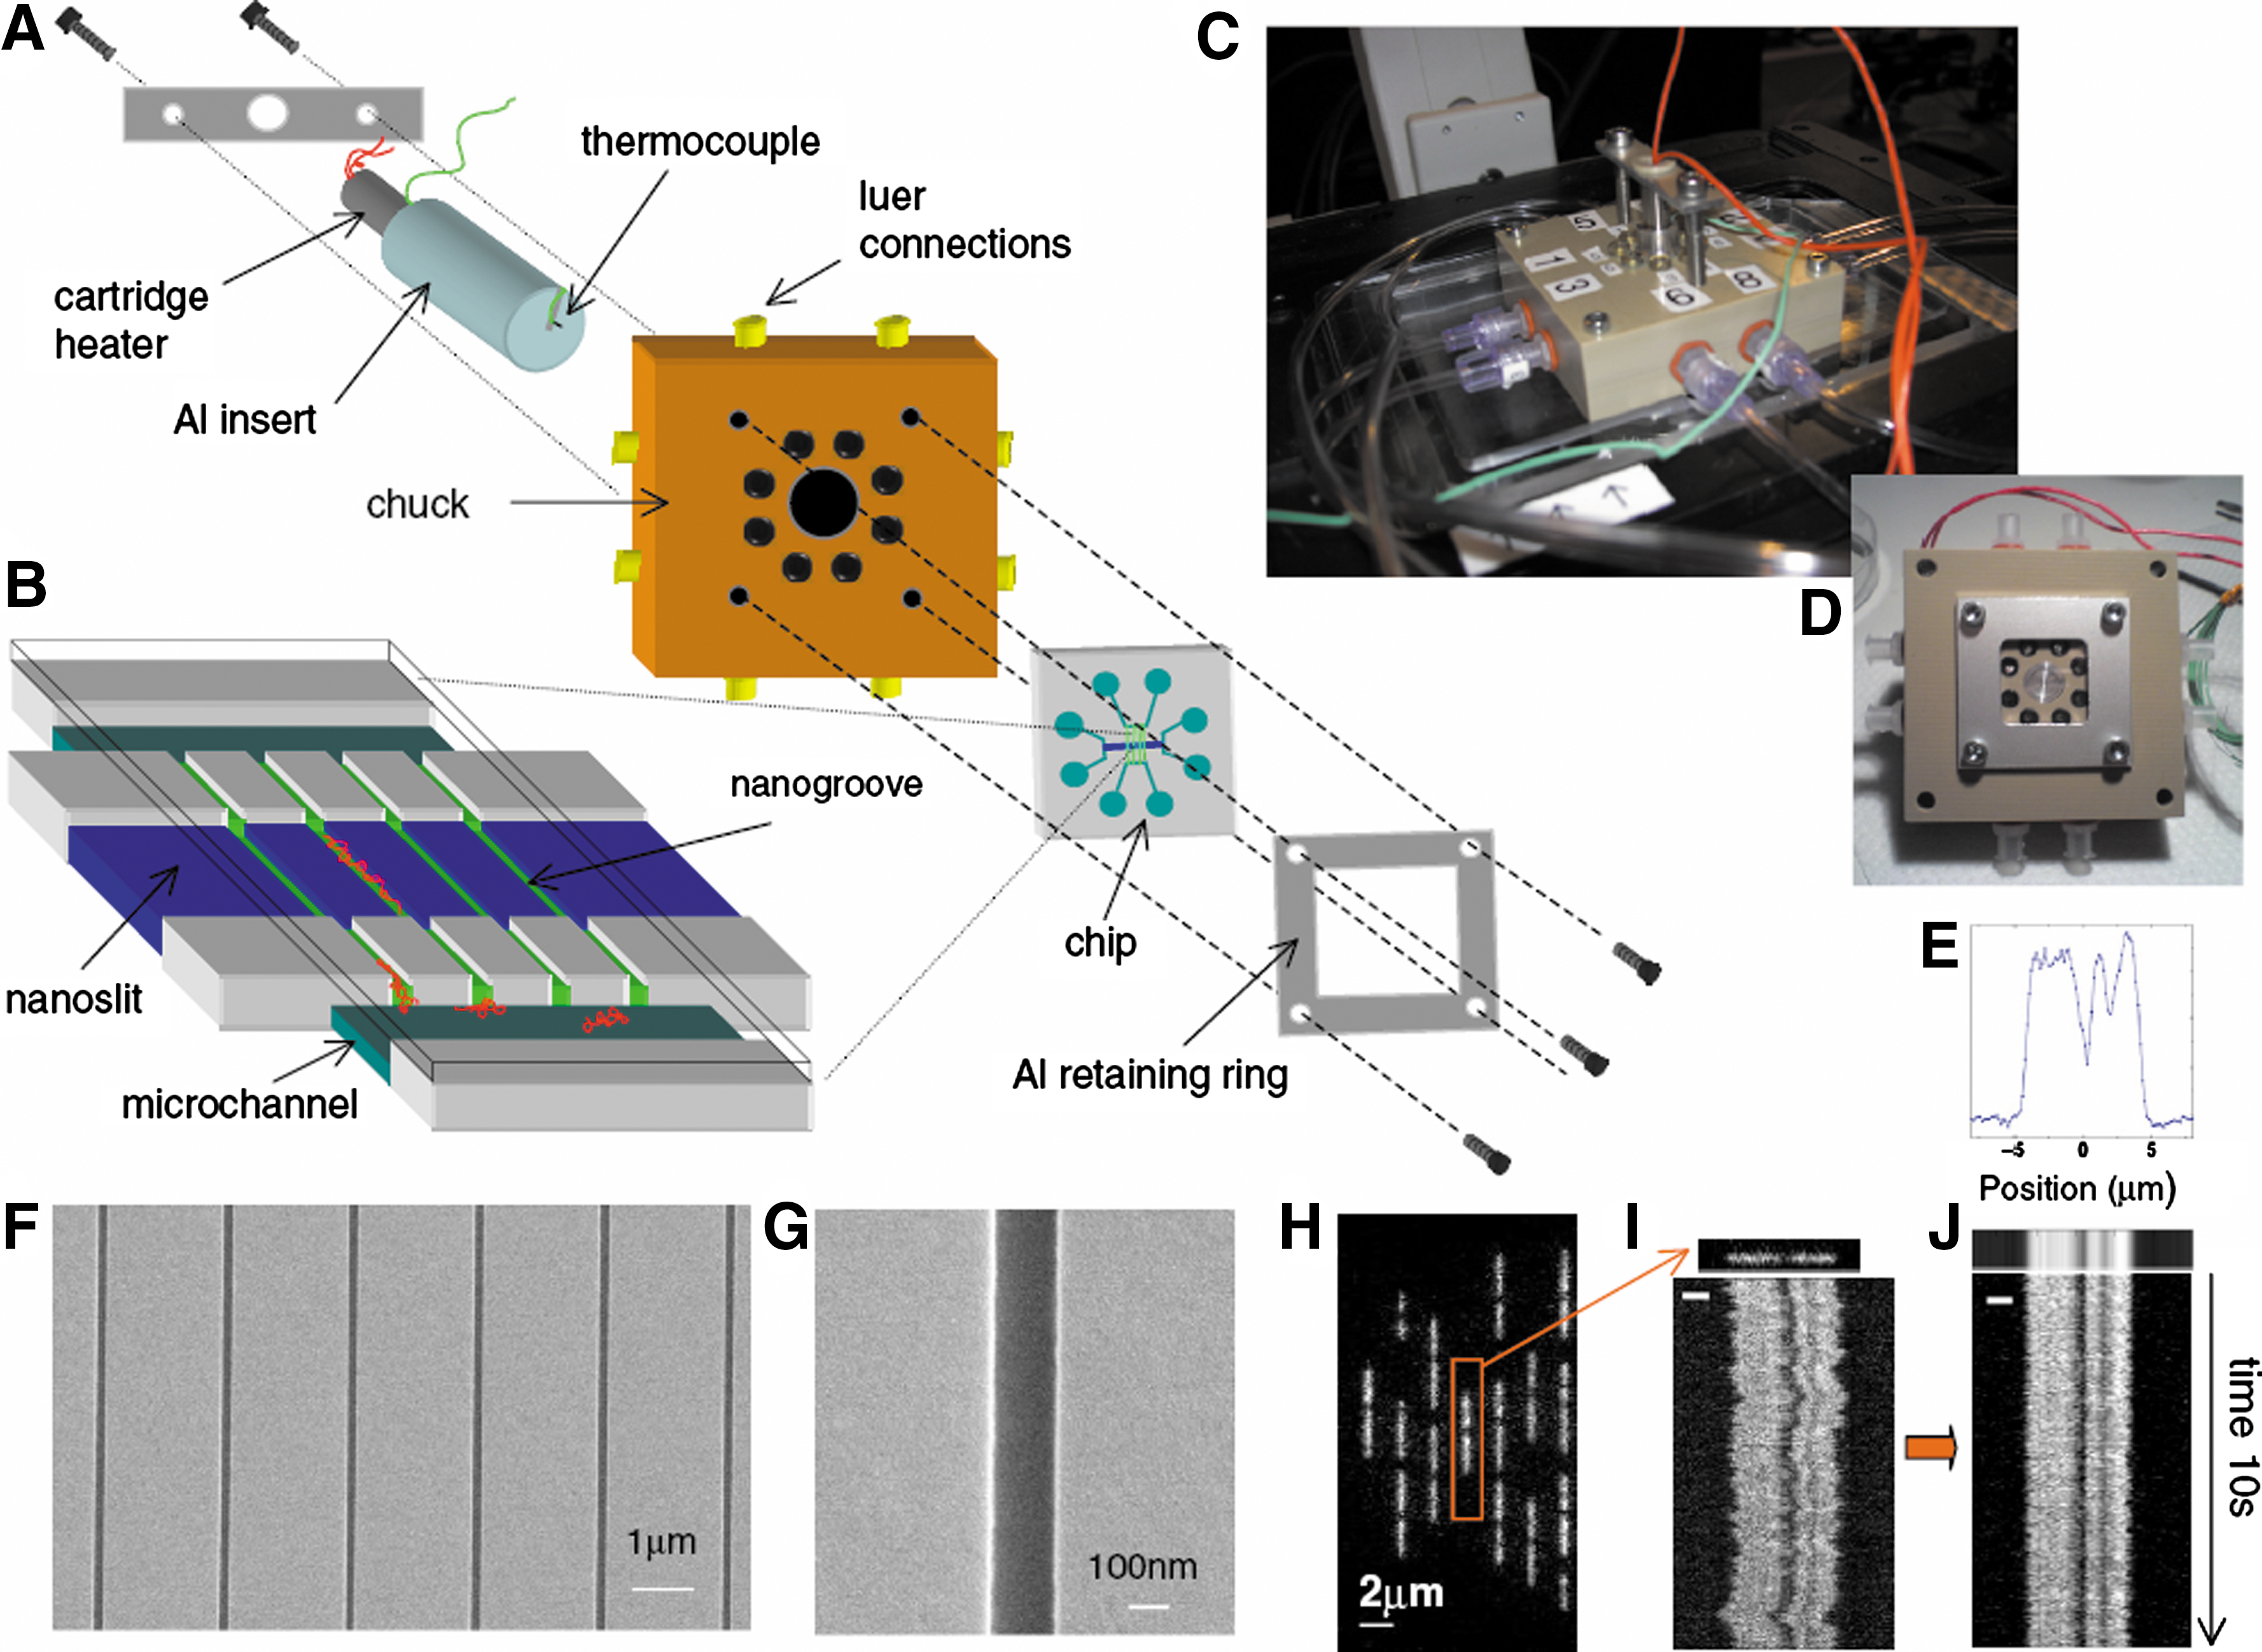
Commentary:The meaning of DNA barcoding has changed over the years. Approximately a decade ago, repetitive sequence-based PCR was used to amplify noncoding repetitive sequences interspersed throughout bacterial genomes: separation of the multiple amplicons and comparison of the resulting pattern with reference strains allowed bacterial subspecies and strain identification; the technique was referred to as bacterial barcoding. In the present work, barcoding has been given almost a literal meaning: the authors stretch unamplified genomic DNA by passing it through nanosize channels and by detecting regions of the genome which have reduced thermostability relative to the rest, they obtain a direct visual “banding” or barcoding of the genomic DNA. This was achieved by first changing the buffer composition to dramatically lower the melting temperature (Tm) of genomic DNA to just a couple of degrees above room temperature to simplify optical detection (for example, the quantum yield of an average fluorophore drops significantly as the temperature is raised, making variable-temperature imaging difficult). Formamide, a reagent known for a long time to induce DNA strand denaturation, and which exhibits a well-defined effect on melting temperature, was used here at a 50% concentration in order to achieve the shift in Tm to the range of 29–33 °C. To observe the genomic DNA as a long strand of nucleic acid, the authors fabricated a special chip containing nanosize fluidic channels (30–120 nm) for DNA stretching and barcode detection coupled with microfluidic channels (1 μm by 50 μm) for sample delivery and interfacing with external ports (see
first figure
). The DNA was loaded by pressure and the special shape pattern created between the microchannels and the middle section of the nanochannel portion (called nano slits, see
first figure
, panel B) allowed the genomic DNA molecules to be trapped, stretched, and imaged. To image the DNA, a standard double-stranded DNA binding dye YOYO-1 was used and a barcode pattern was determined by imaging the nanochannel in a grayscale mode. The authors successfully imaged T7 and lambda phage DNA (see
second figure
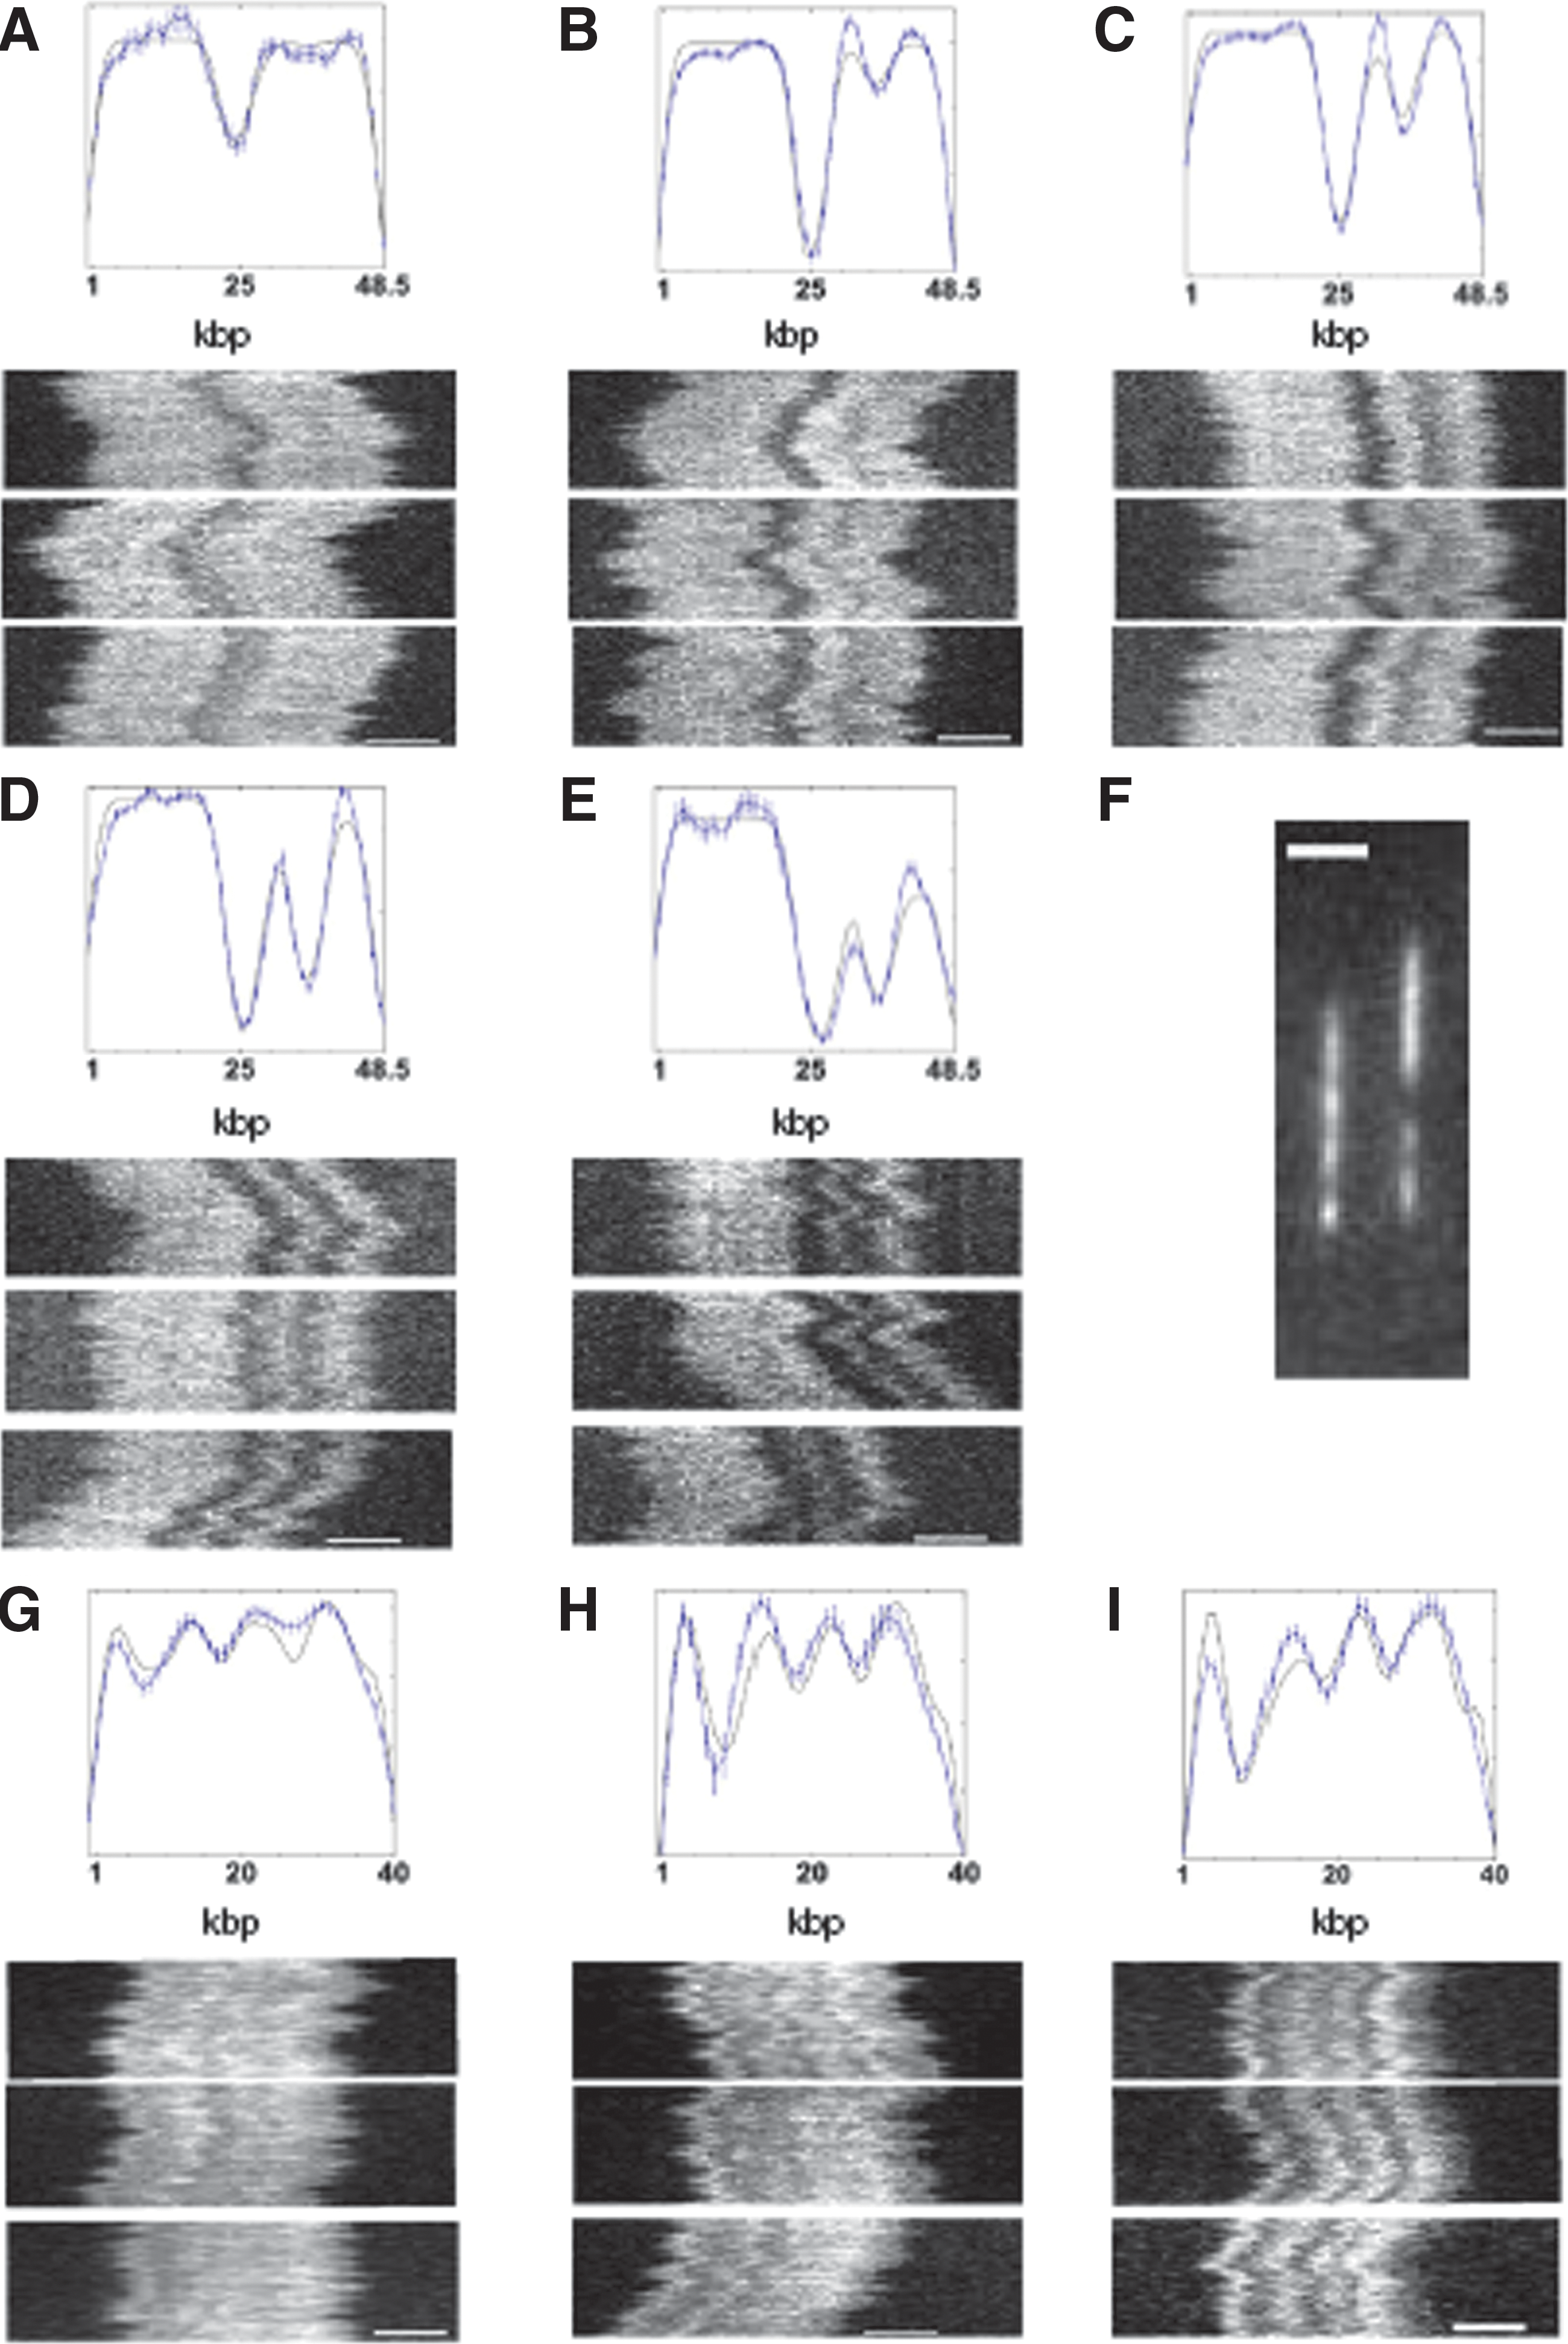
), as well as a BAC construct from human chromosome 12 (Figure 5 of the article), obtaining patterns consistent with classical genetic studies. Furthermore, a strong correlation existed between the barcode pattern observed in the nanochip and the predicted long-range Tm variation of the DNA as a function of the AT content within a given stretch (Figure 4 of the article). In the case of the BAC construct, the authors compared the barcode pattern with a reference sequence for human chromosome 12 and were able to align the cloned construct to a specific stretch of the chromosome with a very good precision of 1 kb. Because the authors did not use specific melting temperature information but only compared the fingerprint of low- and high-GC content regions, the method presented here carries an added convenience in being Tm-independent. It seems entirely feasible that with some improvements in the chip and device, this technique can become the future DNA barcoding method of choice allowing rapid assessment of genome integrity and species identification without the need for any DNA amplification whatsoever. Contributed by Anton Simeonov.
Experimental setup and chip design. (A) Schematic of how the chip, fluidic chuck, and heater are assembled and integrated in an experiment. A retaining ring held the chip clamped against a fluidic chuck via eight o-ring seals. The chuck was designed so that pneumatic pressure could be applied to bring fresh DNA into the nanoslit from the loading channels. In addition, the chuck was designed with a built-in “hot plate” so that the chip could be heated during experiments. A cartridge heater (Omega) was inserted into a cylindrical aluminum insert that was then gently pressed against the chip's back surface. In order to monitor the temperature in situ, a thermocouple was threaded through the insert and placed in a hole drilled halfway through the silica sample. (This hole was located 2 mm away from the nanogroove region.) The hot-plate surface was painted with thermally conductive grease (Omegatherm) to enhance heat transfer. Thermocouple measurements of the chip surface temperature show that the measured thermal difference across the chip is comparable to the expected absolute accuracy of our thermocouple readings (∼1–2 °C). The fluctuations in thermocouple readings are ∼0.1 °C. (B) Three-dimensional diagram of the nanogroove and nanochannel arrays interfaced to microscale loading channels (1 μm deep, 50 μm wide). The nanochannels are etched first (120 nm), followed by the nanoslit (30 nm), to create nanogrooves within the open nanoslit region. Cartoon DNA molecules are shown in red. (C) Photograph of the chuck-chip-heater assembly on the microscope stage with external tubing for applying pressure. (D) Photograph of a chip clamped to the chuck via the aluminum retaining ring. (E) Intensity profile obtained by averaging over rescaled frames. The barcode shown below the plot is graphed data displayed as a grayscale plot. (F) Low-magnification SEM micrograph of the nanochannels. (G) High-magnification SEM micrograph of a nanochannel (150 nm wide, 120 nm deep). (H) Raw image of λ-DNA molecules in nanochannels at 28 °C in 50% formamide (with background removed). (I) Example of single λ-DNA molecule from (H) with accompanying “time trace” of intensity integrated transverse to nanochannel axis plotted for all frames. (J) Time trace for molecule shown in (I) with thermal fluctuations “smoothed out” via rescaling procedure. The white scale bars in (I) and (J) are equal to 2 μm.
λ-phage and T7 consensus barcodes in 50% formamide. (A) λ-phage barcode at 27 °C with three example time traces (n = 13 molecules total in consensus). (B) λ-phage at 28 °C (n = 56 molecules in consensus). (C) λ-phage at 30 °C (n = 47 molecules in consensus). (D) λ-phage at 31 °C (n ¼ 38 molecules in consensus). (E) λ-phage at 32 °C (n = 19 molecules in consensus). (F) A raw fluorescence micrograph showing λ-phage and T7 molecules side by side: It is possible to easily distinguish the two from the melting barcode. (G) T7 at 30 °C (n = 20 molecules in consensus). (H) T7 at 30.6 °C (n = 10 molecules in consensus). (I) T7 at 31.2 °C (n = 17 molecules in consensus). The example time traces have 10-s duration. The scale bar in all images is 2 μm. The error bars in the plots are standard errors on the ensemble mean (SEM), calculated as the SD of ensemble values divided by the square root of n.
Comet in a Well
Wood DK, Weingeist DM, Bhatia SN, Engelward BP: Single cell trapping and DNA damage analysis using microwell arrays. PNAS 2010;107:10008–10013.
Abstract: With a direct link to cancer, aging, and heritable diseases as well as a critical role in cancer treatment, the importance of DNA damage is well-established. The intense interest in DNA damage in applications ranging from epidemiology to drug development drives an urgent need for robust, high throughput, and inexpensive tools for objective, quantitative DNA damage analysis. We have developed a simple method for high throughput DNA damage measurements that provides information on multiple lesions and pathways. Our method utilizes single cells captured by gravity into a microwell array with DNA damage revealed morphologically by gel electrophoresis. Spatial encoding enables simultaneous assays of multiple experimental conditions performed in parallel with fully automated analysis. This method also enables novel functionalities, including multiplexed labeling for parallel single cell assays, as well as DNA damage measurement in cell aggregates. We have also developed 24- and 96-well versions, which are applicable to high throughput screening. Using this platform, we have quantified DNA repair capacities of individuals with different genetic backgrounds, and compared the efficacy of potential cancer chemotherapeutics as inhibitors of a critical DNA repair enzyme, human AP endonuclease. This platform enables high throughput assessment of multiple DNA repair pathways and subpathways in parallel, thus enabling new strategies for drug discovery, genotoxicity testing, and environmental health.
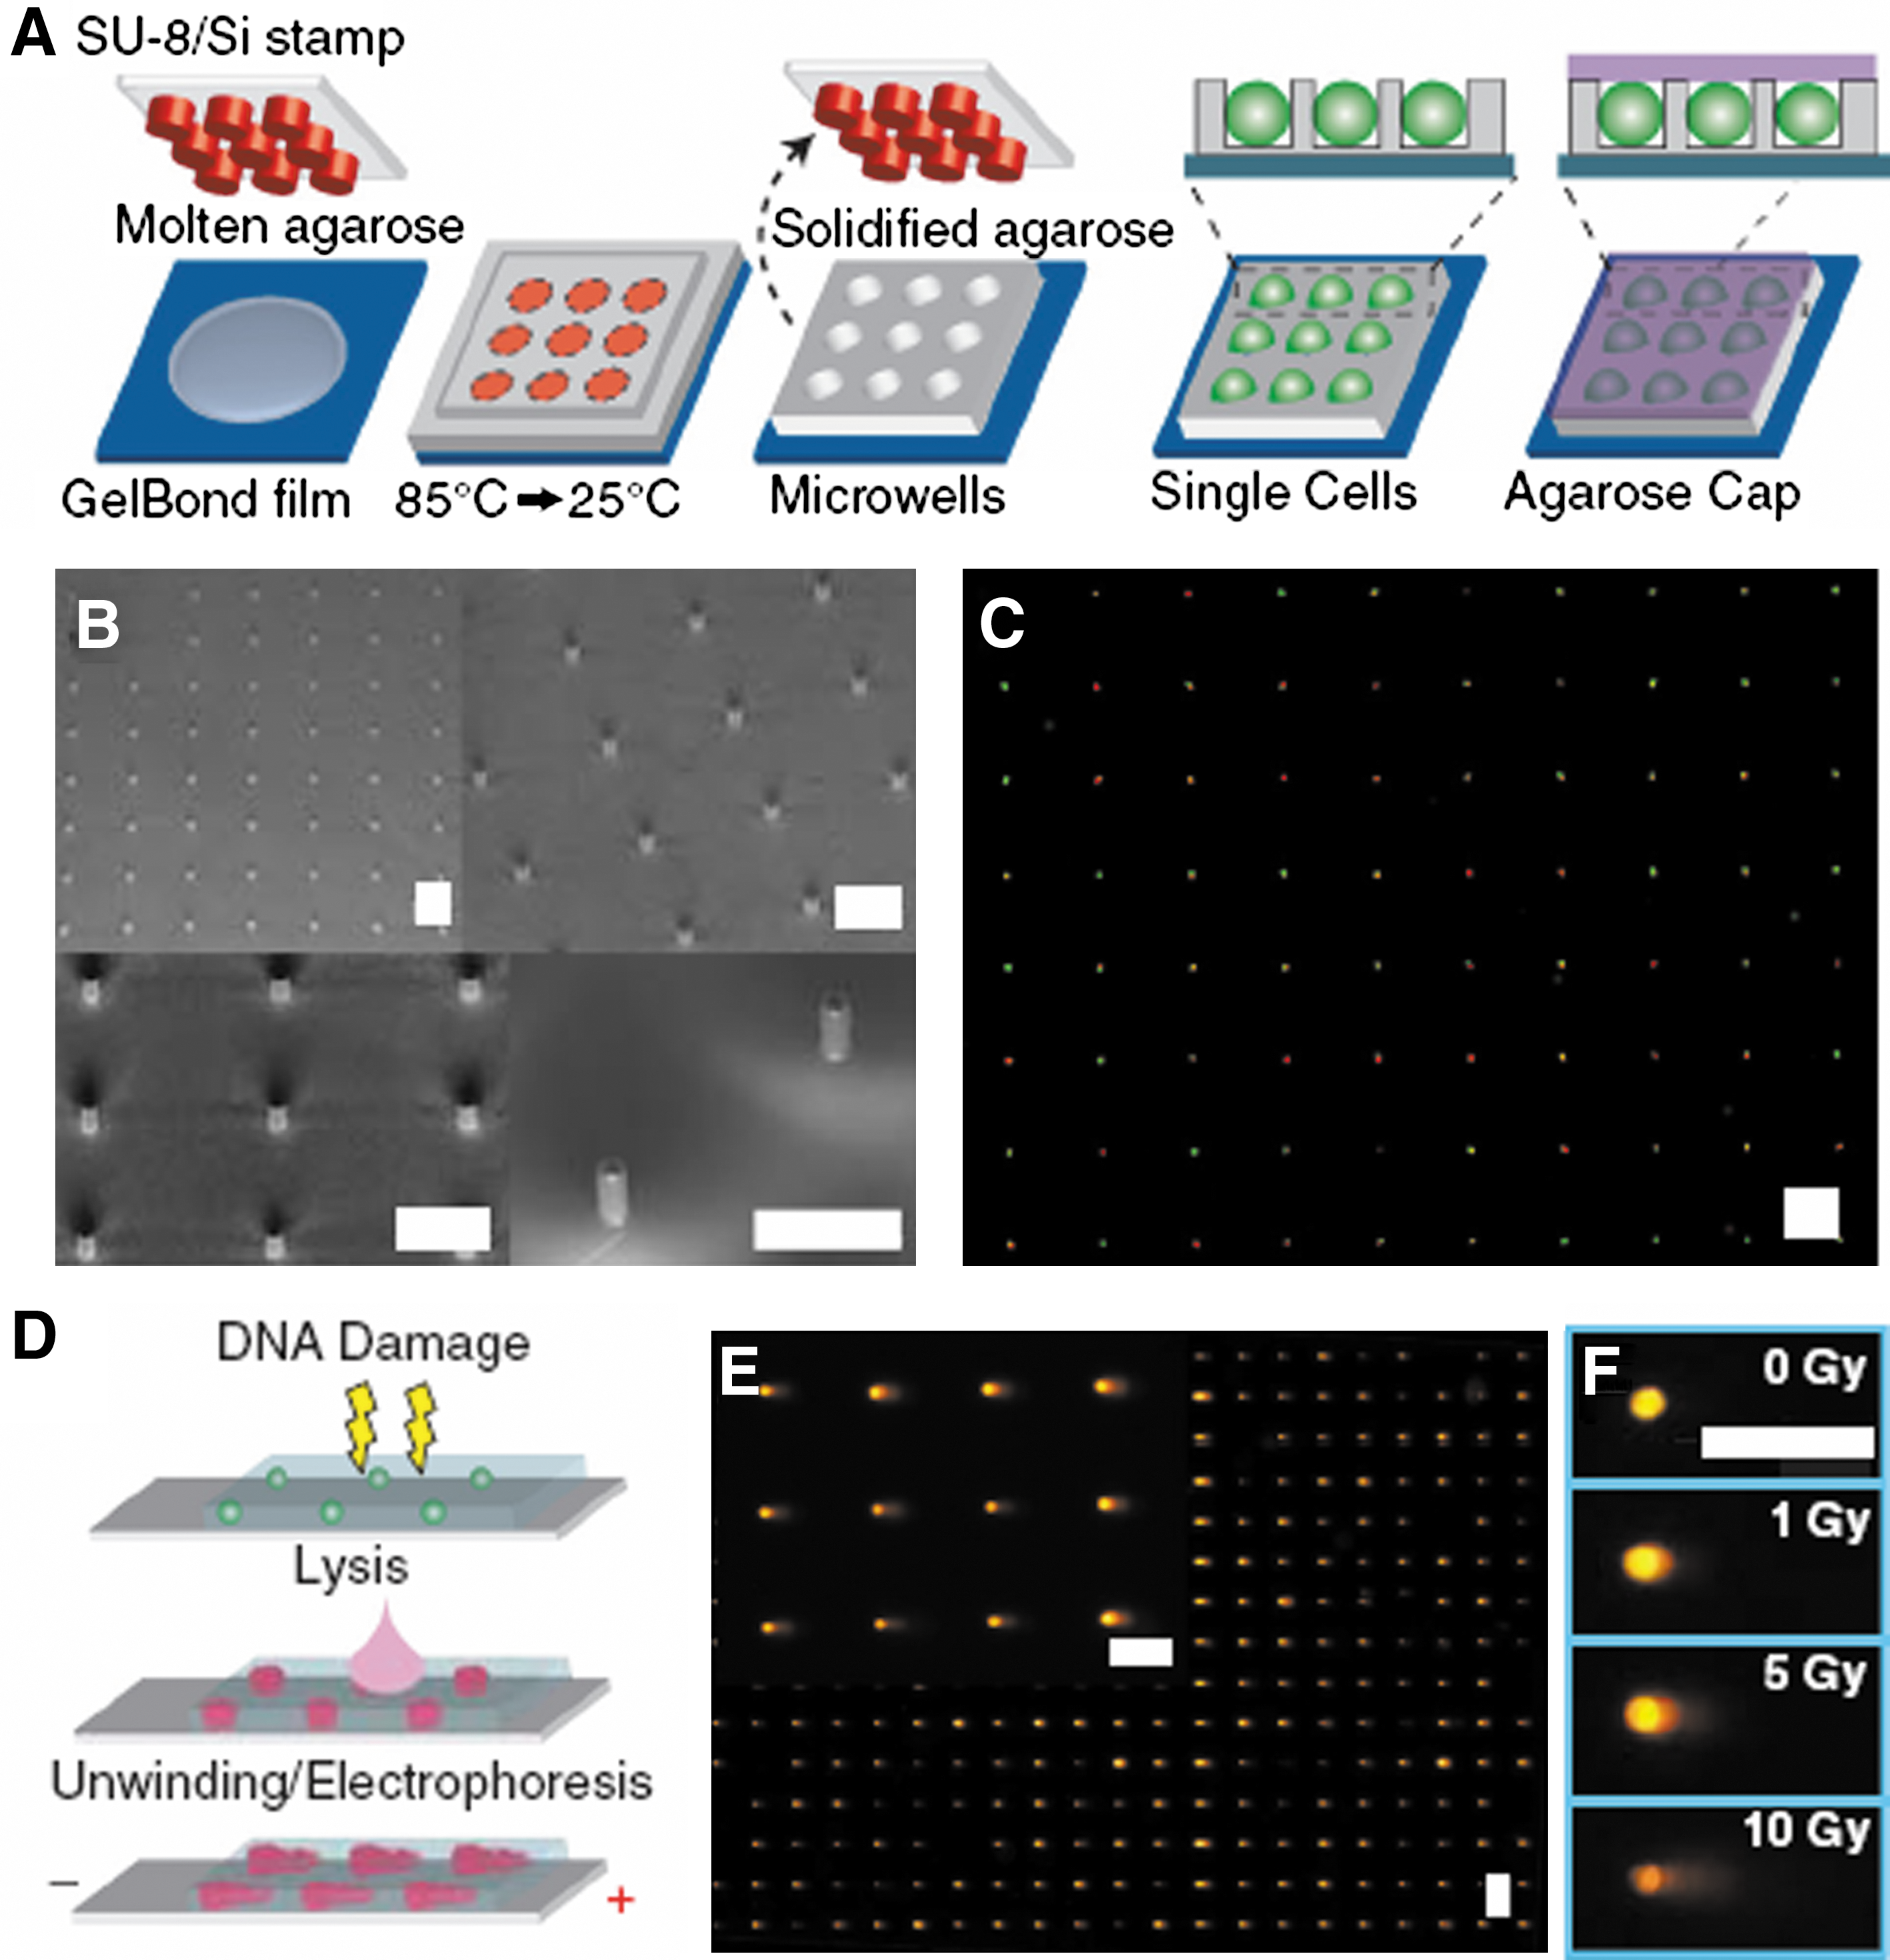
Commentary:A significant improvement to the comet assay is finally here. The comet assay has been practiced for over 20 years to assess genomic DNA damage from various treatments (radiation, genotoxic agents) but advances in imaging devices notwithstanding, it has remained a very low throughput manual technique plagued by difficulties in execution, data interpretation, and low reproducibility. The comet assay is based on the immobilization of cells in molten agarose, treatment of the cells with the agent of choice and, after cell lysis, detection of the differential DNA damage by electrophoresis: single-strand breaks and smaller DNA fragments formed as a result of the treatment migrate faster within the agarose gel and are detected and quantified as an increased “tail” region relative to the slower migrating undamaged genomic DNA, itself dubbed the “comet core”. Beyond the low throughput, among the major difficulties reported for this technique are the ambiguity in defining core and tail portions of the comet and the overlap of cells within the agarose matrix making it impossible to identify individual comets. In the present method, Bhatia and Engelward solve a large majority of these problems by creating a thin-layer patterned device which retains the major features of the comet assay, that is, the physical constriction of cells within the agarose matrix and the subsequent lysis and electrophoretic separation, but at the same time allows the placement of defined number of cells within a well-defined physical space to enable the comet assay to be performed in an array fashion on multiple samples under identical conditions and with the utilization of automated comet detection and quantitation. The authors start with molten agarose on a solid substrate onto which a microfabricated stamp containing small well features is imprinted. Upon cooling of the agarose, the stamp is withdrawn, leaving a precisely defined array of microwells into which single cells can be delivered and where the subsequent electrophoresis region can be constrained (see
first figure
). Crucial features of this approach include the ability to tailor the well size to the size of the cells being analyzed and the ability to retain all cells within the same focal plane, thus making it possible for the comet results to be imaged and analyzed automatically without introducing a laborious focusing routine (see
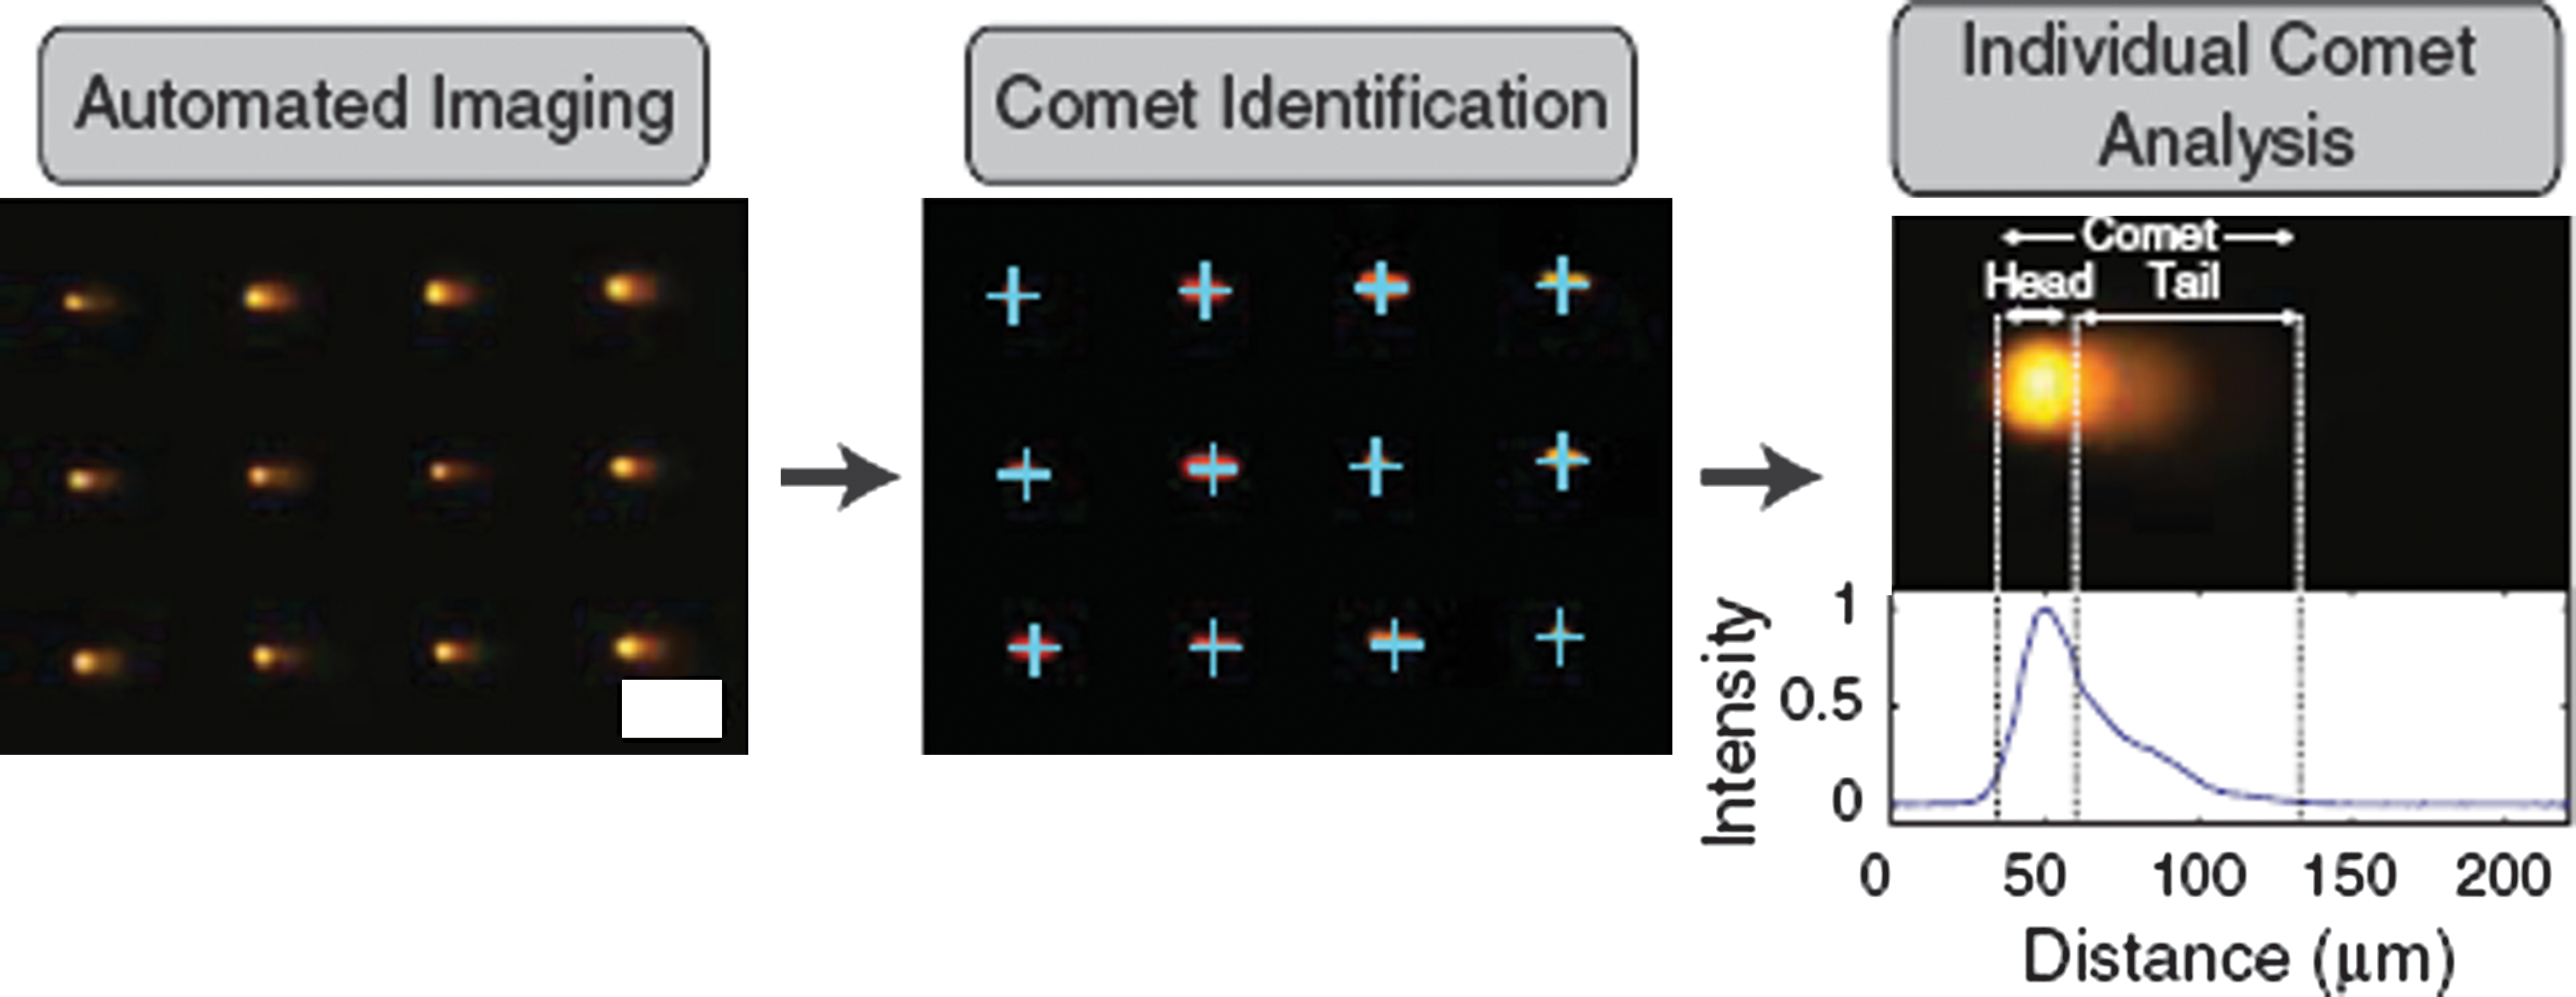
second figure
): simple scan in the direction of the electrophoretic field allows head and tail detection and because each well is normalized with respect to total DNA content, the comet calculation within each well is self-calibrated (Figure 4 of the article). The new comet array method was first demonstrated by creating a 24-well device and followed this by testing the comet assay in a 96-well format (Figure 5 of the article); subsequently, the authors demonstrated the reporting capability of the new assay as a function of damaging radiation delivered or the type of genotoxic agent used (Figures 3 and 5 of the article). Lastly, they showed that the 96-well comet array assay can be used to measure the effect of small molecule inhibitors of a DNA repair enzyme on the extent of DNA damage: previously-reported inhibitors of the major abasic endonuclease APE1, a key participant in base-excision repair, were used to treat cells in a dose-response manner and the percentage of comet tail (representing the degree of damage) was shown to increase as a function of both concentration and IC50 potency of the APE1 inhibitors, providing a direct demonstration of the compounds' effect on repair of DNA lesions in cells and paving the way toward high-throughput testing of candidate inhibitors of DNA repair pathways using the comet assay. Contributed by Anton Simeonov.
Single cell gel electrophoresis array. (A) Microwell fabrication. A microfabricated stamp is placed onto molten agarose. Agarose is cooled to set, and the stamp is removed. Cells are loaded into wells by gravitational settling, and an agarose overlay covers the cells. (B) Scanning electron micrograph of SU-8 posts patterned onto a silicon substrate. (C) Two populations stained red and green, loaded into wells concurrently, are shown by cytoplasmic staining. (D) Comet assay. Cells are treated with DNA damaging agent. Cells are lysed in the gel, exposing the DNA. The DNA is unwound and electrophoresed under alkaline conditions. Relaxed loops and low molecular weight fragments migrate out of the packed chromatin, forming a comet tail. (E) Arrayed microwell comets. (F) Microwell comets with varying doses of IR damage. Horizontal scale bars are 100 μm.
Comet analysis pipeline. Images of comets are acquired automatically. Identification software recognizes comets in a defined array. Image of arrayed comets before and after identification are shown. Identified comets are labeled with blue crosses. Scale bar is 100 μm. Finally comet analysis software identifies beginning and end of comet as well as head/tail division (dashed vertical lines) and calculates comet parameters. A comet is shown along with its corresponding line profile from which the comet parameters are calculated.