




Abstract
High content screening (HCS) has emerged an important tool for drug discovery because it combines rich readouts of cellular responses in a single experiment. Inclusion of cell cycle analysis into HCS is essential to identify clinically suitable anticancer drugs that disrupt the aberrant mitotic activity of cells. One challenge for integration of cell cycle analysis into HCS is that cells must be chemically synchronized to specific phases, adding experimental complexity to high content screens. To address this issue, we have developed a rules-based method that utilizes mitotic phosphoprotein monoclonal 2 (MPM-2) marker and works consistently in different experimental conditions and in asynchronous populations. Further, the performance of the rules-based method is comparable to established machine learning approaches for classifying cell cycle data, indicating the robustness of the features we use in the framework. As such, we suggest the use of MPM-2 analysis and its associated expressive features for integration into HCS approaches.
Introduction
Automated imaging techniques coupled with quantitative analysis routines that classify cells into different cell cycle stages have been shown to be accurate and reproducible. 2 Since many clinically important disruptions occur during mitosis—the phase in which the replicated genome is divided into two daughter cells—efforts have been made to classify stages of mitosis with a high degree of temporal resolution. 3 –5
One common experimental approach involves using a fluorescent histone marker or nuclear stain (e.g., 4′,6-diamidino-2-phenylindole [DAPI] or Hoechst) to provide a nuclear marker. 6,7 After image acquisition, images are processed into individual nuclei, and measurements from the labeling pattern within each nucleus are made. Finally, statistical learning approaches are used to determine cell cycle stage based on subnuclear and nuclear patterns. One challenge to these approaches is that treatment conditions often change from experiment to experiment; for example, drug treatment can lead to diverse mitotic chromosome morphologies in one dataset that may not be represented in another set.
In this work we seek to develop and evaluate a rules-based classification framework that can be applied to both synchronous and asynchronous populations of cells. Our framework reduces the need for synchronized cell populations and would simplify high content screens. Moreover, we seek to make this framework robustly to different compound treatments, making it suitable for HCS applications. To this end, we have also defined unique features for high content analysis that refines our framework across different types of experimental treatments.
Materials and Methods
Cell Lines and Culture
The quantitative cell cycle approaches developed here arose from previous mitotic progression studies of Aurora kinase family members and engineered cell lines. 8 The single thymidine block experiment and the unsynchronized cell experiments were performed with HeLa cells cultured in Dulbecco's modified Eagle's medium (DMEM; Invitrogen) supplemented with 10% fetal bovine serum (FBS), 50 units/mL penicillin, and 50 μg/mL streptomycin (Invitrogen). The double thymidine block experiment was performed with HeLa Tet-On Aurora-C-wild type (HTO-AurC-WT) cells. HTO-AurC-WT cells are modified HeLa Tet-On cells (BD Biosciences) that have been stably transfected with a pTRE-regulated expression construct for Flag-Aurora-C. 8 Flag-Aurora-C expression is negligible in the absence of doxycycline, which was not used in the experiments described here, and moderate Aurora-C overexpression has no overt effect on cell cycle progression. 9 HTO-AurC-WT cells were cultured in a 1:1 combination of DMEM and McCoy's 5A medium (Invitrogen) with 10% tet system-approved FBS (Hyclone), 50 units penicillin and 50 μg streptomycin, 100 μg/mL G-418 (Invitrogen), and 100 μg/mL hygromycin B (Invitrogen). All cells were cultured at 37°C in 5% CO2.
Cell Seeding and Synchronizations
Cells were manually seeded into black-walled, optical glass-bottom, 96-well trays (Matrical; double thymidine block experiment), into 384-well optical plastic-bottom trays (Greiner; unsynchronized experiment) or onto poly-D-lysine-coated coverslips (single thymidine block experiment). Where indicated, cells were synchronized at the G1/S border by single or double thymidine block. Specifically, 30 h after seeding, cells were blocked by exchanging the medium in the well for medium containing 4 mM thymidine and incubated for 14 h. Cells were then released from this block by three changes of thymidine-free media. For single thymidine block, cells were incubated for 8 h, and then fixed. For double thymidine block, cells were incubated for 10 h, blocked again for 15 h, and then released again into S phase in synchrony. Cells were then fixed after the second release as the peak of the synchronized wave of cells passed through mitosis.
Cell Fixation, DNA Staining, and Immunolabeling
Cells were fixed by the gentle addition of an equal volume of ice-cold 8% EM-grade formaldehyde in Dulbecco's phosphate-buffered saline (PBS) plus Ca2+ and Mg2+ directly to the media already in the well for a final concentration of 4% formaldehyde, and incubated on ice for 30 min. Cells were briefly permeablized in PBS containing 0.5% Triton X-100 (PBS-TX) and then treated with blocking buffer (1% bovine serum albumin in PBS-TX) for 15 min at room temperature. Cells were immunolabeled with 1:100–1:500 mouse mitotic phosphoprotein monoclonal 2 (MPM-2) antibody [GeneTex (clone 0.T.181) or Millipore] and either 1:200 rabbit anti-Aurora-B antibody (Bethyl Labs) or 1:1,000 rat anti-tubulin (Abcam) diluted in blocking buffer for 1 h at room temperature. Cells were then washed two times for 10 min each in PBS-TX. Next, secondary antibodies diluted in blocking buffer (1:1,000 Alexa Fluor 488–conjugated goat anti-mouse and 1:500 Alexa Fluor 647–conjugated goat anti-rabbit or 1:1,000 Alexa Fluor 568–conjugated goat anti-rat from Invitrogen) were applied for 1 h at room temperature. About 1 μg/mL DAPI and 10 μg/mL CellMask™ Deep Red (Invitrogen; single thymidine block experiment only) in PBS-TX was applied to cells for 10 min. Cells were washed in PBS-TX for 10 min, followed by PBS for 10 min. To ensure stable imaging, cells were postfixed in 4% formaldehyde in PBS for 30 min at room temperature or 37°C and then rinsed several times in PBS. Cells in 96-well or 384-well plates were stored at 4°C in PBS until imaging, and they were also imaged while in PBS. Cells on coverslips were mounted on slides with SlowFade Gold Antifade reagent (Invitrogen).
Automated Microscopy
For automated cell cycle classification, high-throughput imaging was performed with a 20×/0.75 NA or 0.50 NA Plan Nikon objective on a Beckman-Coulter IC-100 Image Cytometer. At least 30 fields were imaged per treatment. Image-based auto-focusing was performed for each field in the DAPI channel, and one image was collected for each channel at the autofocus z-plane, plus two additional images 5 μm above and below the autofocus plane (double thymidine block and unsynchronized experiments) or six additional planes, three above and three below the autofocus plane, every 2 μm (single thymidine block experiment). DAPI, MPM-2, and either Aurora-B or tubulin and CellMask channel images were collected at each plane.
Image Preprocessing
Raw images were processed by background subtraction of the median pixel value from the entire image, except for CellMask images, in which case the mode pixel value was subtracted. Resulting negative intensity pixels were set to zero. Further image analysis was performed on background-subtracted images. To correct for chromatic aberrations, channels were registered by manually determining optimal vertical and horizontal translations and expansions for additional channels relative to the DAPI channel. These translations and expansions were then automatically applied to all fields from an experiment, and the resulting padding was then cropped. Implementation of the custom workflow was performed using the Advanced Imaging Collection in Pipeline Pilot 7.5.2 (Accelrys, Inc.).
Image Segmentation
A multi-step method was developed for the delineation of nuclei from DAPI images that is tolerant of the disparity in signal intensity, axial thickness, shape, and size between interphase nuclei and mitotic chromosome masses (Appendix Fig. A1); these details become significant when using high numerical aperture objectives.
A binary nucleus mask was created from the DAPI channel. The image was smoothed by filling intensity holes in the image, applying Gaussian smoothing, and then filling intensity holes again. The smoothed DAPI image was transformed to a gradient image to highlight nuclear/chromosomal edges. Watershed segmentation was then performed on the gradient image to break it into watershed basins. In general, each nucleus consisted of numerous watershed basins, with boundaries of a subset of the basins corresponding to the true boundaries of the nuclei. Intensity peaks were then identified in the smoothed DAPI image and used as seed regions for the formation of nuclei. All watershed regions overlapping with a seed region became a nuclear seed. Watershed regions were merged with adjacent seed regions if their median DAPI pixel intensity was within 50% of that of the adjacent seed. The merging process was reiterated until no new watershed regions were added to seed regions. Resulting seed regions defined a binary nuclear mask. This produced nuclear object boundaries that overlaid steep transitions from bright to dim DAPI signals, and that also adjusted to the brightness of each individual nuclear/chromosomal object, whether interphase or mitotic.
Closely adjacent nuclei that merge into a single nuclear object with this binary mask are a common occurrence, especially in samples with high cell density. To separate touching nuclei, we applied watershed segmentation to the inverse of the distance transform of the binary mask. The peaks of the distance transform were used as water sources for the watershed segmentation. This frequently resulted in over-segmentation of nuclei. To recombine over-segmented nuclei, the peak markers of the distance transform image within each watershed segmentation region were expanded to include all pixels with an intensity difference from the peak less than an empirically determined threshold (e.g., 3). If this expanded peak marker encountered the boundary between its watershed region and an adjacent watershed region, then one of two paths would be followed. First, if the peak marker from the adjacent region also expanded to the same boundary, then the two peak markers were merged into a single peak marker. Alternatively, if the first peak marker was the only one that expanded to the boundary, then it was eliminated from the peak marker image. The new expanded peak markers image was then used as the water source for another watershed segmentation, and the process was repeated iteratively until no additional peaks could be merged or eliminated. This produced a labeled nucleus mask that correctly segmented most cells (Appendix Fig. A2b). The only cells that proved problematic were nonlinear clusters, cells exhibiting a high degree of overlap, and narrow metaphase, anaphase, or cytokinetic nuclei with end-on abutments to other cells.
A cellular mask was created by dilating the nuclear mask using an empirically determined structuring element with a 20-pixel radius (Appendix Fig. A2c). Cytoplasm masks were produced by the subtraction of the nucleus masks from the cellular masks. The custom segmentation workflow was implemented using imaging components within Pipeline Pilot 7.5.2 (Accelrys, Inc.).
Feature Extraction
Intensity and morphology-based features were extracted from the DAPI and MPM-2 channels of each segmented cell using the Image Region Shape Statistics, Advanced Image Region Shape Statistics, Image Intensity Statistics, and Advanced Image Intensity Statistics components in the Advanced imaging Collection in Pipeline Pilot 7.5.2 (Accelrys, Inc.).
Manual Cell Cycle Classification
Segmented cells were scored by an expert both to serve as a training set for automated classification and for validation of the automated classifier and rules-based classifiers. About 1,000 to 2,000 nuclear objects were manually classified from each nondrug-treated sample, and from 200 to 1,000 objects for each drug-treated sample, into the following classes: interphase, prophase, prometaphase, metaphase, anaphase, cytokinesis, telophase, multi-nuclear cluster—all interphase, multi-nuclear cluster—mixed (i.e., contained at least one mitotic cell), apoptotic/necrotic, fragment, and noncell. All acquired z-planes were used to achieve best possible manual classification, whereas only the optimally focused planes of each channel were employed for automated classification. Whereas only the DAPI and MPM-2 channels were used for automated classification, the fluorescence channels used for manual classification varied by experiment. In the double thymidine blocked and released experiment, DAPI and Aurora-B channels were used, blind to the MPM-2 channel. In the single thymidine blocked and released experiment, DAPI, tubulin, and CellMask channels were used, blind to the MPM-2 channel. In the unsynchronized experiment, DAPI and MPM-2 were used for manual classification.
Automated Classification
One-against-one support vector machine (SVM) classification was performed using a radial-basis-function kernel.
10
The kernel parameter, g, and slack penalty, C, were tuned using a grid search over the range of 0.5–128 and 1–1,024, respectively (in increments increasing by a factor of four) with fivefold cross-validation. To account for unbalanced class sizes, sampling without replacement was used on the entire training dataset to create 30 sub-training sets, each containing the same number (one less than the size of the class with fewest samples) of cell samples per class. A classifier was trained on each of these sub-training sets to create an ensemble of classifiers. Each classifier in the ensemble produces a probability of a sample belonging to a class; therefore, for each testing sample, a class label was defined as the class with the maximum summed probability across the ensemble. Before classifier training, each sub-training set data was standardized by feature and normalized by sample, linearly dependent features were removed, and then stepwise discriminant analysis was performed to select for informative features.
11
This was performed in Python 2.6.5, with SVM implementation from the LIBSVM toolbox (
Results
Selection of a Mitosis Marker Suitable for Classification
To distinguish between interphase and the mitotic sub-phases prophase, prometaphase, metaphase, anaphase, cytokinesis, and telophase (Fig. 1), we chose MPM-2 phospho-epitope as a cell cycle protein marker. MPM-2 is a well-described mitotic marker antibody used in cell cycle studies that labels phospho-epitopes present on numerous hyperphosphorylated mitotic proteins. 12 This redundancy of reactive proteins means that it is unlikely that labeling of mitotic cells could be lost due to experimental depletion of a single epitope-carrying protein. MPM-2 intensely labels mitotic cells from a wide variety of species ranging from mosquitoes to humans, 12 indicating that the presence of the reactive epitope is an evolutionarily conserved characteristic of mitotic cells. Further, there is strong evidence that creation of MPM-2 reactive phosphoproteins is essential for entry into the mitotic state. 13 –18 Importantly, to our knowledge, MPM-2 has not been experimentally uncoupled from mitosis.
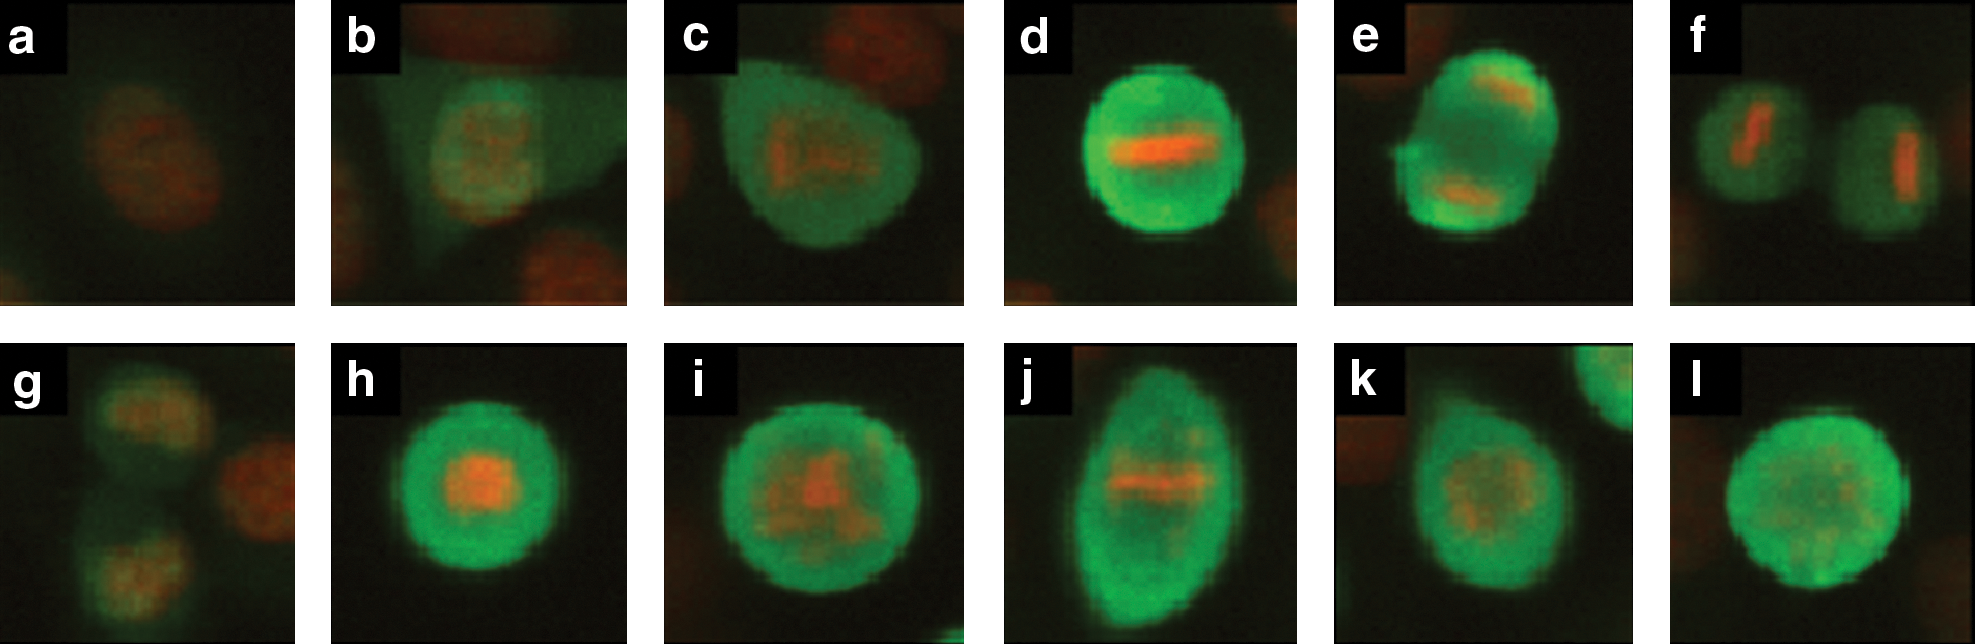
Example cell cycle patterns in HeLa cells. Each image contains DAPI (red) and MPM-2 (green) signal. Representative images are shown of interphase
Using MPM-2 in Anaphase and Cytokinesis Recognition
Anaphase is characterized by chromosomal division. Cytokinesis is the process of cellular division, and it begins during late anaphase and completes during telophase (Fig. 1e, f). DAPI staining alone is insufficient for recognizing cells undergoing cytokinesis, and it can variably segment anaphase cells as one or two distinct nuclear objects per cell, depending upon the extent of chromatid separation. However, because MPM-2 labeling is diffuse and cytoplasmic after nuclear envelope breakdown (NEBD), we were able to segment the MPM-2 image and thereby delineate cellular boundaries of post-NEBD mitotic cells (including prometaphase, metaphase, anaphase, and cytokinesis; see A rules-based classifier that distinguishes between mitotic stages section). This was done exactly as for nuclear segmentation from the DAPI image, except that post-NEBD mitotic nuclei were used as object seed regions. By this process, cells undergoing cytokinesis were automatically segmented into two distinct MPM-2 objects, each associated with a single internal nuclear object. In contrast, precytokinetic anaphase cells were segmented as a single MPM-2 object. All nuclear objects within a single MPM-2-segmented cell were considered to belong to the same cell. Thus, for the purposes of our classification, the birth of two daughter cells from a single parent cell is considered to take place at the onset of cytokinesis.
Defining a Set of Mitosis Features
Images were automatically processed into single cell regions using the DAPI channel. A trained expert manually labeled a subset of images from each experiment using the established cell cycle markers as a supplemental reference. Separately, a commonly used set of intensity features were extracted from the DAPI and MPM-2 channels and commonly used shape features were extracted from the nucleus masks. 2 This set includes the DAPI intensity per cell measurement, which has been shown to be suitable for 2N/4N analysis. 19 Additionally, we defined additional DAPI and MPM-2-derived features to distinguish between sub-mitotic phases: (a) the cytoplasm-to-nucleus MPM-2 intensity, (b) the misalignment score, the degree to which a cell has aligned its chromosomes at the spindle equator, and (c) the pairing score, a measure that relates the alignment between two plates in a cell and therefore is indicative of anaphase (see Appendix).
Datasets of Cell Populations Under Different Mitotic Indices
We collected three datasets using three approaches: untreated, single thymidine block and release, and double thymidine block and release. Each dataset consists of cells that were antibody labeled for MPM-2 and counterstained with DAPI. Additionally, mitotic markers Aurora-B and tubulin were antibody labeled in some cells for further reference. For each dataset we determined the mitotic index (MI), which is the percentage of cells in mitosis, through visual analysis of the Aurora-B and tubulin markers. Unsynchronized cells have an MI of 7% (low MI) and single thymidine block; release cells have an MI of 16% (medium MI) and double thymidine block; release populations have an MI of 36% (high MI). Using the total DAPI per cell measurement, we used 2N/4N analysis to further identify population shifts in the different datasets (Fig. 2).
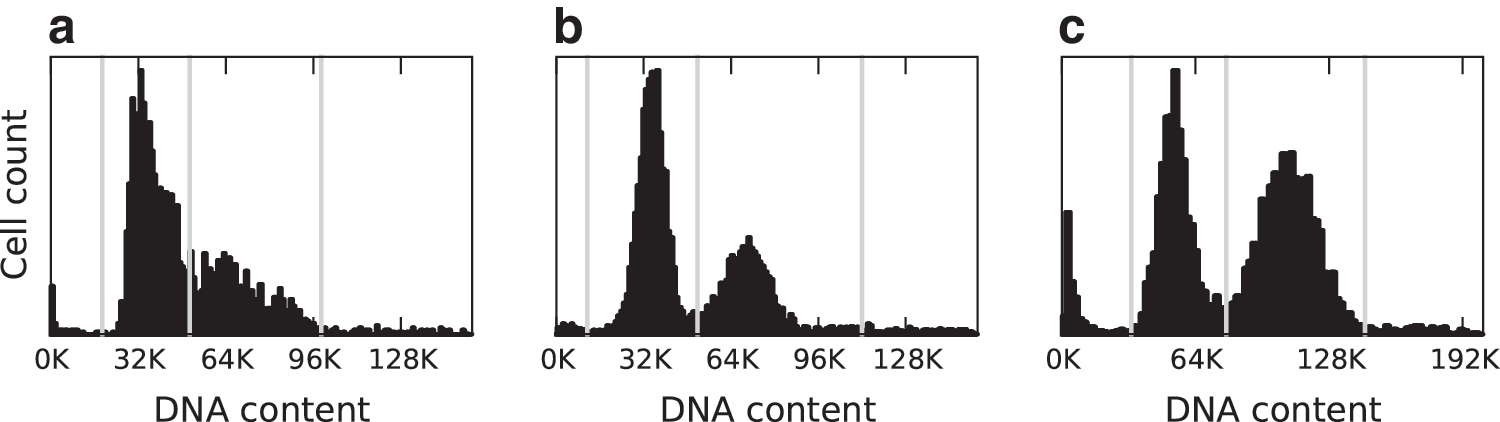
Separation of cells by DNA content.
A Rules-Based Classifier That Distinguishes Between Mitotic Stages
We defined a rules-based classifier (Fig. 3) using features that capture observable characteristics of MPM-2 immunolabeling and DAPI staining. The first rule determines whether cells are in interphase (Fig. 1a) or mitosis, and it is predicated on the observation that MPM-2 immunolabeling in interphase is low in both the nucleus and cytoplasm. 12 DNA content was used to define 2N (e.g., anaphase, cytokinesis, telophase, G1, and S) or 4N cells (e.g., S, G2, prophase, prometaphase, metaphase, and anaphase). For each individual 4N cell, we calculated the median nuclear MPM-2 channel pixel intensity. From these values, we visually determined a threshold that separated mitotic 4N cells above from interphase 4N cells below. Similarly, we calculated the median cytoplasmic MPM-2 channel pixel intensity from each individual 2N cell, and we used these values to set a threshold that separated mitotic 2N cells above from interphase 2N cells below (Appendix Fig. A3).
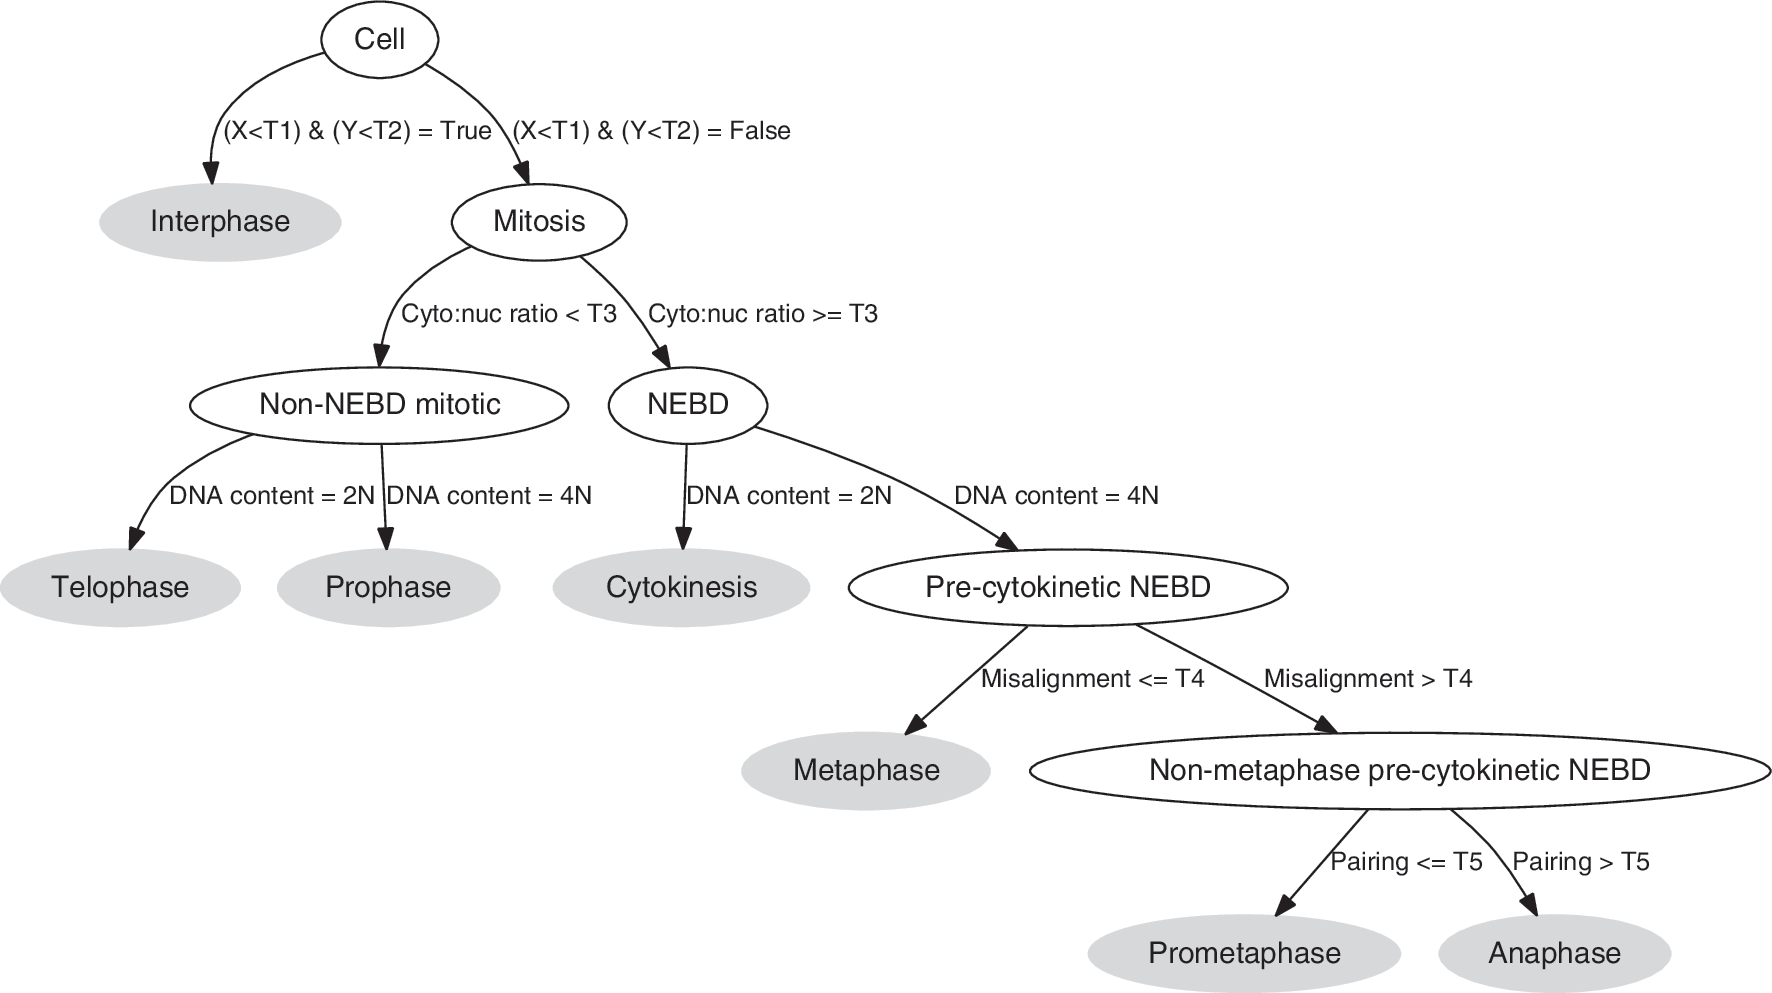
Decision tree for mitotic stage classification. Nodes (blank ovals) and leaves (filled ovals) represent intermediate and final decisions, respectively. T1–T5, thresholds; X, median MPM-2 pixel intensity in the nucleus; Y, median MPM-2 pixel intensity in the cytoplasm.
The second rule distinguishes cells with intact nuclei from those having undergone NEBD (Appendix Fig. A4). It has been observed that NEBD and cytoplasmic MPM-2 immunolabeling mark the prophase-to-prometaphase transition (Fig. 1c). 20 Moreover, we routinely observed that MPM-2 immunolabeling is recruited back into the nucleus during telophase before reactivity was lost, presumably due to potential translocation of phosphorylated MPM-2 antigens or the kinases that phosphorylate them. With this in mind, we defined an NEBD feature to distinguish prophase and telophase (late phase) from the other sub-mitotic stages. We used the ratio of cytoplasmic to nuclear MPM-2 intensity to capture this property, as cells expressing MPM-2 without a nuclear envelope have a higher proportion of signal in the cytoplasm. From visual analysis of cell population data (Appendix Fig. A4a), we found that a ratio of 1 separates post-NEBD from non-NEBD cells. As before, we manually adjusted this threshold to give better separation of prophase and prometaphase cells.
At the next decision level, we separated cells based on their DNA content. First, we applied the MPM-2 cytoplasmic segmentation to post-NEBD cells as described above (see Using MPM-2 in anaphase and cytokinesis recognition). Then, 2N/4N analysis was performed on all cells using the total DAPI intensity per cell (Fig. 2). 19 We used this to separate the non-NEBD cells into telophase (2N) and prophase (4N). For post-NEBD-positive cells, we identified 2N cells as being in cytokinesis. The thresholds to identify 2N and 4N were determined manually from the DAPI distributions (Fig. 2, Appendix Fig. A5).
The fourth rule utilizes the misalignment score to identify metaphase cells in the 4N post-NEBD population (Appendix Fig. A6). We then sorted cells based on this score, and manually chose the threshold that produced good separation between metaphase and the remaining stages. Cells that were at or below the threshold were determined to be metaphase.
The final decision rule distinguishes between anaphase and prometaphase using the pairing score (Appendix Fig. A7). As before, the threshold was manually chosen to separate the two phases.
Evaluation of Rules-Based Classifier
The classifier performed best at determining the interphase and metaphase classes (Fig. 4). Interphase sensitivity was at least 95% and precision was at least 80% across the three experiments. Metaphase sensitivity (TPR) and precision (PR) were at least 88% in all experiments. Sensitivity (also called recall) and precision are commonly used to assess classifier performance and are defined as

Performance of classifier in different cell cycle-disruptive drug treatments. Values are in percentages. Each box in the table is a separate plot of classification precision (PR) versus sensitivity (TPR) for the cell cycle class listed at the top of the corresponding column and the drug treatment listed at the left of the corresponding row. Solid symbols are rules-based classifier results, and empty symbols are SVM classifier results. Symbol shape indicates the experiment: circle, high MI; square, medium MI; triangle, low MI. Data are only shown for experiments in which there were at least five members of the corresponding manually identified ground truth class. The error bars represent 95% confidence intervals of the sensitivity/precision as determined by the Wilson Score, and the positions of the symbols themselves represent the centers of the intervals. SVM, support vector machine.
where x is the mitosis stage (or class); TP, or true positives, is the number of correct classifications within x; FP, or false positives, is the number of samples misclassified as x; and FN, or false negatives, is the number of samples incorrectly classified as x. Prometaphase classification was more variable from experiment to experiment; sensitivity ranged from 75% to 89% and precision from 60% to 84%. Anaphase sensitivity hovered around 50%, but precision was at least 84% in all experiments. Cytokinesis precision ranged from 63% to 73% and sensitivity ranged from 57% to 84%. Prophase and telophase classifications were lowest. While prophase recognition sensitivity was around 50%, precision ranged from 20% to 78%. Telophase classification maintained fairly constant precision from experiment to experiment, ranging from 50% to 67%, but ranged widely in sensitivity, with values from 3% to 56%.
Notably, most misclassifications were assigned to one of the two classes temporally adjacent to the true class, and most of these misclassifications were of cells in transition between classes that had near-threshold values. Such misclassifications were ascribed to the gradual change in patterns between some sub-mitotic phases. An exception to this rule was the low frequency confusion by the classifier of prometaphase and anaphase cells that failed the pairing score test. Another was the misclassification of clear-cut anaphase cells as cytokinesis due to the isolation of one of the segregating sister chromatid masses from the other, which often occurred due to imperfections in segmentation.
Comparison of Framework to SVM Classification
We compared our framework results to an SVM classifier (Fig. 4), which has been used in various cell cycle studies. 2 The classifier was trained on a set of stepwise discriminant analysis (SDA)-selected features extracted from the images (excluding the cytoplasm-to-nucleus, misalignment, and pairing measures). We evaluated this approach by cross validation, and found that it performed best on the double thymidine block dataset, followed by the single thymidine block and then unsynchronized sets (Appendix Table A1).
We then compared the effectiveness of the SVM approach to that of the rules-based classifier on the same datasets (Fig. 4, no drug). We found that SVM performed comparably to the rules-based method in the classification of interphase cells, prophase cells, cytokinetic cells, and telophase cells, whereas the rules-based method outperformed the SVM in the classification of prometaphase, metaphase, and anaphase cells. Interestingly, in these latter three classes we observed that quality of classification by the SVM was affected by the MI of the training set, whereas the rules-based method was not. The SVM classified prometaphase and metaphase cells almost as effectively as the rules-based method for the high MI experiment, but not for the medium and low MI experiments. We also observed a greater tendency for the SVM-based method to misclassify cells to classes that were not temporally adjacent to their true class.
Robustness to Drug Treatments
Treatment of cells with mitosis-disrupting drugs can produce unusual phenotypes that may not be properly classified. To evaluate the robustness of the rules-based classifier to different treatments, we tested the framework on cells treated with cell cycle disrupting drugs (Table 1), which block cells in prometaphase with unusual morphology (Fig. 1h–l). We found that the quality of interphase and prometaphase rules-based classifications were not decreased by treatment of cells with 2 μM ZM447439, an Aurora-B kinase inhibitor 21 or 100 ng/mL nocodazole, a microtubule depolymerizing agent. 22 In contrast, we found that the quality of prometaphase classification by the SVM classifier decreased after treatment of cells with ZM447439 and nocodazole.
Performance of Classification Approaches on Different Drug Treatments in a Double Thymidine Block and Release Experiment
Values are sensitivity/precision, and are given in percentages.
SVM, support vector machine.
Discussion
We have defined a rules-based classification approach with several favorable characteristics for integration into HCS approaches. First, it produces classification results that are comparable to machine learning-based methods in synchronized populations. Second, as with machine learning approaches, this framework is scalable to large experiments, as the image processing routines and decisions by a trained classifier are highly reproducible. Third, and most significant, the rules framework performs similarly across different types of experiments, including asynchronous populations of cells and drug-treated cells. Removing the need to synchronize cells can simplify a cell cycle experiment and make its incorporation into HCS feasible. The final important attribute of the rules-based classifier is that when it disagrees with the manual label, it routinely assigns a label that is temporally adjacent to the correct assignment. This property may be useful in efforts to re-label data for manual annotations that may not be sufficient.
Classifier confusion with the telophase class may have arisen because the MPM-2 distribution may not reliably characterize telophase cells. Thus, it may be advantageous to re-annotate cells that have 2N DNA content and high levels of MPM-2 within the nucleus simply as late mitosis, rather than as telophase.
The analysis presented also highlights the utility of MPM-2 as a robust mitotic marker, and we envision that the knowledge-derived features from MPM-2 can be integrated into future machine learning approaches to produce more meaningful cell cycle decisions. Coupled with additional biomarkers, this enables robust high content screens that produce richer, multifaceted readouts.
Footnotes
Acknowledgments
S.D.S., R.M.H., and B.R.B. were funded by the Huffington Foundation. J.Y.N. was supported by NIH K12DK083014 (PI, D.J. Lamb). A.T.S. was supported by the Medical Scientist Training Program (PI, J.R. Rosen). M.A.M. was supported by the ARRA Grand Opportunity award (1RC2ES018789-01) and John S. Dunn Foundation. Additional imaging resource support was provided by the John S. Dunn Gulf Coast Consortium for Chemical Genomics Screening Grant Program (PIs, P.J. Davis, University of Texas Health Science Center and M.A.M.), the Dan L. Duncan Cancer Center (P30 CA125123, PI, C.K. Osborne), the Center for Reproductive Biology (U54 HD007495, PI, B.W. O'Malley), and the Center for Digestive Diseases (P30 DK56338, PI, M.K. Estes). The authors thank T.-A.T. Nguyen and S.M. Hartig for critical review of the manuscript, I.P. Uray for performing high-throughput microscopy, D.R. Nash for expert analysis of cellular images, and T.J. Moran (Accelrys) and J.H. Price (Vala Sciences) for longstanding support in automated bioimaging techniques.
Disclosure Statement
No competing financial interests exist.
Abbreviations
Cross-Validation of Support Vector Machine Classification on Different Treatment Types
| Unsynchronized | ||||||||||||
|---|---|---|---|---|---|---|---|---|---|---|---|---|
| Classifier output | ||||||||||||
| True class | Ana | Cyto | Inter | Meta | Multi-nuc | Noncell | Prom | Pro | Telo | # | TPR | PR |
| Anaphase | 6 | 1 | 0 | 1 | 0 | 0 | 1 | 0 | 0 | 9 | 0.67 | 0.55 |
| Cytokinesis | 1 | 11 | 0 | 0 | 0 | 0 | 0 | 0 | 2 | 14 | 0.79 | 0.35 |
| Interphase | 0 | 3 | 649 | 0 | 103 | 86 | 0 | 8 | 25 | 874 | 0.74 | 0.97 |
| Metaphase | 3 | 1 | 0 | 9 | 0 | 0 | 16 | 2 | 0 | 31 | 0.29 | 0.60 |
| Multi-Nuclear | 0 | 0 | 10 | 0 | 23 | 1 | 0 | 1 | 0 | 35 | 0.66 | 0.18 |
| Noncell | 0 | 1 | 3 | 0 | 0 | 12 | 0 | 0 | 1 | 17 | 0.71 | 0.11 |
| Prometaphase | 1 | 0 | 0 | 4 | 0 | 0 | 7 | 0 | 0 | 12 | 0.58 | 0.29 |
| Prophase | 0 | 0 | 0 | 1 | 0 | 0 | 0 | 5 | 1 | 7 | 0.71 | 0.28 |
| Telophase | 0 | 14 | 5 | 0 | 0 | 3 | 0 | 2 | 12 | 36 | 0.33 | 0.29 |
| Single thymidine block and release | |||||||||||||
|---|---|---|---|---|---|---|---|---|---|---|---|---|---|
| Classifier output | |||||||||||||
| True class | Ana | Cyto | Frag | Inter | Meta | Multi-nuc | Noncell | Prom | Pro | Telo | # | TPR | PR |
| Anaphase | 6 | 1 | 0 | 0 | 3 | 0 | 0 | 5 | 0 | 0 | 15 | 0.40 | 0.21 |
| Cytokinesis | 2 | 41 | 0 | 0 | 1 | 0 | 0 | 1 | 3 | 6 | 54 | 0.76 | 0.69 |
| Fragment | 0 | 0 | 32 | 1 | 2 | 1 | 2 | 0 | 0 | 0 | 38 | 0.84 | 0.73 |
| Interphase | 0 | 1 | 10 | 1,163 | 0 | 111 | 99 | 0 | 7 | 112 | 1,503 | 0.77 | 0.98 |
| Metaphase | 7 | 4 | 0 | 0 | 26 | 0 | 0 | 6 | 0 | 0 | 43 | 0.60 | 0.63 |
| Multi-nuclear | 1 | 1 | 0 | 9 | 1 | 100 | 0 | 3 | 0 | 10 | 125 | 0.80 | 0.46 |
| Noncell | 0 | 0 | 2 | 2 | 0 | 0 | 8 | 0 | 1 | 0 | 13 | 0.62 | 0.07 |
| Prometaphase | 12 | 0 | 0 | 0 | 8 | 1 | 0 | 28 | 7 | 0 | 56 | 0.50 | 0.62 |
| Prophase | 1 | 0 | 0 | 0 | 0 | 0 | 0 | 1 | 15 | 4 | 21 | 0.71 | 0.36 |
| Telophase | 0 | 11 | 0 | 8 | 0 | 3 | 1 | 1 | 9 | 95 | 128 | 0.74 | 0.42 |
| Double thymidine block and release | |||||||||||||
|---|---|---|---|---|---|---|---|---|---|---|---|---|---|
| Classifier output | |||||||||||||
| True class | Ana | Apop | Cyto | Inter | Meta | Multi-nuc | Noncell | Prom | Pro | Telo | # | TPR | PR |
| Anaphase | 24 | 0 | 5 | 0 | 0 | 1 | 0 | 7 | 0 | 0 | 37 | 0.65 | 0.63 |
| Apoptotic/Necrotic | 1 | 29 | 0 | 0 | 0 | 1 | 1 | 0 | 0 | 0 | 32 | 0.91 | 0.91 |
| Cytokinesis | 5 | 0 | 50 | 0 | 0 | 2 | 0 | 0 | 0 | 13 | 70 | 0.71 | 0.77 |
| Interphase | 0 | 1 | 0 | 415 | 0 | 12 | 2 | 0 | 36 | 37 | 503 | 0.83 | 0.98 |
| Metaphase | 2 | 0 | 0 | 0 | 42 | 0 | 0 | 2 | 0 | 0 | 46 | 0.91 | 0.89 |
| Multi-nuclear | 1 | 1 | 0 | 2 | 0 | 54 | 0 | 0 | 3 | 0 | 61 | 0.89 | 0.74 |
| Noncell | 0 | 1 | 0 | 0 | 0 | 0 | 39 | 0 | 0 | 0 | 40 | 0.98 | 0.91 |
| Prometaphase | 5 | 0 | 0 | 0 | 5 | 0 | 1 | 71 | 2 | 0 | 84 | 0.85 | 0.82 |
| Prophase | 0 | 0 | 0 | 4 | 0 | 2 | 0 | 7 | 38 | 0 | 51 | 0.75 | 0.48 |
| Telophase | 0 | 0 | 10 | 4 | 0 | 1 | 0 | 0 | 1 | 53 | 69 | 0.77 | 0.51 |
Numbers in confusion matrices show the number of cells counted as a particular class by the classifier. # represents the total number of cells hand-scored as belonging to that class. Specificity (TPR) and precision (PR) are represented as ratios.