
Abstract
A solute aspirated into a prefilled tube of diluent undergoes a dilution effect known as dispersion. Traditionally the effects of dispersion have been considered a negative consequence of using liquid-filled fixed-tip liquid handlers. We present a novel device and technique that utilizes the effects of dispersion to the benefit of making dilutions. The device known as the Gradient Diluter extends the dilution range of practical serial dilutions to six orders of magnitude in final volumes as low as 10 μL. Presented are the device, dispersion methods, and validation tests using fluorescence detection of sulforhodamine and the high-performance liquid chromatography/ultraviolet detection of furosemide. In addition, a T-cell inhibition assay of a relevant downstream protein is used to demonstrate IC50 curves made with the Gradient Diluter compare favorably with those generated by hand.
Introduction
When large numbers of samples need to be diluted, a mix-and-split method based on whole plates can be achieved with 96- or 384-channel pipettors. In whole plate dilutions each sample plate represents a dilution point where the total number of plates is equal to the number of dilution points. Our initial testing of this method produced favorable results (data not presented).
With the introduction of nanoliter dispensers it is possible to make direct dilutions by dispensing solute directly into assay plates, eliminating mix-and-split steps and the dilution plate altogether. 2 Acoustic dispensers feature drop sizes as low as 1.0 nL and can prepare serial dilutions with excellent accuracy and precision. For example, the Echo 555® (Labcyte, Inc., Sunnyvale, CA) acoustic dispenser supports serial dilution applications and offers inherent savings over instruments based on disposable tips. 3 Acoustic-based dilutions are limited in range due to the time needed for high volume dispenses, and require source plates with multiple starting concentrations. 4
Gas bubble expansion (inkjet)–based dispensers are another class of instrument well-suited for making direct dilutions. The HP D300 digital dispenser (Tecan Group Ltd., Männedorf, Switzerland) is a purpose-built dilution instrument based on disposable eight-channel printer cartridges. 5 The cartridge features an array of nozzles where the smallest volume resolution is a single 13 pL drop. When compared to acoustic, the inkjet dispenser is faster and capable of dilution ranges of six orders of magnitude. Disadvantages for this device include loading of the cartridges and the high consumable cost. In general, direct dilution methods do not preserve dimethyl sulfoxide (DMSO) normalization across experiments, unless neat DMSO in varying volume is back-filled into each well. DMSO normalization is often a requirement for cell-based assays.
There have been several prototype examples of microfluidic networks performing serial dilutions. 6,7 In-chip dilutions have inherent advantages over those made in-plate since they have minimal sample requirements and are closed to atmosphere. Chips featuring flexible dilution factors have been reported and used to create logarithmic as well as step-wise dilution circuits. 8 Sugiura et al. have demonstrated on-chip dose-response cell assays with dilution ranges of six orders of magnitude. 9 Disadvantages for using serial dilution chips include pre- and postprocess sample handling, commercial availability, and cost.
When using liquid-filled, fixed-tip liquid handlers, a leading air gap is often aspirated ahead of the solute to prevent unwanted dilution effects from residual system liquid. 10,11 A solute aspirated with no air gap into a primed capillary tube will undergo a dilution effect known as the Taylor-Aris dispersion effect. 12,13 As solute flows into a diluent-filled tube, the flow rate along the interface of the tube is less than the flow rate along the inner axis of the tube. For laminar flow a parabolic-shaped velocity gradient develops where the velocity is greatest at the centerline and lowest at the tube wall interface. The dispersion effect acts to smear out the solute concentration distribution in the direction of flow (see Fig. 1). Taylor-Aris dispersion is the result of advection, dispersion, and diffusion. Here we take advantage of this phenomenon, which reproducibly dilutes the solute, and has reduced to practice a device capable of accurate dilutions out to 22 dilution points.
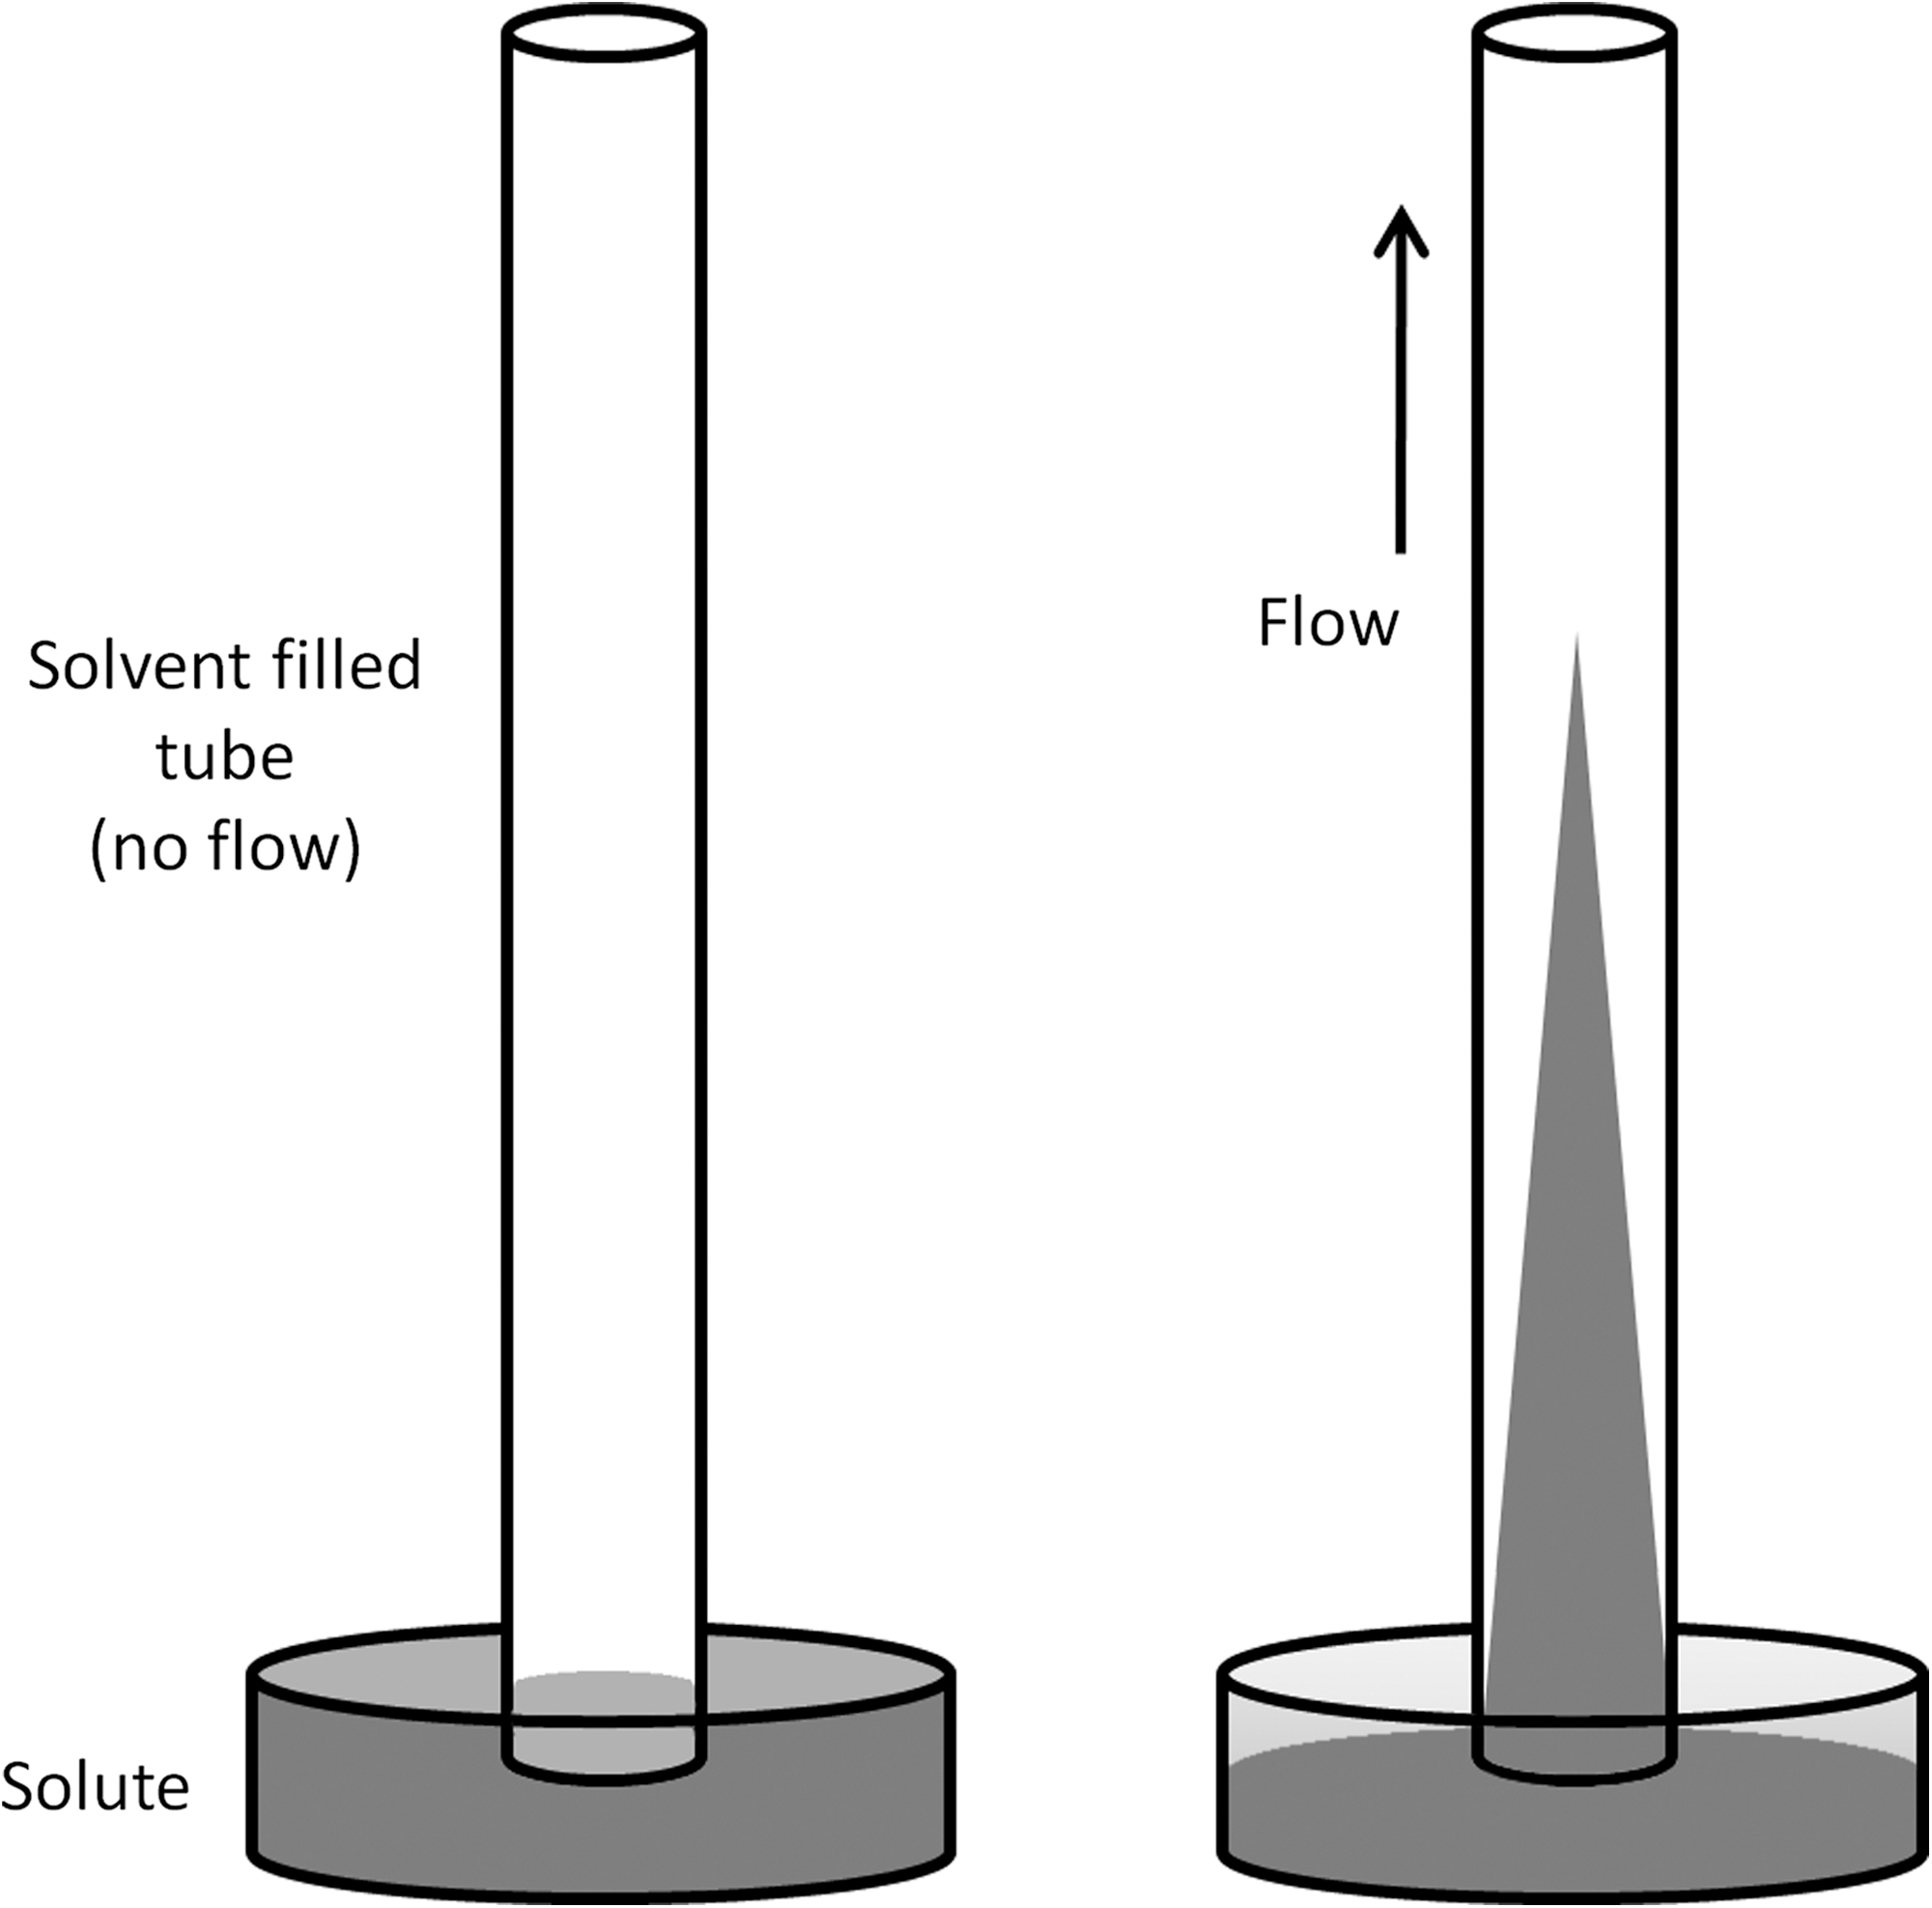
The result of the Taylor-Aris dispersion effect is to smear out the solute concentration toward the direction of flow.
Materials and Methods
Due to the hydroscopic nature of DMSO it is acknowledged that 100% DMSO may statistically contain some percentage of water. For all practical purposes we use dry DMSO (high-performance liquid chromatography [HPLC] grade) fresh from sealed bottles in all experiments. Sample water absorption was minimized through single-use tubes and the use of sealed plates.
HPLC Ultraviolet Quantization Test
A 20 mM solution of furosemide (Sigma Aldrich F4381) in 100% DMSO was serially diluted on the Gradient Diluter using a 100 μL final volume, 10-pt, 1:3 dilution protocol and heat sealed on a Plateloc (Agilent Technologies, Santa Clara, CA). Row E and row H of the dilution plate (20 wells) were analyzed in triplicate using the Waters ACQUITY UHPLC® (Waters Corp., Milford, MA). All separations were performed using a 2.1×50 mm BEH300 C18 1.7 μm reverse phase column at 35°C using a 2 μL sample loop. A 5%–90% linear gradient of acetonitrile was achieved in 3.8 min, with a flow rate of 0.4 mL/min. Detection was made with a Waters PDA (photo diode array) at 254 nm.
A standard dilution of 20 mM furosemide was prepared by hand in 4 mL glass vials using a 2 mL final volume, 10-pt, 1:3 dilution template. A mix-and-split method was used, mixing between each transfer step for 20 s on a Genie 2 vortex mixer (Scientific Industries, Inc., Bohemia, NY). From each dilution point 150 μL was transferred into HPLC vials (Waters, 186000384C) and analyzed using the same UHPLC/ultraviolet (UV) method as the dilution plate.
Dye Validation Tests
A 0.2 mM solution of sulforhodamine (S101) (Sigma Aldrich S7635) dye was prepared in 100% DMSO. From S101 stock two serial dilutions were made as standards in 4 mL glass vials; one was a 2 mL final volume, 10-pt, 1:3 dilution, and the second was a 1 mL final volume, 22-pt, 1:2 dilution. Again, dilutions were prepared by hand with a mix-and-split method. Between each transfer step the vial is mixed for 20 s on a vortexer. From the 1:3 dilution 100 μL was transferred from each dilution point into the corresponding column of a 96-well microplate (Costar 3657) forming a single row. From the 1:2 dilution 10 μL was transferred from each dilution point into the corresponding column of a 384-well microplate (Greiner 784201) forming a single row.
From S101 stock four dilution plates (Costar 3657) were serially diluted in 100% DMSO on the Gradient Diluter with a 100 μL final volume, 10-pt, 1:3 dilution protocol. The plates were then mixed by 10 aspirate-dispense cycles with a Beckman (Brea, CA) Multimek™ 96-channel pipette and read on a Tecan Safire2® plate reader using two different gain settings (see Table 1 for reader settings).
Summary of Tecan Safire 2 Reader Settings
Each plate is read at two different gain settings (A, B).
In another test, four S101 384-well dilution plates (Greiner 784201) are serially diluted each day on the Gradient Diluter for 5 consecutive days using a 10 μL final volume, 22-pt, 1:2 dilution protocol. Each day the prepared plates are mixed with a Beckman Multimek™ 384-channel pipette, spun for 30 s at 700 rpm in a Beckman GS-6KR centrifuge, and read with the Safire 2 plate reader using two different gain settings.
Cell Assay Test
A cell-based dose-response test was performed for a set of reference compounds (small molecules known to inhibit T-cells). An intracellular phosphorylation assay is used to measure relative STAT (signal transducer and activator transcription) proteins. Reference compounds were serially diluted in 100% DMSO by hand using a mix-and-split method in a microplate (Greiner 781280). The 20 μL final volume, 22-pt, 1:2 dilution template was used. In another microplate (Greiner 781280), the reference compounds were serially diluted on the Gradient Diluter using the same 1:2 dilution template. Two intermediate source plates (Labcyte LP-0200) were made by transferring 8 μL from each dilution plate with the Multimek 384-channel pipetter. From each intermediate source plate the Echo 555 is used to create three 200 nL assay plates (Costar 3617). Primary human T-cells previously stimulated for 5 days with phytohaemagglutinin were plated at a density of 2,000 cells/μL in the six assay plates containing compound. The assay plates underwent the BD Phosflow™ assay protocol and were analyzed on an LSR II flow cytometer (BD Biosciences, San Jose, CA). Table 2 provides the basic steps used to perform the assay. For specific assay details see the BD Phosflow™ T Cell activation kit instruction manual. 14 Percent positive was calculated as the % of cells that had fluorescence intensity >95% of the negative control wells. Dose-response curves generated from each plate are used to compare the two serial dilution methods.
Summary Protocol Table for Phosflow™ Assay
Step Notes
6. Spin, aspirate; ∼20 μL left in well; 4 min @1,150.
10. Spin, aspirate, wash; 80 μL 1% fetal bovine serum; 4 min @1,150.
14. Spin aspirate; 4 min @1,150.
Results and Discussion
Dispersion effects can be favorably applied to fixed-tipped liquid handlers, extending the lower volume range of an instrument. For example, consider a solute that is aspirated into a prefilled channel followed by partially dispensing a large part of it to waste. Here, dispensing the tail end of the parabolic concentration gradient would facilitate a large dilution between source and destination without the use of micro- or nanodispensing or multiple dilution steps.
The dispersion tube by itself is not adequate to produce useful serial dilutions for a given dilution factor. However, by adding diluent into the well separately, the ratio between solute and diluent for a given volume can be precisely controlled. Referring to Figure 1, each dispense from the solute tube acts to aliquot a slice of the parabolic concentration profile into the well. By varying the ratio dispensed between the diluent and solute tubes, various dilution templates (2:1, 3:1, and 5:1) have been empirically developed for a given final volume. We have found the dispersion effect to be reproducible over a wide range of small molecules dissolved in 100% DMSO (data not shown).
The Gradient Diluter Device
The device described herein is a newly designed serial dilution device called the Gradient Diluter. The device is capable of running both dispersion and air-gap dilution protocols. The device features separate solute and dilution channels plumbed to a common tip. In the case of the solute channels, the solute is prediluted at the aspiration step by dispersion. Aliquots from both the solute and diluent channels are added separately to the wells. The channels originate at separate eight-channel syringe pumps, one for the solute channels and one for the diluent channels. The solute and diluent channels each use 100% DMSO as system liquid. The DMSO reservoir is a replaceable 4 L reagent bottle that is sealed to atmosphere except for the syringe pump inlet tubes that pass snugly through the cap.
The coaxial dispense head as shown in Figure 2 features eight-diluent channels (shown in dark gray) and eight-solute channels (shown in white). The diluent channels continue through and exit the coaxial dispense head as thin-walled 14 ga. SS pipes (shown in black). The solute tubes pass continuous through the coaxial dilution tube and extend 5 mm below the diluent channels. The coaxial configuration of the dispense head is designed to allow dispensed diluent to flow concentrically around the solute channels. This offers several inherent advantages. Small volumes dispensed by the solute tips are effectively washed into the well by the diluent dispense. Dispensing diluent around the solute tips acts to minimize carryover between wells and between washes.
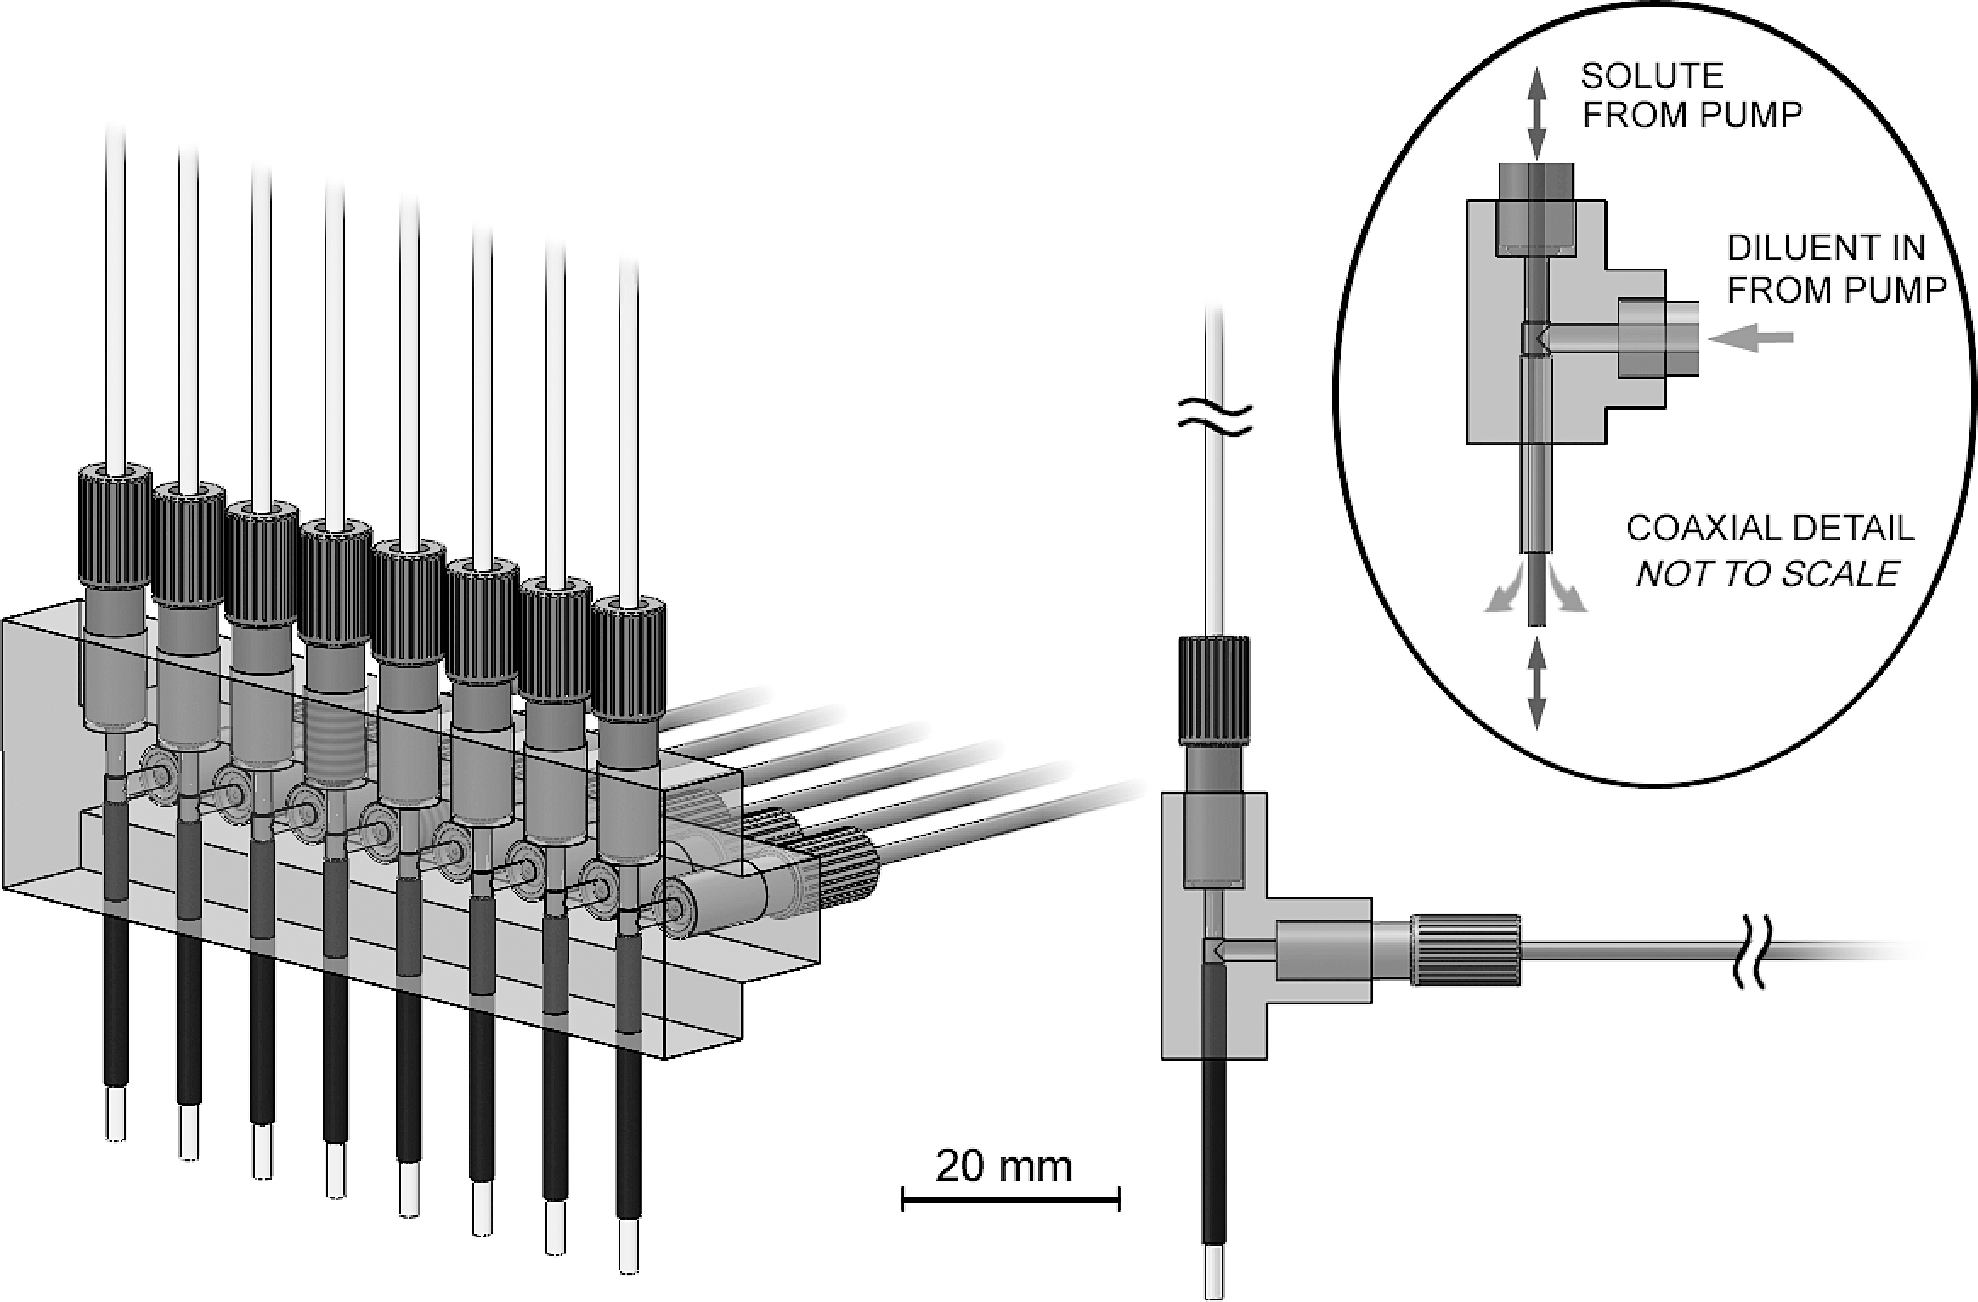
The coaxial dispense head features eight solute tubes and eight diluent tubes. The diluent tubes originate at the diluent syringe pump and terminate as 14 ga. SS tubes (shown in dark gray) press-fit into the dispense head. The solute tubes (white) originate at the solute syringe pump and pass continuous through the coaxial diluent tubes.
Two eight-channel 500 μL syringe pumps (Tecan XL3008) supply the coaxial dispense head. One syringe pump is dedicated to the eight-solute channels and the other syringe pump is dedicated to the eight-diluent channels. A meter-long length of tubing connects the coaxial dispense head to the syringe pumps. This allows volumes up to 50 μL to be aspirated before contact with the pump valve. The solute channels are made from PEEK tubing 1/16′′ O.D.×0.02′′ I.D.×1 m. The diluent channels are made from PFA tubing 1/16′′ O.D.×0.04′′ I.D×1 m (IDEX Health & Science LLC, Oak Harbor, WA).
Referring to Figure 3, microtiter plates to be serialized arrive preconfigured with concentrated compounds in the first column. A stacker PlateStak™ (Perkin Elmer, Shelton, CT) retrieves the plate and positions it onto the deck of a TT 3-axis gantry robot (IA-TT-C3-I-4040-10B-NPN-ET; IAI, Inc., Torrance, CA). The 3-axis gantry positions the dispense head to serialize the plate by column or access the wash station. The active wash station supplies 100% DMSO from a Tecan XE1000 5 mL syringe pump. The wash station assembly, coaxial dispense head, and associated mounting brackets were internally designed and custom made.
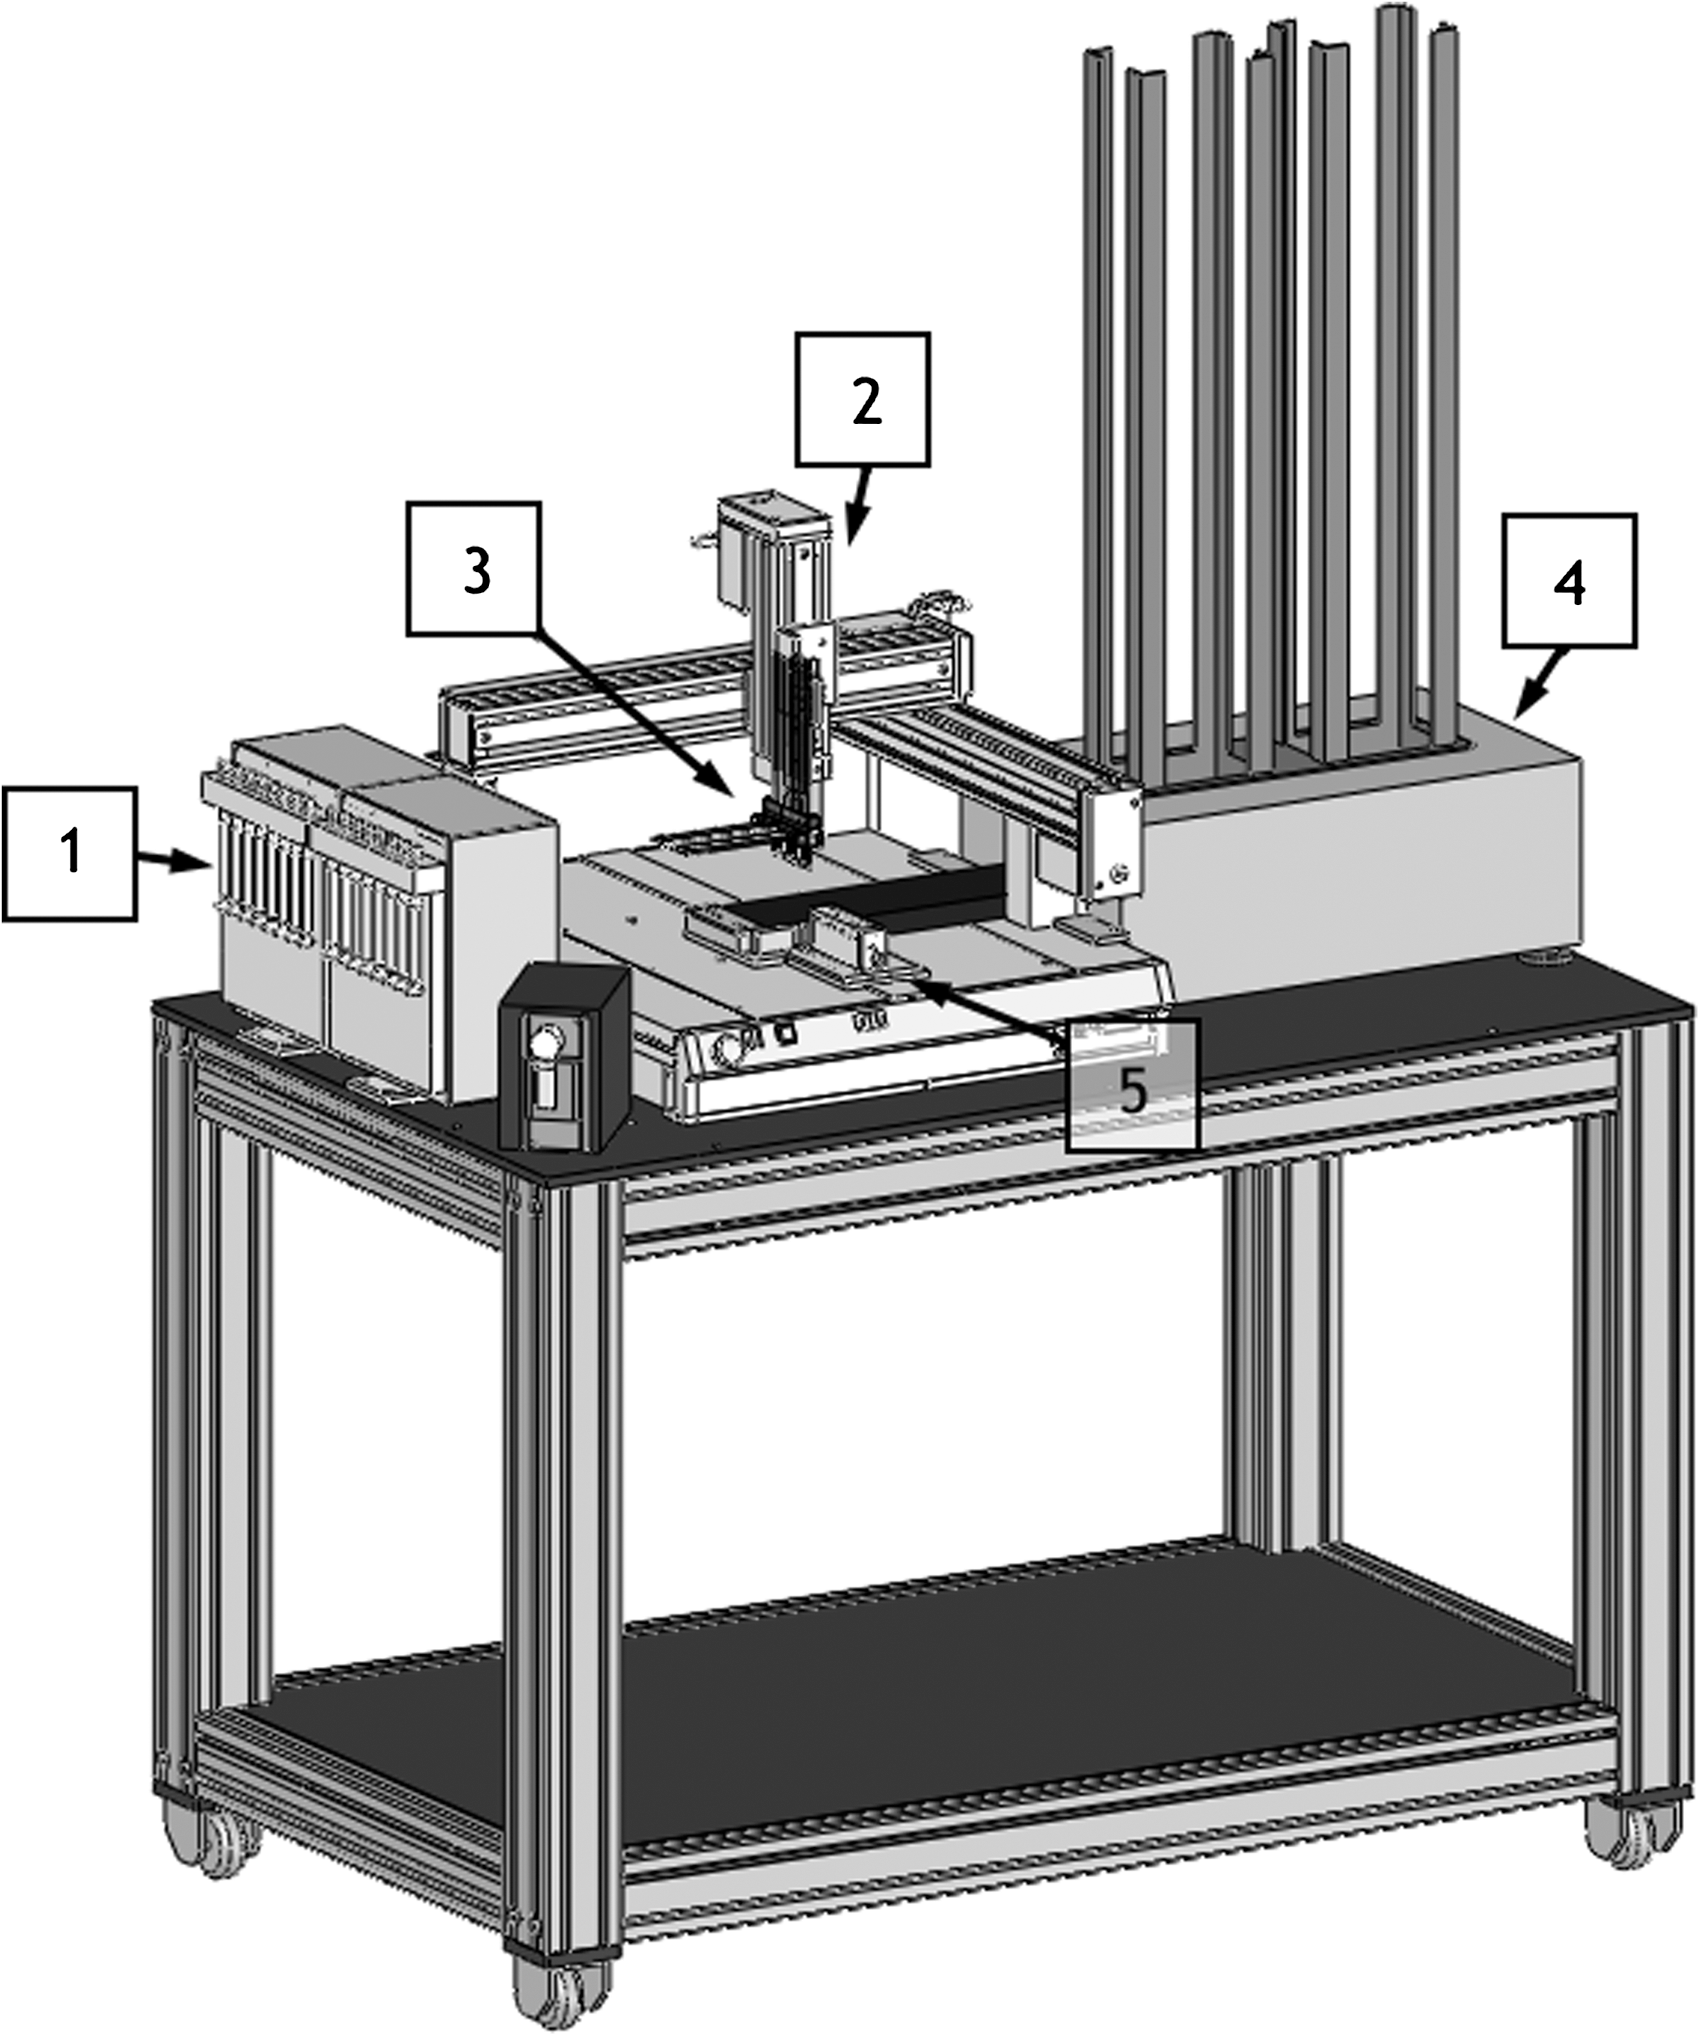
The Gradient Diluter features separate: 1, syringe pumps for solute and diluent channels; 2, three-axis gantry robot; 3, a coaxial manifold; 4, a plate stacker; 5, an active wash station.
We utilize an internally developed .NET application named comPilot to control the Gradient Diluter. ComPilot is effectively a protocol player that allows validated XML serial dilution protocols to be loaded, run, paused, or stopped (see Fig. 4). The player executes high-level commands line by line, completing each command before starting the next line. The application features a dedicated high-level command set that coordinates core functions like mixing (see Table 3) from the individual system devices. The comPilot software parses user-level XML commands to device-level commands appropriate for the devices.
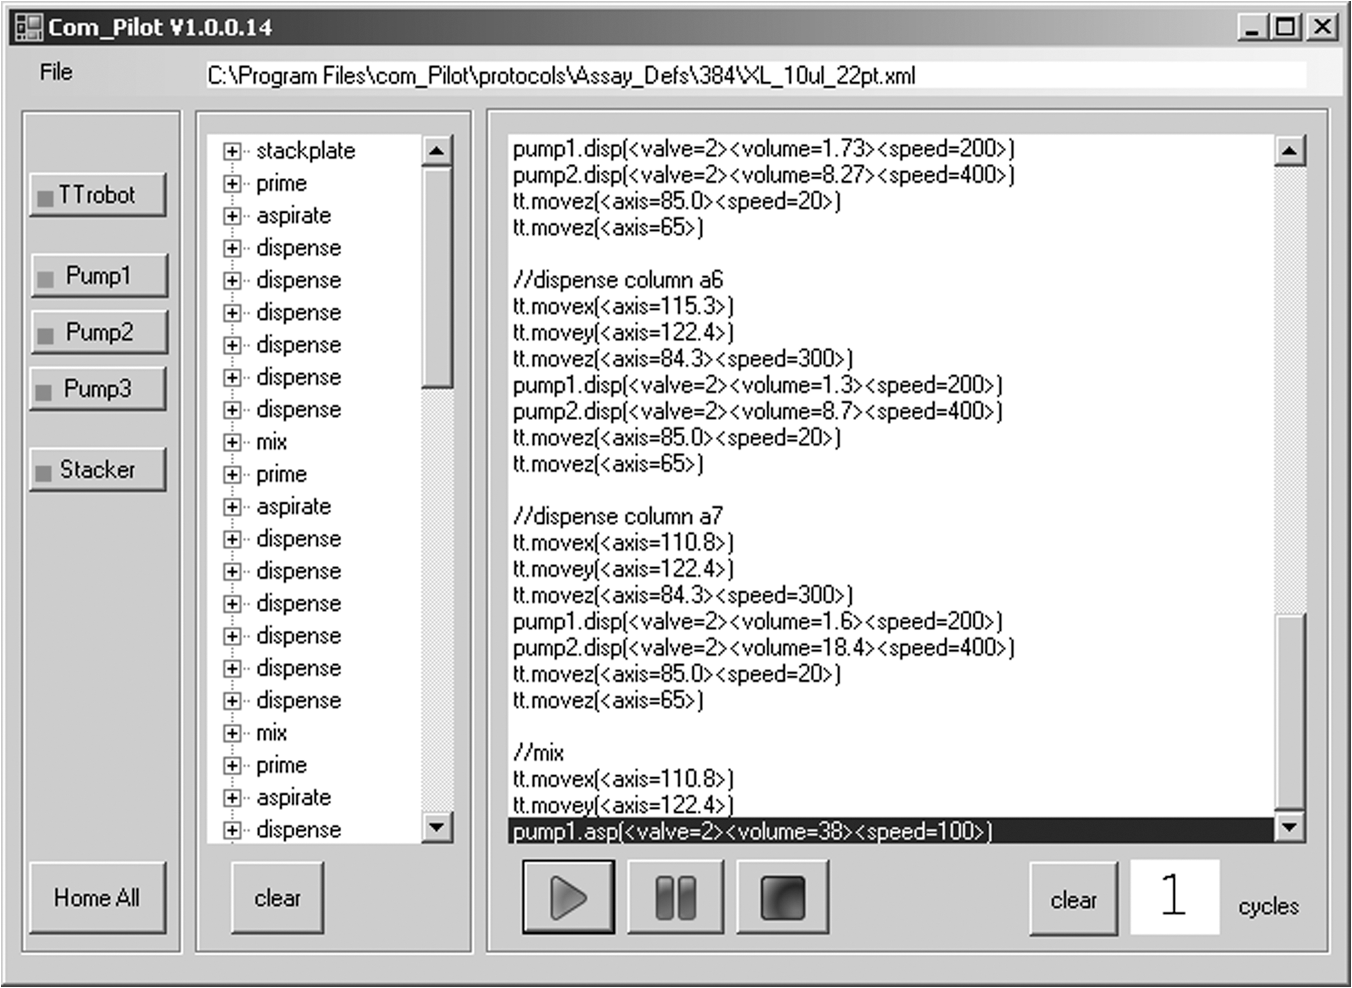
Screen shot of comPilot main application. High-level commands with parameters are loaded from the XML protocol as a tree view. The comPilot software parses user-level XML commands to device-level commands appropriate for the devices.
High-Level Commands Utilized by the Gradient Diluter
Experiment Development and Results
A standard curve was generated from the furosemide standards data. Due to the large serial dilution range the linear regression curve model was not accurate at the lower and higher concentration ranges. Instead, the furosemide Gradient Diluter data were directly compared with furosemide standards to determine percent error for every point of the serial dilution. Figure 5 tabulates the furosemide results as percent error by column for the Gradient Diluter for the 10-pt, 1:3, 100 μL protocol. Except for the last point the Gradient Diluter closely matches the standards.
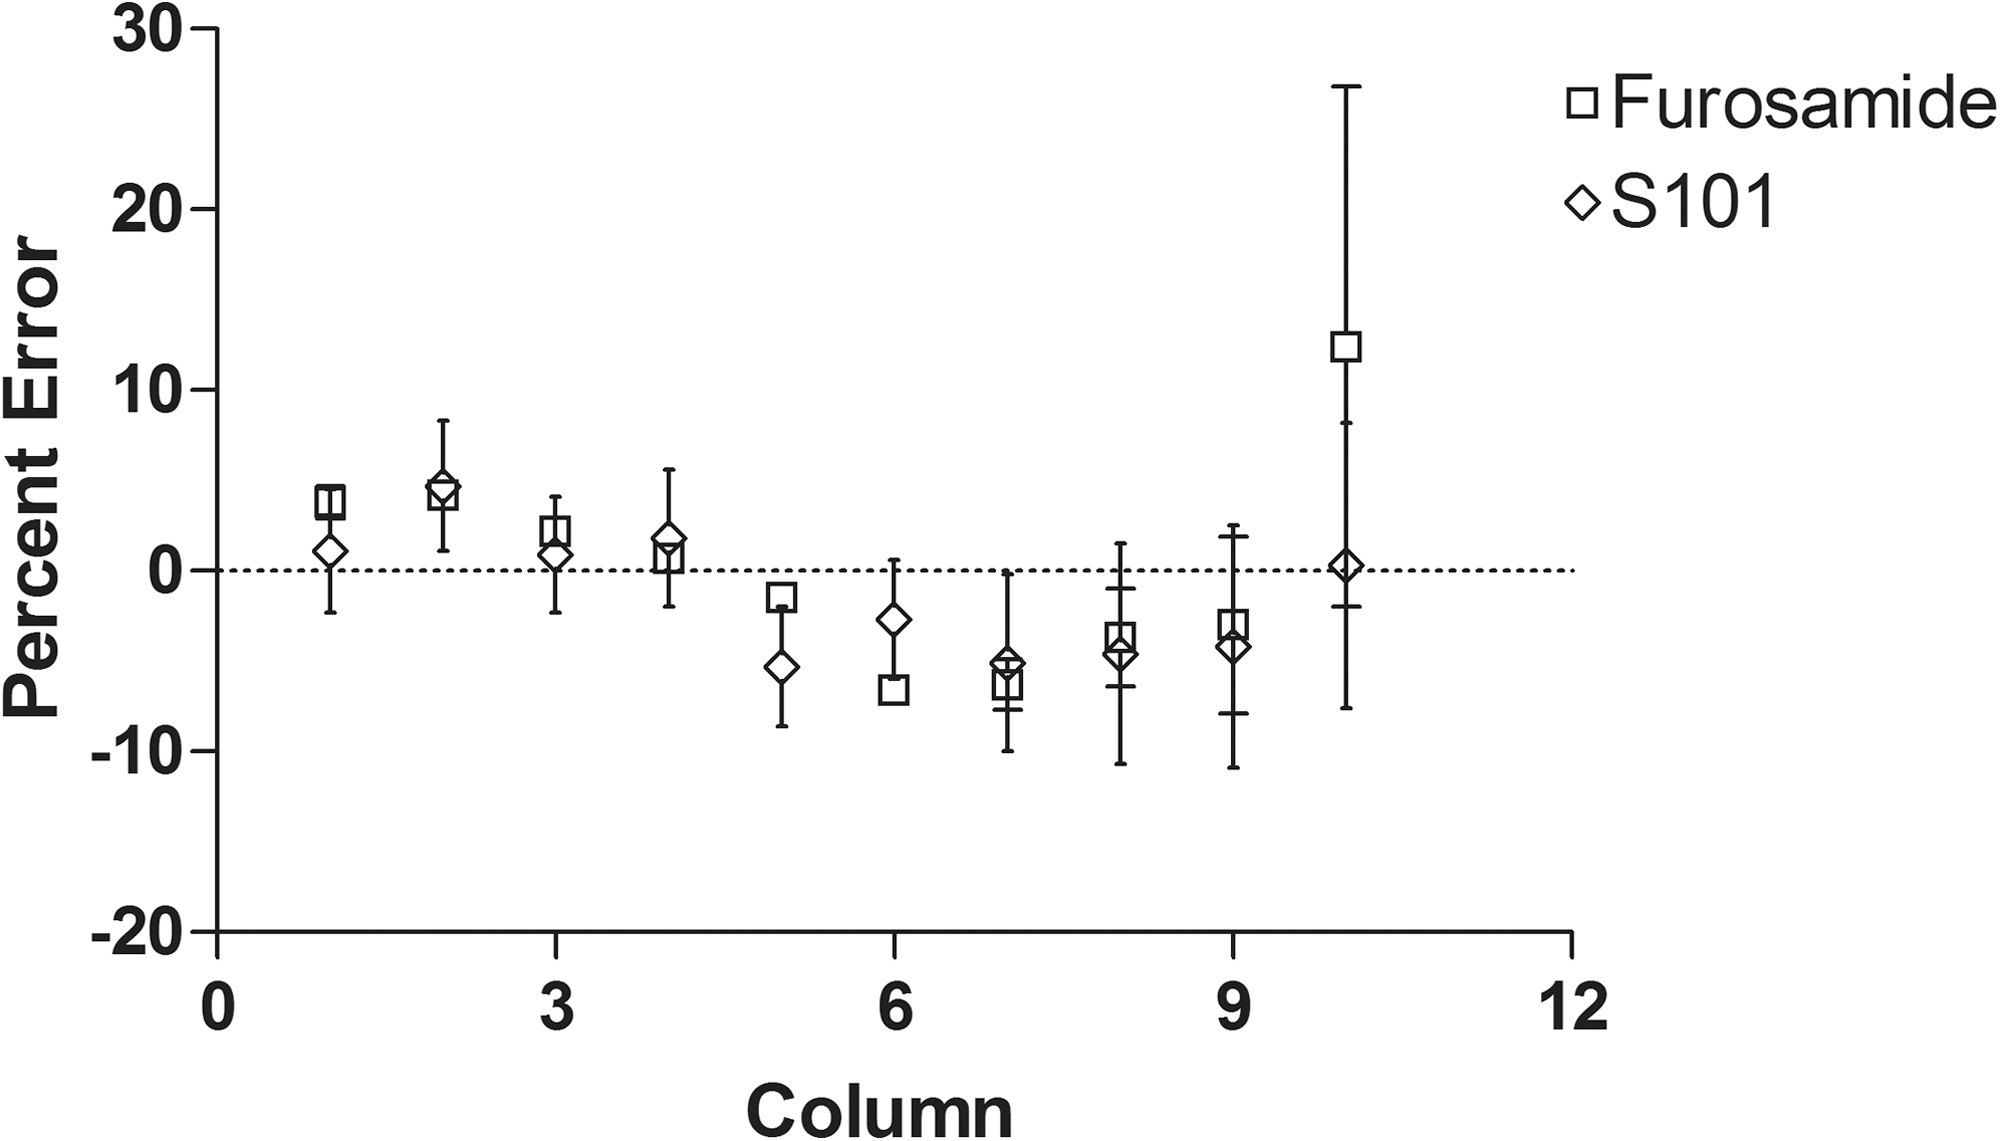
Percent error independently determined from furosemide and S101 methods performing the 10-pt, 1:3, 100 μL final volume dilution protocol. Each furosemide data point represents the column-wise mean±SD for n=6 wells. The S101 data points represent the column-wise mean±SD of three test plates (n=24). S101, sulforhodamine; SD, standard deviation.
The S101 method used to quantify serial dilution performance has been previously reported. 15 In this study, the column-wise mean from four plates was compared directly with S101 standards to determine percent error. Referring to Figure 5 the S101 results are plotted as percent error by column-wise mean. The S101 results show close agreement between the Gradient Diluter and the standards for the 10-pt, 1:3, 100 μL protocol. In addition, Figure 5 plots percent error for both the UV and S101 results. Results from the two independent methods show similar trends that appear to be unique characteristics of the protocol.
The S101 methods were then used to evaluate the Gradient Diluter performing the 22-pt, 1:2, 10 μL final volume protocol. Each day, four plates are serialized by the Gradient Diluter and analyzed for a total of 5 days. For each plate the column-wise mean was determined and compared against the corresponding standard to determine percent error. Figure 6 tabulates the percent error by column-wise mean for each of the test days. The accuracy of the device is within close agreement with the test standards. Figure 7 shows the coefficient of variance by column-wise mean for each of the test days. The results for the S101 tests conclude the device performs repeatedly with an acceptable level of precision.

Percent error for each test day performing the 22-pt, 1:2, 10 μL final volume dilution protocol with the S101. Each point represents the column-wise mean from four test plates (n=64).

CV for each test day performing the 22-pt, 1:2, 10 μL final volume dilution protocol with the S101. Each point represents the column-wise mean from four test plates (n=64). CV, coefficient of variance.
The cell assay results were used to produce a series of dose-response curves. All dose-response curves were fit with a log inhibitor, and a four-parameter, variable slope response using Prism 5.04 (GraphPad Software, Inc., La Jolla, CA). Figure 8 is a composite image of four dose-response curves generated from known and active compounds tested in the cell assay. Each of the dose-response plots feature two curves: one generated from serially diluting the compound by hand and the other curve resulting from the compound being serially diluted with the gradient diluter. The dose-response curves generated from serial dilutions prepared by the Gradient Diluter overlay curves generated by hand serial dilutions within±0.5 log (considered an acceptable range for biological inhibitors).

Composite results for cell assay dose-response curves generated by hand versus the Gradient Diluter performing the 22-pt, 1:2, 20 μL final volume dilution protocol. Percent positive is defined as the percent of cells above the 95% negative control. The dose-response curves were fit using a log (inhibitor), and a four-parameter, variable slope response. Each data point represents the column-wise mean±SD for one plate (n=16) sampled in triplicate.
A number of dilution protocols have been developed for the gradient diluter; these include 1:2, 1:3, and 1:5 dilution ratios for a variety of final volumes. Once a compatible test method for measuring S101 dye in DMSO was developed, the dispersion protocols were empirically developed for a given final volume. Once developed, the protocols are fixed for production and used on identical devices across several sites. Typically we do not create protocols for unique devices or conditions. In practice, the highest quality protocols are a hybrid between direct deposit and mix-and-split methods. The hybrid method periodically re-establishes the Taylor-Aris dispersion to produce the highest quality results.
For example when performing the 10 μL final volume, 22-pt, 1:2 dilution, 10 μL of solute is aspirated from column one (wells A, C, E, G, I, K, M, and O). The next six columns are made by direct deposit where a volume of solute is aliquoted followed by a coaxially added volume of diluent. For each well the ratio of solute and diluent volumes added equals the final volume of 10 μL. At the seventh column the remaining volume of solute along with additional diluent is dispensed to generate wells with twice the final volume (20 μL). The wells are then mixed by the solute channels with five aspirate-dispense cycles, using a leading air gap. The dispense tips are washed and primed before 10 μL of solute is re-loaded (aspirated) into the solute channels from column seven. The next six wells are made again by direct deposit. At column 13 another mix-and-split step is performed followed by direct deposit for the remaining columns. Since the device is based on an eight-channel dispense head, the entire series is repeated for the remaining wells in rows (B, D, F, H, J, L, N, and P). The dispense tips are internally washed by flushing diluent through them for several cycles and externally cleaned in the active wash station. The wash process reduces carryover to less than 1:1,000,000 of the starting concentration.
Though this article has focused on the use of dispersion methods to generate serial dilutions in 100% DMSO, it should be noted that we have obtained suitable results using air-gap protocols that isolate the system liquid from the aspirated solute. We have only limited experience using aqueous buffers as the diluent, since each type of diluent has required empirical development.
We feel that the instrument has been developed to a point where it could potentially benefit the community. We have partnered with Bionex, Inc. (Sunnyvale, CA) in developing a commercial version of this instrument.
Conclusions
We have presented several techniques for creating serial dilutions and a novel device and methods based on the principles of dispersion. The effects of dispersion are applied favorably to predilute the solute concentration in the solute channels. This phenomena extends the dispense range of the syringe pumps for a given concentration as picoliter quantities of solute can be dispersed into microliter volumes of diluent. Independent volume control over the solute and diluent channels provides a means to control the dilution ratio for a given final volume. The diluent and solute channels are coaxially joined at the dispense tips. In this configuration diluent is dispensed on the outside of the solute channels reducing carryover and washing the solute dispense into the well.
The large concentration range of serial dilutions is beyond the linear range of most analytical methods. For this reason, plates prepared with the Gradient Diluter were directly compared against calibration standards that feature every point of the dilution under test. We have evaluated the instrument with three methods: furosemide analyzed by UHPLC/UV detection, S101 dye as read with the Safire 2 plate reader, and a biological assay. In each validation case the device is compared directly with serial dilution standards that were generated by hand. Our testing concludes that the Gradient Diluter effectively achieves serial dilutions to six orders of magnitude in final volumes as low as 10 μL.
Footnotes
Acknowledgments
The authors would like to thank Ian Campuzano and Klaus Michelson for their contributions with UHPLC/UV testing, Mark Sandberg and Sonia Escobar for their contributions with cell assay testing, and Peter Grandsard and David Powers for their critical reading of this manuscript and advice throughout the project.
Disclosure Statement
No competing financial interests exist.