
Abstract
CaV2.2 (N-type) calcium channels are key regulators of neurotransmission. Evidence from knockout animals and localization studies suggest that CaV2.2 channels play a critical role in nociceptive transmission. Additionally, ziconotide, a selective peptide inhibitor of CaV2.2 channels, is clinically used to treat refractory pain. However, the use of ziconotide is limited by its low therapeutic index, which is believed, at least in part, to be a consequence of ziconotide inhibiting CaV2.2 channels regardless of the channel state. Subsequent efforts have focused on the discovery of state-dependent inhibitors that preferentially bind to the inactivated state of CaV2.2 channels in order to achieve an improved safety profile relative to ziconotide. Much less attention has been paid to understanding the binding kinetics of these state-dependent inhibitors. Here, we describe a novel electrophysiology-based assay on an automated patch platform designed to differentiate CaV2.2 inhibitors based on their combined state dependence and kinetics. More specifically, this assay assesses inactivated state block, closed state block, and monitors the kinetics of recovery from block when channels move between states. Additionally, a use-dependent assay is described that uses a train of depolarizing pulses to drive channels to a similar level of inactivation for comparison. This use-dependent protocol also provides information on the kinetics of block development. Data are provided to show how these assays can be utilized to screen for kinetic diversity within and across chemical classes.
Introduction
CaVs exist in at least three different conformational states (closed, open, and inactivated). Although ziconotide has a degree of state dependence at very hyperpolarized membrane potentials, it inhibits CaV2.2 channels regardless of the channel state when the potentials are within physiological ranges. 11,12 It has been suggested that a more state-dependent CaV2.2 inhibitor would have an improved therapeutic index relative to ziconotide. 13,14 Supporting this hypothesis, the state-dependent CaV2 inhibitor TROX-1 shows efficacy in preclinical models of pain with a satisfactory preclinical therapeutic window against cardiovascular and CNS side effects. 15 A number of assays have been described for identifying CaV2.2 inhibitors in a high throughput format 16 –19 with some specifically designed to identify state-dependent inhibitors. 20,21 Additionally, a more moderate throughput electrophysiological assay has been recently described that can assess state dependence. 21
Despite this focus on the discovery of state-dependent CaV2.2 inhibitors, little attention has been paid to understanding the underlying kinetics of channel block. There are several important considerations for state-dependent compounds that could have a profound impact on the overall efficacy and safety. For example, after neuronal excitation and channel inactivation, a state-dependent CaV2.2 inhibitor produces inactivated state block. How quickly does this inhibition diminish as the channel moves to the closed state on repolarization of the neuron? Similarly, how quickly does the inactivated state block develop on the induction of neuronal activity? The limited attention directed toward the kinetics of CaV2.2 inhibitors may partly stem from the lack of higher throughput assays for assessing this information. Here, we describe a novel automated electrophysiological assay that can be used to differentiate compounds based on both state dependence and the kinetics of channel recovery in the presence of the compound. We also describe a use-dependent assay, where inactivation is preferentially driven through trains of brief depolarization. This assay can be used in parallel with the state-dependent assay to compare compounds and to provide information on the kinetics of block development. These assays can ensure that a wide diversity of kinetic profiles are explored and are incorporated into structure-activity relationships within chemical classes. Additionally, novel tool CaV2.2 inhibitors may be indentified that will facilitate investigation of how kinetic and state-dependent profiles relate to efficacy and safety.
Methods
CaV2.2 Cell Line
The CaV2.2 cell line stably co-expressing rat recombinant CaV2.2 (201719) e[Δ18a, Δ24a, 31a, 37b], CaVβ3, and α2δ1subunits was purchased from Dr. Diane Lipscombe (Brown University). Cells were maintained at 37°C and 5% CO2 in Dulbecco's modified Eagle's medium supplemented with 10% fetal bovine serum, 1% GlutaMAX, 100 IU/mL penicillin, 100 mg/mL streptomycin, 10 μg/mL blasticidin, 50 μg/mL hygromycin B, and 50 μg/mL zeocin. All cell culture reagents were purchased from Invitrogen (Carlsbad, CA).
Cell Preparation
On the day of the experiment, cells that were plated in T175 cell culture flasks and grown to 60%–80% confluency were rinsed once in Dulbecco's phosphate buffered saline and dissociated with 7 mL Detachin (Genlantis, San Diego, CA) at 37°C for 5 min. Dissociated cells were then centrifuged in a Beckman GS-15 centrifuge (Brea, CA) at 1000 rpm for 2 min. at room temperature, the supernatant was removed, and the pellet was re-suspended in serum-free media (CHO-SFM-II; Invitrogen) supplemented with 25 mM Hepes (Sigma, St. Louis, MO) at a final cell density of 3×10⁶ cells/mL. The cells were added to the Sophion QPatch (Sophion Bioscience, Ballerup, Denmark) automated cell preparation station where the cells were stirred and maintained in a single cell suspension. After 10 min of cell recovery, experiments were run unattended for several hours.
QPatch-HT Electrophysiology
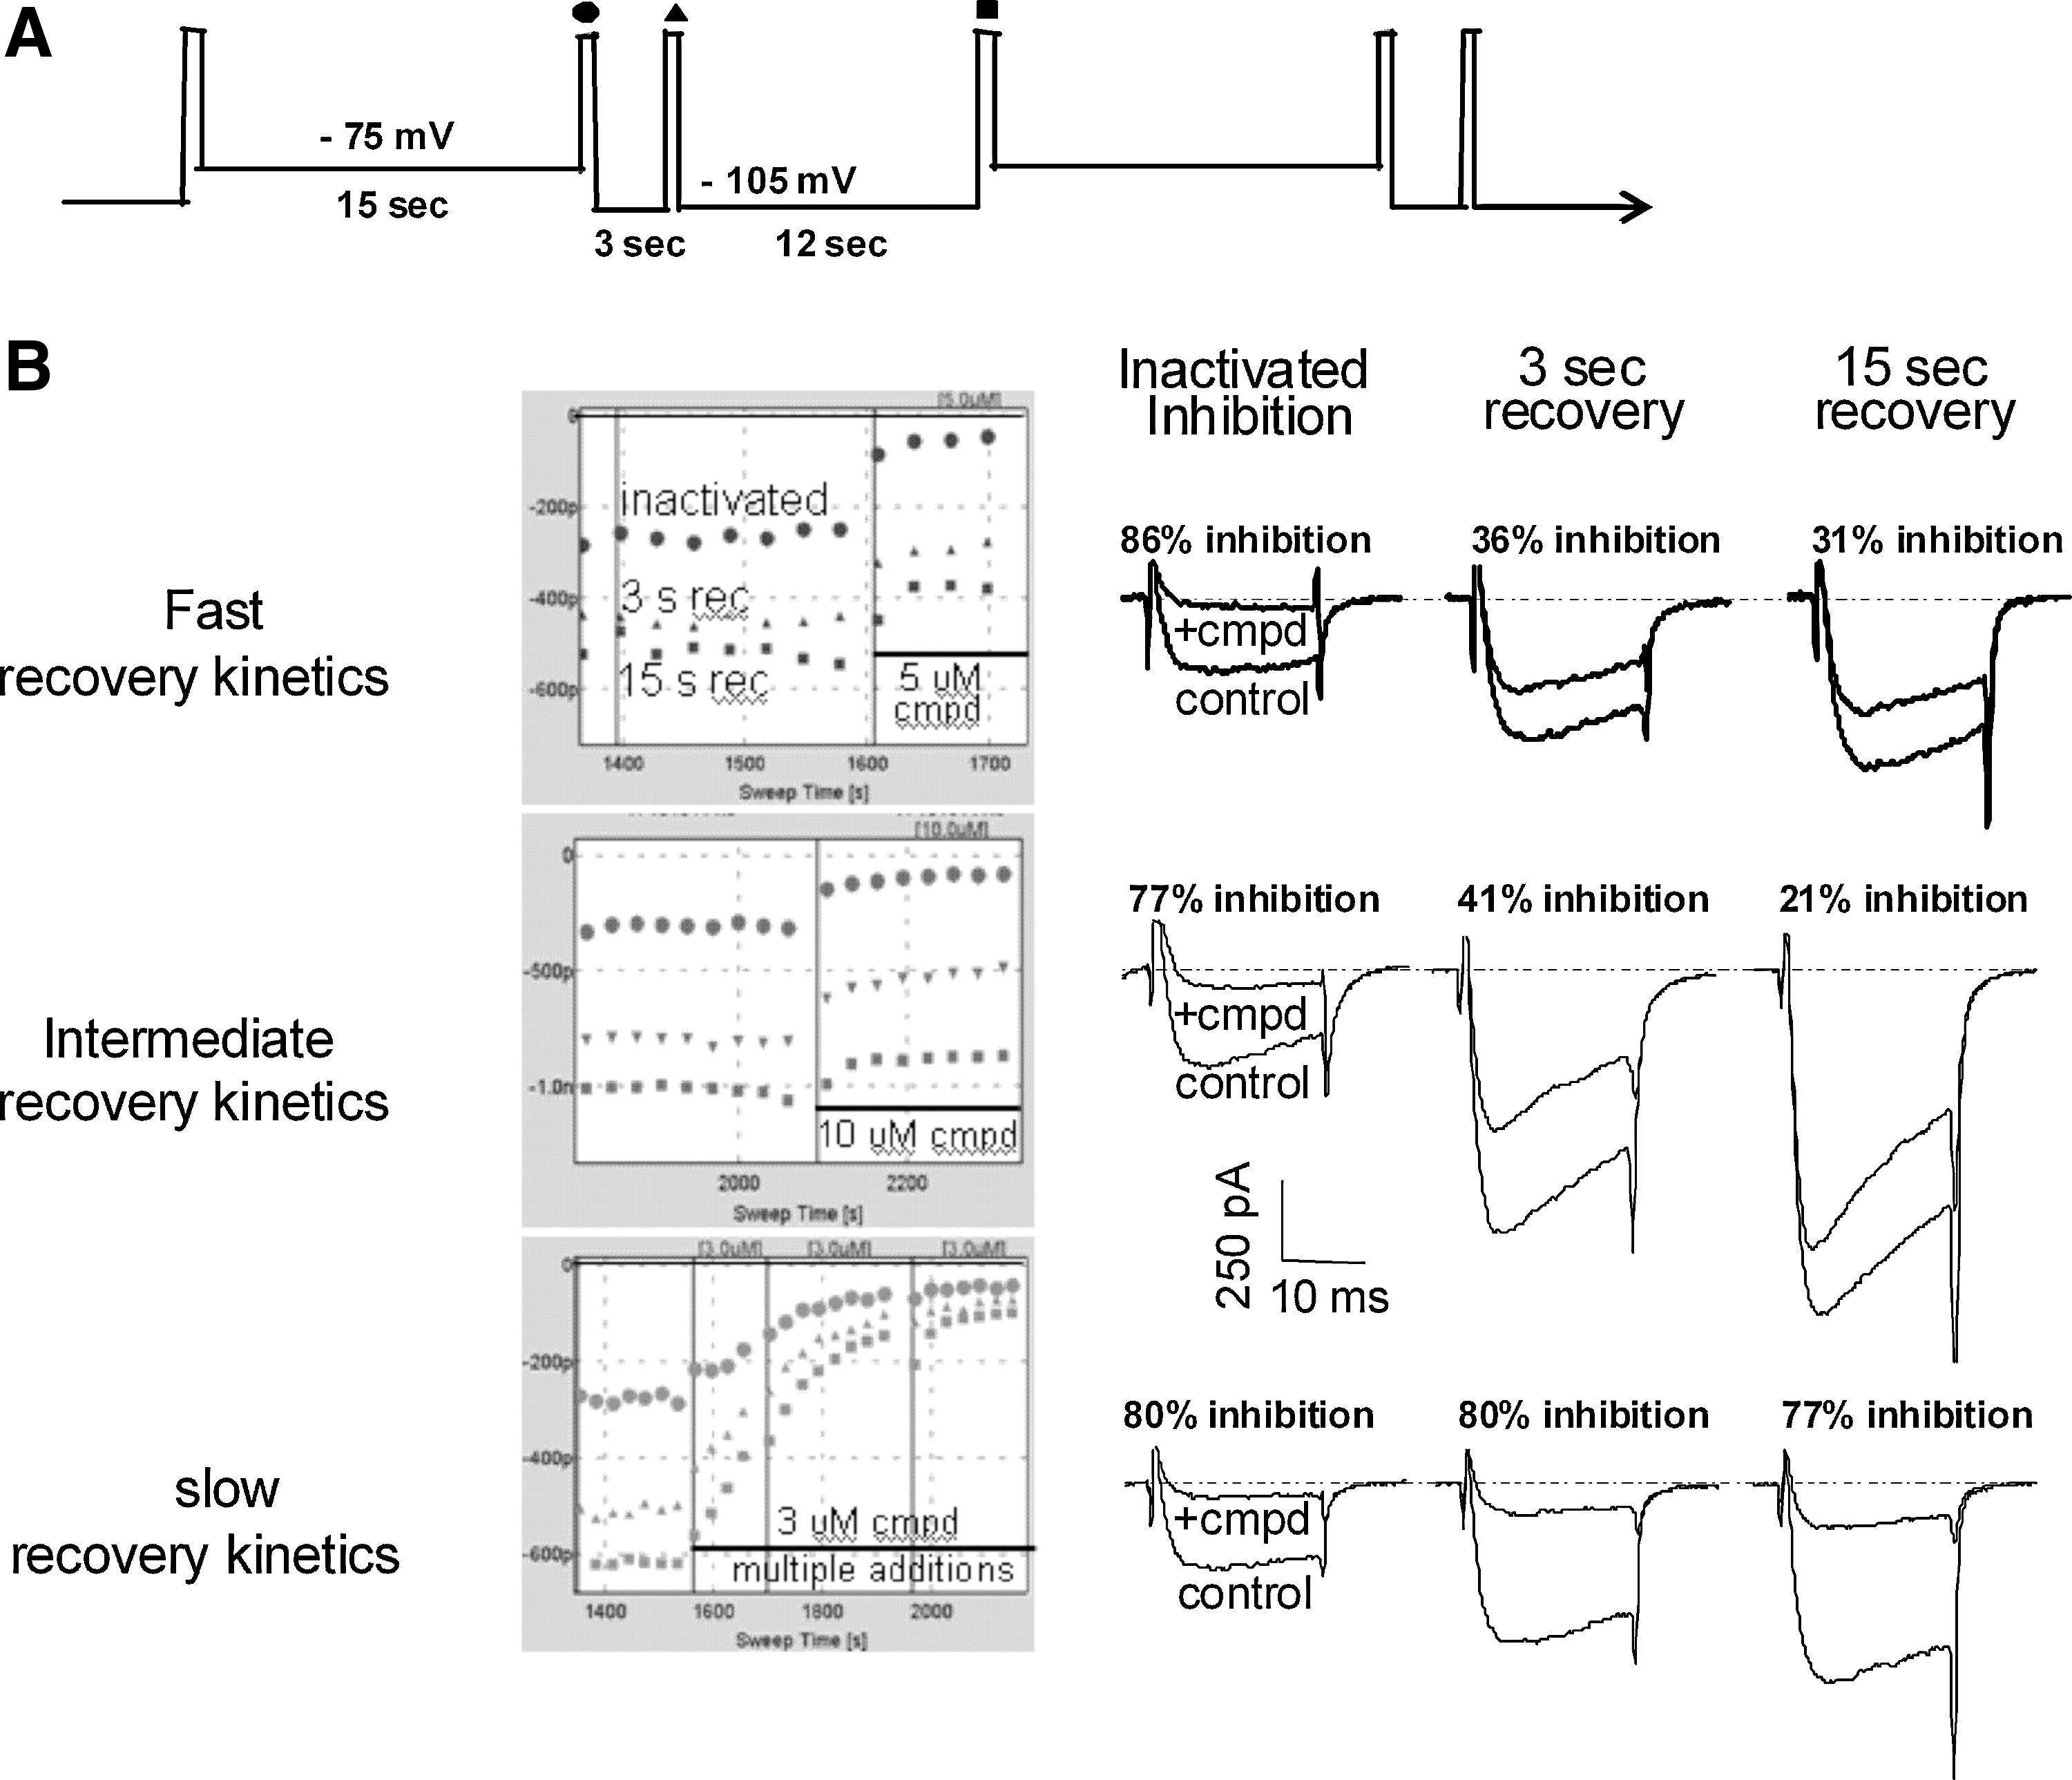
Whole-cell patch-clamp experiments were carried out on the QPatch-HT automated platform that performs 48 parallel and independent recordings on a disposable QPlate. Cells were automatically prepared by the QPatch and re-suspended in extracellular solution using an on-board mini centrifuge (Qfuge). Positioning of the cells on the QPlate measuring site was done by application of negative pressure. Gigaseal and whole-cell configurations were established using QPatch software (Sophion Biosciences). To evaluate inactivated state inhibition and recovery kinetics, an alternating voltage protocol was used to stabilize the current at the inactivated state. The holding membrane potential was alternated between −110 mV and −75 mV with a 50 ms step to 0 mV at a frequency of 0.067 Hz. The addition of a brief step to 0 mV after 3 s of recovery at the hyperpolarized membrane potential was added to further monitor recovery kinetics (Fig. 1A). Using this protocol, ∼50%–70% of the N-type channels are inactivated at the depolarized holding potential compared with −110 mV holding potential. The actual depolarized holding potential ranged between −80 and −75 mV so that the inactivation levels would be similar across passages and assay runs. To evaluate the closed state inhibition, the same protocol was used as just mentioned; however, the baseline holding potential remained at −110 mV throughout the assay. The extracellular solution contained (in mM) 87.5 CsCl, 40 (TEA)-Cl, 10 HEPES, 10 glucose, 5 BaCl2, and 1 MgCl2, pH 7.2, 310 mOsm. The intracellular solution contained (in mM) 112 CsCl, 27 CsF, 8.2 EGTA, 10 HEPES, and 2 NaCl. On the day of the experiment, 4 mM MgATP was added, and the pH was adjusted to 7.2 with CsOH, 290 mOsm. The addition of antagonists was set up using the QPatch Assay Software and delivered with an eight-pipette liquid handling robot. All compounds were prepared first as serial dilutions in dimethyl sulfoxide (DMSO) and then brought up in extracellular solution for final testing concentrations in the presence of 0.3% DMSO. All the compound test solutions were kept in glass inserts held in 96-well plates (BioTech Solutions, Vineland, NJ). DMSO (0.3%) controls were run in all experiments. DMSO control currents measured from the inactivating period exhibited from 1% run-up to 7% run-down; from the hyperpolarized period, from 1% to 6% run-up; and from the 2–3 s recovery period, from 2% run-up to 2% rundown. Due to this small differential change at the different measuring periods, data outside of the screening data from Figure 4 were corrected based on the run-up or run-down observed for DMSO controls, for the respective measuring period within the same run.
The two-voltage recovery protocol can be used to differentiate CaV2.2 inhibitors.
Compound plates were set up for 32 two-point titrations (control, concentration 1, and concentration 2). Each condition was run in duplicate (16 total conditions) with a request for a total n of 8 in the QPatch assay software. This typically resulted in a run of 4–5 QPlates, at ∼1 plate/h, with n's of 3–5 of useable data for each condition. As an example, in the screening mode, 16 compounds could be assessed at two concentrations over 4–5 h with n values of 3–5 for each concentration (∼30 data points/h or ∼32 compounds/day at two concentrations). Although low by high throughput screening (HTS) standards, this is an extremely high-content electrophysiological assay with greatly improved throughput over manual electrophysiology (mEP).
Data Analysis and Statistical Comparisons
Peak current amplitudes were measured using the Sophion QPatch software and exported to Microsoft Excel, where percent inhibition values were calculated. GraphPad Prism (GraphPad Software, San Diego, CA) was used for data plotting, data fitting, and statistical comparisons. Statistical comparisons and data fitting were performed as noted in the figure legends.
Results
Modified Two-Voltage Protocol for Identifying Compounds with Different Kinetic Profiles
In an effort to develop a protocol that provides informative kinetic information, we modified the two-voltage protocol for CaV2.2 channels first described in Vortherms et al. 21 The Vortherms protocol alternated between a depolarized and hyperpolarized holding potential every 15 s. During the 15 s depolarization, a portion of CaV2.2 channels are inactivated, and compound inhibition can be measured under inactivating conditions. When the membrane potential is hyperpolarized, channels recover from inactivation and inactivated-state block. To better monitor this recovery from the block, we added a brief step to 0 mV after 3 s of recovery at the hyperpolarized membrane potential (Fig. 1A). By comparing the degree of CaV2.2 block under inactivating conditions (measured at circle), with that of the block after 3 s (triangle) and 15 s (square) of recovery at a hyperpolarized membrane potential, compounds can start being differentiated based on their recovery kinetics. Figure 1B shows examples of different compounds displaying fast, intermediate, and slow recovery kinetics. For the fast-recovering compound, there is 86% block under inactivated conditions, but much of this block is relieved within 3 s at the hyperpolarized potential (36% inhibition) without much additional recovery at 15 s (31% inhibition). The compound in the middle panel displays more intermediate recovery kinetics with 77% inhibition under inactivated conditions, partial recovery to 41% inhibition after 3 s, and further recovery to 21% block after 15 s. In sharp contrast to these first two examples, the compound in the lower panel of Figure 1B shows little, if any, recovery from the block during the 15 s at the hyperpolarized membrane potential (80% under inactivated conditions, 80% after 3 s, and 77% after 15 s).
Evaluation of Closed State Block Provides a More Complete Assessment of the Compound Inhibition Profile
For compounds with slower recovery kinetics, full recovery to closed state block levels may not be complete within the 15 s recovery period. To further explore this, we utilized a protocol that measures the CaV2.2 closed state block more directly (Fig. 2B) The value of this protocol is illustrated by the comparison of two compounds within the same chemical series that displayed sharply contrasting kinetic profiles (Fig. 2C). Compound A1 displayed very fast kinetics with a substantial recovery by 3 s (solid vs. open bar) using the two-voltage recovery protocol. The lack of any additional recovery at 15 s (hashed bar) suggests that recovery was complete by 3 s (i.e., fully relaxed to closed state, hyperpolarized levels). This was confirmed by assessing the block at the same concentration utilizing the closed state protocol (reverse hashed bar). In contrast, Compound A2 showed a similar block at all three measurement points in the two-voltage recovery protocol, suggesting very slow recovery kinetics with essentially no recovery from inactivated state block occurring up through 15 s. This profile would also be consistent with the compound having no actual state dependence. The closed state protocol can be used to distinguish between these two possibilities. In the closed state protocol, Compound A2 exhibited reduced blocking, indicating that it is indeed a state-dependent compound. Therefore, although these two compounds display a similar degree of state dependence (solid bars compared with reverse hashed bars for each), they differ dramatically in their recovery kinetics.
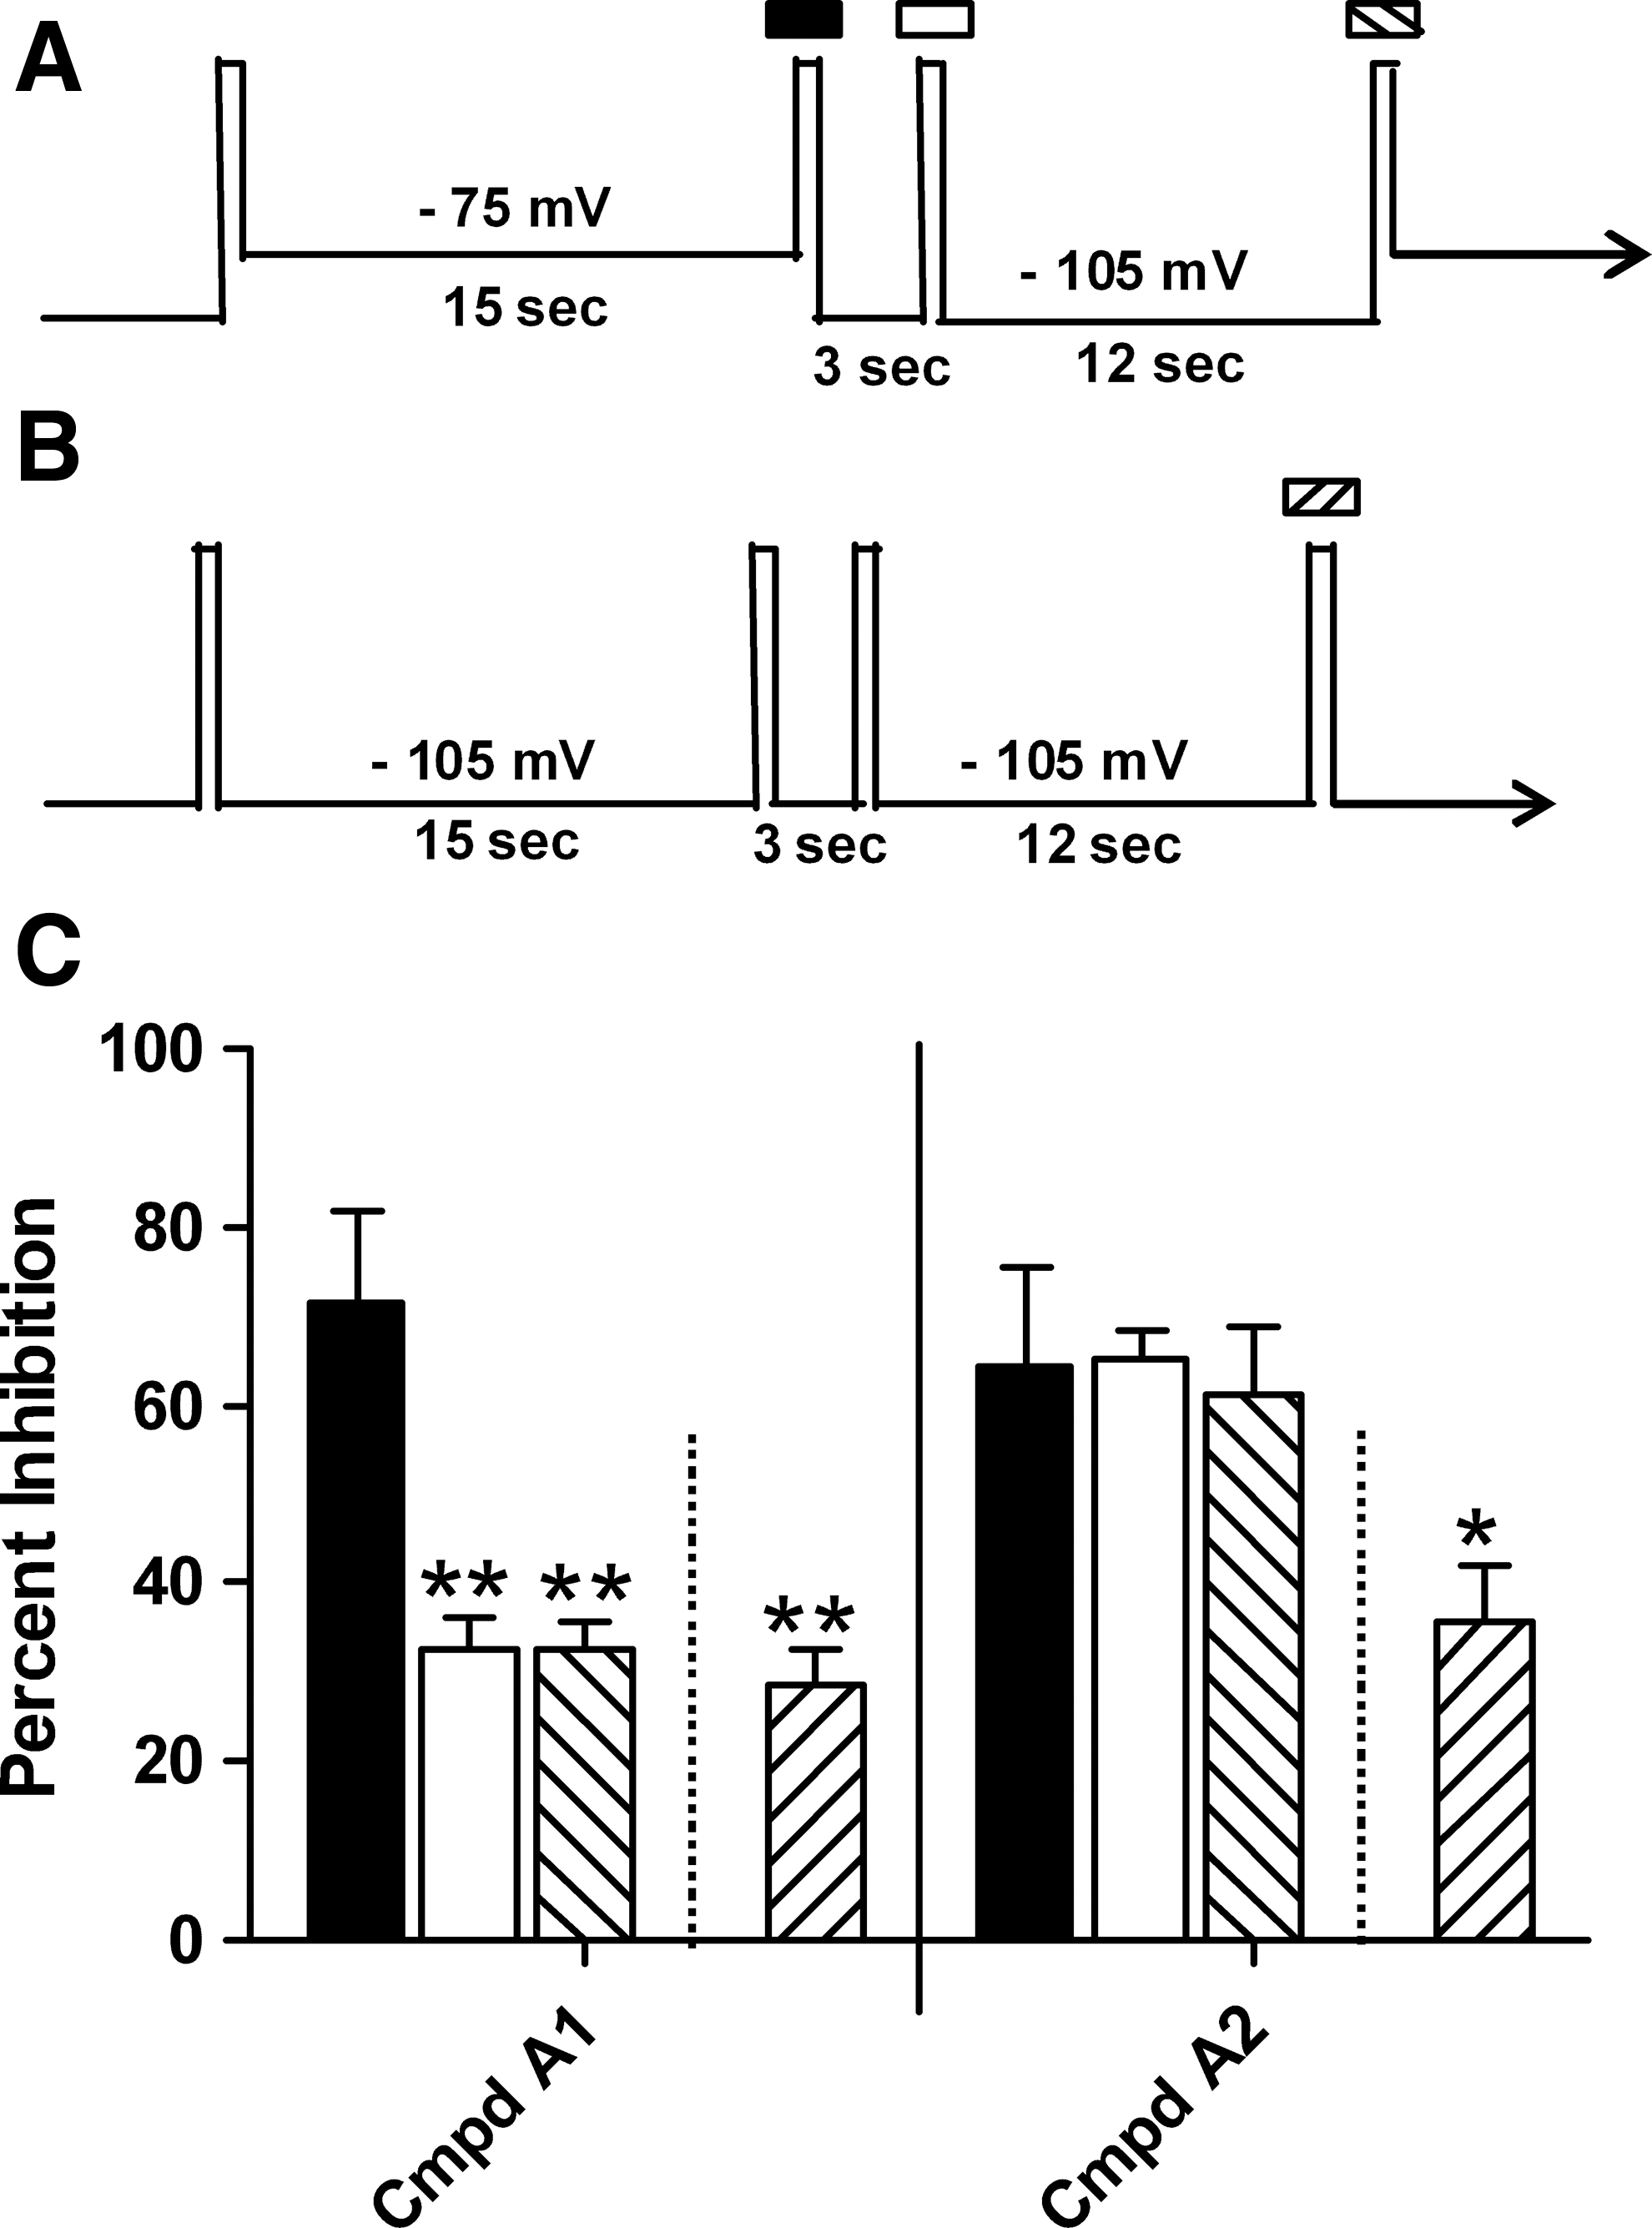
Follow up with the closed state protocol is required to assess state dependence for slow kinetic compounds.
Kinetic Profile of the State-Dependent CaV2 Inhibitor TROX-1
TROX-1 was recently reported as being a small-molecule state-dependent inhibitor of CaV2 channels with a preclinical therapeutic window for analgesic efficacy against cardiovascular and central nervous system side effects. 15 Therefore, we assessed the kinetic and state-dependent profile of TROX-1 on CaV2.2 using our two-voltage recovery protocol (Fig. 3). At concentrations of both 3 μM and 10 μM, TROX-1 displayed intermediate to slow kinetics with little recovery by 3 s (open bar) but significant recovery by 15 s (hashed bar). Recovery at 15 s, however, was still not complete, as follow-up assessment in the closed state protocol revealed a further reduction in the block under closed state conditions (reverse hashed bar). As reported in Abbadie et al., 15 TROX-1 demonstrated a good degree of state dependence as illustrated from the difference between the inactivated state (solid bar) and closed state (reverse hashed bar) block at both concentrations. Although TROX-1 exhibits relatively slow kinetics with strong state dependence, it is unclear what overall profile provides the optimal safety window in vivo. For this reason, it is important to be able to screen for diversity within and across series to maximize the chances of success.
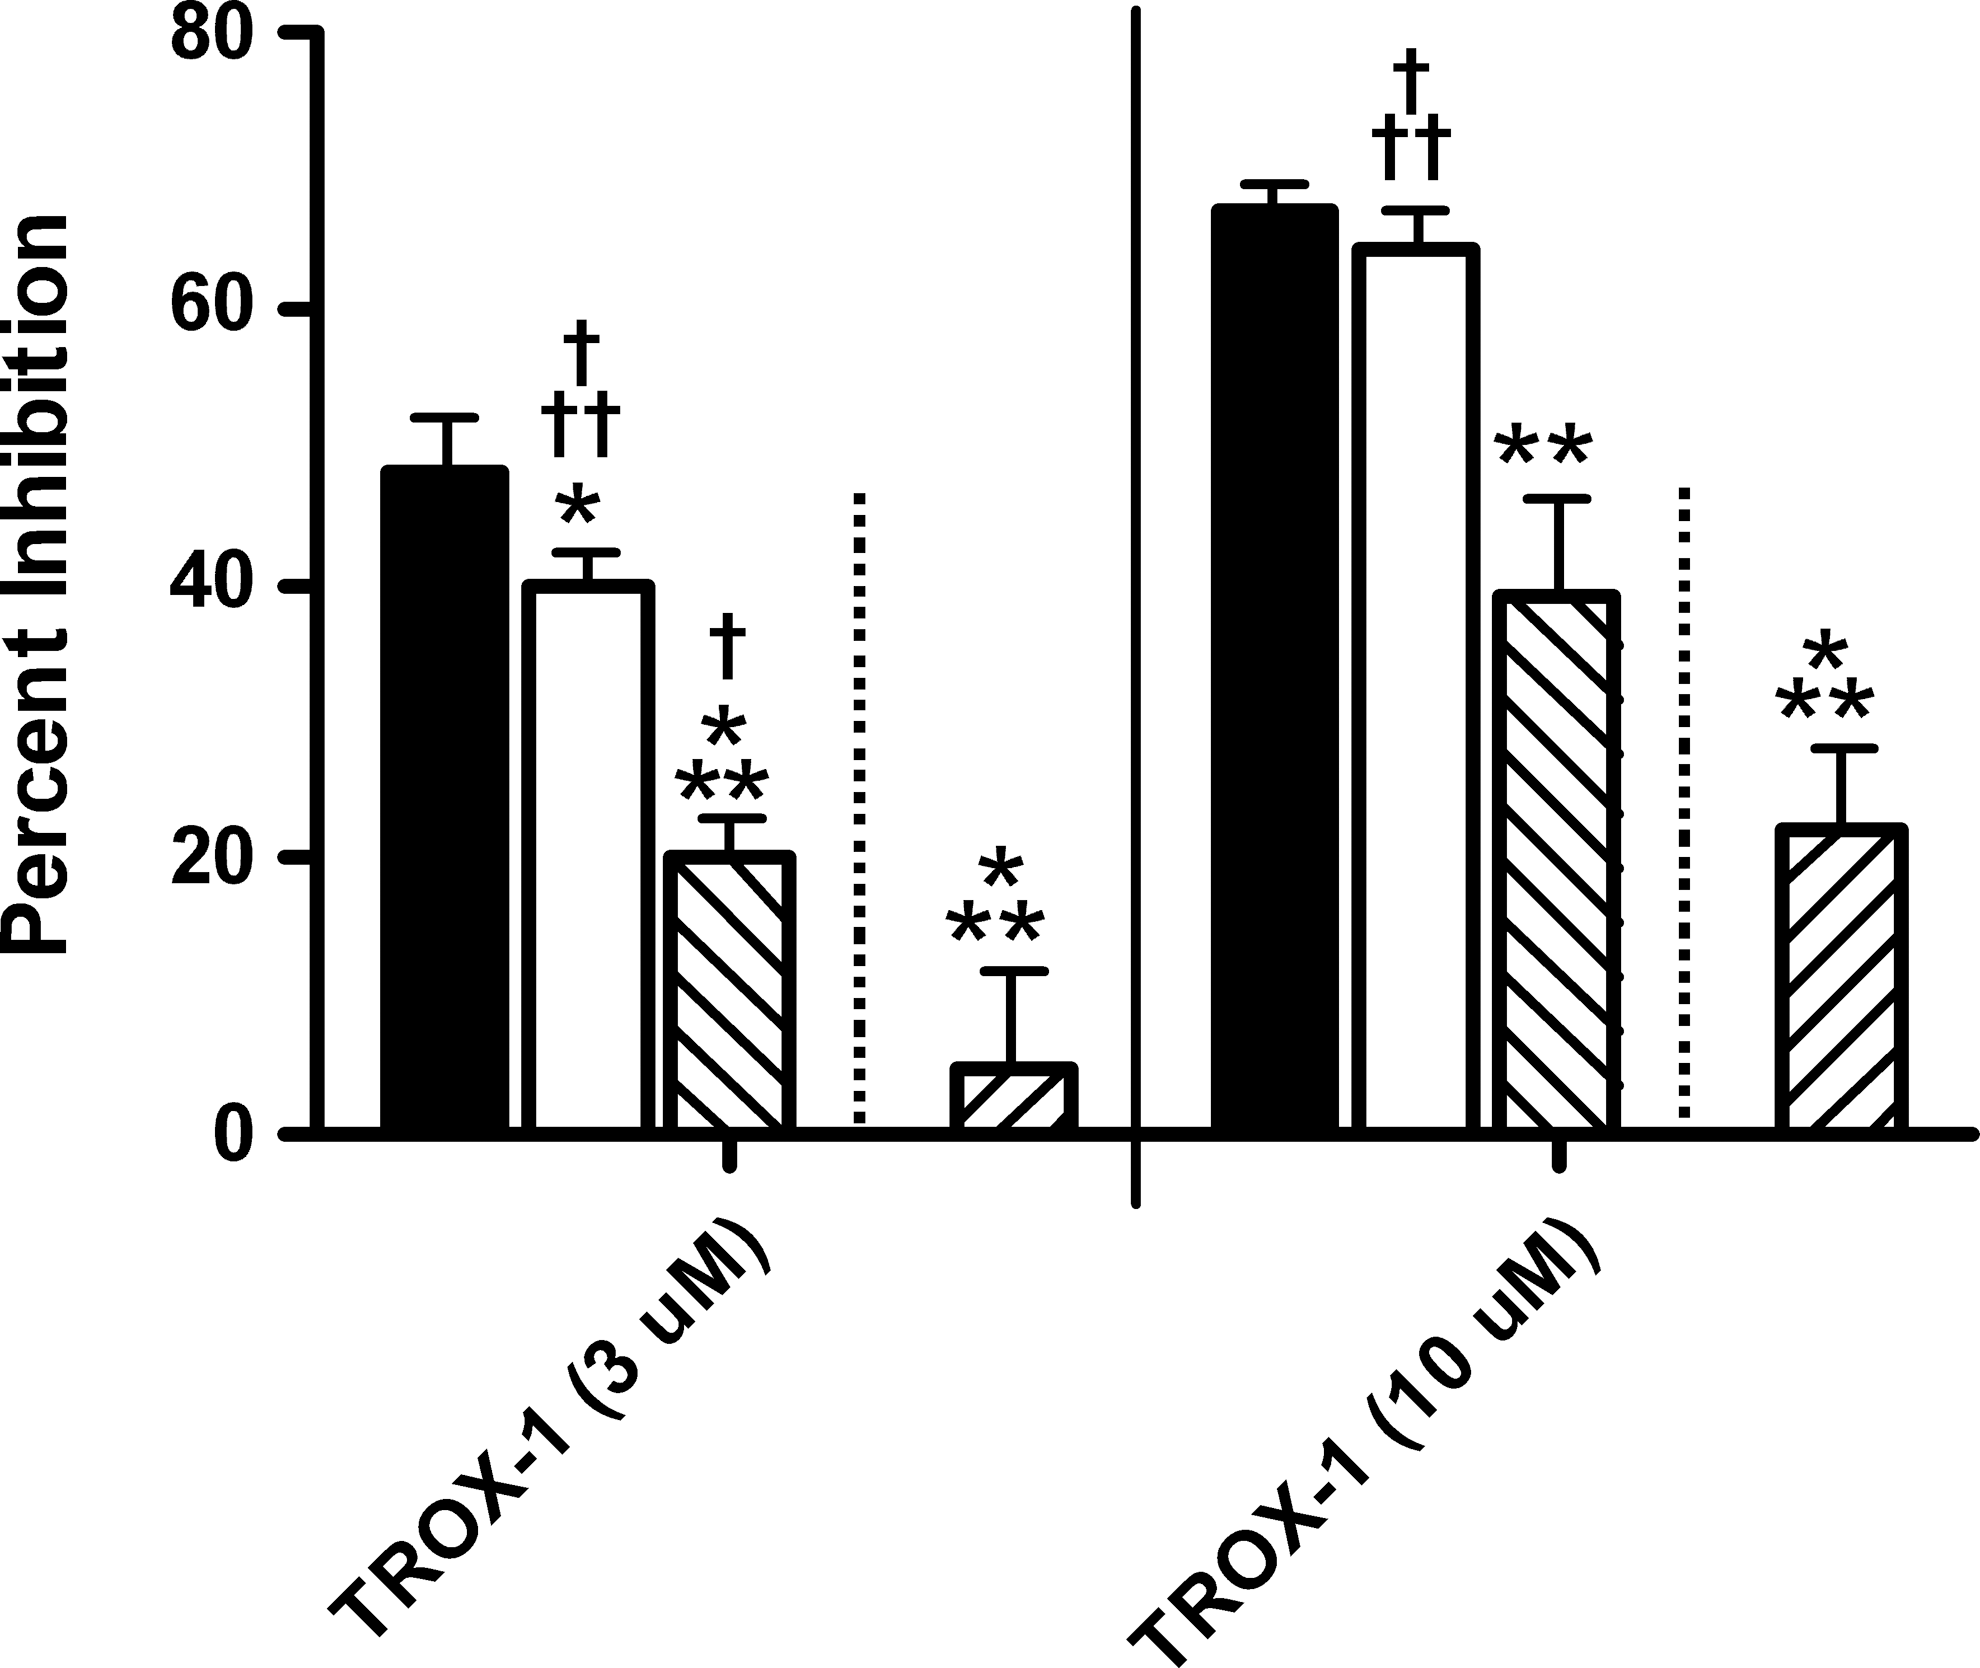
TROX-1 exhibits relatively strong state dependence with intermediate recovery kinetics for CaV2.2. Similar profiles are obtained at both 3 μM and 10 μM TROX-1. Little recovery was observed within the first 3 s. More significant recovery was observed by 15 s although still not complete for the closed state blocking levels. Solid bars, inactivated state block; open bars, 3 s recovery block; hashed bars, 15 s recovery block; reverse hashed bars, closed state block. The statistical comparison was the same as described in Figure 2. *Statistically different from inactivated state block; †statistically different from the closed state block. One symbol, P<0.05; two symbols, P<0.01; three symbols P<0.001. The 3 s and 15 s recovery measurements at both 3 μM (P<0.001) and 10 μM (P<0.05) were also significantly different but not indicated on the graph for purposes of clarity. For 3 and 10 μM TROX-1 in the two-voltage recovery protocol, n=7 and n=4, respectively. For 3 and 10 μM TROX-1 in the closed state protocol, n=7 and n=5, respectively. TROX-1, (3R)-5-(3-chloro-4-fluorophenyl)-3-methyl-3-(pyrimldin-5-ylmethyl)-1-(1H-1,2,4-triazol-3-yl)-1,3-dihydro-2H-indol-2-one.
Screening for Diversity: Triazine and Pyrimidine CaV2.2 Inhibitors
The triazine Compound T1 (Fig. 4A) was initially identified as a CaV2.2 inhibitor in a high throughput screen of an Abbott chemical library. Subsequent synthetic chemistry efforts resulted in a number of structurally related triazine and pyrimidine compounds with activity against CaV2.2 channels. The two-voltage recovery protocol was used to look at a subset of these compounds to identify members with differentiated state-dependent and/or kinetic properties Figure 4 gives examples of some triazines and pyrimidines found to display a range of blocking profiles. For the triazines, Compounds T1 and T2 displayed relatively fast recovery kinetics with a substantial recovery of the block at 3 s and little to no additional recovery at 15 s. Compound T3 also showed relatively fast kinetics with a substantial recovery from the block at 3 s and a further recovery after 15 s to essentially no block. Although structurally similar in many aspects, the pyrimidines exhibited different profiles. Compound P1 demonstrated more intermediate kinetics with little recovery at 3 s but a significant recovery at 15 s, while Compound P2 showed very little recovery from block even up to 15 s, –a profile consistent with either very slow recovery kinetics (>15 s) or very little state dependence.

Diversity of profiles observed for the structurally similar triazine and pyrimidine series using the two-voltage recovery protocol.
As demonstrated from the data in Figure 4, the two-voltage recovery protocol can be used as a first-pass screen to identify compounds with different state-dependent and/or kinetic profiles. Following the first-pass screen, compounds of interest can be further evaluated with follow-up concentration-response curves for the inactivated state, the two recovery periods, and the closed state, and, thus, provide a more thorough characterization of the state dependence and kinetics. Since the triazines displayed very fast recovery kinetics, in some cases even appearing to be fully recovered within 3 s (Fig. 4B, Compounds T1–T3), the first recovery measurement was shortened to 2 s in the follow-up concentration-response curves. Figure 5 shows the full concentration-response curves for three compounds with contrasting profiles. Compound T4, a triazine closely related to the Figure 4 triazines, displayed similarly fast recovery kinetics, and almost complete recovery to closed state block values within 2 s. Compound T4 also displayed a strong state dependence with an IC50=5.9 μM for the inactivated state and an IC50>30 μM for the closed state. The pyrimidine Compound P1 had similar state dependence (IC50=6.3 μM for the inactivated state and IC50>30 μM for the closed state) compared with Compound T4; however, it had a more intermediate kinetic profile with little recovery at 2 s and a more complete recovery by 15 s. Diversity was found within the pyrimidine chemical series, as Compound P2 showed only minimal, although statistically significant, state dependence (IC50=4.6 μM for the inactivated state and 8.9 μM for the closed state). There was not enough separation between the inactivated and closed state inhibition curves to resolve the kinetics of Compound P2.
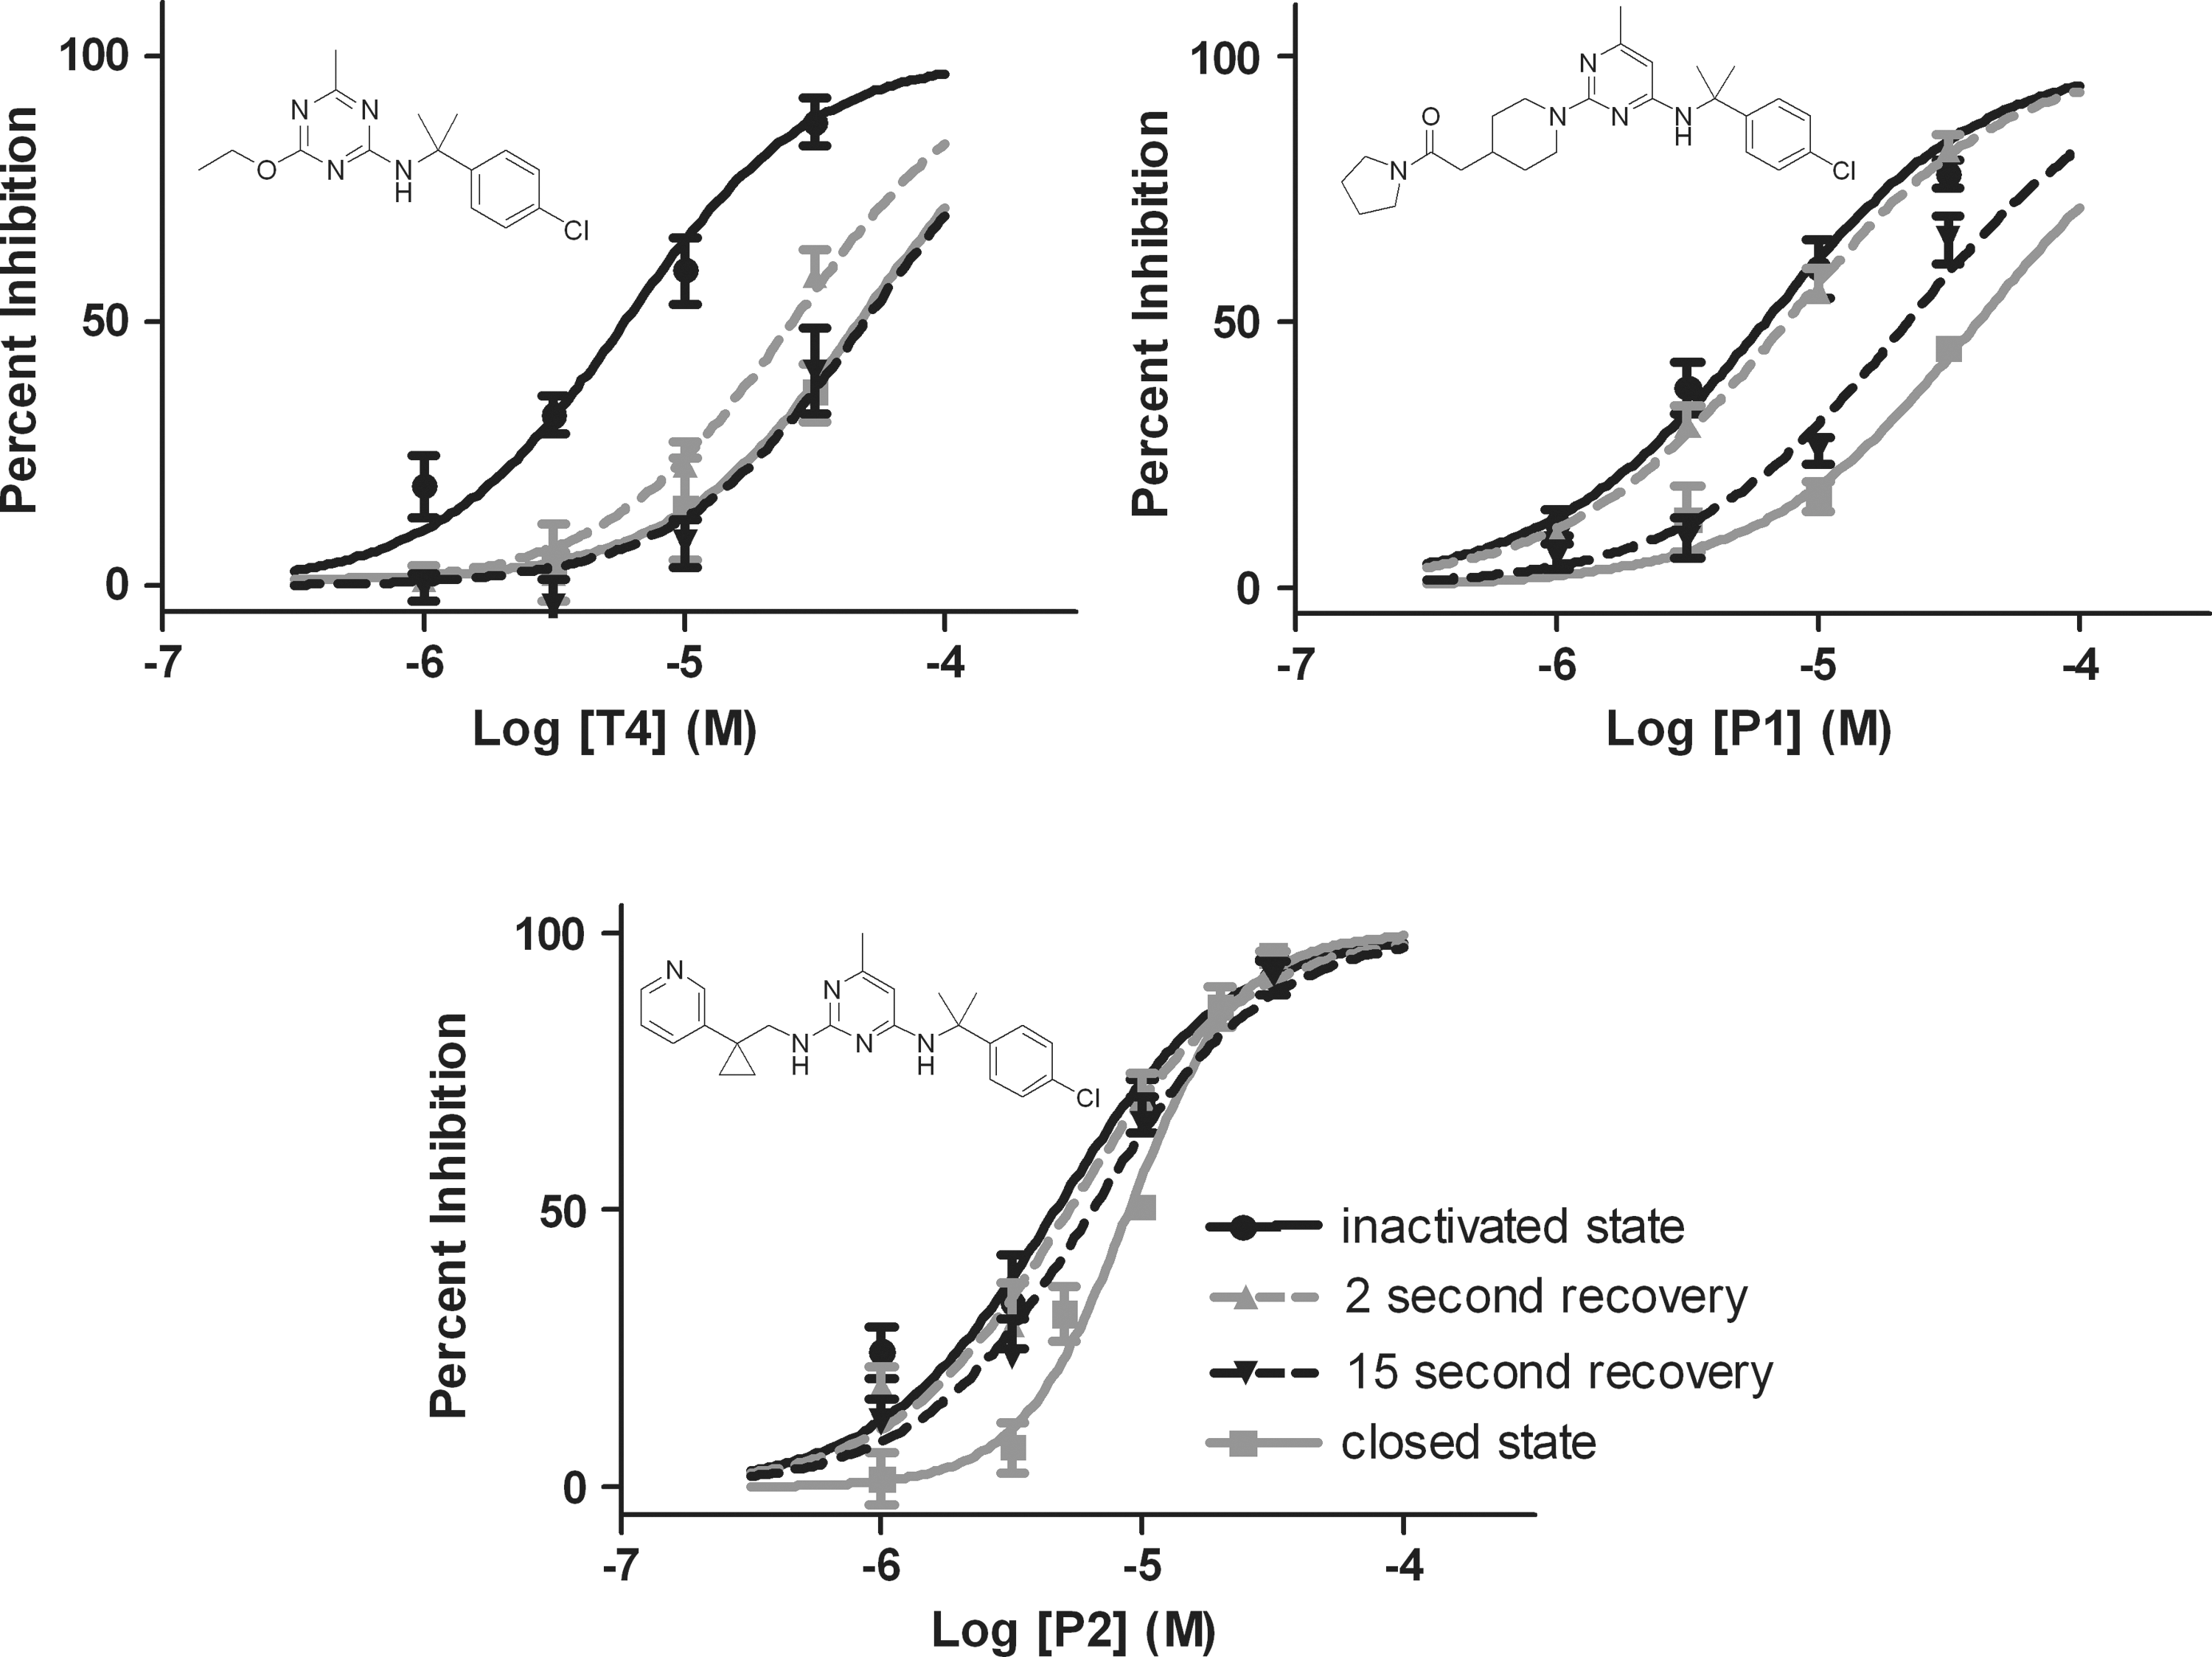
Follow-up full titrations for select compounds showing various kinetic/state-dependent profiles on CaV2.2. Compound T4 displayed strong state dependence (compare the inactivated state curve with the closed state curve) and very fast recovery kinetics with the block largely recovered within 2 s. Compound P1 exhibited more intermediate recovery kinetics with a similar degree of state dependence. In contrast, Compound P2 displayed very little if any state dependence. For clarity, statistics are only included in the figure legend. Inactivated, 2 s recovery, and 15 s recovery data at each concentration were compared using a one-way repeated measures ANOVA with a post-hoc Tukey comparison for significance. Closed state data, which has been obtained from a different population of cells, were compared with other data using a one-way ANOVA with Dunnet's comparison for significance. For Compound T4, the inactivated state block was different from the 2 s recovery block (1 μM*, 3 μM**, 10 μM**, 30 μM***), the 15 s recovery block (1 μM*, 3 μM***, 10 μM***, 30 μM***), and the closed state block (1 μM**, 3 μM**, 10 μM***, 30 μM***). The 2 s recovery block was different from the 15 s recovery block at 30 μM** and the closed state block at 30 μM**. For Compound P1, the inactivated state block was different from the 15 s recovery block (1 μM*, 3 μM***, 10 μM***, 30 μM***) and the closed state block (3 μM*, 10 μM***, 30 μM***). The 2 s recovery block was different from the 15 s recovery block (3 μM***, 10 μM***, 30 μM***) and the closed state block (10 μM***, 30 μM***). The 15 s recovery block was different from the closed state block at 30 μM**. For Compound P2, the closed state block was different from the inactivated state block (1 μM**, 3 μM*, and 10 μM*), the 2 s recovery block (10 μM**), and the 15 s recovery block (10 μM*). For Compound T4, P1, and P2 n=5–8 cells per data point for the two-voltage recovery protocol data and n=3–9 cells per data point for the closed state protocol. The data were fit using a four-parameter logistic equation with the minimum fixed at zero and the maximum fixed to 100% of the control. A shared hill slope was used within each data set except for Compound P2 for which the closed state data was fit independently, as the shared slope did not fit the data well. The IC50 values for the inactivated state, 3 s recovery, 15 s recovery, and closed state were 5.9, 26, and >30 μM (49 μM extrapolated) for Compound T4; 6.3, 7.6, 22, and >30 μM (41 μM extrapolated) for Compound P1; and 4.6, 5.2, 6.4, and 8.9 μM for Compound P2. *P<0.05, **P<0.01, ***P<0.001.
Further Differentiation of Compounds Utilizing a Matched Use-Dependent Protocol
Compounds were further differentiated by employing a use-dependent protocol, which relies on trains of brief, channel-opening depolarizations to drive inactivation (Fig. 6A). The frequency in the use-dependent protocol was chosen in order to attain similar levels of CaV2.2 inactivation as had been achieved in the two-voltage recovery protocol, and, thus, allow for a more direct comparison of results between protocols. Although the degree of block attained between the two protocols was very similar for some compounds (Fig. 6B, TROX-1 and Compound P1, solid vs. open bars), other compounds showed striking differences. Both Compounds T2 and T4 showed substantially less block in the use-dependent protocol with Compound T4 showing essentially no inhibition.
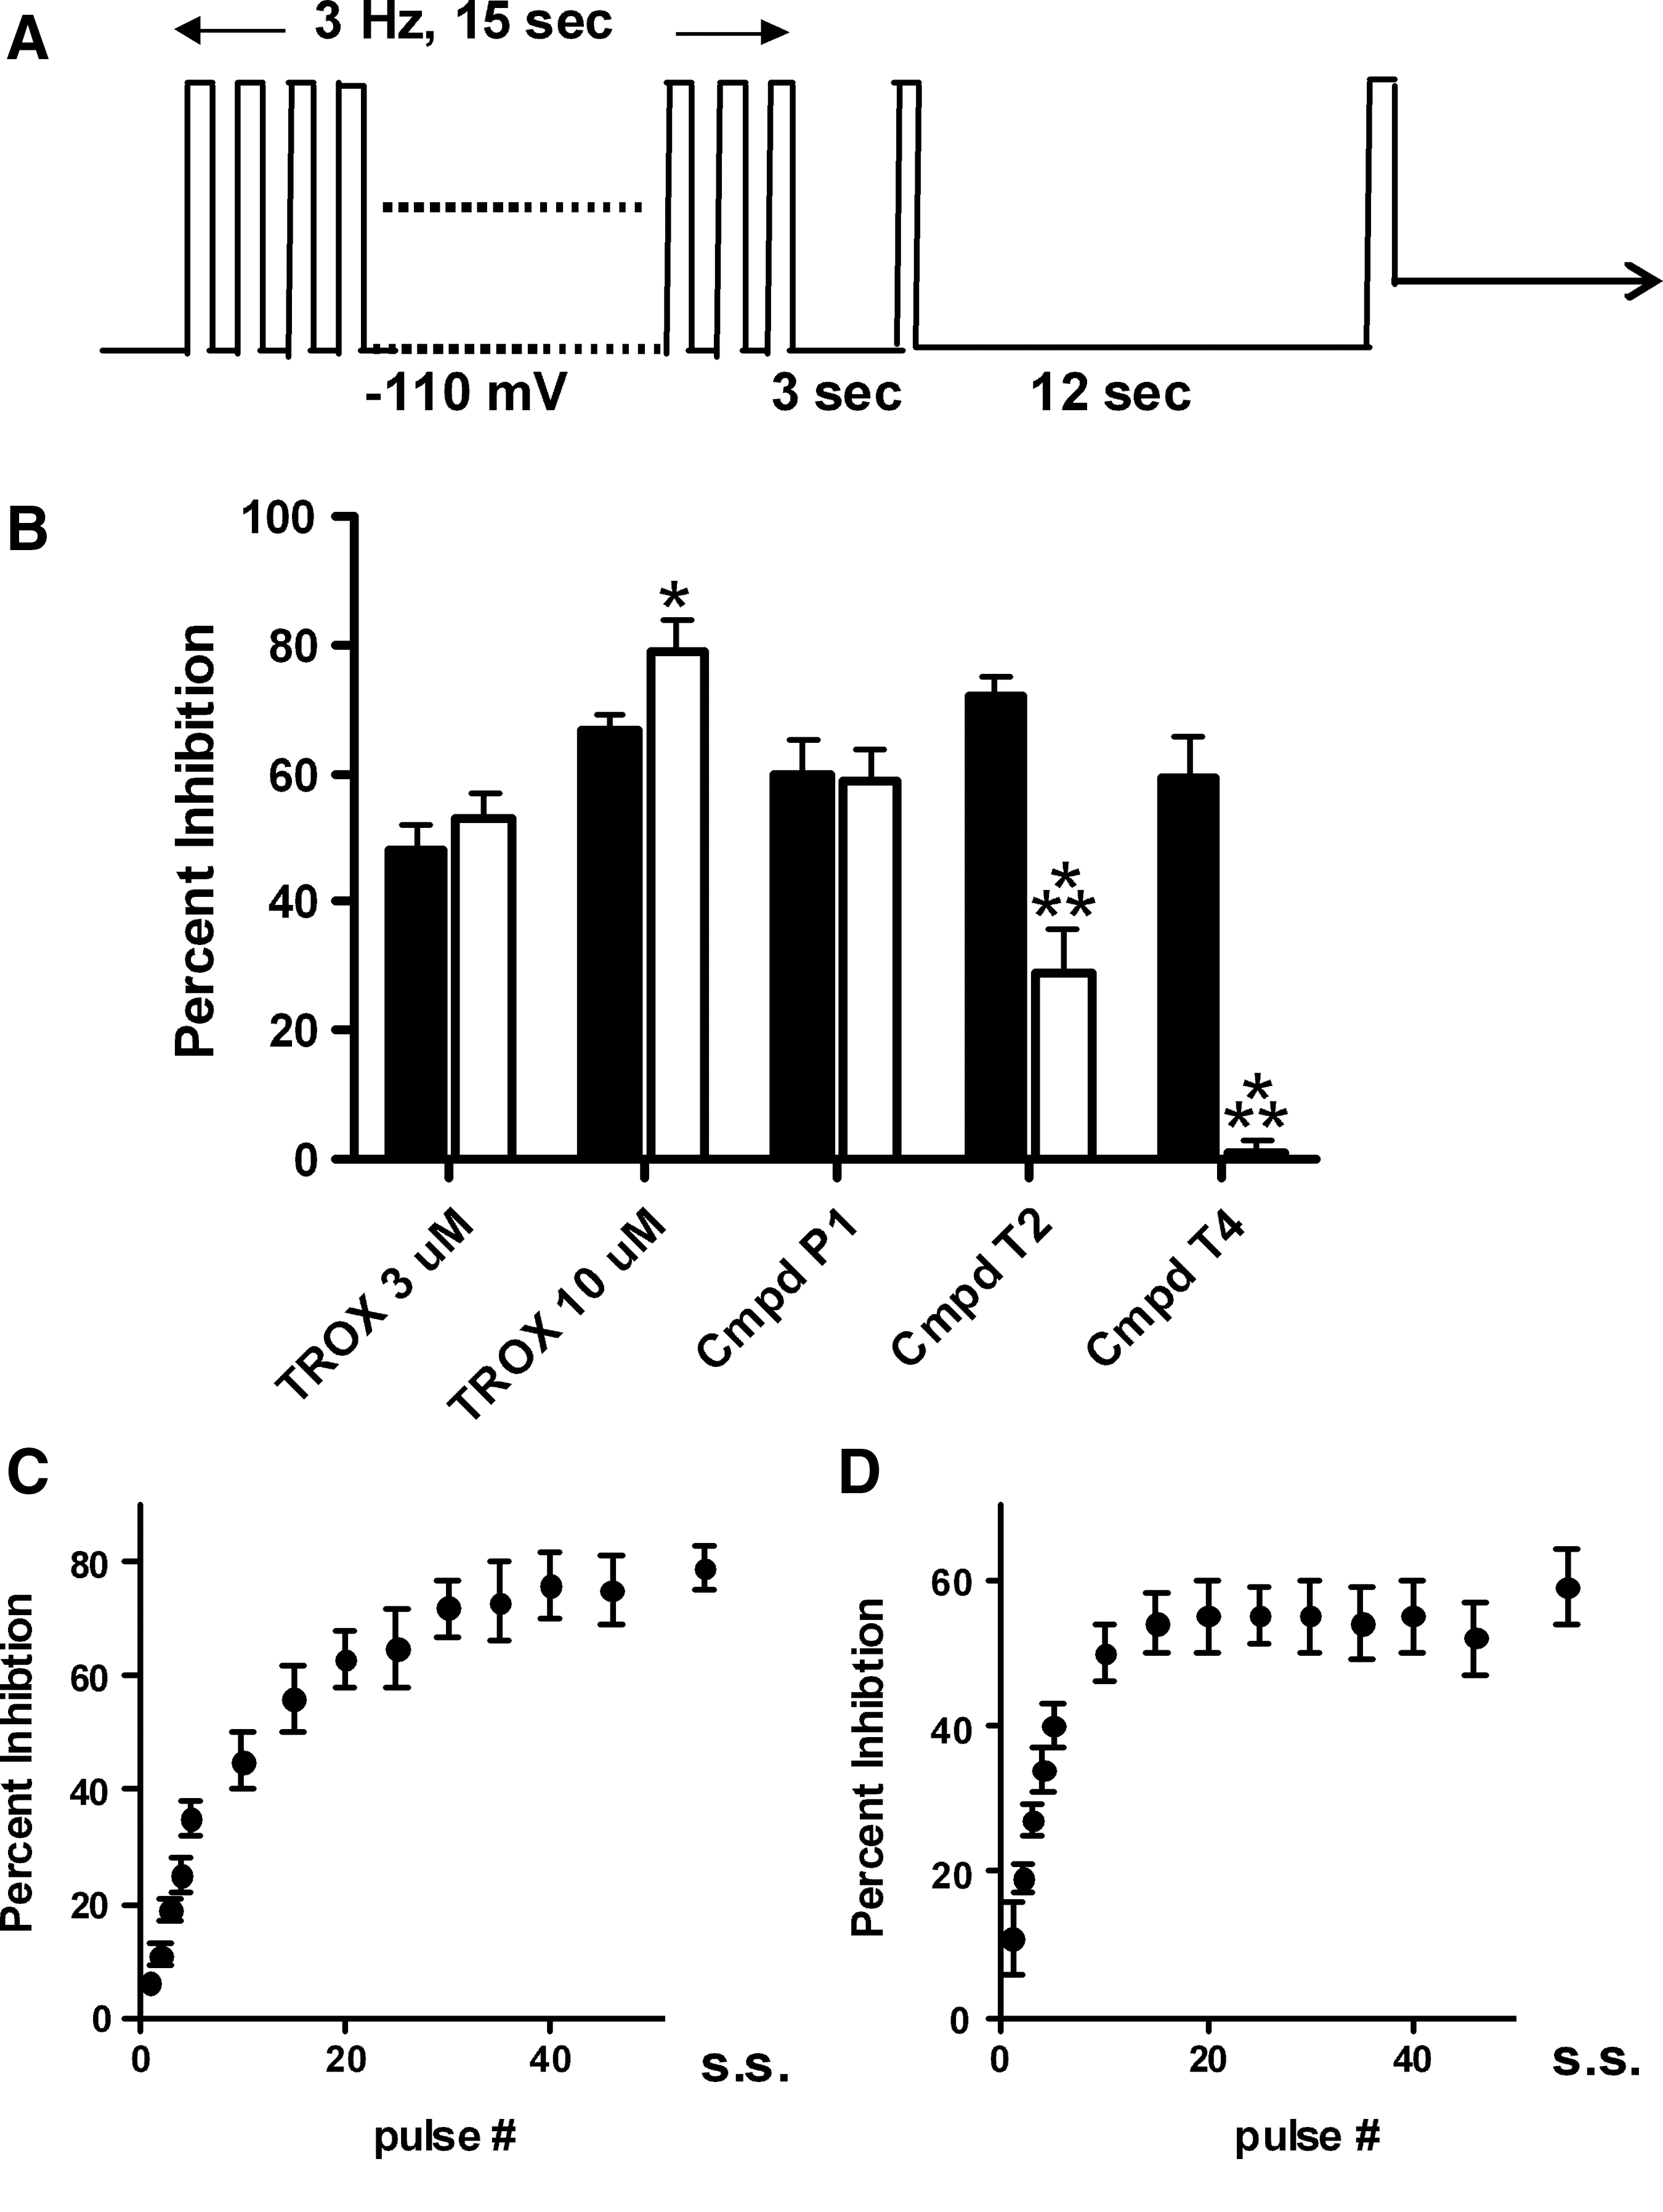
Use-dependent protocol for further differentiation of compounds.
This use-dependent protocol also provides information on the development of the block following compound application, and can be monitored throughout the inactivating train. Examples of this are illustrated for TROX-1 (Fig. 6C) and Compound P1 (Fig. 6D). TROX-1 takes 30–40 pulses (∼10–13 s) to reach steady state (s.s.) block, while Compound P1 reaches s.s. block by ∼15 pulses (∼5 s). These data are derived from the first train in the presence of the compound, and the s.s. block achieved at the end of the compound application period is shown for comparison. This s.s. measurement was typically obtained after four to six trains. Trains were repeated once every 15 s in order to be comparable to the inactivating depolarizations in the two-voltage recovery assay.
Discussion
There has been a significant effort devoted toward the discovery and development of small-molecule CaV2.2 inhibitors with an improved therapeutic index compared with ziconotide (Prialt). 10 These efforts have largely focused on finding state-dependent inhibitors with little consideration of kinetics. This is likely due, in part, to the lack of higher throughput assays for obtaining useful kinetic information. Here, we describe an automated electrophysiological assay for acquiring kinetic information in parallel with state dependence. This assay can be used to identify compounds with a range of state-dependent and kinetic profiles, thereby providing tools and potential clinical candidates for investigating the relevance of these properties to an improved therapeutic window. The utility of this assay was demonstrated by differentiating triazine/pyrimidine compounds based on their overall state-dependent and kinetic profiles. We also describe a follow-up use-dependent protocol that can be used to identify compounds which differentially block the channel when inactivation is driven through trains of brief strong depolarizations. This use-dependent protocol has the potential to identify compounds that are more reliant on open channel blocking mechanisms, and facilitates monitoring of the development of the block to provide additional information on kinetics.
A number of high-throughput nonelectrophysiological assays for identifying CaV2.2 inhibitors have been described, 16 –19 including ones that also have the ability to measure state dependence. 20,21 However, these assays do not have the ability to provide relevant kinetic information. Automated electrophysiological assays for CaV2.2 have also been described to look at either state dependence 21 or use dependence. 17 Although some kinetic information can potentially be gleaned from use-dependent assays by looking at the development of the block during the train, the overall potency measurements that result can be difficult to interpret. In use-dependent protocols, channels are continuously cycling through the different states, and the measured potency of a compound can be influenced by the overall stimulation frequency relative to the compound kinetics. In some cases, compounds could even be missed if a use-dependent protocol were the only assay being utilized (e.g., Compound T4 from Fig. 6B). These limitations make it difficult to apply findings from use-dependent assays more broadly.
The limitations of these existing assays highlight some of the advantages of the assay described in this article. First, in addition to state-dependent information, the two-voltage recovery protocol provides a measure of the time it takes for the channels, after hyperpolarization, to recover from inactivated state block levels and return to closed state block levels. This could be a particularly relevant consideration for CaV2.2 state-dependent inhibitors, as these channels cycle between closed, open, and inactivated states under in vivo conditions. Second, the kinetic measurements described here are made in the continuous presence of the compound. This protocol is more physiologically relevant than the kinetic measurements derived from compound washout rates. The kinetics derived from washout rates can appear artificially slow if the time it takes the compound to wash out from the cell and membrane is rate limiting or if a fast and direct continuous perfusion system is not utilized. Lastly, the use-dependent protocol described here is designed to mirror the two-voltage state-dependent protocol but with trains of depolarizing steps driving channel inactivation. This protocol provides a way to more directly compare the development of the block across compounds and, when used in parallel with the two-voltage recovery protocol, can be used to identify potentially interesting compounds such as those illustrated in Figure 6B. It is unclear exactly why there is such a dramatic decrease in the inhibition observed for Compounds T2 and T4 using the use-dependent protocol. It could be related to the faster recovery kinetics of these compounds preventing the accumulation of inhibition during trains. This seems unlikely, however, as there is a similar degree of cumulative channel inactivation in both protocols. An alternative explanation is that the use-dependent assay drives the channels into a different inactivated state that is less sensitive to the block by the triazines. Regardless of the root cause for the decrease in inhibition, the parallel use of the two-voltage and use-dependent protocols would enable these compounds to be singled out for potential follow up with mEP or even behavioral experiments.
The 3 s recovery pulse in the two-voltage recovery protocol facilitates the identification of compounds with fast recovery rates and allows their state dependence to be determined (i.e., Compounds A1 and T4). For these compounds, the degree of inhibition was similar at both recovery time points, implying that the block had relaxed back to closed state levels. This was confirmed using the follow-up closed state protocol. In contrast, very slow recovery kinetics can mask true state dependence in the two-voltage recovery assay. An example of this is Compound A2, where the inactivated, 3 s, and 15 s recovery measurements all showed a similar block. In cases such as this, the follow-up closed state protocol is required to distinguish slow kinetic compounds from ones with no state dependence. For Compound A2, the closed state protocol resulted in reduced block, thereby identifying this compound as a state-dependent inhibitor with very slow kinetics.
When using only one or two concentrations of compounds during compound screening with the two-voltage recovery protocol, it should be recognized that the related kinetics or state-dependence data can be influenced by where the selected concentrations fall in the concentration response curve. Ideally, direct comparisons should only be made between compounds showing similar levels of inactivated state block. In Figures 2 and 4, for example, comparisons were only made across compounds using concentrations that produced inactivated block ranging from 50% to 75%. This range was also selected, because it provided a more sensitive window for visualizing recovery kinetics. To help guide initial concentration selections, results from an IMR-32 FLIPR assay (described in Vortherms et al. 21 ) were used. Additionally, we found that the degree of inactivation at a given membrane potential could vary slightly depending on cell passage. An advantage of the current assay is that the degree of inactivation can be monitored for each individual cell and across runs by comparing the current elicited from the hyperpolarizing membrane potential with the current elicited from the inactivating step. The depolarizing voltage can then be adjusted so that similar inactivation levels are used over time. Overall, the difference in the inactivation over passages was relatively small, and the depolarizing voltage was only varied between −75 and −80 mV to maintain the targeted inactivation levels. The use-dependent assay can also be designed to produce a similar degree of inactivation as the two-voltage protocol in order to make comparisons more relevant.
As with any assay, it is also important to consider potential limitations. The two-voltage recovery protocol inactivates the CaV2.2 channels using a 15 s depolarization followed by 15 s of recovery at a hyperpolarized membrane voltage. The potential exists to underestimate potencies if the block has not reached s.s. after the 15 s of inactivation. For TROX-1 and Compound P1, the data from the use-dependent protocol suggest that the equilibrium block is largely reached within the 15 s time frame (45 pulses). However, for some compounds, the equilibrium block was not achieved, as the block continued to accumulate during successive cycles. Additionally, right shifts in potency sometimes occur on automated platforms, which are believed to be the result of nonspecific binding to compound plates, pipettes, and/or recording wells. 22,23 These factors could contribute to the current data set, as there are right shifts relative to mEP. TROX-1 showed an approximate eightfold right shift relative to published data (48% block at 3 μM on the QPatch vs. a 0.4 μM IC50 by mEP 15 ). The triazines Compounds T3 and T4 were assessed by mEP and showed shifts of approximately fivefold (60% block at 3 μM on the QPatch vs. a 0.39 μM IC50 by mEP for Compound T3 and 5.9 μM on the QPatch vs. a 1.1 μM IC50 value by mEP for Compound T4). It should also be noted that these mEP protocols utilized a constant depolarizing potential for inducing inactivation. Thus, these mEP values may be related to the block involving slower inactivated states of the channel as has been suggested for varied sodium and calcium channel inhibitors. 24 –26 Regardless, the utility of the current assay is that it can differentiate compounds based on both kinetics and state dependence. Furthermore, the inactivated, recovery and closed state block data are all generated on the same instrument using the same or closely related voltage protocols. These data can then be readily compared, and compounds of interest with differential profiles can be prioritized for follow-up characterization in additional in vivo and in vitro assays.
There is a relatively poor understanding of the exact neuronal activities that drive pain and underlie potential CaV2 mechanism-based cardiovascular and CNS side effects. For this reason, it is difficult to predict what combination of state dependence and kinetics will provide the optimal therapeutic utility for a CaV2 inhibitor. This uncertainty highlights the need for exploring compounds with a range of kinetic profiles and of identifying tool compounds. From a drug discovery perspective, the assays presented here can be utilized at the multiple stages of a program. In the early stages, when initial leads are being selected, these assays can help assure mechanistic diversity in the compound classes being explored. This strategy should help maximize the chances of success when the ideal blocking mechanism/profile is unknown. During lead optimization, these assays can facilitate a more informed structure-activity relationship (SAR) within and across chemical classes and can continue to be used to identify compounds with differing profiles. Finally, these assays can be used to identify tool compounds for improving our understanding of how compound kinetics might influence in vivo profiles. As the field progresses and additional compounds with favourable safety margins are identified, it will be interesting to see whether they appear to be associated with certain kinetic and/or state-dependent profiles.
Footnotes
Acknowledgments
The authors would like to acknowledge the Abbott Electrophysiology group for helpful discussions concerning state dependence and kinetics and thank their chemistry colleagues for providing the compounds used in these studies.
Disclosure Statement
No competing financial interests exist.