




Abstract
In recent years, the increased use of cell-based functional assays for G protein-coupled receptors in high-throughput screening has enabled the design of robust assays to identify allosteric modulators (AMs) in addition to the more traditional orthosteric agonists and antagonists. In this article, the authors describe a screening format able to identify all ligand types using a triple-add assay that measures changes in cytosolic calcium concentration with three separate additions and reads in the same assay plate. This triple-add assay captures more small molecule ligand types than previously described assay formats without a significant increase in screening cost. Finally, the customizability of the triple-add assay to suit the needs of various AM screening programs is demonstrated.
Introduction
G Protein-Coupled Receptors Comprise One of the Most Important Classes of Pharmaceutical Targets
Allosteric Modulators of GPCRs Present a New Frontier in Drug Discovery
GPCR binding sites divide into two general categories: orthosteric and allosteric. Orthosteric sites are defined as those that bind an endogenous agonist. Allosteric sites are defined as any site on the receptor other than the orthosteric site. GPCR-based drug discovery has historically focused on orthosteric agonists and competitive antagonists. More recently, pharmaceutical companies have steered their focus toward allosteric modulators (AMs), which can have several advantages over their orthosteric counterparts.
Some allosteric ligands can have intrinsic agonist activity (allosteric agonists). AMs bind to an allosteric site on the target receptor without necessarily eliciting any activity on their own but instead modulate the activity of orthosteric agonists. 2,7,8 These AMs are typically divided into three general categories: positive, negative, and silent. Positive allosteric modulators (PAMs) bind to an allosteric site and increase the potency or the efficacy (or both) of an orthosteric agonist. Negative allosteric modulators (NAMs) bind to an allosteric site and decrease the potency or efficacy of an orthosteric agonist. Silent allosteric modulators (SAMs), also called neutral allosteric ligands, bind to an allosteric site without significantly modifying orthosteric agonist activity. The SAM will, however, competitively inhibit PAMs and NAMs from binding to the same allosteric site.
Recent work has revealed AMs that behave somewhere in between PAMs/NAMs and SAMs. Even at saturating concentrations, these compounds exhibit very small positive or negative modulatory effects that can be missed if compound activity is not measured with great precision. It therefore follows that a putative SAM may simply exhibit extremely weak efficacy modulation, resulting in only small leftward or rightward shifts of the orthosteric agonist concentration–response curve (CRC). Thus, for the purposes of this article, the term “silent allosteric modulator” will be accompanied by use of the term “weak allosteric modulator” (WAM). Nevertheless, we will differentiate between weak positive modulators and weak negative modulators.
AMs offer several potential advantages over orthosteric agonists and antagonists. PAMs have the potential to initiate different signaling cascades than orthosteric agonists. 9 Additionally, PAM-based therapeutics can maintain endogenous regulation of receptor activity, simply amplifying the receptor response to endogenous agonist when it is present. 10 This is in contrast to agonist therapeutics, which can activate a response regardless of the presence or absence of the endogenous agonist. Maintaining endogenous receptor regulation may allow PAM-based therapeutics to exhibit fewer adverse side-effects than agonist therapeutics.
Allosteric ligands can exhibit greater receptor selectivity than orthosteric agonists. 2 Current hypotheses propose that the highly conserved nature of orthosteric (i.e., endogenous) agonist-receptor interactions have prevented orthosteric sites from diverging as evolution produced new subtypes within receptor families. In other words, mutations at orthosteric sites are strongly selected against such that they diverge very little as a given receptor evolves. Allosteric sites, however, do not have these constraints and may diverge more significantly. For example, orthosteric agonists of the muscarinic acetylcholine receptor have shown poor selectivity among the five subtypes (M1–M5), while allosteric ligands have shown the desired selectivity. 11
Allosteric ligands often possess what is termed a “knife-edge” structure–activity relationship such that they can be switched from one compound class (e.g., a NAM or SAM) into another (e.g., a PAM) with slight chemical modifications. For example, modest chemical modifications of benaldazine analogs can turn PAMs into NAMs, or SAMs of the metabotropic glutamate receptor subtype 5 12 (Fig. 1). We can conclude from this phenomenon that, even if a chemotype containing our desired PAM is not represented by the PAM in our compound library, it may be represented by a related NAM, SAM, or allosteric agonist. Thus, when designing a screening program to identify (for example) PAMs, it is also desirable to identify NAMs, WAMs, SAMs, and allosteric agonists; because a “hit” from any one of these compound classes could identify a chemotype capable of yielding the desired PAM or NAM effect following some minor chemical modifications. Even in the case where a given chemotype is already known, the identification of compounds with differing modes of action from the same chemotype can provide additional information about the structure–activity relationship that can be used to inform chemistry and help to delineate the structural determinants of affinity for the allosteric site versus activity at that site. Finally, while unlikely to be therapeutically useful, SAMs can have great utility as tool compounds for evaluating the receptor specificity of effects produced by other AMs. Therefore, screening approaches that can identify all classes of modulator for a given receptor are desired.
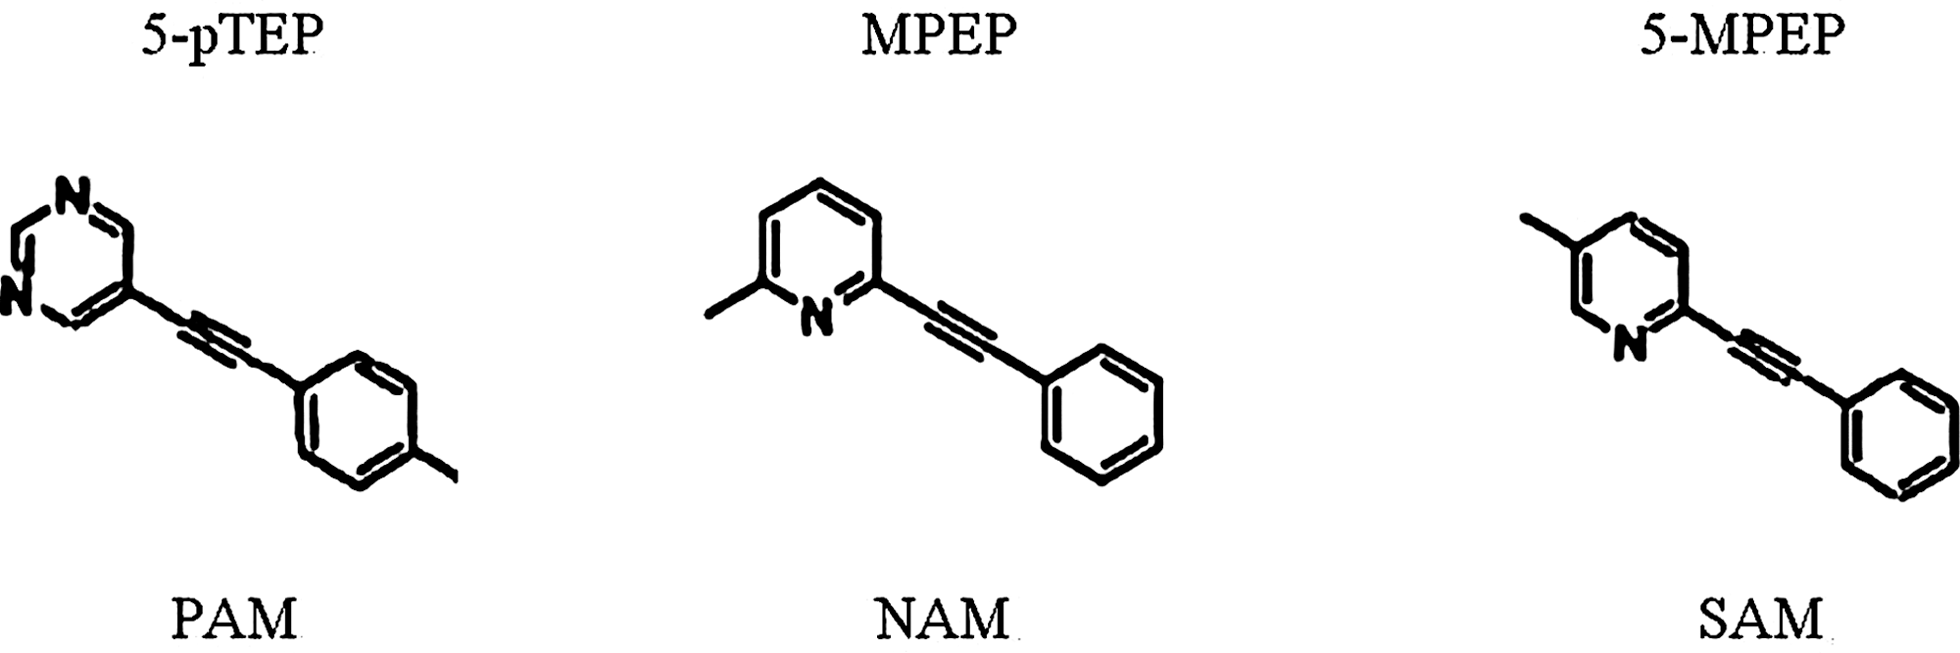
Minor modifications to these benaldazine analogs can change their modulator activity between PAMs, NAMs and SAMs at the mGluR5 receptor. 12 NAM, negative allosteric modulator; PAM, positive allosteric modulator; SAM, silent allosteric modulator.
Identifying AMs with FLIPR: Limitations of the Double-Add Assay
Instruments such as the FLIPR, used along with calcium-sensing dyes such as Fluo-4, are popular tools in screening programs to measure intracellular calcium levels as a surrogate for GPCR activity. 13 In fact, non-Gαq coupled GPCRs are often expressed in recombinant cell lines along with a hybrid Gαq-Gαi/o or Gαq-Gαs protein to enhance the ability of tools such as FLIPR to measure target GPCR activity. 14 Thus, FLIPR presents a robust, high-throughput platform to screen for GPCR-manipulating small molecules.
In PAM screens using dynamic calcium flux assays, two challenges to the assay plate (the plate that contains cells and is measured by the camera on FLIPR) are often used. 15 Such a format involving two challenges, or two separate treatments of the cells on the assay plate, is referred to here as a “double-add.” The first read occurs while adding test compound to the assay plates. If the compound in question exhibits agonist activity (either orthosteric or allosteric) the cells should elicit a response (usually within 30 s) during this first read. The second read can vary depending on whether the screen is designed to detect PAMs or NAMs/antagonists. In a PAM-mode detection screen, the second addition consists of a low concentration of orthosteric agonist. The exact concentration used can be optimized based on factors that include the observed Hill Slope for the agonist in the assay system, 7 but typically is around EC20 or below, and for simplicity is always referred to as EC20 within this article. A “pure” PAM (one that has no intrinsic agonist activity) would exhibit no agonist response in the absence of orthosteric agonist (first read) but would potentiate the response to an EC20 of orthosteric agonist (second read). In a NAM/antagonist-mode detection screen, the second addition consists of an EC80 of agonist. Again, no agonist response is expected in the first add, but NAMs and antagonists will inhibit the second, EC80 challenge of orthosteric agonist.
Using a double-add format, screens can identify either two compound ligand types (agonists and PAMs in PAM mode detection) or three compound ligand types (agonists, competitive antagonists, and NAMs in NAM/antagonist mode detection). To maximize the chance of identifying useful chemotypes, a screening program attempting to identify all compound ligand types using the double-add format requires multiple assay plates. By increasing the number of assays, however, the price of screening a large compound library can become prohibitive. Thus, obtaining more reads from a single plate could allow a screening program to identify more relevant chemotypes by capturing more compound classes using a single assay plate.
Identifying All Ligand Types with One Screen: The Triple-Add Assay
In this article, a screening format that uses three challenges in the same assay plate, referred to as a “triple-add” screen, is described. A triple-add screen can obtain all the information normally gathered in multiple double-add assays. The first two additions parallel to those of a double-add PAM-mode detection screen: addition of compound (first read) followed by an EC20 of orthosteric agonist (second read). The optimal third addition depends on the target being screened. When screening with a target receptor that has no tool AMs, the third addition would be a NAM/antagonist mode detection screen (i.e., adding an EC80 of agonist). This treatment paradigm is referred to as “EC80.” In this triple-add format, four compound ligand types could be identified: agonists from the first read, PAMs from the second read, and NAMs and competitive antagonists from the third read. Triple-add screening formats using an EC80 challenge during the third read have been previously described. 16 However, such screening formats still have the disadvantage of being incapable of detecting SAMs/WAMs.
If tool PAMs or NAMs have already been discovered for a target, the triple-add paradigm can be further optimized to capture WAMs/SAMs (in addition to agonists, PAMs, NAMs, and competitive antagonists), which might otherwise be missed using the “EC80” paradigm. Instead of adding an EC80 of orthosteric agonist, an EC20 of orthosteric agonist can be combined with an appropriate concentration of known PAM to raise agonist response up to an EC80 level. Ideally, the concentration of PAM used would be less than or equal to its EC80 (for increased sensitivity of the assay for detecting WAMs and SAMs). This treatment paradigm is referred to as “EC20+PAM.”
Alternatively, the third add can consist of an EC80 orthosteric agonist+NAM, where the NAM reduces the agonist EC80 response to the level equivalent to an EC20 agonist response. This treatment paradigm is referred to as “EC80+NAM.” This approach optimizes the probability for detecting SAMs/WAMs (especially low efficacy PAMs) that bind to the same allosteric site as the tool NAM. However, this assay gives up the ability to detect high efficacy NAMs.
The rationale for “EC20+PAM” and “EC80+NAM” modes assumes that the AMs of interest interact at the same allosteric site and compete for allosteric site binding. The combination of competitive binding at the allosteric site (between the known PAM or NAM and the test compound) together with their effects on orthosteric agonist potency, results in an increased signal window compared with the second add PAM detection mode and the third add “EC80” agonist mode, described above.
The validation and utility of these different triple-add assays are demonstrated using cells recombinantly expressing Gq-coupled GPCRs and tool molecule AMs identified internally.
Methods
Cell Culture
CHO cells stably expressing recombinant human receptors were cultured in tissue culture treated T-175 flasks (Corning) in medium (Dulbecco's modified Eagle's medium/F12 [Gibco 11039], 10% fetal bovine serum [FBS; Hyclone, ATD31921], and appropriate selection antibiotics), at 37°C, 5% CO2. Cells were harvested and plated in 1,536-well (Corning 3838) tissue culture treated black/clear plates 16–20 h prior to the experiment. Briefly, flasks were rinsed with 10 mL/flask Dulbecco's phosphate-buffered saline (magnesium and calcium free; Gibco # 14040) and incubated in 5 mL/flask of 0.05% trypsin-ethylenediaminetetraacetic acid (Gibco 25300) at 37°C for 5 min. Medium (Dulbecco's modified Eagle's medium/F12 [Gibco 11039]+10% FBS [Hyclone, ATD31921]+1% penicillin-streptomycin [Gibco 15140]) was added to the harvested cells, then the cells were pelleted using a tabletop centrifuge at 1,200 RPM for 10 min. The cell pellet was resuspended in 10 mL/flask medium, counted on the Guava Personal Cell Analysis System (Guava Technologies), and diluted with medium to a concentration of 360,000 cells/mL. Cell suspension was added at 5 μL/well (1,800 cells/well) to plates that were then incubated at 37°C, 5% CO2 overnight.
Compound Plate Preparation
Compounds were solubilized in dimethyl sulfoxide (DMSO, EM Science; MX 1458-6) at either 10 mM or 3 mM and then serially diluted in DMSO in half-log increments in 384-well polypropylene microplates (REMP, 23490-104). Compounds were transferred (5 μL/well) to either 384-well LDV ECHO master plates (Labcyte) or 1,536-well ECHO master plates (Labcyte). Compounds were transferred to intermediate plates from master plates via acoustic dispensing using the ECHO-550 (Labcyte). Subsequently, the aqueously diluted intermediate plates were used to add compounds to the assay plates on the FLIPRTETRA. Intermediate plates were created and diluted (standard 1,536-well white plates, Corning 3725). The dilutions consisted of 54.5-fold (3.67× final conc., 147.5 nL compound [transferred by ECHO] in 8 μL Hanks buffered salt solution [HBSS]/20 mM 4-(2-hydroxyethyl)-1-piperazineethanesulfonic acid [HEPES], used in the first addition); 42.8-fold (4.67× final conc., 187.5 nL compound [transferred by ECHO] in 8 μL HBSS/20 mM HEPES, used as a second addition); or 35.3-fold (5.67× final conc., 227.5 nL compound [transferred by ECHO] in 8 μL HBSS/20 mM HEPES, used for third additions).
Ca2+ Flux Assay
All Ca2+ flux assays were performed as described in Table 1. After overnight incubation, the medium was removed from the cells by aspiration using an Aquamax (Molecular Devices) at a height of 0.3 mm, followed by addition of 4 μL /well of 3 μM Fluo4-AM (Molecular Probes, F14202), 0.016% pluronic acid (Sigma, P-2443), and 2.5 mM probenecid (Sigma, P-8761), in HBSS/20 mM HEPES. Plates were incubated for 1 h at room temperature prior to assay in the FLIPRTETRA (Molecular Devices). For all additions, the FLIPRTETRA reads a baseline once per second for a 10 s prior to compound addition followed by 50 s at a 1-s interval and 60 s at a 3-s interval. For the first addition, 1.5 μL/well of a 3.67× compound solution was added at a height of 3.5 μL with 2× mixing of 2 μL at a height of 3.5 μL. For the second addition (when used), 1.5 μL /well of a 4.67× compound solution is added at a height of 3.5 μL with 2× mixing of 2 μL at a height of 3.5 μL. For the third addition (when used), 1.5 μL /well of a 5.67× compound solution is added at a height of 3.5 μL with 2× mixing of 2 μL at a height of 3.5 μL.
Calcium Flux Assay Protocol
Step Notes
1. 1,536-well black/clear low base tissue culture treated plates (Corning 3838), cells added with Combi dispenser at high speed.
2. Plates are lidded during incubation.
3. Compounds need to be in Echo compatible plates prior to step 4.
4. Compound added with Echo acoustic dispenser, followed by aqueous buffer (HBSS supplemented with 20 mM HEPES, pH 7.5) dispensed with a Combi at high speed into 1,536-well white plates, Corning 3725. For a solution of 3.7× final concentration, dispense 147.5 nL compound and 8 μL HBSS/20 mM HEPES. For a solution of 4.7× final concentration, dispense 187.5 nL compound and 8 μL HBSS/20 mM HEPES. For a solution of 5.7× final concentration dispense 227.5 nL compound in 8 μL HBSS/20 mM HEPES.
5. Dilute required amount of agonist in HBSS supplemented with 20 mM HEPES, pH 7.5. Depending on assay, 4.7× or 5.7× final concentration is needed.
6. Dilute required amount of PAM or NAM in DMSO. Depending on assay, 550× or 350× final concentration is needed. Dispense to Echo compatible plate prior to assay.
7. Aquamax dispenser−0.5 mm probe height, no delay at bottom of well.
8. 3 μM Fluo4-AM, 0.016% pluronic acid, 2.5 mM probenecid, in HBSS/20 mM HEPES—added with Combi dispenser at medium speed.
9. Plates are lidded during incubation.
10. For all additions, the FLIPRTETRA reads once a second for 10 s prior to compound addition (1.5 μL/well at a height of 3.5 μL with 2× mixing of 2 μL at a height of 3.5 μL) followed by 50 s at a 1-s interval and 60 s at a 3-s interval. Tips are washed 2× with water, three strokes of 3 μL for each wash. Result is taken as the maximum fold increase over baseline, where the baseline is the average of the first 8 reads and the maximum is taken starting at read 15.
DMSO, dimethyl sulfoxide; HBSS, Hanks balanced salt solution; NAM, negative allosteric modulator; PAM, positive allosteric modulator.
Desensitization/Time Course Assay
The intermediate plate for treatment 1 (first addition) contained a 16-point half-log serial dilution of orthosteric agonist across all rows. The intermediate plate for treatment 2 (second addition) contained 8-point half-log serial dilutions of the same orthosteric agonist across all columns. The time between additions was varied as described.
Double-Add Assay Paradigms
• Double-add “EC20” PAM detection mode. First addition of compound (3.67×) followed by a 15-min incubation, then the second addition (4.67×EC20 agonist.)
• Double-add “EC80” NAM/antagonist detection mode. First addition of compound (3.67×) followed by a 15-min incubation, then the second addition (4.67×EC80 agonist.)
• Double-add “EC20+PAM” weak PAM/NAM/antagonist detection mode. First addition of compound (3.67×) followed by 10 nL/well addition of 550× EC80 PAM in DMSO using ECHO dispenser (Labcyte). After 15-min incubation, the second addition is performed (4.67× EC20 agonist.)
Triple-Add Assay Paradigms
For all triple mode assays the first two additions are identical to the PAM mode double-add assay paradigm described above. The third read is as follows for various assay formats:
• Triple-add “EC80” NAM/antagonist detection mode. Third addition=5.67×EC80 agonist added 15 min after second addition.
• Triple-add “EC20+PAM” weak PAM/NAM/antagonist detection mode. During the 15 min incubation between the second and third add, dispense 20 nL/well of 350× EC80 PAM in DMSO using ECHO dispenser. After 15 min incubation, the third addition is performed (5.67× EC20 agonist.)
• Triple-add “EC80+NAM” weak PAM detection mode. During the 15 min incubation between the second and third add, dispense 20 nL/well of 350× EC80 NAM in DMSO using ECHO dispenser. After 15 min incubation, the third addition is performed (5.67× EC80 agonist.)
Data Analysis
Raw data files were exported from the FLIPR ScreenWorks software. Maximum fold increase in fluorescence was determined by dividing the maximum value of fluorescence obtained after compound addition by the average of the baseline values taken before compound addition. These values were analyzed using GraphPad PRISM™. EC50/IC50 values were calculated using non-linear regression (sigmoidal dose response, variable slope) and correlation plots were analyzed with linear regression.
Results and Discussion
Desensitization Is a Potentially Limiting Factor for the Triple-Add
Desensitization is a commonly observed, yet incompletely understood, component of GPCR signaling in which initial activation of a GPCR signaling pathway hinders the ability of the pathway to be activated a second time. Desensitization can occur at many points of the signaling pathway, from receptor inactivation to calcium store depletion. 17 –19 When using dynamic Ca2+-based assays to measure GPCR activity, assay-related mechanisms could also cause desensitization-like effects. For example, if GPCR activation induces Fluo-4 dye depletion or excretion from the cells, initial challenges that activate GPCRs would hinder the measurement of responses to subsequent agonist challenges. Thus, because the triple-add assay relies on serial agonist additions, it is important to characterize the potential effects of desensitization in this assay format.
Characterization of Desensitization in Cellular System Prior to Triple-Add Screen
Initial experiments were conducted using a Class A GPCR target of interest to validate the use of the EC20 agonist (PAM detection mode) second addition to show that this had no desensitizing effect on the third addition step. Understanding this desensitization phenomenon is very important in validating a triple-add screen, as the characteristics of agonist concentration and time interval may vary significantly from one receptor and/or cell-line to another. Cells were challenged with varying concentrations of agonist in a first addition (mimicking the second addition of a triple-add screen; Fig. 2A–C). After different time intervals, ranging from 5 to 45 min, an agonist CRC was generated with a second addition of the same agonist (mimicking a third addition in a triple-add screen). This allowed analysis of the effect of various initial concentrations of agonist on subsequent potency and Emax responses for the same agonist. At this receptor, an initial EC20 concentration of agonist (2 nM) does not cause significant desensitization of the potency (EC50; Fig. 2D) or maximum effect (Emax; Fig. 2E) elicited by the second addition of agonist following incubation times ranging from 5 to 45 min. The possibility that test compounds may exhibit activity significantly greater than an EC20 of agonist during either of the first two reads (of a triple-add screen) does not cause concern, as the screen will already identify those compounds as agonists or PAMs, and their third read characteristics will not be important. It should be noted that desensitization of the agonist response was indeed observed, however, this was only produced by agonist concentrations significantly higher than the EC20. Interestingly, this desensitization was most pronounced at the earliest time point tested (5 min) following the first addition, and the agonist response appeared to recover over time, even though the agonist was never removed and the cells were never washed in any way.

Characterizing desensitization of a Gq-coupled Class A GPCR:
To assess the general applicability of the triple-add assay to multiple GPCR systems, we tested two additional GPCRs (one Class C and an additional Class A GPCR) for desensitization in the triple-add format (Fig. 3). The Class C GPCR exhibited no change in agonist potency nor Emax after stimulation with an EC20 of agonist (Fig. 3A, B). Like the first (Class A) GPCR tested, this GPCR did show desensitization of repeated agonist responses, but only following treatment with agonist concentrations significantly higher than the EC20. Also like the first GPCR tested, desensitization of the Class C GPCR assay was most pronounced at 5 min, with recovery observed over time.
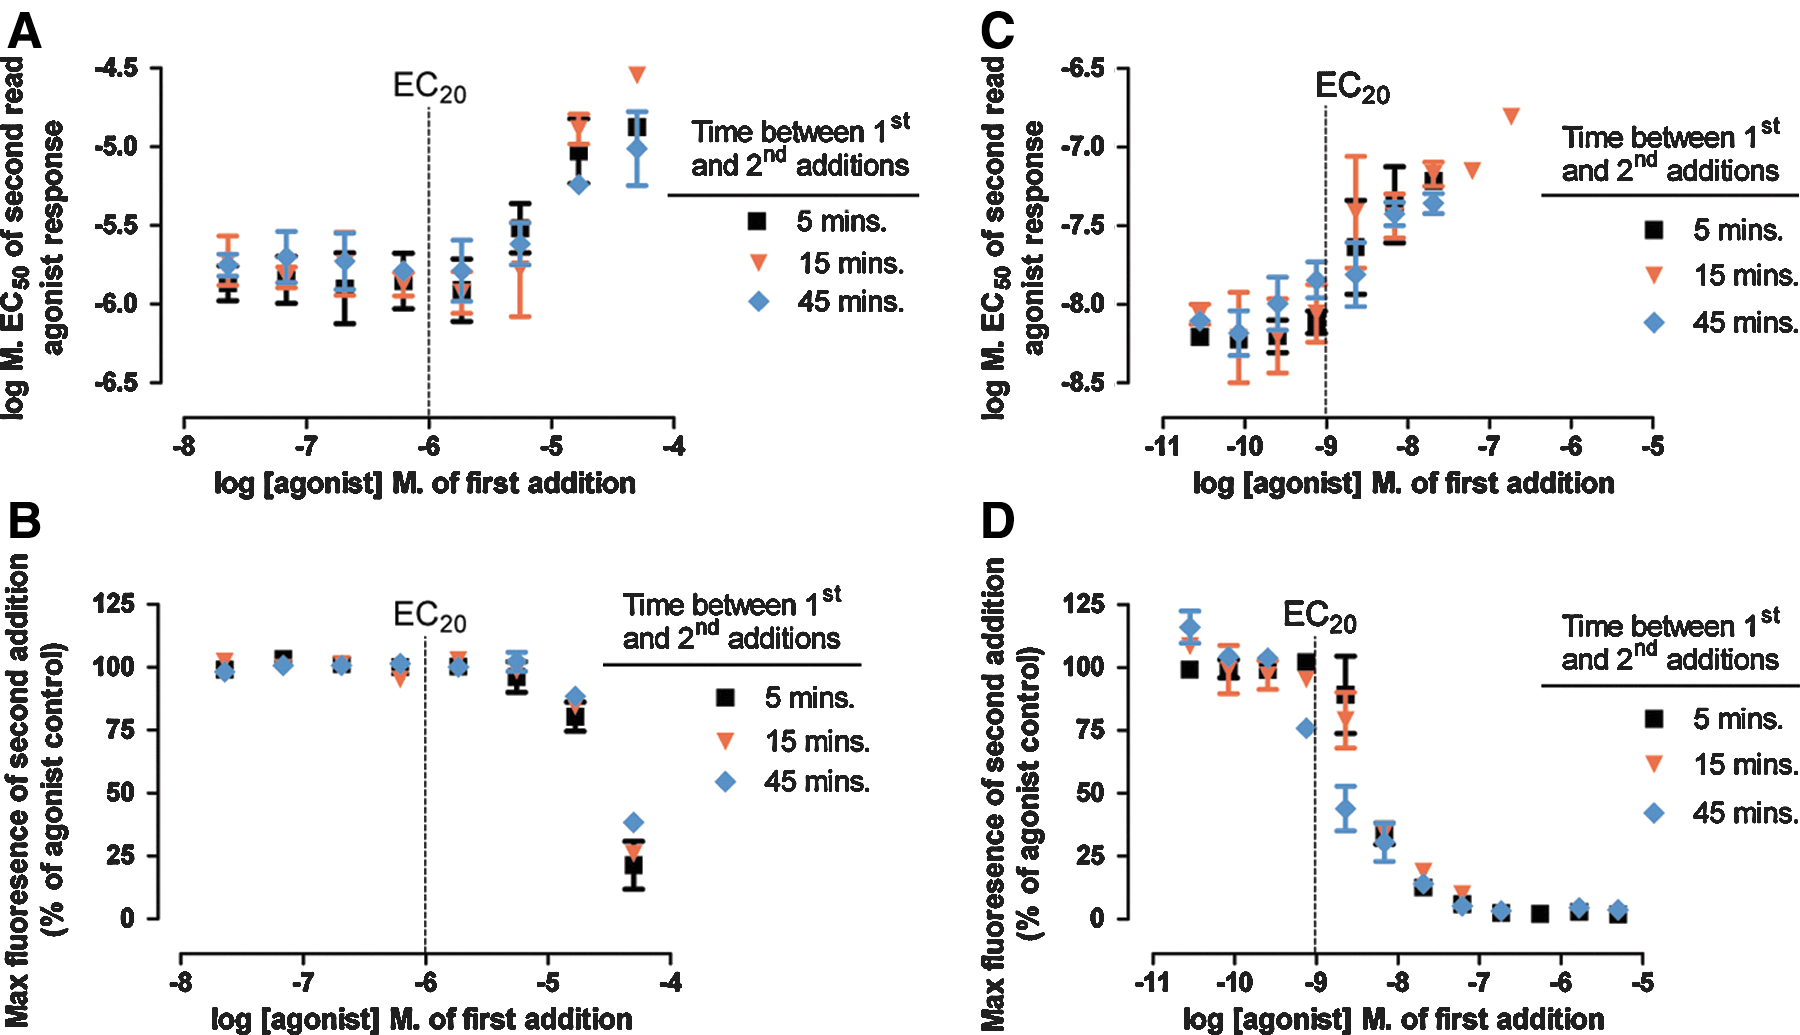
Characterizing desensitization of two additional Gq-coupled GPCRs: combined data from three experiments (mean±SEM) using a Class C GPCR
For the second Class A GPCR tested, an EC20 concentration of agonist caused a slight decrease in agonist potency and Emax (Fig. 3C, D). Unlike the other two GPCRs tested, recovery of agonist responses was not observed; in fact desensitization of agonist responses was more noticeable with longer incubation times. The reasons for the differences in desensitization profiles between the three receptors studied are unclear. However, these results underscore that the behavior of each GPCR system is unique. We therefore conclude that desensitization conditions must be analyzed as part of assay design for any receptor system when considering the triple-add screening format. Receptors that do exhibit some level of desensitization will require a higher level of agonist in the third read, and receptors that exhibit extreme desensitization may not be suitable for a triple-add format. It should be noted that in the end, triple-add high-throughput screen (HTS) assays were successfully optimized for all three of the GPCRs described here.
The Triple-Add Format Can Identify NAMs and Antagonists as Effectively as the “Double-Add” Format
To verify that the triple-add third addition of an EC80 agonist (following an EC20 agonist second addition) was as sensitive for detecting NAMs and antagonists, compared to an EC80 agonist second addition (in a double-add format), CRCs of known NAMs and antagonists were assayed and IC50 values determined using both approaches. Figure 4 shows the correlation of IC50 values for known NAMs and antagonists generated using the EC80 agonist double-add format (x-axis) versus an EC80 agonist triple-add format (y-axis). Detection of NAMs and antagonists were not significantly different between the double-add and triple-add formats, with a correlation slope of 1.00±0.02 and a Y-intercept when X=0 of 0.2±0.2.
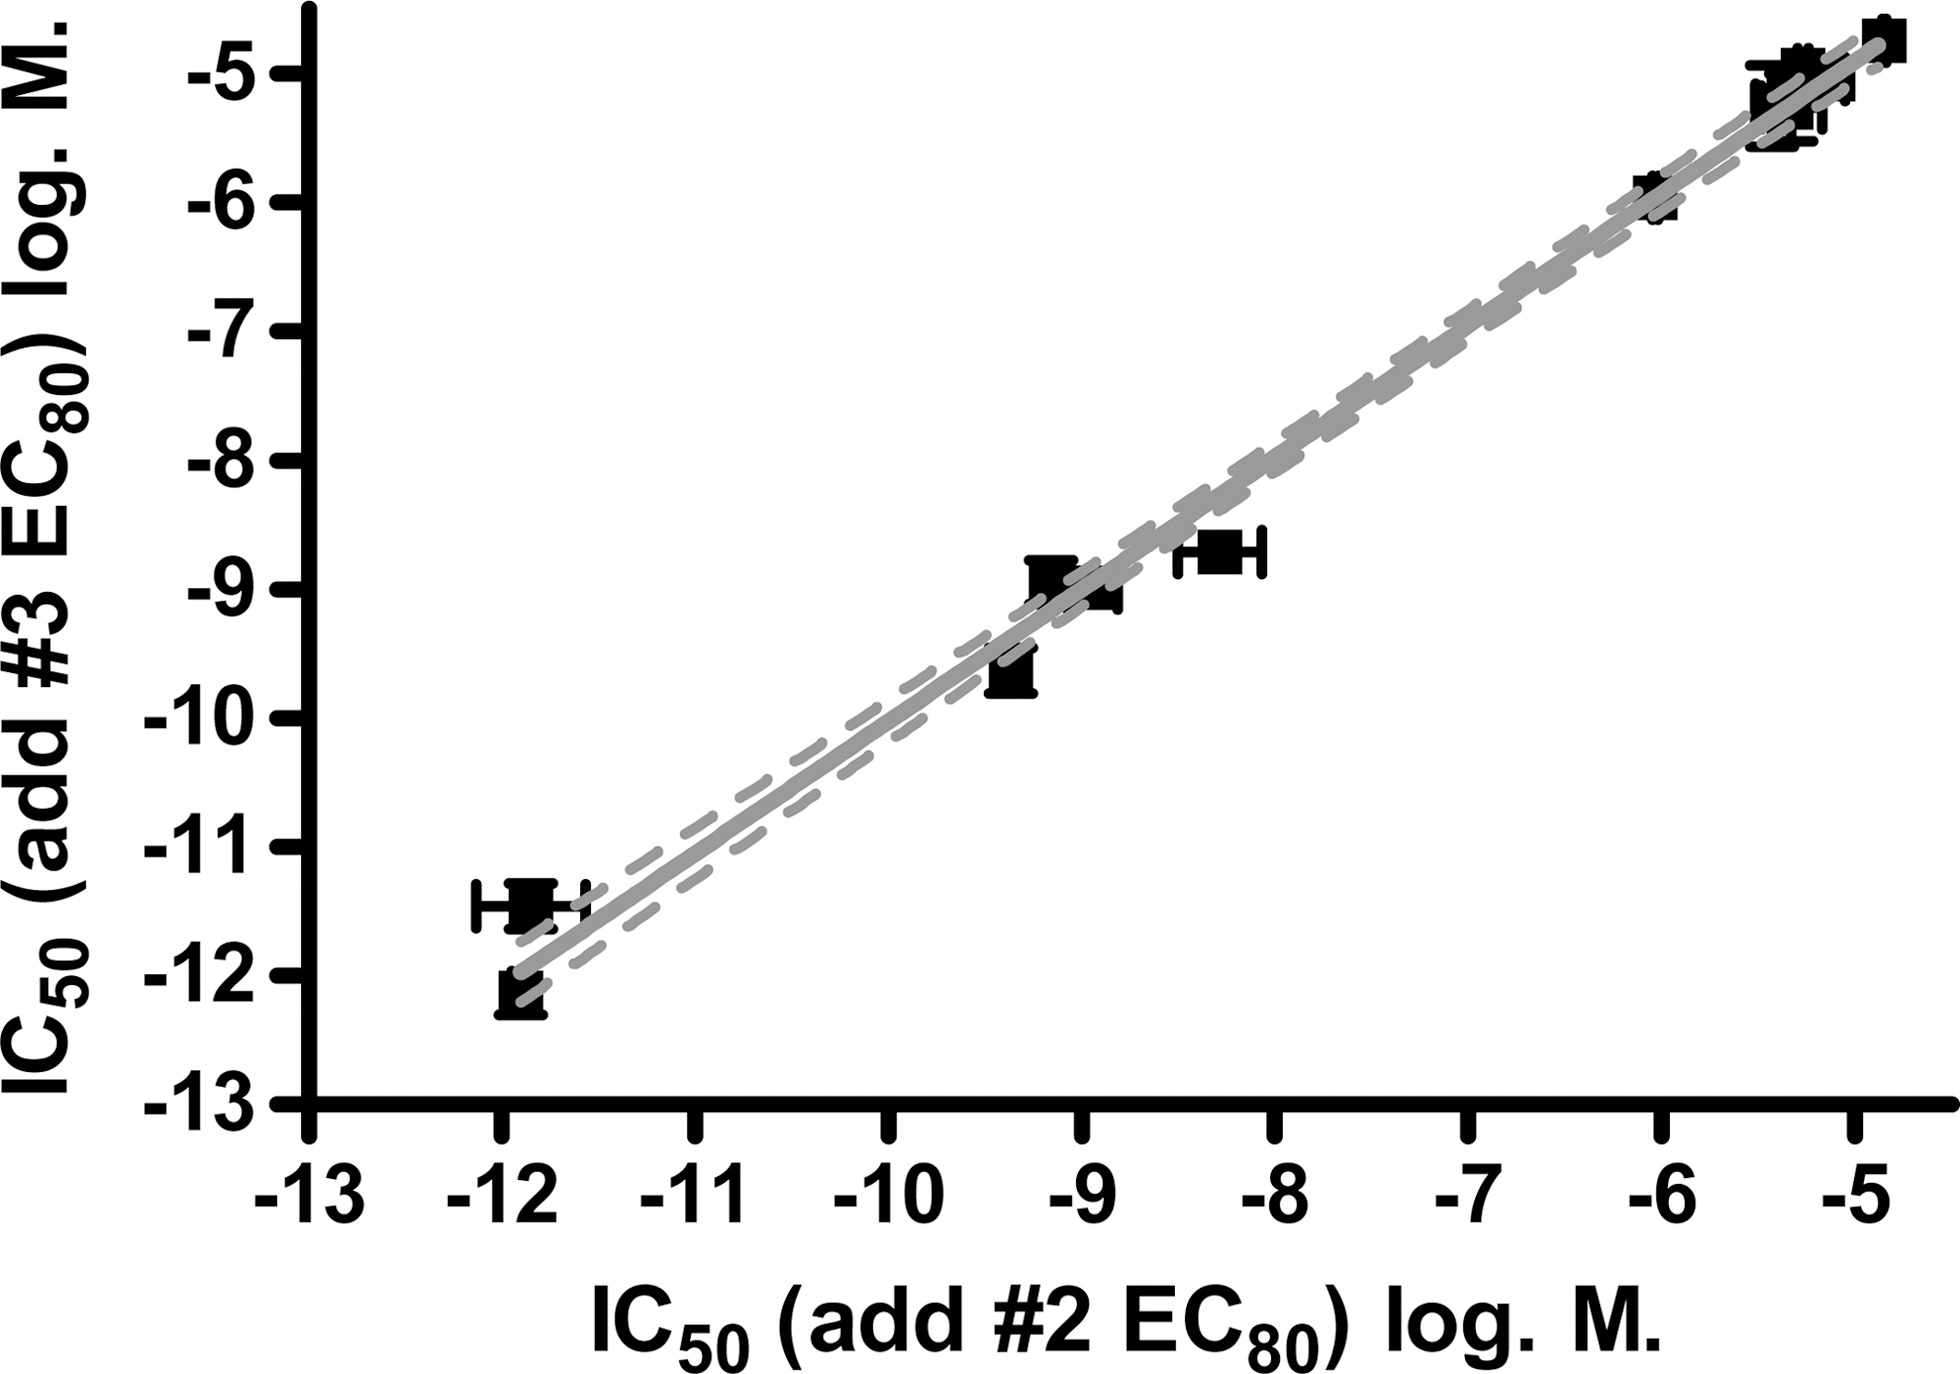
Correlation plot comparing IC50s (mean±SEM of three experiments) of known competitive antagonists and NAMs in double-add format (x-axis) and triple-add format (y-axis) with an EC80 addition of agonist.
WAM/NAM/Antagonist Mode (EC20+PAM) Can Identify NAMs and Antagonists as Effectively as NAM/Antagonist Mode (EC80)
In the introduction, it was suggested that an “EC20+PAM” third addition in a triple-add screen might be advantageous over an “EC80” third addition because it may also detect WAMs/SAMs that competitively displace the PAM from the same allosteric site. However, this method of testing would be significantly less desirable if it reduced sensitivity for detecting competitive antagonists and NAMs in the third read. This was tested with known competitive antagonists and NAMs (Fig. 5), where IC50s were determined using either the third add “EC80” (x-axis) or “EC20+PAM” (y-axis) format. There was no significant difference between IC50s generated for antagonists or NAMs in the “EC20+PAM” versus “EC80” third additions. Correlation plots of the IC50s for antagonists using the two formats yielded a slope of 0.99±0.03 and a y-intercept when x=0 of −0.1±0.2. Correlation plots of the IC50s for NAMs alone (Fig. 5, inset) yielded a slope of 1.10±0.22 and a y intercept when x=0 of 0.2±1.2. These data show that the “EC20+PAM” format is equally sensitive to the “EC80” format for detecting competitive antagonists and NAMs (which bind to the same site as the PAM).
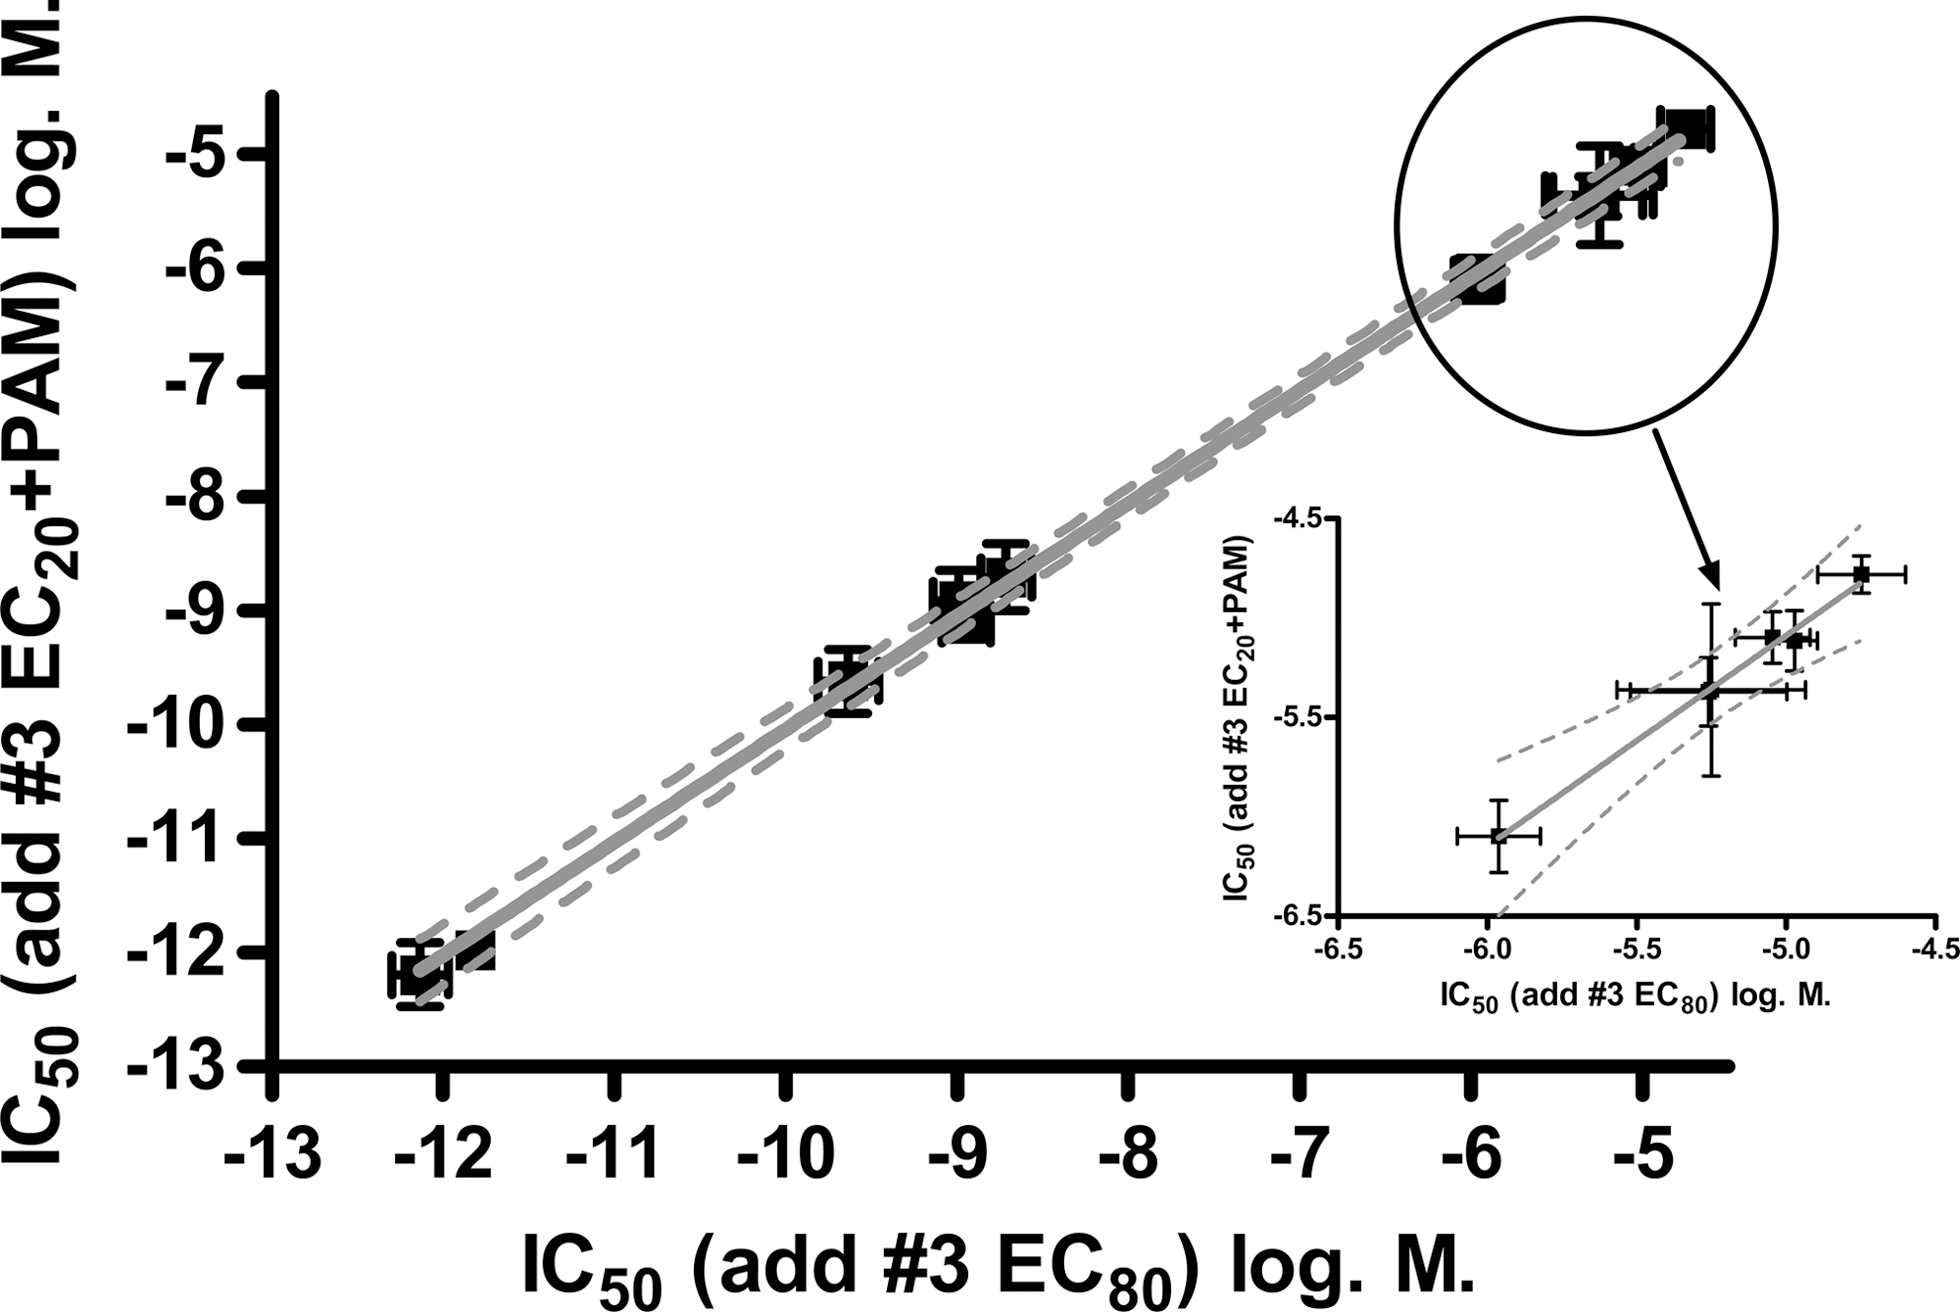
Correlation plot of the IC50 values (mean±SEM of three experiments) for six antagonists and six NAMs using an “EC80” (x-axis) or an “EC20+PAM” (y-axis) triple-add format. The six NAMs, which ranged in potency from 1 to 20 μM, are expanded (inset).
Theoretically, competitive antagonists would inhibit an EC20 concentration of agonist with a lower IC50 than is required to inhibit an EC80 concentration of agonist. An EC80 of agonist is typically used for functional antagonist screens, because it provides the necessary signal window for detecting inhibitory responses while maintaining a reasonable level of sensitivity for detecting antagonists in a screen. However, if the EC20 agonist response is enhanced by a PAM to levels approaching an EC80 of agonist alone, it could conceivably have a greater sensitivity for detecting competitive antagonists with no loss of screening signal window. This was not observed, as IC50 values for both competitive antagonists and NAMs were the same whether the challenge stimulus came from “EC80” of agonist alone or from “EC20+PAM.” One hypothesis for this finding is that the presence of PAM increases the affinity of the agonist for the orthosteric site, leading to greater receptor occupancy at a given, albeit lower, agonist concentration. If this occupancy level matches the occupancy level observed with a higher, EC80 concentration of agonist in the absence of PAM, there will be no change in observed IC50 values for the antagonists.
To assess performance of the WAM/NAM/antagonist mode (EC20+PAM) triple-add assay in HTS conditions, Z′ data were generated using several tool compounds: an agonist, PAM, NAM, and SAM (Fig. 6). The agonist was able to be detected in the first (agonist) read with a Z′ value of 0.74. The Z′ score for a tool PAM during the second (PAM) read was 0.51. The final (antagonist/SAM) read detected a tool NAM with a Z′ of 0.86 and a tool SAM with a Z′ of 0.58.
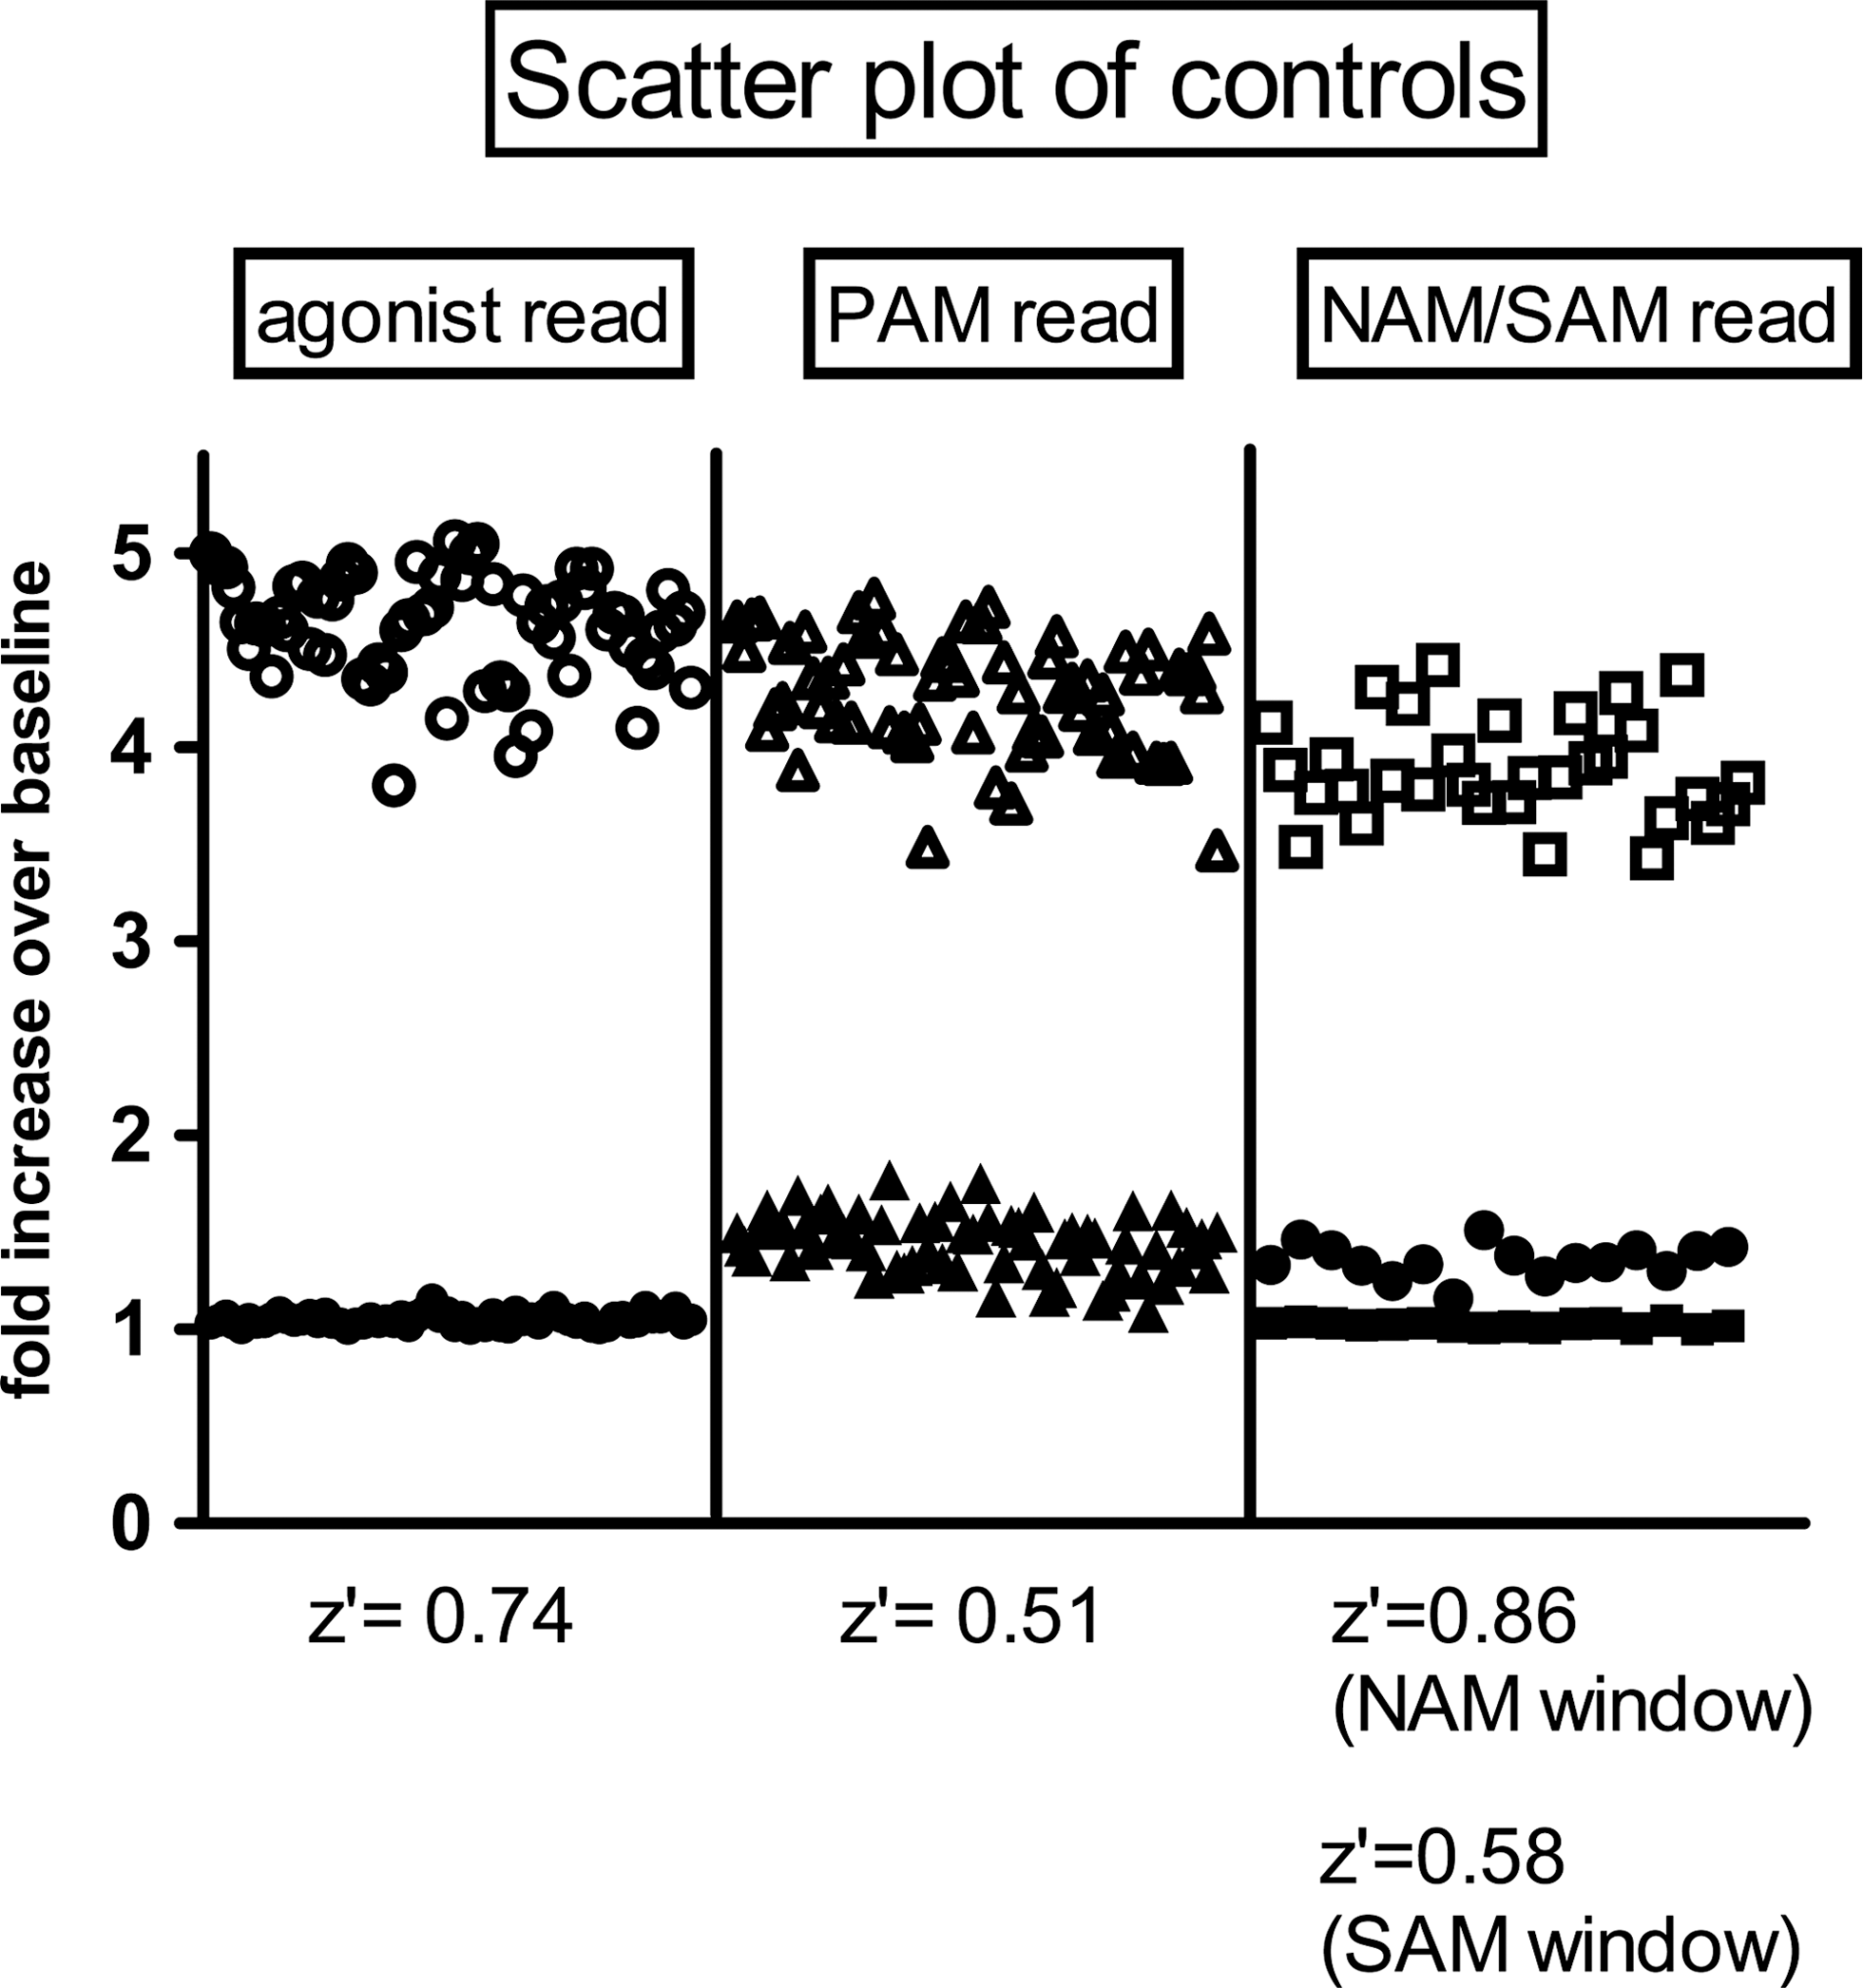
Analysis of assay robustness for a WAM/NAM/antagonist mode (EC20+PAM) triple-add HTS. Z′ scores were generated for appropriate tool compounds in each read of the triple-add assay. For the agonist read (left), Z′=0.74 for signal window between vehicle (●) and agonist (○). For the PAM read (middle), Z′=0.51 for EC20 addition in the absence (▴) versus presence of a tool PAM (▵). For NAM/antagonist or SAM read (right), comparison was made between EC20+PAM addition in the absence (□) versus presence of a tool NAM (▪; Z′=0.86) or SAM (●; Z′=0.58).
Variations on the Triple-Add Format Can Increase the Signal Window for Specific Ligand Types
The “EC20+PAM” triple-add was designed based on the hypothesis that it can identify agonists and PAMs (in the first two additions) and WAMs/SAMs, NAMs, and orthosteric antagonists in the third addition (as shown in Figs. 5 and 6). Thus, this format has the potential to identify all ligand types in one screen. In this mode, a completely silent AM would be expected to reduce the activity from EC80 levels down to EC20 levels (the level of the agonist EC20 response alone) by competing with the PAM for occupancy of the allosteric binding site. Presumably, this is only true for SAMs that compete with the PAM at the same allosteric binding site. The activity of both a “weak” (or “partial”) and “strong” (“full”) NAM was also investigated using this assay format. The weak NAM produced a 61% inhibitory response in the “EC80” triple-add assay (Fig. 7A). IC50 [95% confidence interval (CI)] values for the weak and strong NAMs were 172 [143—209] nM and 18 [17—20] nM, respectively. When tested against an EC20 of orthosteric agonist (“PAM mode” read), both the weak and strong NAMs inhibit the EC20 response to basal levels (Fig. 7A). However, the signal window for detecting the weak and strong NAMs in the EC20 agonist “PAM mode” read is too small to be effectively used in a screening campaign. Using the “EC20+PAM” triple-add assay, this same weak NAM also attenuated the “EC20+PAM” response to basal levels (Fig. 7B). However, the weak and strong NAMs were less potent (approximately threefold) against an “EC20+PAM” challenge (IC50s [95% CI] of 210 [192–230] nM and 10 [8–12] nM, respectively) compared with their ability to antagonize an EC20 of agonist alone (IC50s [95% CI] of 88 [68–113] nM and 3 [2–3] nM, respectively). This might be expected as the NAM must compete with the PAM for binding to the allosteric site in the “EC20+PAM” format. IC50 values were similar (within twofold) for either the weak or strong NAM when compared with the “EC80” agonist assay with the “EC20+PAM” assay. This suggests that the “EC20+PAM” assay is as sensitive as the “EC80” assay for detecting NAMs, with the added benefit that the window of the response in the “EC20+PAM” assay is enhanced for detecting weak NAMs.
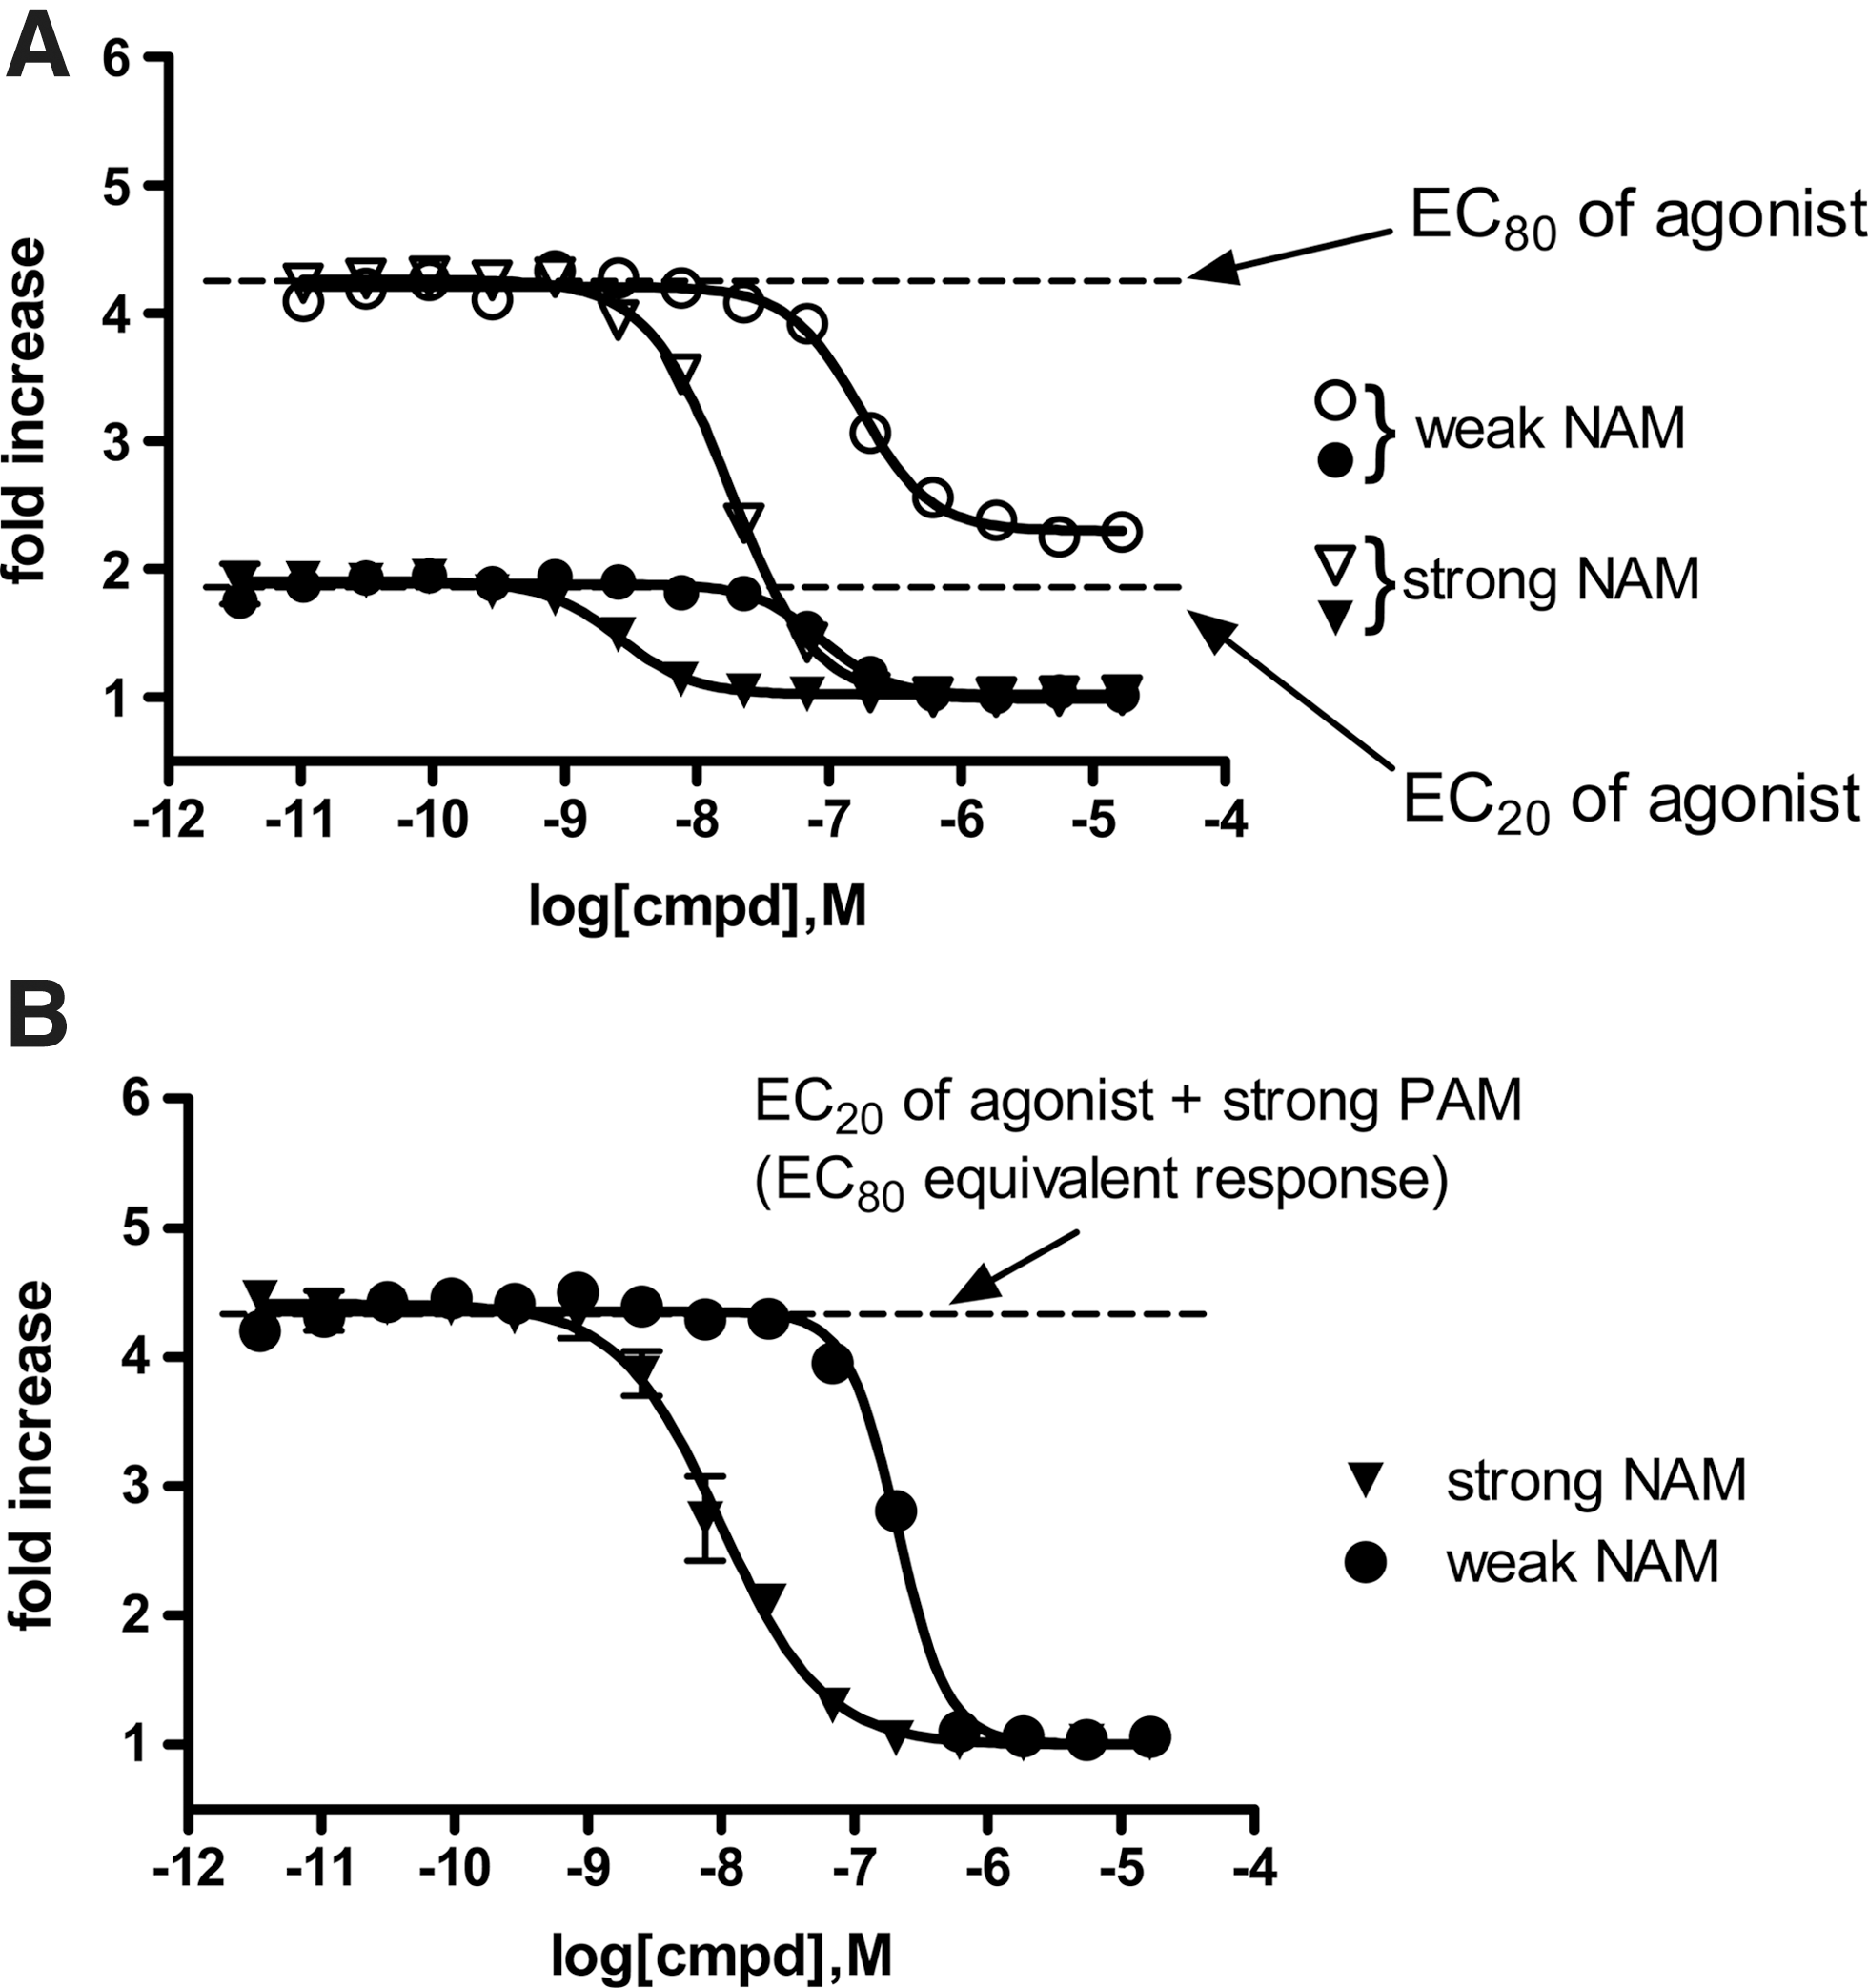
The effects of two compounds with differing levels of NAM activity were compared against a challenge stimulus produced by either an EC20 or EC80 of agonist
It is currently unclear what the result would be for a NAM or WAM/SAM acting at a different allosteric binding site to the tool PAM compound used in an “EC20+PAM” triple-add assay. It is likely that a WAM/SAM will only show up in the screen if it binds to the same site as the tool compound. The effect a NAM binding to a separate allosteric site as the tool compound would produce in this assay format is more difficult to predict. The “EC80” triple-add assay may be advantageous for the detection of NAMs binding to multiple (or unknown) allosteric sites, because the NAM activity is not dependent on a competitive interaction with the PAM at an allosteric site, just its ability to negatively modulate the orthosteric agonist activity.
The previous section shows that the “EC20+PAM” third add increases the signal window for detecting weak NAMs (and presumably other WAMs/SAMs) compared with the “EC80” third add, without affecting detection of agonists, PAMs, and NAMs/antagonists. Next, it was hypothesized that an “EC80+NAM” third add may be more sensitive for detecting weak efficacy PAMs, compared with the EC20 agonist alone (PAM mode-second read). Ideally, the tool NAM used would be at a concentration that would be sub-maximal and produce an EC20 agonist equivalent response when added with the EC80 concentration of agonist.
Figure 8A shows that a low efficacy “weak” PAM produced a 31% response compared with a higher efficacy “strong” PAM, in the presence of an EC20 agonist. The same “weak” PAM produced a 91% response in the “EC80+NAM” assay compared with the same “strong” PAM (Fig. 8B). The increase in Emax of the “weak PAM” suggests that the “EC80+NAM” third add is more sensitive for identifying weak efficacy PAMs and should also be able to identify WAMs/SAMs. An advantage of using the “EC80+NAM” format as a third addition (instead of a second addition), is that the second addition EC20 (PAM mode) may detect PAMs that bind to different allosteric sites at the same receptor, which may not be identified in the “EC80+NAM” assay. By combining these assays into a triple-add format (test compound [agonist mode], first read; EC20 agonist [PAM mode], second read; and “EC80+NAM,” third read), one can optimize the probability for detecting SAMs/WAMs (especially low efficacy PAMs) that bind to the same allosteric site as the tool NAM. However, this format does give up the ability to detect high efficacy NAMs.

Comparison of activities of weak and strong PAMs (▵ and ○, respectively) in a triple-add paradigm where the third addition is either an EC20 of agonist
The EC50 values for the “weak” and “strong” PAMs in the “EC20” (PAM-mode) format were EC50 [95% CI]=28 [18–43] nM and 10 [8–11] nM, respectively compared with the “EC80+NAM” format (EC50 [95% CI]=88 [70–109] nM and 4 [3–5] nM, respectively; Fig. 8). These differences in EC50 values were small (two- to threefold) but significant (based on their 95% CI). However, since the EC50 values were lower for the “strong” PAM and higher for the “weak” PAM in the “EC80+NAM” format, compared with the EC20 of agonist format, the assay format itself does not account for the subtle potency differences.
In addition to the utility of “EC20+PAM” or “EC80+NAM” reads as part of an efficient HTS approach, these testing formats also have potential value for routine compound testing for programs where AMs show relatively weak allosteric efficacy against the target receptor. If higher efficacy PAMs and NAMs are available as tools, the detection of WAMs with these two additional testing formats can be optimized, and as a result, reproducibility and quality of data can be improved.
To illustrate the various triple-add scenarios discussed above, FLIPR traces were generated using compounds representing various activity classes (agonist, full PAM, weak PAM, weak NAM, and full NAM/antagonist) in each of the triple-add versions of the assay (Fig. 9).
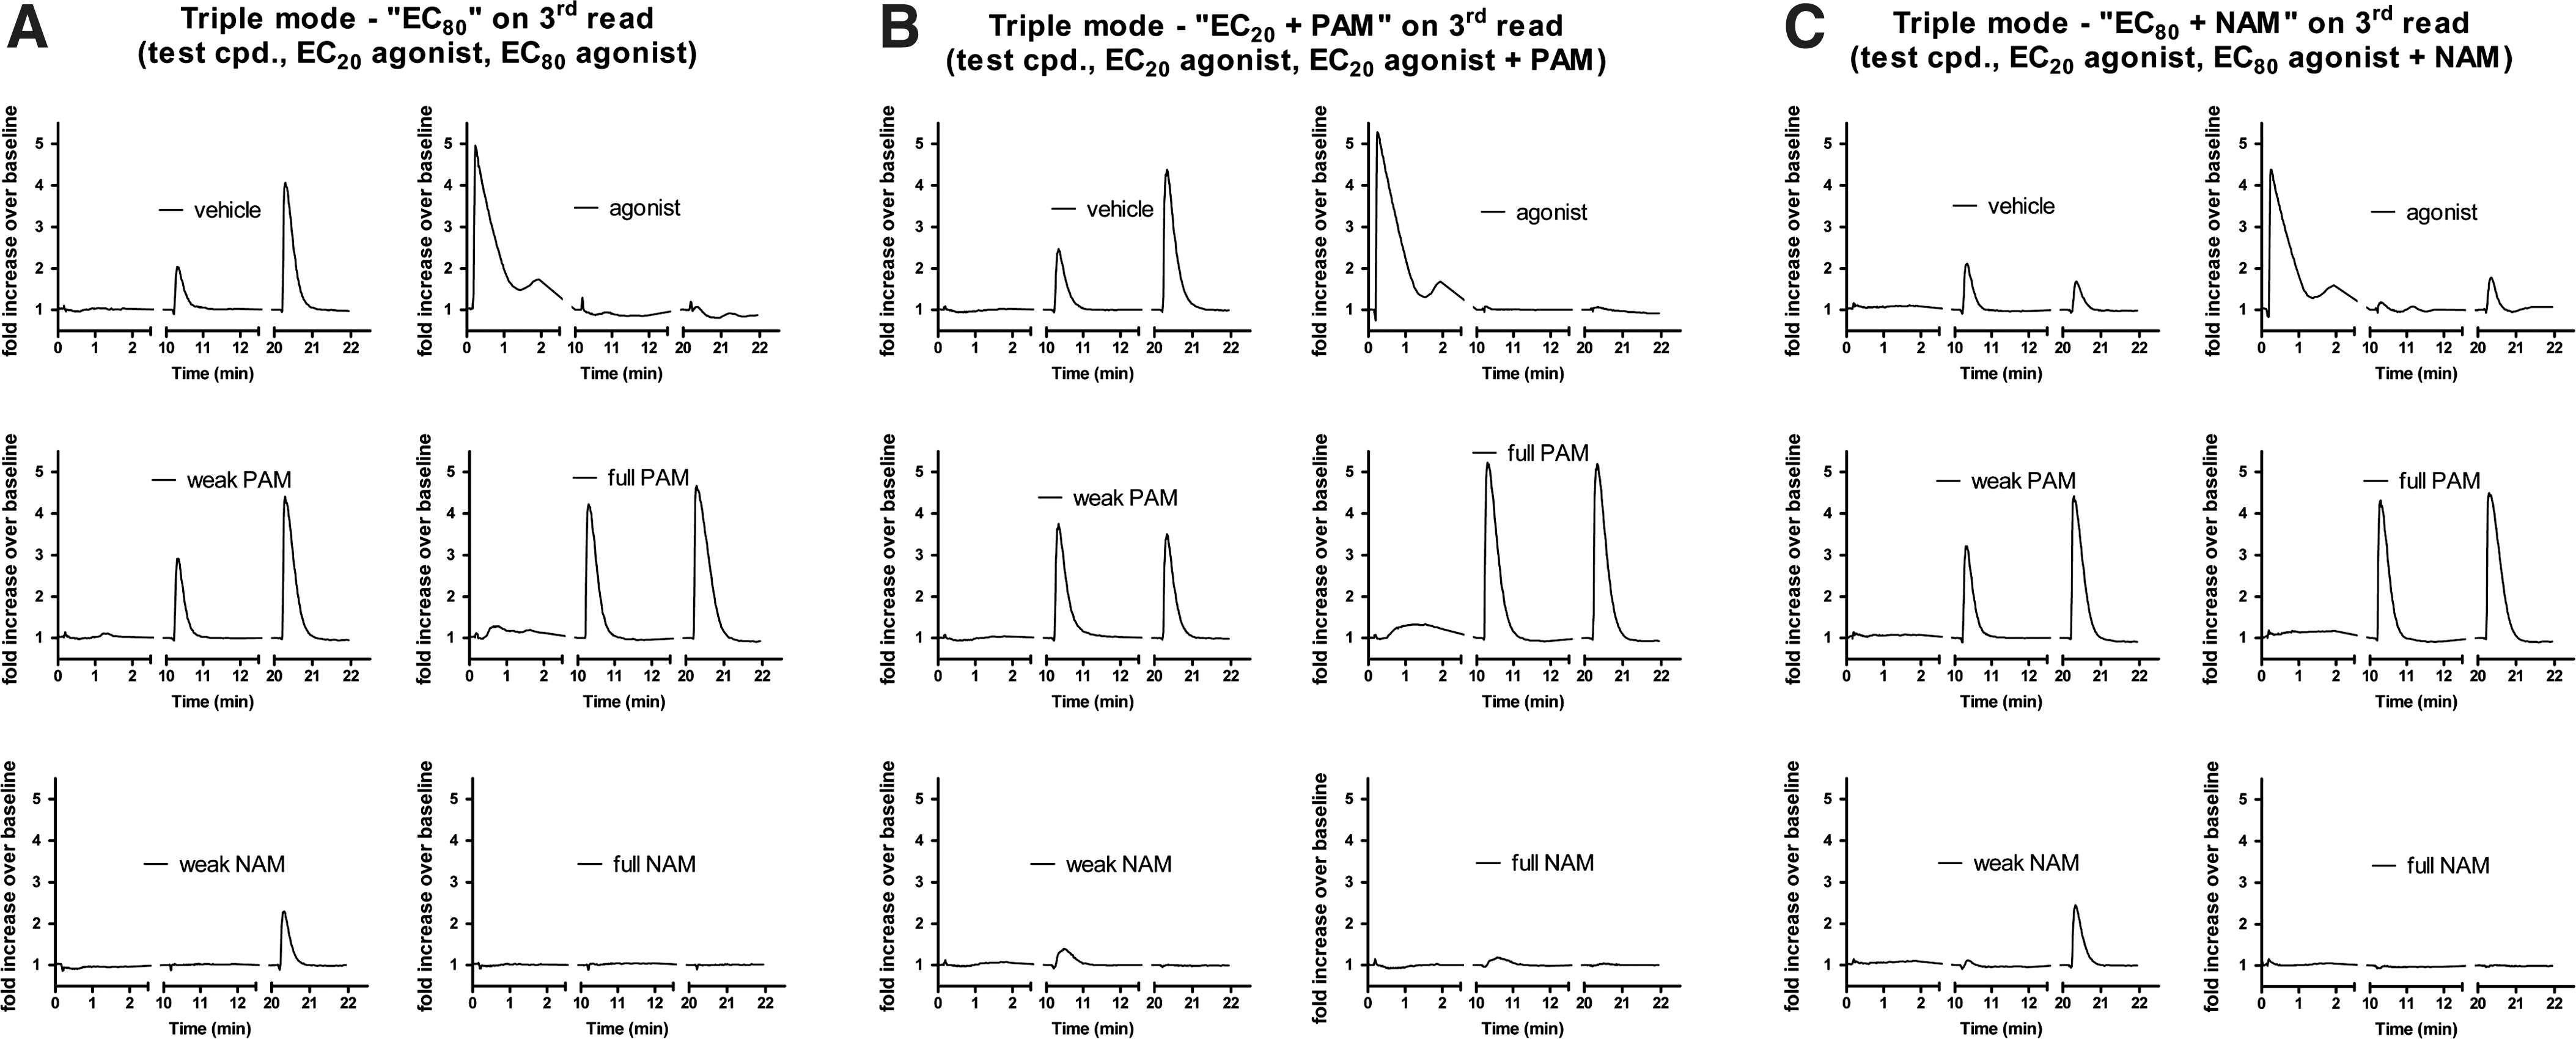
Summary of FLIPR traces produced by ligands of each class (vehicle, agonist, weak PAM, full PAM, weak NAM, and full NAM/antagonist) in each of the triple-add paradigms. The first two additions are the same in each triple mode paradigm. The first addition is test compound (cpd.). The second addition is an EC20 of agonist. The third addition consists of an EC80 of agonist “EC80”
Generating FLIPR traces for various ligand types yielded an interesting yet unexpected observation. As anticipated, full activity elicited by an agonist (agonist trace) in the first read resulted in complete desensitization in the second and third reads. Full activity elicited by a PAM (full PAM trace) in the second read, however, did not result in desensitization in the third read. In other words, even though treatment with a PAM+EC20 of agonist yielded the same level of activity as an EC100 of agonist, the PAM+EC20 of agonist did not yield the same level of desensitization. Although this is an unexpected and interesting finding, exploring the mechanisms of this difference is beyond the scope of this article.
Conclusion
In conclusion, the variations of triple-add calcium response assays described here offer cost-effective screening formats for discovering all ligand types for GPCRs, with each format offering unique advantages for detecting specific ligand types. It is important to validate each triple-add design to account for desensitization (at the level of the receptor or pathways downstream) as this may vary depending on the receptor, cell-line, or agonist ligands used in the assay. In the case where known tool compounds exist for the allosteric site of interest, use of the “EC20+PAM” and “EC80+NAM” triple-add formats can enable more robust responses and reproducibility of data for WAMs/SAMs.
A simple assay is always desirable for a HTS. The triple-add assay formats described here carry with them the disadvantage of adding a significant amount of complexity to the screening assay, and therefore more points at which failure can occur. However, the triple-add assay format has allowed us to generate the same amount of data that would require at least twice as many wells using more conventional approaches. Therefore, with screening being done on a large scale, the cost savings that have been realized using this approach are significant and have more than made up for the increased difficulty inherent in running these types of assays. Additionally, the approaches described have the ability to identify SAMs/WAMs that simply cannot be identified using more traditional functional assays; and in the many cases where a binding assay is not available for an allosteric GPCR site, approaches like the ones described are in fact the only way that such compounds can be identified.
Footnotes
Disclosure Statement
No competing financial interests exist.