




Abstract
The transient receptor potential channel subtype A member 1 (TRPA1) is a nonselective cation channel widely viewed as having therapeutic potential, particularly for pain-related indications. Realization of this potential will require potent, selective modulators; however, currently the pharmacology of TRPA1 is poorly defined. As TRPA1 is calcium permeable, calcium indicators offer a simple assay format for high-throughput screening. In this report, we show that probenecid, a uricosuric agent used experimentally in screening to increase loading of calcium-sensitive dyes, activates TRPA1. Prolonged probenecid incubation during the dye-loading process reduces agonist potency upon subsequent challenge. When Chinese Hamster Ovary (CHO)-hTRPA1 or STC-1 cells, which endogenously express TRPA1, were dye loaded in the presence of 2 mM probenecid TRPA1, agonists appeared less potent; EC50 for allyl isothiocyante agonists in CHO-hTRPA1 was increased from 1.5±0.19 to 7.32±1.20 μM (P<0.01). No significant effect on antagonist potency was observed when using the agonist EC80 concentration determined under the appropriate dye-loading conditions. We suggest an alternative protocol for calcium imaging using another blocker of anion transport, sulfinpyrazone. This blocker significantly augments indicator dye loading and the screening window, but is not a TRPA1 agonist and has no effect on agonist potency.
Introduction
Research on agonist discovery has identified a wide variety of structurally diverse chemicals that activate TRPA1. An increasing number of food additives, 2,10 –14 environmental agents (linked to health problems associated with TRPA1 activation), 15 –17 and marketed drugs 18 –21 with TRPA1 activity have been identified. Some agonists such as menthol, first identified as a TRPM8 agonist, activate the channel by a classical ligand-binding interaction. However, many TRPA1 agonists are reactive electrophiles and have been shown to react with cysteine residues within the N-terminal of the channel. 22,23
In addition, academic and industry research groups continue to investigate agonist activity to further elucidate mechanisms of activation 24 –26 and to identify new tools for screening campaigns. 27,28 Although the identity of the endogenous ligand for TRPA1 is debated, several endogenous activators have been identified. Many of these are components of the inflammatory soup, such as HNE, H2O2, oxidated lipids, and metabolites of prostaglandins. 2,15,29,30
Assays employed in drug discovery programs targeting calcium permeable ion channels routinely utilize calcium imaging platforms, which are applicable for high-throughput screening. These methods are also commonly used for TRPA1 assays. 31 –33 These assays involve the automated detection of changes in the fluorescence of calcium indicator dyes such as Fluo-4 and Fura-2. Changes in indicator dye fluorescence correspond to changes in intracellular calcium concentration as a result of ion channel activity.
Probenecid, a uricosuric agent used clinically in the treatment of gout, is often incorporated into the methodology of these assays. Probenecid significantly reduces dye efflux and sequestration into intracellular organelles as a result of blockade of organic anion transporters.
34
This has the effect of increasing intracellular dye concentrations and, ultimately, increasing the assay window. Probenecid is the recommended method to increase dye retention when using calcium dyes such as Fluo-4 and Fura-2 for screening with Chinese hamster ovary (CHO) cells, but not other cells such as HEK cells (NIH assay guidance available at
We found that using probenecid to increase Fluo-4 or Fura-2 loading in CHO cells expressing human TRPA1, or in STC-1 cells endogenously expressing the mouse variant, results in a decreased TRPA1 sensitivity to subsequent agonist administration. We show that probenecid activates TRPA1 and that extended incubation during the dye-loading period leads to desensitization of the channel. We suggest an alternative protocol for dye loading using another known blocker of anion transport, sulfinpyrazone, which augments dye loading without the undesired effects on TRPA1, which may otherwise lead to a poor assay performance and potentially aberrant pharmacological responses.
Methods
Materials
Probenecid, allyl isothiocyanate (AITC), ruthenium red (RR), trans-cinnamaldehdye, N-methyl maleimide (NMM), menthol, and sulfinpyrazone were purchased from Sigma-Aldrich. HC-030031 36 and AP 18 37 were purchased from Tocris Bioscience. A-967079 38 was synthesized in-house. All compounds were sourced in powder. Stock solutions were diluted in 100% dimethyl sulfoxide (DMSO), except probenecid, which was diluted and stored in 1M NaOH. Stocks were stored in accordance with supplier's recommendations.
Cell Culture
CHO-K1 cells, which expressed human TRPA1 (CHO-hTRPA1) under tetracycline-regulated suppression, were cultured in F12-Glutamax media supplemented with 10% fetal bovine serum, 1% penicillin/streptomycin mixture, 1% sodium pyruvate, 200 μg/mL hygromycin B, and 5 μg/mL blasticidin HCl. All reagents were purchased from Invitrogen. Cells were maintained in T225 flasks and split 1:5 every 2–3 days. Experiments were performed with cells between passage 10 and 50. Channel expression was induced by incubation with 1 μg/mL tetracycline for at least 12 h.
STC-1 cells, which endogenously express murine TRPA1, were cultured in DMEM media supplemented with 15% horse serum, 3% fetal bovine serum, and 1% penicillin/streptomycin mixture. All reagents were purchased from Invitrogen. Cells were maintained in T225 flasks and split 1:2 every 2–3 days. Experiments were performed with cells between passages 10 and 50.
SigmaScreen™ poly-d-lysine-coated 96-well assay plates (#M5307; Sigma-Aldrich) were made with cells dissociated from culture flasks with trypsin and were seeded onto plates at a density of 2.5×10⁴ cells/mL for CHO-hTRPA1 cells or 5×10⁴ cells/mL for STC-1 cells. CHO-hTRPA1 experiments were performed 24 h after plating, while STC-1 experiments were performed 48 h after plating.
Calcium Indicator Dye Loading
Experiments were performed using a HEPES buffer saline solution (HBSS) assay buffer containing (in mM) 140 NaCl, 5 KCl, 10 HEPES, 2 CaCl2, and 1 MgCl2, adjusted to pH 7.4 using NaOH.
For dye loading, either Fluo-4 AM or Fura-2 AM (Molecular Probes) was reconstituted by dissolving 50 μg of dye in 10 μL DMSO (Sigma) with 10 μL Pluronic F-127 (Molecular Probes). Final dye solution was made by adding 20 μL of reconstituted dye to 20 mL HBSS assay buffer. For those assay conditions where probenecid was used, the assay buffer solutions were re-adjusted to pH 7.4 with HCl before addition of the reconstituted dye solution.
On the day of the experiment, cells in the 96-well plates were rinsed with the assay buffer, and then incubated with dye solutions (with or without further reagents as described for individual experiments below) for 40 min in an incubator at 37°C with 5% CO2. Cells were then rinsed of the dye solution and incubated for a further 10 min at room temperature in 100 μL HBSS assay buffer with or without antagonist (again as described for individual experiments below); no probenecid was present at this stage in any experiment (Table 1).
Flexstation™ Calcium-Imaging Assay
1. Cells added to SigmaScreen™ poly-d-lysine-coated 96-well assay plates, incubated at 37°C with 5% CO2 for 12–24 h before screening.
2. Cultured media removed and cells washed with the HBSS assay buffer manually.
3. 2.5 μg/mL dye in 100 μL of HBSS with 0.05% DMSO and 0.05% Pluronic F-127, incubated at 37°C with 5% CO2.
4. Dye solution removed and cells washed with the HBSS assay buffer manually.
5. 100 μL of HBSS with or without antagonist, at room temperature.
6. Manually placed in Flexstation.
7. Filter settings (excitation/emission): Fluo-4: 495/538 nm; Fura-2: 340 and 380/520 nm. For Fura-2, the ratio fluorescence at 520 nm emission of 340 and 380 nm excitation was calculated.
8. Administration speed: at ∼52 μL/s; administration height: 90 μL.
9. Basal fluorescence: Mean of first four readings.
Maximal fluorescence: Maximum observed in 18 s after agonist administration. Compound effect: maximal fluorescence minus basal fluorescence.
CHO, Chinese hamster ovary; TRPA1, transient receptor potential channel subtype A member 1; HBSS, HEPES buffer saline solution; DMSO, dimethyl sulfoxide.
Compound Dilutions
To determine the potency of agonists or antagonists, serial dilutions were made. Initial serial dilutions were made in DMSO with agonist concentrations at 200× final and antagonist concentrations at 100× final. For the compound plates, 2 μL of the 200× agonist/DMSO solution was added to 200 μL assay buffer (final DMSO concentration 1%). The integrated Flexstation fluidics system added 100 μL of the agonist compound plate to the assay plate containing 100 μL HBSS assay buffer.
Antagonist preincubation solutions were made by adding 2 μL antagonist/DMSO solution to 200 μL assay buffer (final DMSO concentration 1%). Antagonist incubation was performed as indicated above. For antagonist experiments, agonist compound plates also contained antagonist. These compound plates were made by adding 4 μL antagonist/DMSO solution to 400 μL HBSS assay buffer at the appropriate agonist concentrations (final DMSO concentration <1.05% DMSO). The integrated Flexstation fluidics system added 100 μL of the agonist/antagonist compound plate to the assay plate containing 100 μL HBSS antagonist solution.
Automated Calcium Imaging
Cells were transferred to a Flexstation (Molecular Devices) for experimentation. Basal fluorescence was recorded for 15 s before agonist administration; the compound effect was calculated as maximal fluorescence observed within 18 s of agonist administration minus basal fluorescence (mean value for four measurements before agonist administration). Automated Flexstation compound administrations were at the speed setting 2 (∼52 μL/s), from an administration height of 90 μL. These administration conditions did not provoke any mechanosensitive response.
For Fluo-4 experiments, the excitation wavelength was 485 nm and the emission wavelength 538 nm (cut-off for measurement 530 nm). For Fura-2 experiments, the ratio of 520 nm emission (cut-off for measurement 515 nm) following excitation at 340 and 380 nm was calculated (Table 1).
All experiments were performed at room temperature.
Electrophysiology
All the experiments were performed at room temperature. TRPA1 expression in CHO cells was induced by incubation with 1 μg/mL of tetracycline 12 h before recording. Cells were perfused with HBSS. For manual patch, electrodes had resistances of 2–4 MΩ, and were filled with a solution containing (in mM) 145 KCl, 10 HEPES, and 1 MgCl2, pH7.3. Electrical signals were recorded by a Multiclamp 700B amplifier, a Digidata 1322A converter, and pCLAMP 10 software (Molecular Devices) at a sample rate of 10 kHz, and filtered with a low-pass Bessel filter at 4 kHz. TRPA1 currents were determined in whole-cell configuration. Cells were held at 0 mV and ramped from −100 mV to +100 mV over 500 ms every 5 s. For automated patch, an eight channel Patchliner (Nanion) was used. The Planar patch chip had a resistance of 5–6 MΩ. The intracellular solution contained (in mM) 50 CsCl, 60 CsF, 20 EGTA, 10 NaCl, 10 HEPES, and 1 MgCl2, pH7.2. During the recording, cells were perfused with an extracellular buffer containing (in mM): 140 NaCl, 2 BaCl2, 1 MgCl2, 4 KCl, 5 glucose, 10 HEPES, and pH 7.4. Cells were held at 0mV and ramped from −100 mV to +100 mV over 70 ms every 10 s. Data were collected at a sampling rate of 10 kHz, and filtered at 3.33 kHz.
Data Analysis
Data were exported to Microsoft Excel for initial analysis; GraphPad Prism was used for fitting of dose response curves, IC50 and EC50 calculation, and statistical analysis. Replicated data from repeated experiments on the same plate (n≥3) were averaged and this value was considered N. All N values were then averaged (N≥2 for all experiments). Data shown in graphs represent average of N±S.E.M for N>2. Mean EC50s and IC50s are the average of the EC50 or IC50 from all N experiments. Paired two-tailed t-tests were used for all statistical analyses.
Results and Discussion
Probenecid-Assisted Dye-Loading Affects TPRA1 Agonist EC50
While optimizing a calcium-imaging assay intended for the screening of TRPA1 agonists and antagonists, we confirmed that probenecid incubation can increase dye loading in CHO- hTRPA1 cells, as indicated by an increase in the maximal response to an agonist, and therefore increases the assay window. We find that probenecid is critically required for adequate loading of CHO cells with Fura-2. The nonratiometric calcium dye Fluo-4 can be loaded without probenecid; however, this results in a significantly smaller assay window (Fig. 1A). Meanwhile in STC-1 cells, used for their endogenous expression of murine TRPA1, it is possible to load both Fluo 4 and Fura 2 without probenecid, but loading is augmented if probenecid is present. Therefore, probenecid can increase the assay window in STC-1 cells if Fluo-4 is used. No significant increase in the assay window per se is observed when using the ratiometric Fura 2 (Fig. 1C), but a fluorescent emission signal from both excitation wavelengths (340 and 380 nm) are increased by probenecid incubation, and this increases the signal-to-noise ratio.
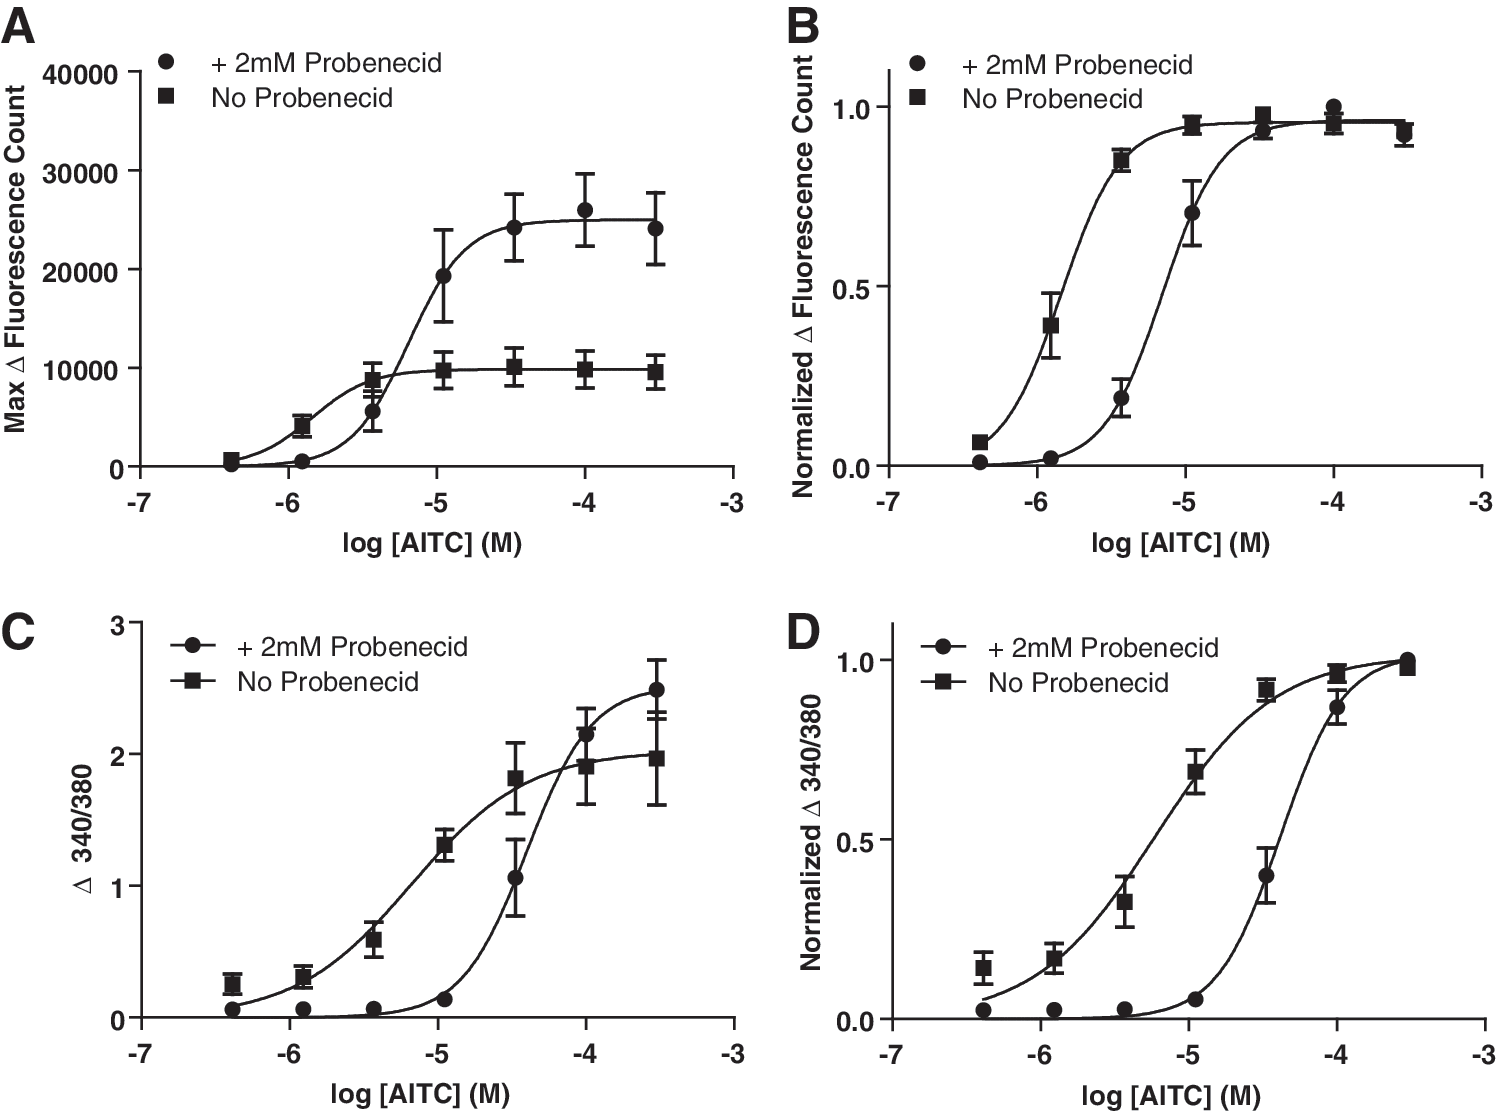
Effect of 2 mM probenecid incubation on a maximal signal and AITC potency.
Crucially, we found that probenecid affected agonist potency at both human and mouse TRPA1 in CHO and STC-1 cells, respectively. Comparing results from CHO-hTRPA1 cells dye loaded in the presence and absence of probenecid showed that probenecid incubation significantly increased the EC50 of our tool agonist AITC (AITC EC50 for cells loaded in the presence of probenecid is 7.32±1.20 μM, while the EC50 for AITC in cells loaded in the absence of probenecid is 1.50±0.19 μM [P=0.008; N=5, n=15], Fig. 1B). To test whether this was cell-type specific, we repeated the experiments using STC-1 cells. Here, again, dye loading in the presence of probenecid significantly increased the EC50 for AITC (AITC EC50 with probenecid-assisted dye loading is 42.09±5.45 μM and without is 6.27±1.53 μM [P=0.0027; N=5, n=15], Fig. 1D).
To test whether this effect is AITC-specific or more general, we tested other known TRPA1 agonists. We included cinnamaldehyde and NMM, which are, like AITC, reactive agonists in that they covalently bind to cysteine in the N-terminus of the channel. 22 We also included menthol, which is thought to interact with the channel in a nonreactive manner. 24 For all of these agonists, we found that incubating the cells with probenecid increased the EC50 (Table 2).
Dye Loading with Probenecid Significantly Increases EC50 of TRPA1 Agonists
EC50 values for AITC (N=5, n=15), cinnamaldehyde (N=4, n=12), NMM (N=4, n=12) and menthol (N=3, n=9) as tested in CHO-hTRPA1 cells dye loaded in the absence and presence of 2 mM probenecid.
a P<0.01, b P<0.05.
AITC, allyl isothiocyanate; NMM, N-methyl maleimide.
These results indicate that prolonged incubation with probenecid reduces the response of TRPA1 to subsequent challenge with agonist.
Dye Loading in the Presence of Probenecid Does Not Affect TRPA1 Antagonist IC50
When the IC50 of TRPA1 antagonists was determined using an AITC concentration equivalent to the EC80 in CHO hTRPA1 cells loaded in the presence and absence of probenecid (18 and 4 μM, respectively), there was no significant probenecid effect. Four antagonists were tested: RR, HC-030031, AP 18, and A-967079 (see Table 3 and Fig. 2). As probenecid appears to desensitize the channel to an agonist challenge it may have been expected that probenecid incubation could increase antagonist potency. However, in the cases of HC-030031 and AP 18, where a nonstatistically significant <3-fold shift in IC50 was observed, the antagonists actually appeared less potent in probenecid-treated cells. This could potentially be explained by increased binding site competition between the agonist and antagonist at probenecid-loaded cells due to the increased 18 μM AITC concentration necessitated by the shift in agonist potency. Little is known about the mechanism of action of these antagonists, but interestingly, it has been suggested that RR is a pore blocker at the hair cell transducer. 39 Nagata et al., demonstrated that RR dose response curves have similar Hill coefficients at both the hair cell transducer channel and TRPA1 suggesting a conserved mechanism of action at both channels that is, pore blockade. 40 Taken together, therefore it is likely that RR is a noncompetitive antagonist of AITC-induced TRPA1 activation. Accordingly, very little shift in IC50 was observed for RR.
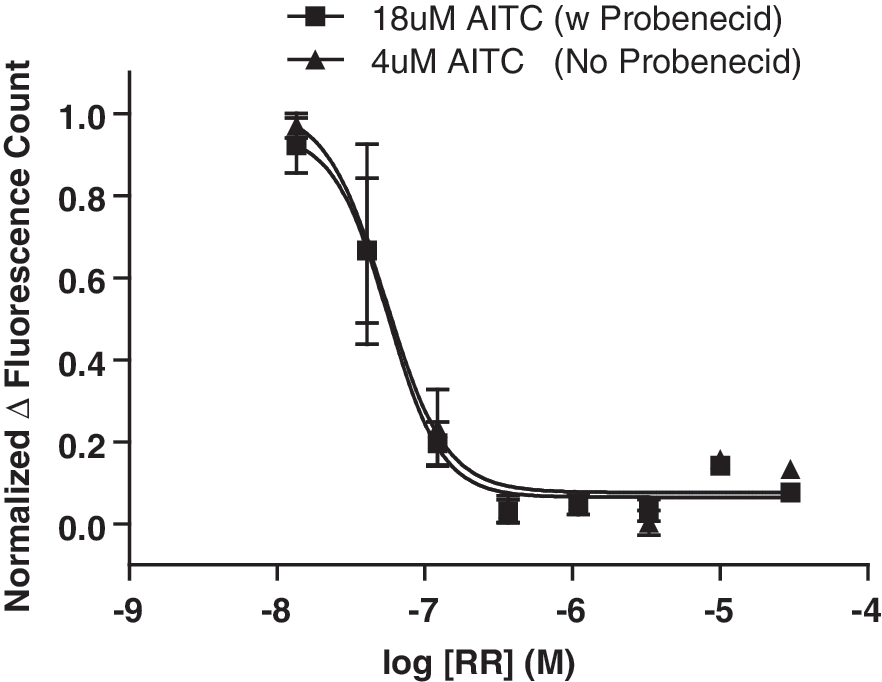
Probenecid incubation has no significant effect on antagonist potency. Dose response experiments for RR against 18 and 4 μM AITC in cells loaded with and without probenecid, respectively. RR, ruthenium red.
Dye Loading with Probenecid Does Not Significantly Alter IC50 of TRPA1 Antagonists
IC50 values for HC-030031 (N=3, n=9), ruthenium red (N=3, n=9), AP18 (N=4, n=12), and A-97079 (N=3, n=9) at 18 and 4 μM AITC as tested in cells dye loaded in the presence and absence of 2 mM probenecid respectively.
These results show that comparable IC50 values for TRPA1 antagonists can be generated whether cells are dye loaded in the presence or absence of probenecid provided the correct agonist concentration is used for both conditions. We show this for a set of four antagonists; however, we cannot rule out the possibility that other antagonists might have different potencies depending on whether TRPA1 has been pretreated with an agonist or not, especially for competitive antagonists as for probenecid pretreated cells a higher EC80 is required.
Probenecid Activates, and Subsequently Desensitizes, TRPA1
It is known for several receptors that prolonged activation with low agonist concentrations leads to desensitization of the response to a subsequent agonist challenge. A similar phenomenon has been reported for TRPA1, where repeated agonist stimulation causes a reduction in response. 41 Therefore, a possible mechanism for the desensitization of TRPA1 observed here is through probenecid-induced activation of the channel. Although TRPA1 agonists are structurally very diverse, probenecid does not have the chemical properties of many typical reactive TRPA1 agonists in that it cannot form Michael adducts. However, Bang et al. recently demonstrated that probenecid can activate the related channel TRPV2. 42 In this report, the authors suggest that probenecid is not an agonist for TRPA1, based on an apparent lack of activity in their assays. However, we found that probenecid increases intracellular calcium in CHO-hTRPA1 cells with an EC50 of 4.2 mM, whereas it does not alter intracellular calcium of untransfected CHO cells (data not shown). This concentration is within the range of the concentration used for dye loading (Fig. 3A). The discrepancy between Bang et al. and our results might be explained by differences in the probenecid concentration range used. Probenecid-induced calcium elevation in CHO-hTRPA1 cells can be blocked by the selective TRPA1 antagonist HC-030031 suggesting that probenecid is an agonist for the channel (IC50=1.57 μM, N=3, n=10; Fig. 3B). Using a manual whole-cell patch clamp to directly compare the effect of 6 mM probenecid and 100 μM ATIC within one cell, we could confirm probenecid activation of the channel was similar in magnitude and IV-relationship as AITC (inward: probenecid: −1.9±0.43 nA, AITC: −1.9±0.39 nA; outward: probenecid: 2.6±0.59 nA, AITC: 3.6±0.62 nA (n=10); Fig. 3C). In separate automated patch clamp experiments, we confirmed that the current activated by probenecid could be blocked by 30 μM HC-030031 (inward: basal, −0.48±0.071 nA; 6 mM probenecid, −0.82±0.098 nA; 30 μM HC-030031, 0.52±0.082 nA; outward: basal, 0.63±0.091 nA: 6 mM probenecid, 1.0±0.10 nA; 30 μM HC-030031, 0.64±0.1 nA [n=30]; Fig. 3C inset).
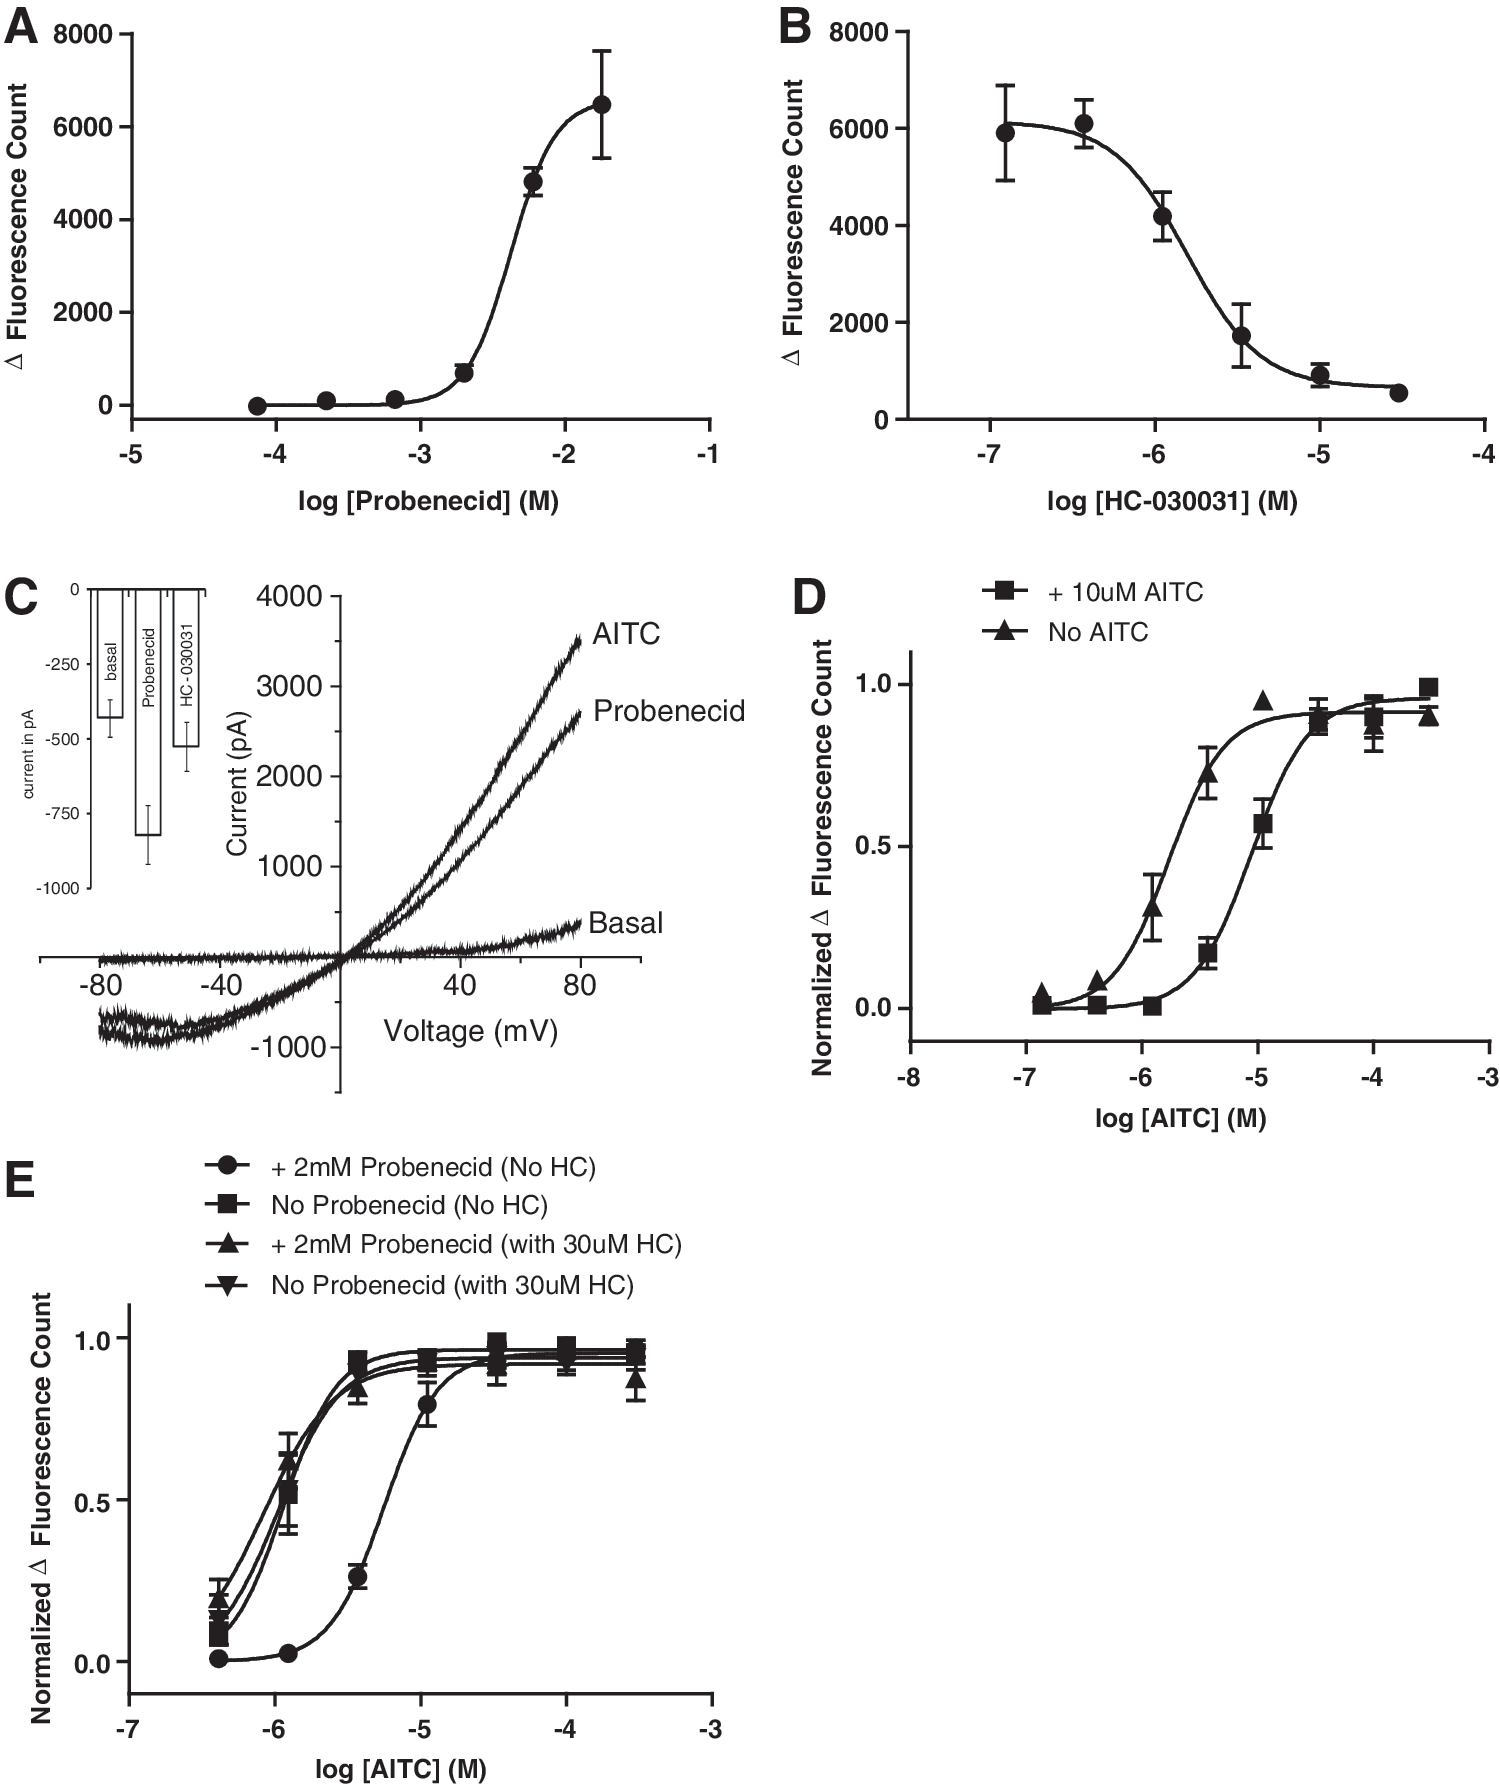
Probenecid activates hTRPA1 and TRPA1 activation during the loading process shifts agonist potency.
Previously reported agonist-mediated desensitization of TRPA1 has been achieved with a short agonist application repeated on a time scale of minutes. 41 To test whether TRPA1 can indeed be desensitized by prolonged agonist activation, CHO-TRPA1 cells were incubated with 10 μM AITC for 40 min during the dye loading as standard in our assay protocol. After washing off the AITC and 10 min incubation in the HBSS assay buffer, cells were challenged with a range of AITC concentrations. We find that prolonged incubation with AITC results in reduced agonist potency (AITC EC50 for cells loaded in the presence and absence of AITC 9.04±1.83 and 2.32±0.58 μM, respectively (P<0.0301; N=4, n=15, Fig. 3D). Interestingly, the maximal response to the challenge is significantly larger after prolonged AITC incubation, which could be the result of increased channel expression at the plasma membrane. Similar results were found by Schmidt et al., who showed that TRPA1 activation increases the exocytosis-mediated membrane surface presentation of the channels. 43
Desensitization of TRPA1 following repeated AITC treatment is not fully understood, but is thought to be calcium-independent and not regulated by protein phosphatase 2B or phosphatidylinositol-4,5-bisphosphate (PIP2). 44 In DRG and trigeminal neurons, TRPA1 desensitization can also be achieved by activation of receptors such as TRPV1 and the cannabinoid receptor via different intercellular pathways. 44,45 Schmidt et al. found that the TRPA1-induced surface presentation of the channel is mediated by activation of the PKA/PLC pathway. 43 In our hands, blockers of the PKA/PLC pathway did not affect the shift in sensitivity of TRPA1 after prolonged agonist incubation (data not shown).
To discount the fact that residual TRPA1 activation following preincubation with an activator contributes to the shift in measured agonist potency, cells were incubated with the TRPA1 antagonist HC-030031 (30 μM) for 10 min after dye loading in the presence of probenecid. This had no significant effect on basal fluorescence count (with HC-030031, 1.58×10³±0.11×10³; without HC-030031, 1.18×10³±0.14×10³; P=0.078), suggesting that there was no continued TRPA1 activation following the washout of probenecid, which supports the inference that dye loading in the presence of probenecid desensitizes the channel to subsequent agonist activation.
Regardless of the mechanism, it appears therefore that activation of TRPA1 by probenecid during the dye-loading period results in a desensitization of TRPA1 to subsequent agonist challenge. To directly test this hypothesis, we blocked TRPA1 using the antagonist HC-030031 during the dye-loading period. In these experiments, cells were incubated with or without 30 μM HC-030031 for 10 min before dye loading. Subsequently, cells were dye loaded in the presence and absence of probenecid with or without HC-030031 for 40 min. Importantly, we established that the wash step after dye loading is sufficient to remove HC-030031. In cells loaded without probenecid, the maximal response and AITC EC50 were not changed by the presence of HC-030031 during the dye-loading step. Using these conditions, we found that blocking TRPA1 during the dye-loading phase prevented probenecid-induced TRPA1 desensitization (CHO-hTRPA1 AITC EC50 in cells dye loaded in the presence of probenecid without HC-030031 5.74±0.88 μM; in cells loaded in the presence of probenecid and with 30 μM HC-030031 0.89±0.18 μM [P<0.05]; in cells dye loaded in the absence of probenecid without HC-030031 1.19±0.24 μM; in cells loaded in the absence of probenecid and with HC-030031 1.09±0.26 μM [no statistically significant difference]; N=3, n=9, Fig. 3E).
Incubation with Sulfinpyrazone Increases Dye Loading Without Affecting Agonist Potency
While preincubation with HC-030031 can prevent the probenecid-induced TRPA1 desensitization, it is not the most desirable solution for a screening assay. We therefore looked for alternative blockers of organic anion transporters, which do not activate TRPA1. In their article, Di Virgilio et al. showed that both probenecid and sulfinpyrazone increase dye loading. 46 In our buffer conditions, sulfinpyrazone is soluble up to 750 μM. At this concentration sulfipyrazone does not activate TRPA1 (Fig. 4). However, we found that sulfinpyrazone, at 250 μM, significantly augmented dye loading in CHO hTRPA1 cells as indicated by an increased maximal response (P<0.0001; N=5, n=21), without having a significant effect on AITC potency (AITC EC50 1.67±0.75 and 2.09±0.83 μM for cells loaded in the presence and absence of sulfinpyrazone (P=0.618; N=5, n=21, Fig. 5).
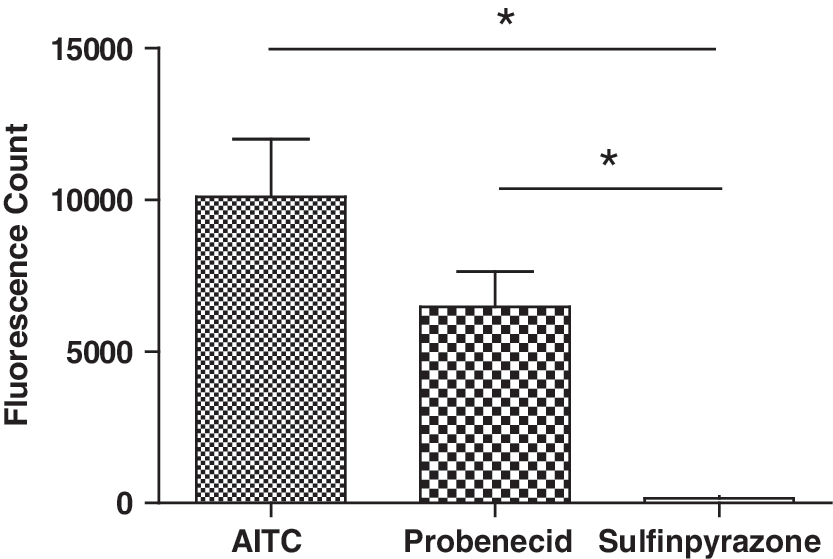
Unlike AITC and probenecid, sulfinpyrazone does not activate TRPA1. Maximum increase in fluorescence count provoked by 300 μM AITC (N=5, n=15), 6 mM probenecid (N=4, n=21) and 750 μM sulfinpyrazone (N=2; n=12) in CHO-hTRPA1 cells. (*P<0.05).
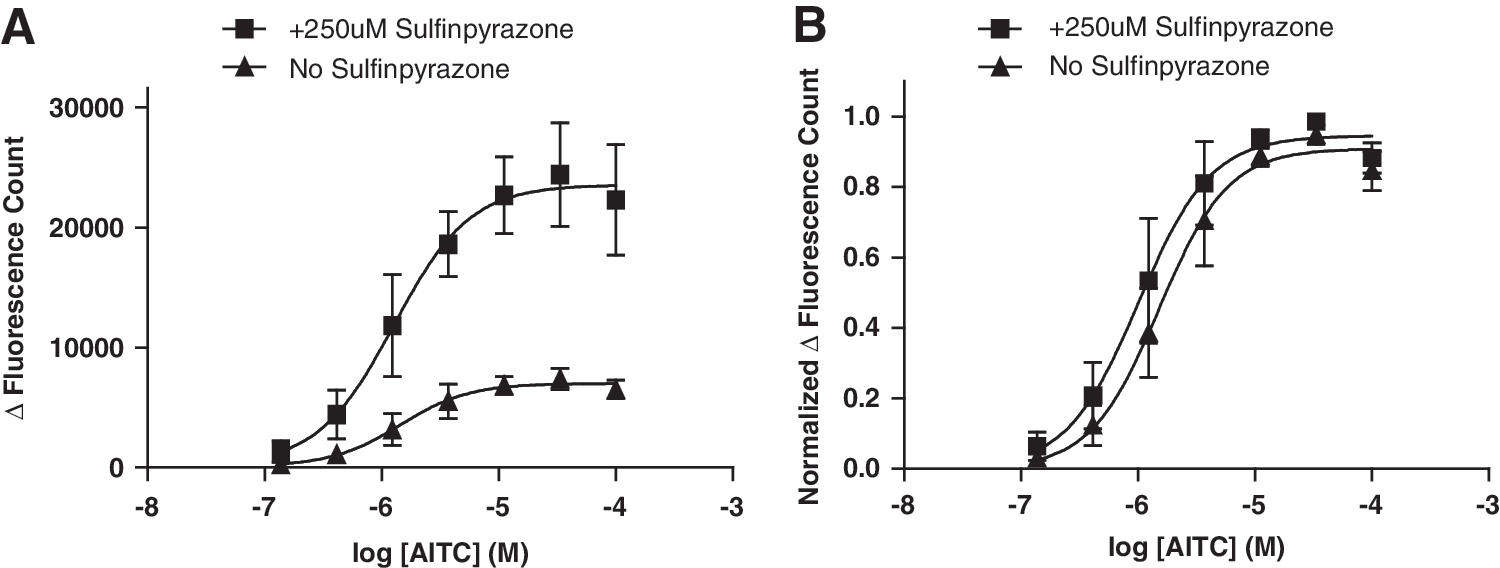
Effect of 250 μM sulfinpyrazone incubation on maximal signal and AITC potency.
Importantly, the observation that low concentration of dye (as seen without sulfinpyrazone) and high dye concentrations (as seen with sulfinpyrazone) generate comparable EC50 excludes other explanations for the shift in agonist potency such as dye saturation at low concentration of dye, differences in extent of calcium buffering by the dye, or nonlinear relationship between the dye concentration and fluorescence intensity change (for Fluo-4), or the wave length ratio change (for Fura-2).
These results demonstrate that sulfinpyrazone boosts dye loading without activating TRPA1 or desensitizing the channel to subsequent agonist challenge.
Conclusions
Here we show that probenecid can activate TRPA1 most likely through a nonreactive, more classical drug target interaction. Using probenecid to assist loading of calcium dyes for TRPA1 agonist, HTS screens can result in an underestimation of the EC50 due to probenecid-induced desensitization of the channel.
These findings might also apply to calcium dye-based assays for other targets affected by probenecid such as the related TRPV2 channel 42 or the G-protein-coupled receptor for bitter taste TAS2R. 47 The TRP channel family is a relatively new class of proteins with emerging pharmacology. It is clear that TRPA1 in particular is modulated by a wide range of diverse compounds; this may be the case for other members of the family and should be considered when designing screening assays.
Footnotes
Acknowledgments
We thank Dr. Rob Watson and Dr. Martin Gosling for critical reading of the article.
C.M., F.Z. and J.M.V. performed the experiments. C.M. and J.M.V. analyzed the data. C.M. and J.M.V. designed the research study and prepared the article.
Disclosure Statement
The authors, all of whom are employees of Novartis, had complete access to all of the data that support this publication and declare that no financial or other conflict of interest exists in relation to the content of the article. The funders had no role in the study design, data collection and analysis, decision to publish, or preparation of the article.