
Abstract
The intermediate-conductance Ca2+-activated K+ channel (KCa3.1) has been proposed to play many physiological roles, and modulators of KCa3.1 activity are potentially interesting as new drugs. In order to identify new chemical scaffolds, high-throughput screening (HTS) assays are needed. In the current study, we present an HTS assay that has been optimized for the detection of inhibitors as well as activators of KCa3.1 in a combined assay. We used HEK293 cells heterologously expressing KCa3.1 in a fluorescence-based Tl+ influx assay, where the permeability of potassium channels to Tl+ is taken advantage of. We found the combined activator-and-inhibitor assay to be robust and insensitive to dimethyl sulfoxide (up to 1%), and conducted an HTS campaign of 217,119 small molecules. In total, 224 confirmed activators and 312 confirmed inhibitors were found, which corresponded to a hit rate of 0.10% and 0.14%, respectively. The confirmed hits were further characterized in a fluorometric imaging plate reader-based concentration-response assay, and selected compounds were subjected to secondary testing in an assay for endogenous KCa3.1 activity using human erythrocytes (red blood cell assay). Although the estimated potencies were slightly higher in the RBC assay, there was an overall good correlation across all clusters. The campaign led to the identification of several chemical series of KCa3.1 activators and inhibitors, comprising already known pharmacophores and new chemical series. One of these were the benzothiazinones that constitute a new class of highly potent KCa3.1 inhibitors, exemplified by 4-{[3-(trifluoromethyl)phenyl]methyl}-2H-1,4-benzothiazin-3(4H)-one (NS6180).
Introduction
In order to identify and characterize new modulator scaffolds of KCa3.1 channels in an efficient manner, the availability of a high-throughput screening (HTS) assay is crucial. As reported by Leherne 11 and others, screening campaigns on K+ channel targets traditionally have been based on technologies using either Rb+ flux (radioactive or nonradioactive) or slow voltage-sensitive fluorescent dyes, which generally have limited throughput and temporal resolution. Automated electrophysiology is becoming increasingly widespread, but unfortunately is not yet cost-effective for HTS. An alternative approach is a Tl+-based flux assay that was introduced by Weaver et al. 12 and successfully applied in several K+ channel modulator screening campaigns. The Tl+ influx assay is easily applicable in HTS campaigns and provides a direct measure of channel activity, due to the increased fluorescence signal seen on an influx of Tl+ through the K+ channel of interest. We have previously used a fluorometric imaging plate reader (FLIPR)–based Tl+-influx assay to characterize positive modulators of KCa2.x and KCa3.1 channels. 13,14 In the present study, we have adapted the protocol in order to be able to detect positive as well as negative modulators of KCa3.1 channels in the same assay. Applying this assay, we have conducted an HTS campaign on a library of 217,119 small molecules and discovered new positive as well as negative modulators of KCa3.1 channels, some of which represent novel structural classes for KCa3.1 modulation. One of the hits identified in this HTS campaign was 4-{[3-(trifluoromethyl)phenyl]methyl}-2H-1,4-benzothiazin-3(4H)-one (NS6180), which represents a novel chemical structure with a potent block of KCa3.1 channels and also displays in vivo efficacy in a model of inflammatory bowel disease. 15
Materials and Methods
Chemistry
ICA-17043 (Senicapoc) and TRAM-34 were synthesized according to published procedures. 16,17 NS6180 appeared first in a commercial library (Specs, Delft, The Netherlands) and was after structural confirmation, re-synthesized as previously described. 15
Cells
The establishment of human embryonic kidney (HEK) 293 cells stably expressing human KCa3.1 channels has previously been described. 3 The cells were grown in Dulbecco's modified Eagle's medium (DMEM, Invitrogen A/S, Nærum, Denmark) supplemented with 10% fetal calf serum (FCS, Invitrogen A/S) and selection antibiotics (G418; Invitrogen A/S) and maintained at 37°C in a 5% CO2 atmosphere.
FLIPR-Based hKCa3.1 Assay
HEK293 cells stably expressing human KCa3.1 were seeded on poly-D-lysine (10 μg/mL)–coated 384-well, clear-bottomed, black-walled Optiplates (Corning Inc, Corning, NY) at a density of ∼3×10⁶ cells/mL in 20 μL DMEM containing 10% FCS per well and left overnight at 37°C in a 5% CO2 incubator.
Before the experiment, the cells were loaded with the fluorescent dye benzothiazole coumarin acetoxymethyl ester (BTC-AM, Invitrogen A/S), essentially as described in. 12 Briefly, growth media were removed from the cells using an EMBLA Microplate Washer (Molecular Devices, Sunnyvale, CA), and the cells were washed once in Cl− free assay buffer (in mM: 140 Na+-gluconate, 2.5 K+-gluconate, 6 Ca2+-gluconate, 1 Mg2+gluconate, 5 glucose, 10 HEPES, and pH 7.3). Subsequently, the buffer was aspirated, and 25 μL Cl—free loading buffer (assay buffer containing an additional 2 μM BTC-AM, 2 mM amaranth [Sigma-Aldrich A/S, Brøndby, Denmark], and 1 mM tartrazine [Sigma-Aldrich A/S]) was added to each well. The cells were incubated at 37°C for 1 h and, subsequently, transferred to a fluorometric imaging plate reader (FLIPR, Molecular Devices). For excitation, the 488 nm line of an argon laser was used, whereas a 540±30 nm bandpass filter was inserted on the emission side.
Screening plates containing dimethyl sulfoxide (DMSO) stock solutions of the compound library were diluted in Cl− free Tl+ buffer (Cl− free assay buffer supplemented with Tl2SO4 (final [Tl+]: 2 mM), amaranth (2 mM), and tartrazine (1 mM) for quenching) at 40 μM, giving a final test concentration of 10 μM (final DMSO concentration of 0.1%). The stimulus buffer consisted of the Ca2+ ionophore A23187 (Sigma-Aldrich, Denmark) dissolved in Cl− free Tl+ buffer (final concentration: 5 μM). Assay plates were tested using a two-addition protocol (1st add.: test compounds, 2nd add.: stimulus buffer), as seen in Table 1. An initial baseline signal was collected before compound addition, followed by addition of the stimulus buffer. In addition, 32 wells served as controls, as shown in Table 1.
Assay for High-Throughput Screening Campaign
1. 384-well clear-bottomed, black-walled Optiplates coated w/poly D-lysine
2. Dissolved in Cl- free assay buffer, loading @37°C, 1 h
3. Cl− free assay buffer supplemented w/Tl2SO4 (final [Tl+]: 2 mM)
4. Baseline before any additions
5. Dissolved in Cl− free Tl+ buffer; for each control 8 wells/plate
6. For each control 8 wells/plate
7. See Data Analysis section
BTC-AM, benzothiazolecoumarinacetoxymethyl ester; FLIPR, fluorimetic imaging plate reader; HTS, high-throughput screening.
Compounds for which the activity was confirmed in a minimum of three out of four wells were subsequently subjected to concentration-response (C-R) testing in separate assays for activators and inhibitors, respectively, as shown in Tables 2 and 3. DMSO stock solutions of the compounds were diluted in Cl− free assay buffer at final compound concentrations of ½ log dilutions (0.316 nM–31.6 μM, final DMSO concentration ≤0.316%), and the assay plates were tested using a two-addition protocol (1st addition: test compound, 2nd addition: stimulus buffer for activators and inhibitors, respectively, as seen in Tables 2 and 3). An initial baseline signal was collected before compound addition, followed by addition of the stimulus buffer. Compound at each test concentration was added in quadruplicate, that is, four individual wells were exposed to test compounds per concentration.
Activator Concentration-Response Assay
1. 384-well clear-bottomed, black-walled Optiplates coated w/poly D-lysine
2. Dissolved in Cl− free assay buffer, loading @37°C, 1 h
3. C-R, 8 compounds/plate, ½ log units from 31.6 μM to 0.316 nM
4. Baseline before any additions
5. Dissolved in Cl− free assay buffer; 32 wells/plate
6. 368 stimulus buffer wells/plate; 8 activator control wells/plate
7. See Data Analysis section
Assay parameters for the concentration-response assays for the confirmed activators. See Materials and Methods section for further details.
C-R, concentration-response.
Inhibitor Concentration-Response Assay
1. 384-well clear-bottomed, black-walled Optiplates coated w/poly D-lysine
2. Dissolved in Cl- free assay buffer, loading @37°C, 1 h
3. C-R, 8 compounds/plate, ½ log units from 31.6 μM to 0.316 nM
4. Baseline before any additions
5. Test compounds dissolved in Cl− free assay buffer; 32 buffer control wells/plate
6. 368 stimulus buffer wells/plate; 8 inhibitor control wells/plate
7. See Data Analysis section
Assay parameters for the concentration-response assays for the confirmed inhibitors. See Materials and Methods section for further details.
Data Analysis
The screening data from the individual wells on the screening plate were expressed as maximal fluorescence signal, which is equal to peak fluorescence signal minus baseline values before addition and background correction by subtraction of the averaged value of the buffer control wells. The data were subsequently analyzed by normalization to the fluorescence peak value of the activator control response.
The screening window coefficient describing the assay quality was estimated as described by Equation (1):
18
Where σc + and σc − represent the standard deviation of the positive and negative control responses, respectively, and μc + and μc − denote the mean values of the positive and negative control responses, respectively. A Z′ value ≥0.3 was required for quality control of the screening plates. The hit threshold for activator screening hits was defined as the mean of the test wells on a given plate plus 3σ, whereas the hit limit for inhibitor screening hits was defined as the mean of the test wells on a given plate minus 3σ.
For hit confirmation and C-R experiments, the data from the individual wells were expressed as a fold increase by division of the maximal signal (after addition of stimulus buffer) with the average baseline value recorded immediately before the addition of stimulus buffer. Next, the data were background corrected by subtraction of the averaged value of the fold increase for the buffer control wells. The data were subsequently analyzed by normalizing the corrected fold increase values to the maximal positive control response and fitting the data to the Hill equation, as described in. 13 EC50 and IC50 values for activators and inhibitors, respectively, as well as efficacy (% of positive control) values are reported.
Erythrocyte hKCa3.1 (Gárdos) Assay
The methodological principle is outlined by Macey et al. 19 Erythrocyte hyperpolarization is measured as a carbonyl cyanide 3-chlorophenyl hydrazone (CCCP)–mediated shift in extracellular pH (Vm=−61.5 mV/pH). In short, blood from healthy human volunteers (Vacutainer, Li/heparin; BD Bioscience, Plymouth, United Kingdom) was centrifuged and plasma removed. Washed erythrocytes were stored at 0°C until use. First, 3 mL unbuffered salt solution (in mM: 2 KCl, 154 NaCl, and 0.05 CaCl2) was controlled at 37°C in a stirred beaker. Next, 50 μL packed erythrocytes were added and the extracellular pH readout was followed (pHG200-8/REF200 electrode pair, Radiometer, Brønshøj, Denmark). Then, 20 μM CCCP were added, followed by varying concentrations of test substances. After pH stabilization, 0.33 μM A23187 was added to initiate the experiment. After the maximal hyperpolarization, the intracellular pH (Vm=0) was found by erythrocyte hemolyzation with Triton-X-100. IC50 values were calculated from a plot of the fractional K+ conductance versus concentration by a fit to the Hill equation.
Results
Fluorescence-Based Tl+ Influx Assay for the Combined Detection of KCa3.1 Activators and Inhibitors
HEK293 cells overexpressing human KCa3.1 were loaded with the Tl+-sensitive fluorescent dye BTC-AM and run in a 2-addition FLIPR-based Tl+ influx assay. The fluorescence development was followed over time in our combined KCa3.1 activator/inhibitor assay under control conditions (full line), in the presence of a screening hit activator of KCa3.1 (Fig. 1, dotted line), as well as in the presence of a screening hit inhibitor of KCa3.1 (Fig. 1, dashed line). In the first addition, a test compound or buffer was added; whereas in the second addition, a stimulus buffer containing the Ca2+ ionophore A23187 at a final concentration of 5 μM was added. Under control conditions, the addition of A23187 led to the activation of KCa3.1, resulting in an influx of Tl+, which, in turn, gave rise to an increase in the fluorescence signal (full line). When stimulated with a pharmacological activator of KCa3.1 in the first addition, an immediate increase in the fluorescence signal was seen (Fig. 1, dotted line), even though there was no detectable increase in the intracellular Ca2+ concentration. However, a subsequent addition of the Ca2+-ionophore A23187 did not induce any further increase in the fluorescence signal, even though a pronounced increase in [Ca2+]i was induced, because the channels were already fully activated. After adding an inhibitor of KCa3.1 as the test compound, there was no detectable increase in the fluorescence signal neither after the first nor after the second addition (Fig. 1, dashed line).
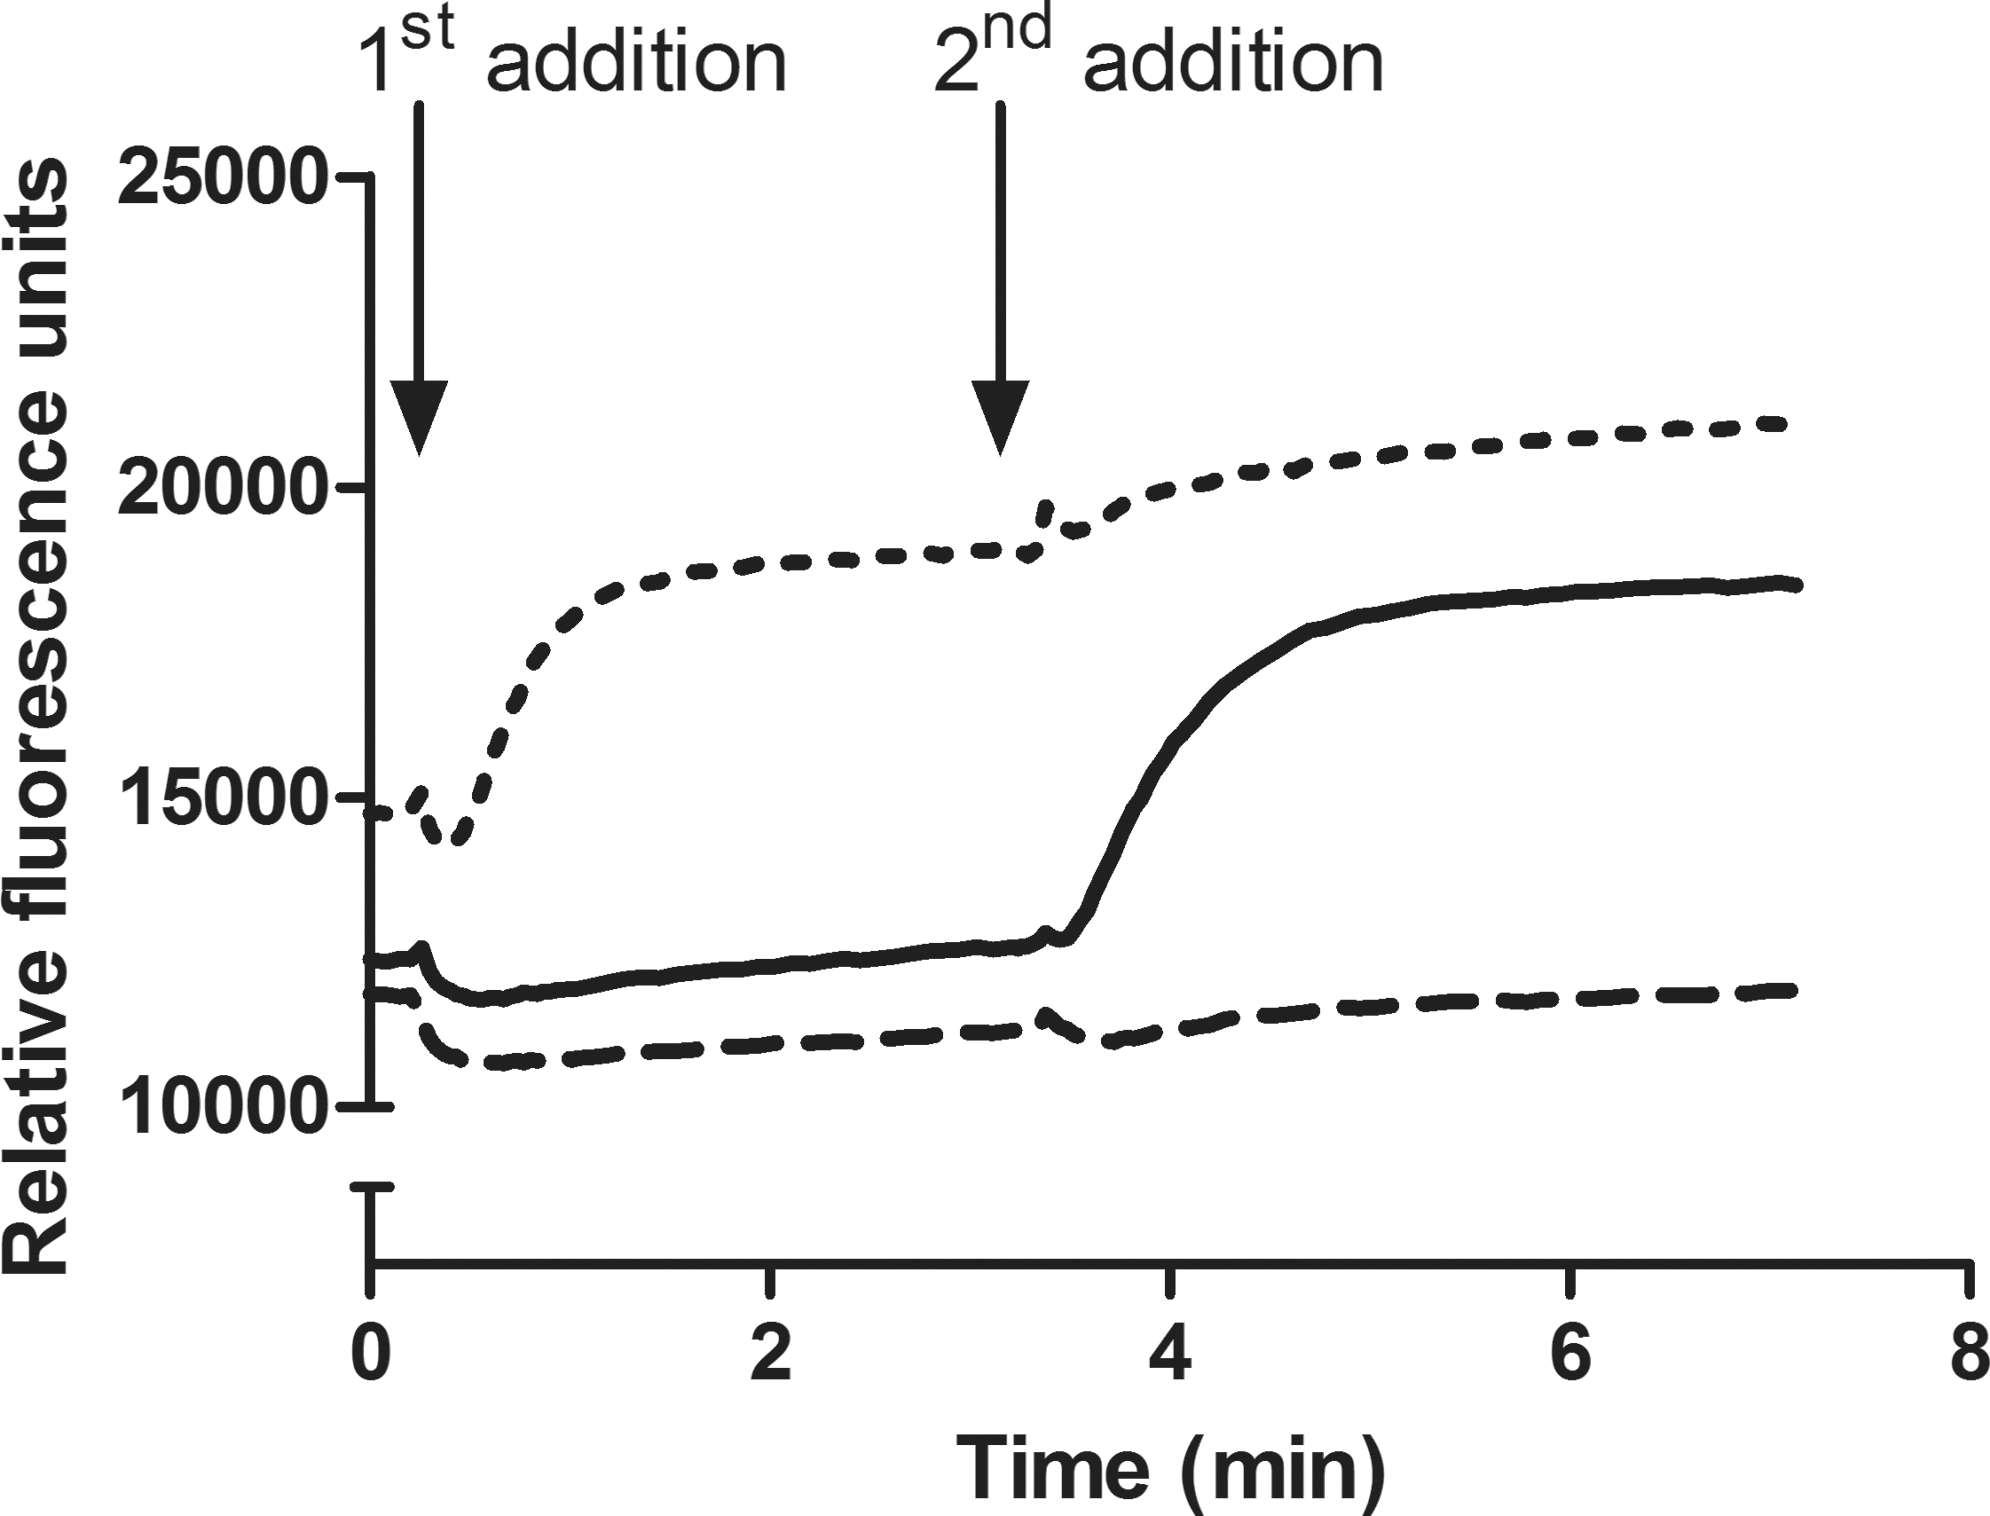
Fluorescence emission from HEK293 cells stably overexpressing human intermediate-conductance Ca2+-activated K+ channels (KCa3.1) and loaded with benzothiazole coumarin acetoxymethyl ester (BTC-AM) followed over time using a fluorimetric imaging plate reader (FLIPR). In the first addition, cells were stimulated with either Cl− free Tl+ buffer (full line), Cl− free Tl+ buffer containing a KCa3.1 activator screening hit at a final concentration at 10 μM (dotted line), or Cl− free Tl+ buffer containing a KCa3.1 inhibitor screening hit at a final concentration at 10 μM (dashed lines). In the second addition, a Tl+-based stimulus buffer containing the Ca2+ ionophore A23187 was added at a final concentration of 5 μM (all traces). The data represent at least three independent experiments.
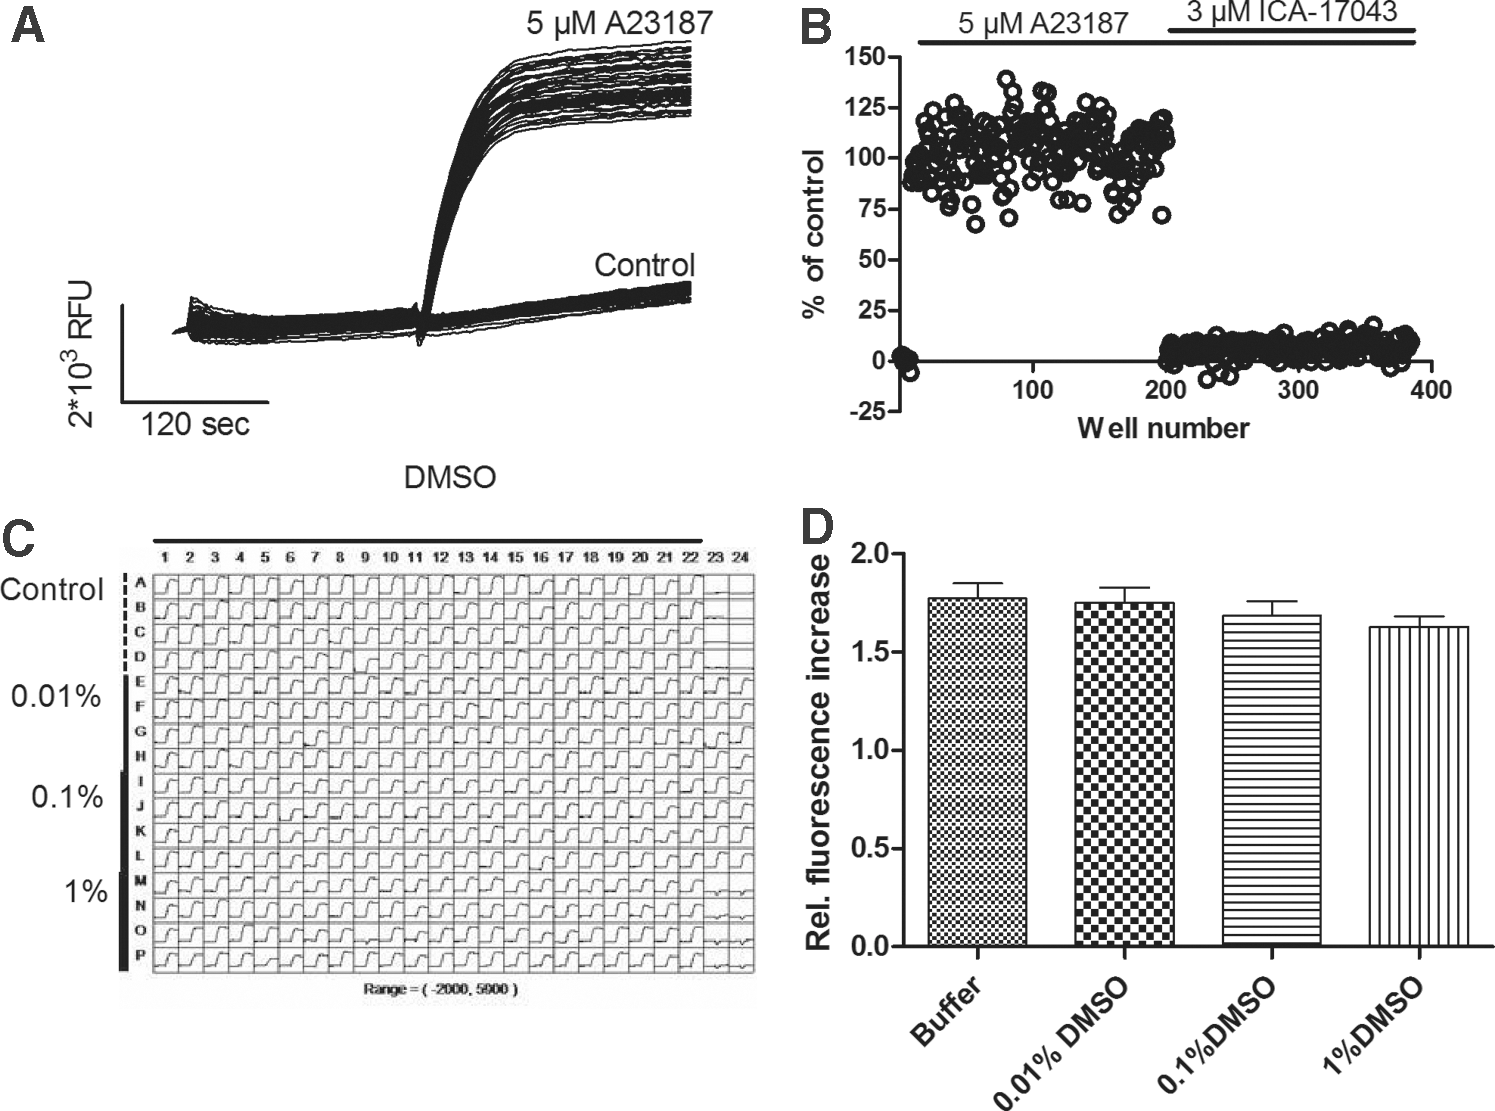
The robustness of the combined assay for KCa3.1 activators and inhibitors was further investigated in order to address its potential use in an HTS campaign. With regard to the activator part of the assay, addition of the Ca2+-ionophore A23187 (5 μM) to a 384-well plate containing KCa3.1 cells loaded with BTC-AM resulted in a robust increase in the fluorescence signal (Fig. 2A); whereas in the absence of A23187, only a minor increase was seen, probably due to a background influx of Tl+ via K+ channels that were endogenous to the HEK293 cells. The multi-well overlay of the fluorescence traces showed a good separation of the background influx and the positive control response induced by A23187 (5 μM), and the well-to-well variability on the plate was acceptable with a Z′ value of 0.52 (n=176 for activators and control wells, respectively). Regarding the inhibitor part of the assay, the increase in fluorescence induced by the activator control A23187 (5 μM) was completely blocked in the presence of the KCa3.1 inhibitor ICA-17043 (3 μM 20 ), and the response size was similar to that of the buffer controls (Fig. 2B). Again, the well-to-well variability was acceptable with a Z′ value of 0.60 (n=176 for activator and inhibitor wells, respectively). The sensitivity of the assay to DMSO was also investigated, and we found that DMSO was well tolerated up to at least 1%, which is well beyond the 0.1% used in this assay. In addition, DMSO appeared not to affect the kinetics or the amplitude of the responses (Fig. 2C, D).
The HTS Campaign
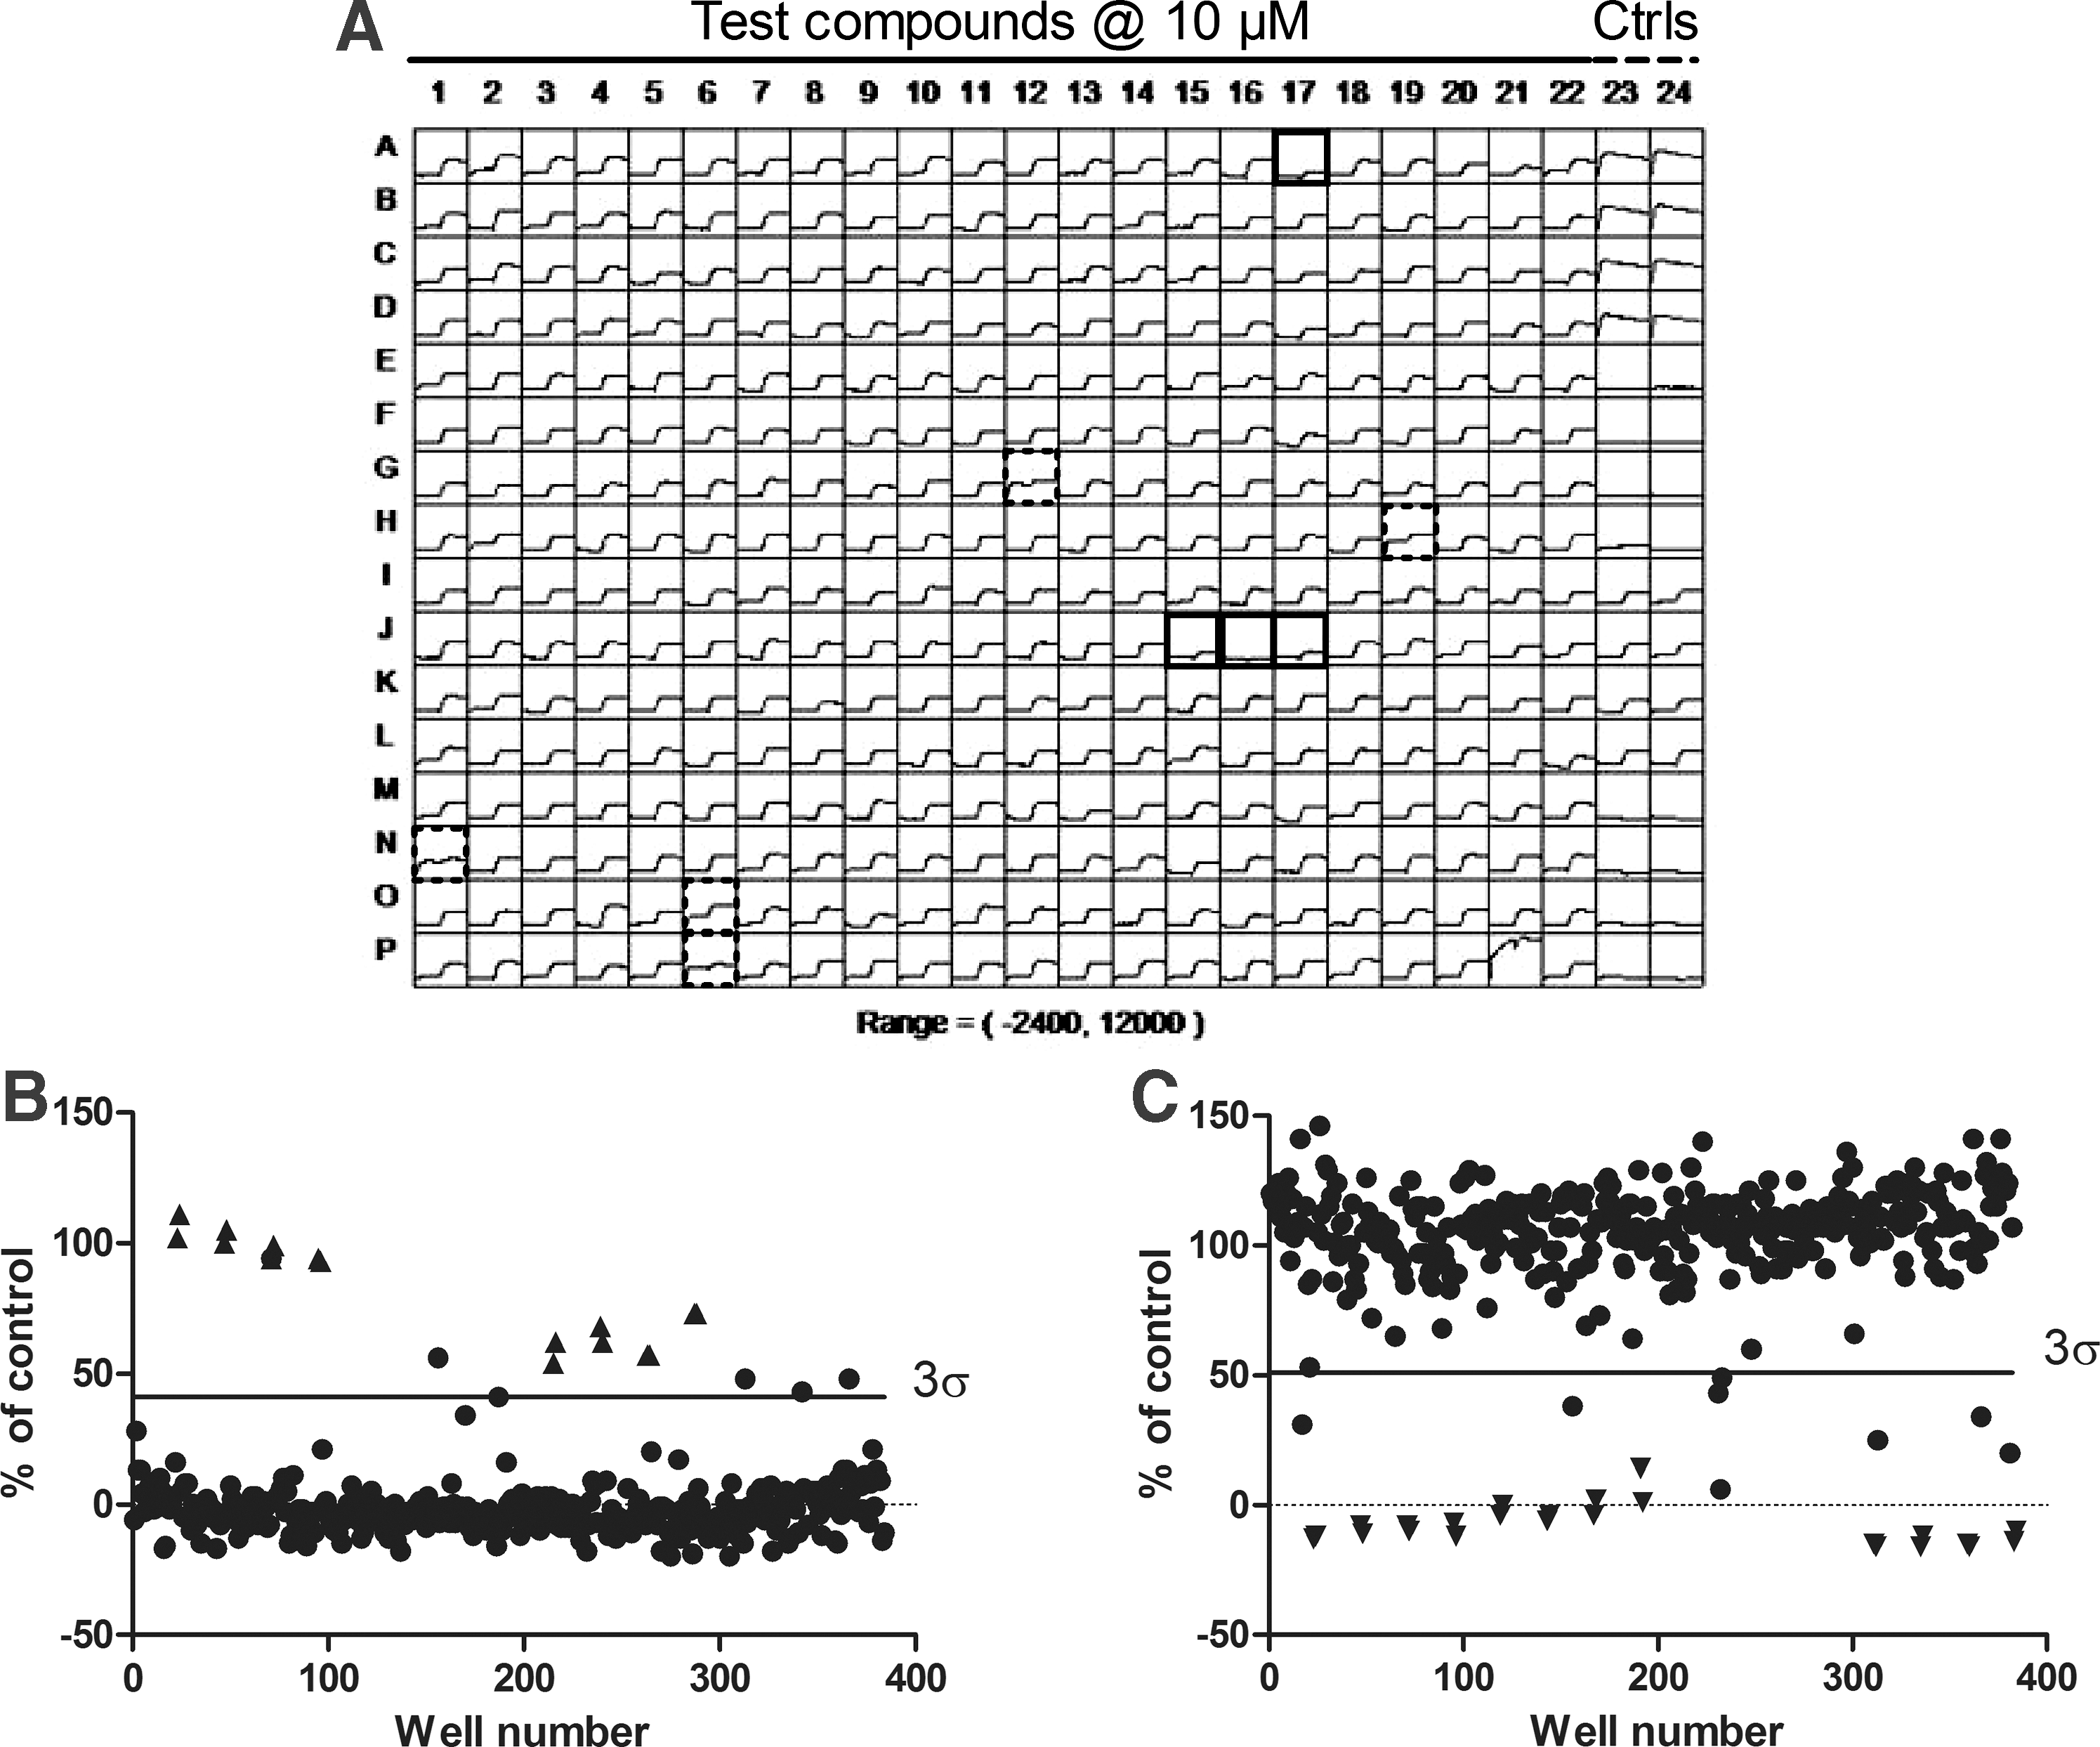
An HTS campaign was launched to test the screening compound collection at NeuroSearch A/S for potential activators and inhibitors of KCa3.1. Our screening compound collection at the time consisted of 217,119 compounds, of which 10,909 were proprietary compounds, whereas the remainder comprised combinations of commercially available screening libraries. Figure 3A shows a screen shot of a screening plate, depicting the fluorescence traces over time for all 384 wells in a single plate. Test compounds were added in columns 1–22, whereas columns 23–24 served as control wells. On this particular plate, five activator hits (dashed squares) and four inhibitor hits (full squares) were identified for further validation. The data are sub-divided into the activator part (response after first addition, Fig. 3B) and the inhibitor part (response after second addition, Fig. 3C) and shown as a percent of the control response (5 μM A23187). The hit-selection cut-off was set to the average response plus 3σ for the activator response (Fig. 3B) and the average response minus 3σ for the inhibitor response (Fig. 3C), as indicated by the horizontal lines. The filled circles above the line were identified as activator hits (Fig. 3B; filled triangles represent control wells), and the filled circles below the line were identified as inhibitor hits (Fig. 3C; filled inverted triangles represent control wells). The 217,119 compounds in the library were distributed on 627 screening plates (384-well format), and with a screening capacity of 30 plates per day, 4 days a week, the HTS campaign could have been conducted in approximately 6 weeks. However, due to internal prioritization, we ended up using approximately 3 months. Fortunately, the cells behaved equally well over the entire period and were not affected by the increasing passage of time. The average Z′ factor for the activator part was estimated at 0.4 (Fig. 4A, n=16 control wells per plate, yielding 10,032 wells in total), whereas the average Z′ factor for the inhibitor plates was estimated at 0.5 (Fig. 4B, n=16 control wells per plate, totalling 10,032 wells in all).
A representative example of a screening plate.

Z′ values for the 627 screening plates (384-well format) tested in the combined screen for KCa3.1 activators and inhibitors. The Z′ values were determined according to Zhang et al.
18
The identified hits were subsequently evaluated in hit confirmation testing. Each hit was tested in quadruplicate and considered confirmed if active in a minimum of three out of four wells. Confirmed hits were passed on to C-R testing (11 concentrations in half-log units [31.2 μM–0.316 nM]). EC50 and IC50 values for activators and inhibitors, respectively, were estimated as described in Materials and Methods. A total of 224 confirmed activators and 312 confirmed inhibitors were found, corresponding to a hit rate of 0.10% and 0.14%, respectively. The confirmed hits were, subsequently, subjected to a chemical clustering procedure. Both chemoinformatic descriptor-based and manual methods were used to classify the confirmed compounds into clusters. Regarding clustering of the activator hits, the former method proved useful, and the confirmed activators were found to represent 39 different clusters. The confirmed activator hits were not characterized further in the present study. With regard to the inhibitors, the chemoinformatic descriptor-based method provided some intuitively wrong classifications, in that close analogues were frequently binned into different clusters. Manual clustering was, therefore, chosen, and deemed acceptable, given that the number of hits (312) was still manageable for individual analysis. This exercise resulted in 39 clusters, summarized in Table 4. Figure 5 shows the KCa3.1 inhibitor potencies of these clusters. Visual inspection and classification of hits is, of course, open to observer bias. Thus, for example, while there were several clusters consisting of close homologues of a single core chemotype, others were created by including molecules of overall similar architecture, but where the core scaffold was not necessarily identical in all cases. Especially clusters 2, 3, 4, 5, 8, 10, 22, and 25 consisted of homologous series of >2 close analogues that were significantly different from hitherto known KCa3.1 inhibitor chemotypes. In all, 55 hits were deemed to be singletons. In an attempt to find patterns, the singletons were subdivided into four classes according to overall flexibility of the molecule (floppy or compact) and whether they were predominantly aromatic or aliphatic. This gave rise to the following four clusters: Singleton compact aliphatic, Singleton compact aromatic, Singleton flexible aliphatic, and Singleton flexible aromatic.
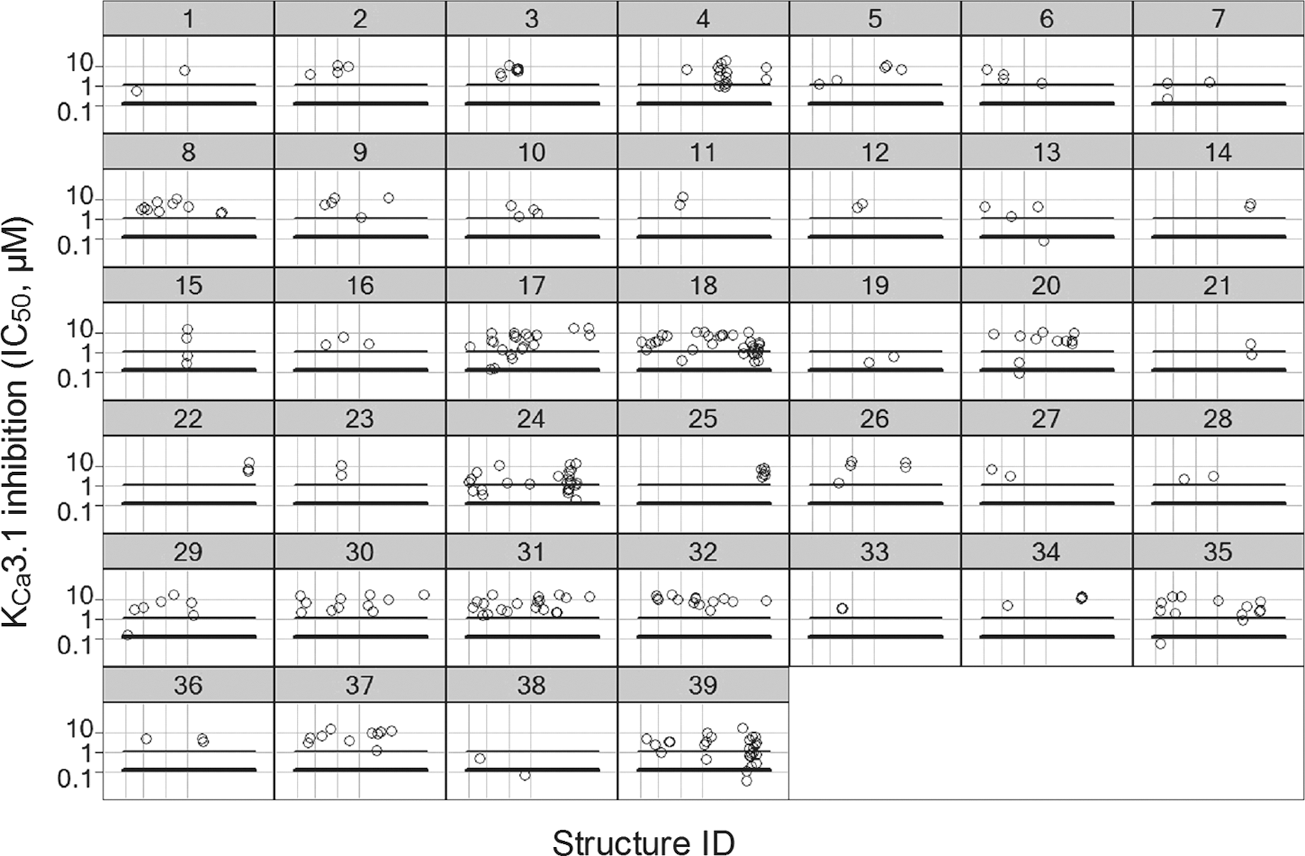
IC50 values (μM) of 312 confirmed KCa3.1 inhibitors in Tl+ influx FLIPR concentration-response (C-R) assay binned by cluster. Inhibitors more potent than 1 μM are below the thin horizontal line, and inhibitors more potent than 0.1 μM are below the bold horizontal line.
Overview of the 39 Clusters Obtained After Chemical Clustering of the Confirmed Inhibitor Hits and Their In Vitro Properties
bDihydropyridines.
cSingleton compact aliphatic.
dSingleton compact aromatic.
eSingleton flexible aliphatic.
fSingleton flexible aromatic.
gTriarylmethanes.
RBC, red blood cell; NS6180, 4-{[3-(trifluoromethyl)phenyl]methyl}-2H-1,4-benzothiazin-3(4H)-one.
Selected members of the individual clusters of confirmed inhibitor hits were subsequently validated in a red blood cell (RBC) assay in order to elucidate their effects on the classic Gárdos channel, the endogeneous KCa3.1 channel in human erythrocytes. Since the red cells represent a very simple cell system with a limited number of conductances, it is possible to determine the relative erythrocyte KCa3.1 conductance in a noninvasive manner using the CCCP method for estimation of the erythrocyte membrane potential, as described in Materials and Methods. In total, 107 inhibitor hits covering most clusters were validated in the RBC assay, as shown in Figure 6, where the IC50 values obtained in the KCa3.1 FLIPR assay and in the RBC assay, respectively, are correlated. As seen from Figure 6, there is a clear distribution of the points around the line of equity, indicating, in general, a good correlation between the two in vitro assays.

IC50 values of 107 KCa3.1 inhibitors in FLIPR C-R assay (ordinate) versus IC50 values in the red blood cell (RBC) assay (abscissa). Each square plot represents one chemical cluster based on visual inspection of the hit structures.
KCa3.1 Inhibitor with a Novel Chemical Structure Identified
Among the inhibitor hits identified, several were very potent and one in particular, NS6180, belonging to a novel KCa3.1 inhibitor scaffold, received our attention due to its high potency, as seen from the C-R curve (FLIPR) shown in Figure 7, where the IC50 value was estimated at 0.08±0.02 μM. The family of benzothiazinones represented here by NS6180 differs from the hitherto known KCa3.1 blocker scaffolds dominated largely by triarylmethanes such as TRAM-34 and ICA-17043 and conceptually similar structures. 21 The FLIPR C-R curves for TRAM-34 and ICA-17043 are shown for comparison, and the IC50 values were estimated at 0.7±0.4 μM (n=5) and 0.01±0.002 μM (n=3), for TRAM-34 and ICA-17043, respectively (Fig. 7).

Discussion
Potassium channels are among the most selective ion channels known, being permeable only to a few close K-ion analogues, such as the alkali metal ion Rb+, the ammonium ion NH4 +, and the transition metal ion Tl+. 22,23 All three ions have been extensively used as read-outs for activation of K+ channels in scientific publications, although only Rb+ and Tl+ are in practical use in HTS campaigns these days. Tl+ interacts with the intracellular fluorescent dye BTC 12 , causing an increased fluorescence emission, and fluorescence-based Tl+ influx assays have previously been applied for detecting the activity of K+-channels, including Ca2+-activated K+ channels. 12 –14 However, a combined assay for simultaneous detection of KCa3.1 activators and inhibitors in a format allowing HTS campaigns has not previously been described.
Tl+-based assays are limited in flexibility by the toxicity of thallium and by low solubility of TlCl, which causes precipitation on the addition of Tl+ to physiological Cl− containing buffers. When designing screening assays, this problem is circumvented by the use of Cl− free extracellular buffers, as was also the case in the present study. However, the removal of Cl− is principally a drastic intervention with possible consequences for cellular pH balance, resting membrane potential, and Ca2+ homeostasis, which call for a comprehensive assay optimization. We introduce here a fluorescence-based Tl+ influx assay for the combined detection of activators as well as inhibitors of KCa3.1 channels. Tl+ is added in both 1st and 2nd additions of the assay, in contrast to previous standard activator- or inhibitor-Tl+ influx assays, 12,14 and we managed to restrict the final [Tl+] to 1 mM. The responses seen showed no detectable differences compared with the responses observed in the separate inhibitor and activator assays, suggesting that the prolonged presence of Tl+ does not affect the readout. In addition, the assay displayed a good window for both the activator and the inhibitor part, and was insensitive to DMSO (up to 1%), making it suitable for conducting a HTS campaign, which is in accordance with previous reports on fluorescence-based Tl+ influx assays on other K+ channel targets. 12 However, the assay robustness, reflected in the separate Z′ values for the activator and inhibitor parts, although satisfactory, was slightly lower than that reported by, 12 which may well be due to the necessary compromises taken in order to optimize simultaneously both the activator and inhibitor parts of the assay. The satisfactory robustness of the combined assay, in addition to the obvious scientific and cost benefits of being able to screen for both activators and inhibitors in the same assay, enabled us to launch an HTS campaign for the activators and inhibitors of KCa3.1.
The confirmed KCa3.1 hits represented 39 chemical activator clusters as well as 39 inhibitor clusters, but the activator hits were not explored further in this study. A comparison of the KCa3.1 inhibitor potencies between the FLIPR assay and the secondary RBC assay shows good correlation across all clusters. However, on average, there was a slight tendency toward higher potencies in the RBC assay, a tendency that was also confirmed in patch clamp analyses.*
As was to be expected given their known propensity to inhibit KCa3.1, 21 27 triarylmethanes as well as 11 dihydropyridines were found, thereby attesting to the reliability of this screen. In addition, several clusters consisted of chemical series (>2 close analogues) that represented novel KCa3.1 inhibitor chemotypes. This would lend credence to the conclusion that these scaffolds constitute novel bona fide KCa3.1 inhibitor series.
One of these series were the benzothiazenones exemplified by the compound NS6180 (4-{[3-(trifluoromethyl)phenyl]methyl}-2H-1,4-benzothiazin-3(4H)-one), which was characterized in greater detail using the Tl+ assay. In direct C-R comparisons with the triarylmethane reference compounds TRAM-34 and ICA-17043 (senicapoc), NS6180 was more potent than TRAM-34 and slightly less potent than ICA-17043. The FLIPR IC50 value for NS6180 was estimated at 80 nM, which is slightly less potent than seen in the RBC assay (14 nM). 15 The IC50 value of ICA-17043 was estimated at 10 nM, which is in good agreement with the estimate in the RBC assay (34 nM)* as well as what has previously been published (10 nM 20 ). However, the IC50 value of TRAM-34 was estimated at 0.7 μM, when tested in the FLIPR C-R assay, which is significantly higher than what has previously been reported (20 nM) 17 as well as what we determined in the RBC assay (18 nM). 15 Interestingly, in a population patch clamp study on KCa3.1 channels, the IC50 value for TRAM-34 was estimated at 0.31 μM, 24 which is also higher than expected. This could indicate that TRAM-34 may possess properties (solubility, stickiness, stability etc.) that make it sub-optimal for testing in certain types of population-based in vitro assays.
Altogether, these facts allow a good measure of predictability for compounds tested in FLIPR as to their expected potency range in an endogenous, human KCa3.1 channel. This was indeed borne out in practice in our subsequent Medicinal Chemistry program on KCa3.1 inhibitors (not shown).
In summary, we present a novel fluorescence-based Tl+-influx assay for the combined detection of KCa3.1 activators as well as inhibitors. We found the assay suitable for use in a high-throughput setting and conducted an HTS campaign on a library of 217,119 small molecules. The HTS campaign led us to the identification of several chemical series of both activators and inhibitors. Among those were the benzothiazinones, which constitute a novel class of potent KCa3.1 inhibitors, one of them being NS6180, which has been further characterized in an accompanying paper. 15
Footnotes
Acknowledgments
The excellent technical assistance rendered by Anja Dahl Nielsen and Vibeke Meyland-Schmidt at NeuroSearch A/S is gratefully acknowledged.
Disclosure Statement
All the authors were fulltime employees at Neurosearch A/S at the time these data were generated.
Abbreviations
*
Strøbæk D, personal communication, NeuroSearch, 2011.