
Abstract
The methylation state of lysine residues within histone H3 is a major determinant of active and inactive regions of the genome. Enhancer of Zeste homolog 2 (EZH2) is a histone lysine methyltransferase that is part of the polycomb repressive complex 2 (PRC2). Elevated EZH2 expression levels have been linked to hypertrimethylation of histone H3 lysine 27 (H3K27), repression of tumor repressor genes, and the onset of several types of cancers. We used the AlphaLISA technology to develop a high-throughput assay for identifying small molecule inhibitors of EZH2. AlphaLISA Acceptor Beads coated with antibodies directed against methylated H3K27 provided a sensitive method of detecting EZH2 activity through measurement of K27 methylation of a biotinylated H3-based peptide substrate. Optimized assay conditions resulted in a robust assay (Z′>0.7) which was successfully implemented in a high-throughput screening campaign. Small molecule inhibitors identified by this method may serve as powerful tools to further elucidate the potential importance of EZH2 in the development and treatment of cancer.
Introduction
Lysine 27 of histone H3 (H3K27) is methylated by the polycomb repressive complex 2 (PRC2), a multi-subunit protein complex whose catalytic subunit is the methyltransferase enhancer of Zeste homolog 2 (EZH2). Other members of PRC2 include the extra sex combs protein (EED), suppressor of Zeste 12 (SUZ12), RbAp48, and AEBP2 [Drosophia homologs are E(z), Esc, Su(z)12, and NURF55/CAF-1]. 6 –11 EZH2 catalyzes the transfer of a methyl group from S-adenosyl-L-methionine (SAM) to the terminal nitrogen atom of a H3K27 side chain, releasing S-adenosyl-L-homocysteine (SAH) as a reaction by-product. Hypertrimethylation of H3K27 (H3K27me3) due to elevated EZH2 expression levels has been associated with a concomitant decrease of tumor repressor gene expression and with several types of cancer, including prostate, breast, and colon. 12 –16 EZH2 also appears to work in concert with a mutated form of the enzyme to more efficiently catalyze H3K27me3 production in follicular lymphoma as well as some subtypes of diffuse large B-cell lymphoma, the most common form of non-Hodgkin lymphoma. 17,18 Moreover, structural studies suggest that these elevated H3K27me3 levels can in turn enhance EZH2 activity, thereby potentially leading to an auto-magnification of aberrant epigenetic modifications. 19 Collectively, these discoveries have garnered interest in the development of small molecule inhibitors of EZH2 as novel anti-cancer therapeutics. 20,21
The discovery of small molecule EZH2 inhibitors should be facilitated and hastened by high-throughput screening (HTS). Assays performed in an HTS setting need to be sensitive, robust, cost-effective, and scalable. Currently available radiometric assays for EZH2 18,22 meet these standards, but are accompanied by additional handling requirements as well as safety precautions associated with the use and disposal of large volumes of radioactive waste. Alternatively, nonradioactive homogenous assays have been reported, but these assays rely heavily on coupled enzymatic reactions, tend to be less robust, and require counterscreens with additional assays to ensure that identified hit compounds are acting directly on the target. 23,24 For the development of an EZH2 activity assay that better meets ideal HTS criteria, we explored the use of AlphaLISA™ technology to detect the methylation of a biotinylated, unmethylated 24-mer H3-based peptide (H3K27me0) substrate. This detection technology is widely used due to its adaptability to a variety of targets and substrates, and has been successfully applied to develop high-throughput assays for histone methyltransferases (SET7/9, G9a), 25,26 histone demethylases (Jumonji JMJD3, LSD1), 25,27 and other binding proteins which recognize methylated histones. 28 In the case of EZH2, AlphaLISA donor beads coated with streptavidin bind to the biotin tag of the peptide, while H3K27 methylation is bound by AlphaLISA acceptor beads coated with antibodies which recognize and bind to H3K27me1 and H3K27me2. A gain of signal indicates methylation of the peptide substrate at K27 by EZH2. Here we describe the principle, development, and performance of our AlphaLISA EZH2 assay in an HTS setting.
Materials and Methods
Reagents, Recombinant Proteins, and Peptides
Fluorescein-labeled SAH “tracer” and histone methyltransferase (HMT) Buffer 2 (with and without added detergent) were obtained from BPS Biosciences (San Diego, CA). Recombinant PRC2 (>90% purity) was prepared by co-expression of N-terminal His-tagged human EZH2 (residues 2–end), N-terminal His-tagged human EED (amino acid residues 2–end), N-terminal His-tagged human RbAp48 (residues 2–end), N-terminal His-tagged human AEBP2 (amino acid residues 2–end), and N-terminal Flag-tagged human SUZ12 (residues 2–end) in a baculovirus expression system and obtained from BPS Biosciences. Anti-SAH monoclonal antibody was purchased from Axis Shield (Dundee, United Kingdom). Bicine (1 M solution), SAM, SAH, and poly-L-Lysine (0.1% solution) were purchased from Sigma-Aldrich (St. Louis, MO). Biotinylated peptide substrates used for assay development were purchased from AnaSpec (Freemont, CA) and consisted of residues 21–44 of histone H3 and contained various methylation states at the K27 position (H3K27me0, H3K27me1, H3K27me2, H3K27me3) of the K27 marker. The sequences of the peptides were: unmethylated H3K27me0, AT KAA RKS APA TGG VKK PHR YRP GGK-
AlphaLISA H3K27me2/1 Detection Assay
Detection bead mix was prepared immediately before use by diluting beads in 1× Epigenetics Buffer, prepared according to the manufacturer's instructions, and keeping light exposure to a minimum. The sensitivity of the AlphaLISA detection assay was initially investigated by testing a range of concentrations (2–20 μg/mL) of streptavidin-coated Donor Beads and anti-H3K27me2/1 AlphaLISA Acceptor Beads, always mixed in a 1:1 ratio, in an attempt to optimize signal–background ratio (S/B) and selectivity for the various methylated peptides. Experiments were carried out by adding 5 μL of 2× detection bead mix to white 384-well low-volume ProxiPlates containing 5 μL of biotinylated H3K27me0, H3K27me1, H3K27me2, or H3K27me3 peptides serially diluted in optimized EZH2 reaction buffer. Assay plates were then covered with Costar (Corning Inc., Corning, NY) adhesive aluminum seals and incubated for 1 h. Plates were measured on an EnVision instrument (PerkinElmer) using the AlphaScreen® setting adapted for optimal signal detection with a 615 nm filter, after sample excitation at 680 nm. The emission signal at 615 nm was used to quantify lysine methylation.
For the HTS and potency determination of inhibitors, an optimized AlphaLISA H3K27me1 detection assay was used in which 14 μL of 1.4× detection bead mix was added to white 384-well low-volume ProxiPlates containing 6 μL of EZH2 enzyme reaction. The final concentration of Donor and Acceptor beads was optimized to 4 μg/mL per well. Plates were then sealed, incubated for 1 h at room temperature (RT), and measured as described above. It should be noted that a two-step method of AlphaLISA bead addition may also be used, which can result in modest S/B improvement. In this case, the Acceptor beads are first incubated with completed enzyme reaction for 1 h, followed by an additional 1-h incubation with Donor beads. The final bead concentration is the same for both methods.
EZH2 Enzymatic Activity Assays
Enzyme reactions during assay development were carried out in 5-μL volumes in white 384-well low-volume white assay plates. Using HMT Buffer 2, the effects of various buffer additives were tested using a standard set of assay conditions in all experiments, including 7.5 nM PRC2, 200 nM H3K27me0 peptide, and 700–750 nM SAM and incubation times of 120–180 min. The allosteric modulation of EZH2 as a method of improving S/B was investigated by running enzyme reactions in the presence of 0–10 μM nonbiotinylated H3K27me3 peptide. Similarly, experiments to assess the effects of detergent (0%–0.1% Triton X-100 or Tween 20) were performed in the presence of 0.005% BSA before screening compound libraries in high throughput. Experiments to evaluate different types of buffers (pH 8.0) were conducted applying the same standard assay conditions to 50 mM 3-(N-morpholino)propanesulfonic acid (MOPS), Tris, 2-(N-morpholino)ethanesulfonic acid (MES), Bicine, or Hepes buffers (±0.01% Triton X-100), and comparing results with those obtained in the standard HMT Buffer 2 (±0.01% Triton X-100). Experiments to test pH-dependence of EZH2 activity were subsequently conducted with 50 mM Bicine at pH 6.8, 7.2, 7.6, 8.0, 8.4, and 8.8.
All subsequent optimization experiments and biochemical characterization of EZH2 were carried out in an optimized EZH2 reaction buffer (50 mM Bicine, pH 7.6, 0.005% BSA, 0.002% Triton X-100, and 1 mM DTT). The apparent Michaelis constant (Km ) values for SAM and peptide were determined by conducting time courses using 7.5 nM PRC2, different concentration ranges of the substrate of interest, and fixed saturating concentrations of the other substrate (2 μM H3K27me0 peptide for SAM Km and 10 μM SAM for peptide Km ). Reactions were stopped at indicated incubation times with 1× Epigenetics Buffer and diluted to ensure that the top final peptide concentration corresponded to a signal that was within the linear limits for detecting the methylated peptide product.
Peptide Km was determined using an orthogonal fluorescence polarization (FP) assay that monitors the generation of SAH in the enzyme reaction. Time courses were performed using 25 nM PRC2, 10 μM SAM, and a range of H3K27me0 peptide concentrations in black low-volume 384-well plates. Enzyme reactions were run in 6-μL volumes and were stopped at indicated incubation times by dilution in an FP detection buffer (50 mM Tris, pH 7.5, 100 mM NaCl, 0.05% BSA, 0.1% Tween 20, and 3 mM EDTA).
FP SAH Detection Assay
To 6 μL of enzyme reaction, 3 μL of 4× anti-SAH mAb in FP buffer was added, and the assay plate was incubated for 1 h at RT. Next, 4× fluorescein-labeled SAH in the FP buffer was added, and the assay plate was incubated for 30 min at RT. In the final detection reaction, anti-SAH mAb was diluted 1:500, and the concentration of fluorescein-labeled SAH was 5 nM. Assay plates were measured with a Tecan Safire II (Morrisville, NC) using the FP mode and measuring emission at 520 nm, following sample excitation at 470 nm. By reporting on the conversion of SAM to SAH by methyltransferases, the measured ΔmP could be used as an indirect method of quantifying lysine methylation.
High-Throughput Screening
High-throughput screens for the identification of inhibitors were performed by combining 2 μL of 3× concentrated compound, 2 μL of 3× concentrated PRC2, and 2 μL of 3× concentrated mixture of peptide and SAM, each prepared in optimized EZH2 reaction buffer. Test compounds were initially dissolved and serially diluted in 100% DMSO before predilution to 3× in buffer. Reactions for assessing compound potency against EZH2 contained final concentrations of 3 nM PRC2, 100 nM H3K27me0, 500 nM SAM, and 1% (v/v) DMSO. Enzyme reactions were incubated at RT for 180 min before stopping and measuring the amount of lysine methylation with the AlphaLISA anti-H3K27me2/1 detection assay. The complete assay protocol is shown in Table 1.
High-Throughput Screening Protocol Table for the EZH2 AlphaLISA Assay
1. Final concentrations are 10 μM for 1-pt., 50 μM to 0.024 nM for 22-pt. dilution series, columns 23–24 vehicle only, prepared in enzyme reaction buffer.
2. Final concentration is 1 μg/mL (3 nM), column 24 no enzyme, prepared in enzyme reaction buffer.
3. Final concentrations are 500 nM SAM/100 nM H3K27me0 peptide, prepared in enzyme reaction buffer.
4. Plates sealed with adhesive aluminum foils or placed into humidity chamber.
5. Final concentration is 4 μg/mL of each bead, prepared in the dark using 1× Epigenetics Buffer.
6. Keep dark, and do not expose to light before measurement.
7. Alpha Screen emission filter (570/100 nm), 180 ms excitation time, 550 ms total measurement time.
EZH2, enhancer of Zeste homolog 2; H3K27, lysine 27 of histone H3; PRC2, polycomb repressive complex 2; SAM, S-adenosyl-L-methionine.
In each compound assay plate, two columns of wells (16 wells per column) were reserved for assay controls. One column was used for high controls and consisted of enzyme reactions that were exposed to vehicle only [1% (v/v) DMSO]. The other column was used for low controls containing only vehicle and peptide/SAM mix, but no enzyme. Primary screens were first performed at a single concentration (10 μM) of compound. Hit confirmation was then performed in dose–response format (starting from 50 μM). Mechanism of action was investigated using SAM competition experiments in which the dose–response format was applied to enzyme reactions containing SAM at 1× appKm and at 20× appKm . To ensure that the linearity of the enzyme reaction was maintained when using high SAM concentrations, incubation times did not exceed 120 min before the addition of AlphaLISA anti-H3K27me2/1 detection reagents.
AlphaLISA Interference Assay
A bulk reaction containing 3 nM PRC2 Complex, 100 nM H3K27me0, 500 nM SAM, and 1% (v/v) DMSO was incubated at RT for 180 min. Next, 6 μL per well of bulk reaction was dispensed into assay plates containing a prediluted compound. The detection bead mix was then quickly added to a final volume of 20 μL per well and a final concentration of 4 μg/mL per well as described previously. The complete protocol for the AlphaLISA interference assay is shown in Table 2.
High-Throughput Screening Protocol Table for the AlphaLISA Artifact Assay
1. Final concentration is 1 μg/mL (3 nM), prepared in enzyme reaction buffer.
2. Final concentrations are 500 nM SAM/100 nM H3K27me0 peptide, prepared in enzyme reaction buffer.
3. Plates sealed with adhesive aluminum foils or placed into humidity chamber.
4. Final concentrations are 10 μM for 1-pt., columns 23–24 vehicle only, prepared in enzyme reaction buffer.
5. Final concentration is 4 μg/mL of each bead, prepared in the dark using 1× Epigenetics Buffer.
6. Keep dark and do not expose to light before measurement
RT, room temperature.
Data Analysis
The amount of signal generated in the presence of compounds versus that in the presence of DMSO vehicle alone (high control) was calculated using the formula:
where POC is percent of control. The raw values from the high and low controls were used to calculate plate S/B and Z′. Single-compound concentration POC, linear regression analysis plots, goodness of fit (R
2), S/B, and Z′ values were determined with Screener (Genedata AG, Basel, Switzerland) data analysis software. Linear regression analysis plots, goodness of fit (R
2), and correlation (Pearson r) of IC50 values were performed with Prism® version 5 (GraphPad Software, San Diego, CA). For IC50 determinations, data was fit to a 4-parameter equation (
Results and Discussion
Over the past decade, there has been accumulating evidence linking abnormal methylation of lysine residues on the amino-terminal tail of histone H3 to tumorigenesis, highlighting an unmet potential for the discovery and development of novel anticancer therapeutics against a wide range of epigenetic targets. 3 –5 EZH2 is a histone lysine methyltransferase that serves as the catalytic subunit of the PRC2 and has been shown to hypertrimethylate H3K27, an event that has been shown to silence tumor suppressor genes and has been associated with several types of cancer. 12 –18 The discovery of EZH2 inhibitors would be facilitated by assays that enable the HTS of large compound libraries. For our high-throughput screen, we considered a variety of methods for the measurement of methyltransferase activity. In addition to the use of traditional radiometric assays to study methyltransferase activity, 18,22 a number of coupled enzymatic assays have been described in which the assay readout is dependent on the activity of secondary enzymes that generate other detectable analytes. 23,24 Although these assays are homogenous and do not use radioactivity, they require the development of orthogonal assays to ensure that identified hit compounds are only acting on the desired enzymatic target. Another type of methyltransferase assay involves the use of thiol-reactive fluorescent reagents for detecting homocysteine. However, the homocysteine signal may be complicated by the nonspecific labeling of free thiols on the enzymes involved in the coupled enzymatic reaction. 29,30 To circumvent these issues, we developed a homogenous EZH2 assay that is HTS-amenable and uses the AlphaLISA technology to detect the methylation of a peptide derived from H3 (Fig. 1A). This format is nonradiometric and does not require a coupled enzyme reaction. Signal is generated when streptavidin-coated AlphaLISA Donor Beads bind to the biotin tag at the C-terminal end of the unmethylated peptide substrate, while AlphaLISA Acceptor Beads coated with antibodies against H3K27me2/1 recognize and bind to monomethylated H3K27 (H3K27me1) on the same peptide. These interactions bring both beads into close proximity, allowing the efficient transfer of 1 O2 from the Donor Bead to the Acceptor Bead needed to trigger a detectable emission signal. Since the antibodies on the Acceptor Beads do not recognize or bind to H3K27me0, a gain of signal in this assay indicates methylation of the H3K27 peptide by EZH2.

EZH2 AlphaLISA assay overview.
AlphaLISA Detection Assay
Before exploring conditions for the enzymatic activity of EZH2, we first optimized the AlphaLISA signal detection to enable the reliable and robust detection of methylated peptide. We started by examining AlphaLISA signal sensitivity and the specificity of the detection reagents to multiple methylation states of the H3K27 peptide (Fig. 1B). When using a mixture of AlphaLISA Donor and Acceptor Beads to compare the detection of several biotinylated H3K27 peptides, a strong increase in the AlphaLISA signal was detected in the presence of both H3K27me1 and H3K27me2. Maximum signal was reached at a concentration of 100–150 nM peptide, with H3K27me2 producing ∼2.5-fold higher S/B compared to H3K27me1. Under the same conditions, neither H3K27me3 peptide nor H3K27me0 was detected above background. Interestingly, we found that a 5-fold reduction in the manufacturer's suggested concentration of each bead improved S/B for H3K27me1 and increased specificity of detection for H3K27me2. Under these conditions, we achieved a 4-fold higher S/B for H3K27me2 relative to H3K27me1 (Fig. 1B). More importantly, reduction of the bead concentration to 4 μg/mL increased the sensitivity of peptide detection such that maximum S/B was reached with only 60 nM peptide. Due to the saturation of signal with lower peptide concentration, appropriate dilution of the enzyme reaction was required to ensure that the peptide remained within the linear range of detection.
EZH2 Reaction Buffer
Using the optimized parameters for AlphaLISA detection, several experiments were then performed to establish favorable EZH2 reaction buffer conditions. Initially, a commercial buffer (HMT Buffer 2; contains 0.01% Triton X-100) was used for the enzymatic reaction, but different buffer components and conditions were explored in an attempt to improve the methyltransferase activity of EZH2. We also explored the inclusion of an H3K27me3 peptide, which has been reported to enhance the activity of EZH2. 31 Published data suggested that there may be an allosteric mechanism of EZH2 activation in the presence of high levels of H3K27me3. Preferential interaction of EED, another subunit of PRC2, with nucleosomes containing high levels of H3K27me3 has been reported. 19 EED contains several repeating WD40 domains that are abundant in proteins involved in scaffolding functions, including protein–protein and protein–DNA interactions. 32 Protein X-ray crystallography confirmed the binding of the H3K27me3 peptide to EED and revealed that the binding was stabilized with an aromatic cage on a side of the EED protein that is opposite of that which interacts with EZH2 within PRC2. 22,31 We therefore investigated the addition of a nonbiotinylated H3K27me3 peptide as a useful method of enhancing EZH2 activity and S/B. We found that adding 5–10 μM of H3K27me3 peptide boosted the S/B of the assay ∼250% (Fig. 2). We also observed a modest 2-fold increase in V max and a 2-fold stronger affinity (Km ) for SAM when enzyme reactions were performed in the presence of 10 μM H3K27me3 peptide (data not shown). Both of these effects reflect an increase in EZH2 activity in the presence of the H3K27me3 peptide and suggest that the observed 2.5-fold increase in S/B is due to increased turnover of H3K27me0 to H3K27me1 under these conditions. It is interesting to note that previous studies found the H3K27me3 peptide to cause a marked increase in V max with no effect on SAM Km . 19 However, these alternative assays were performed using much more complex substrates (i.e., oligonucleomes).
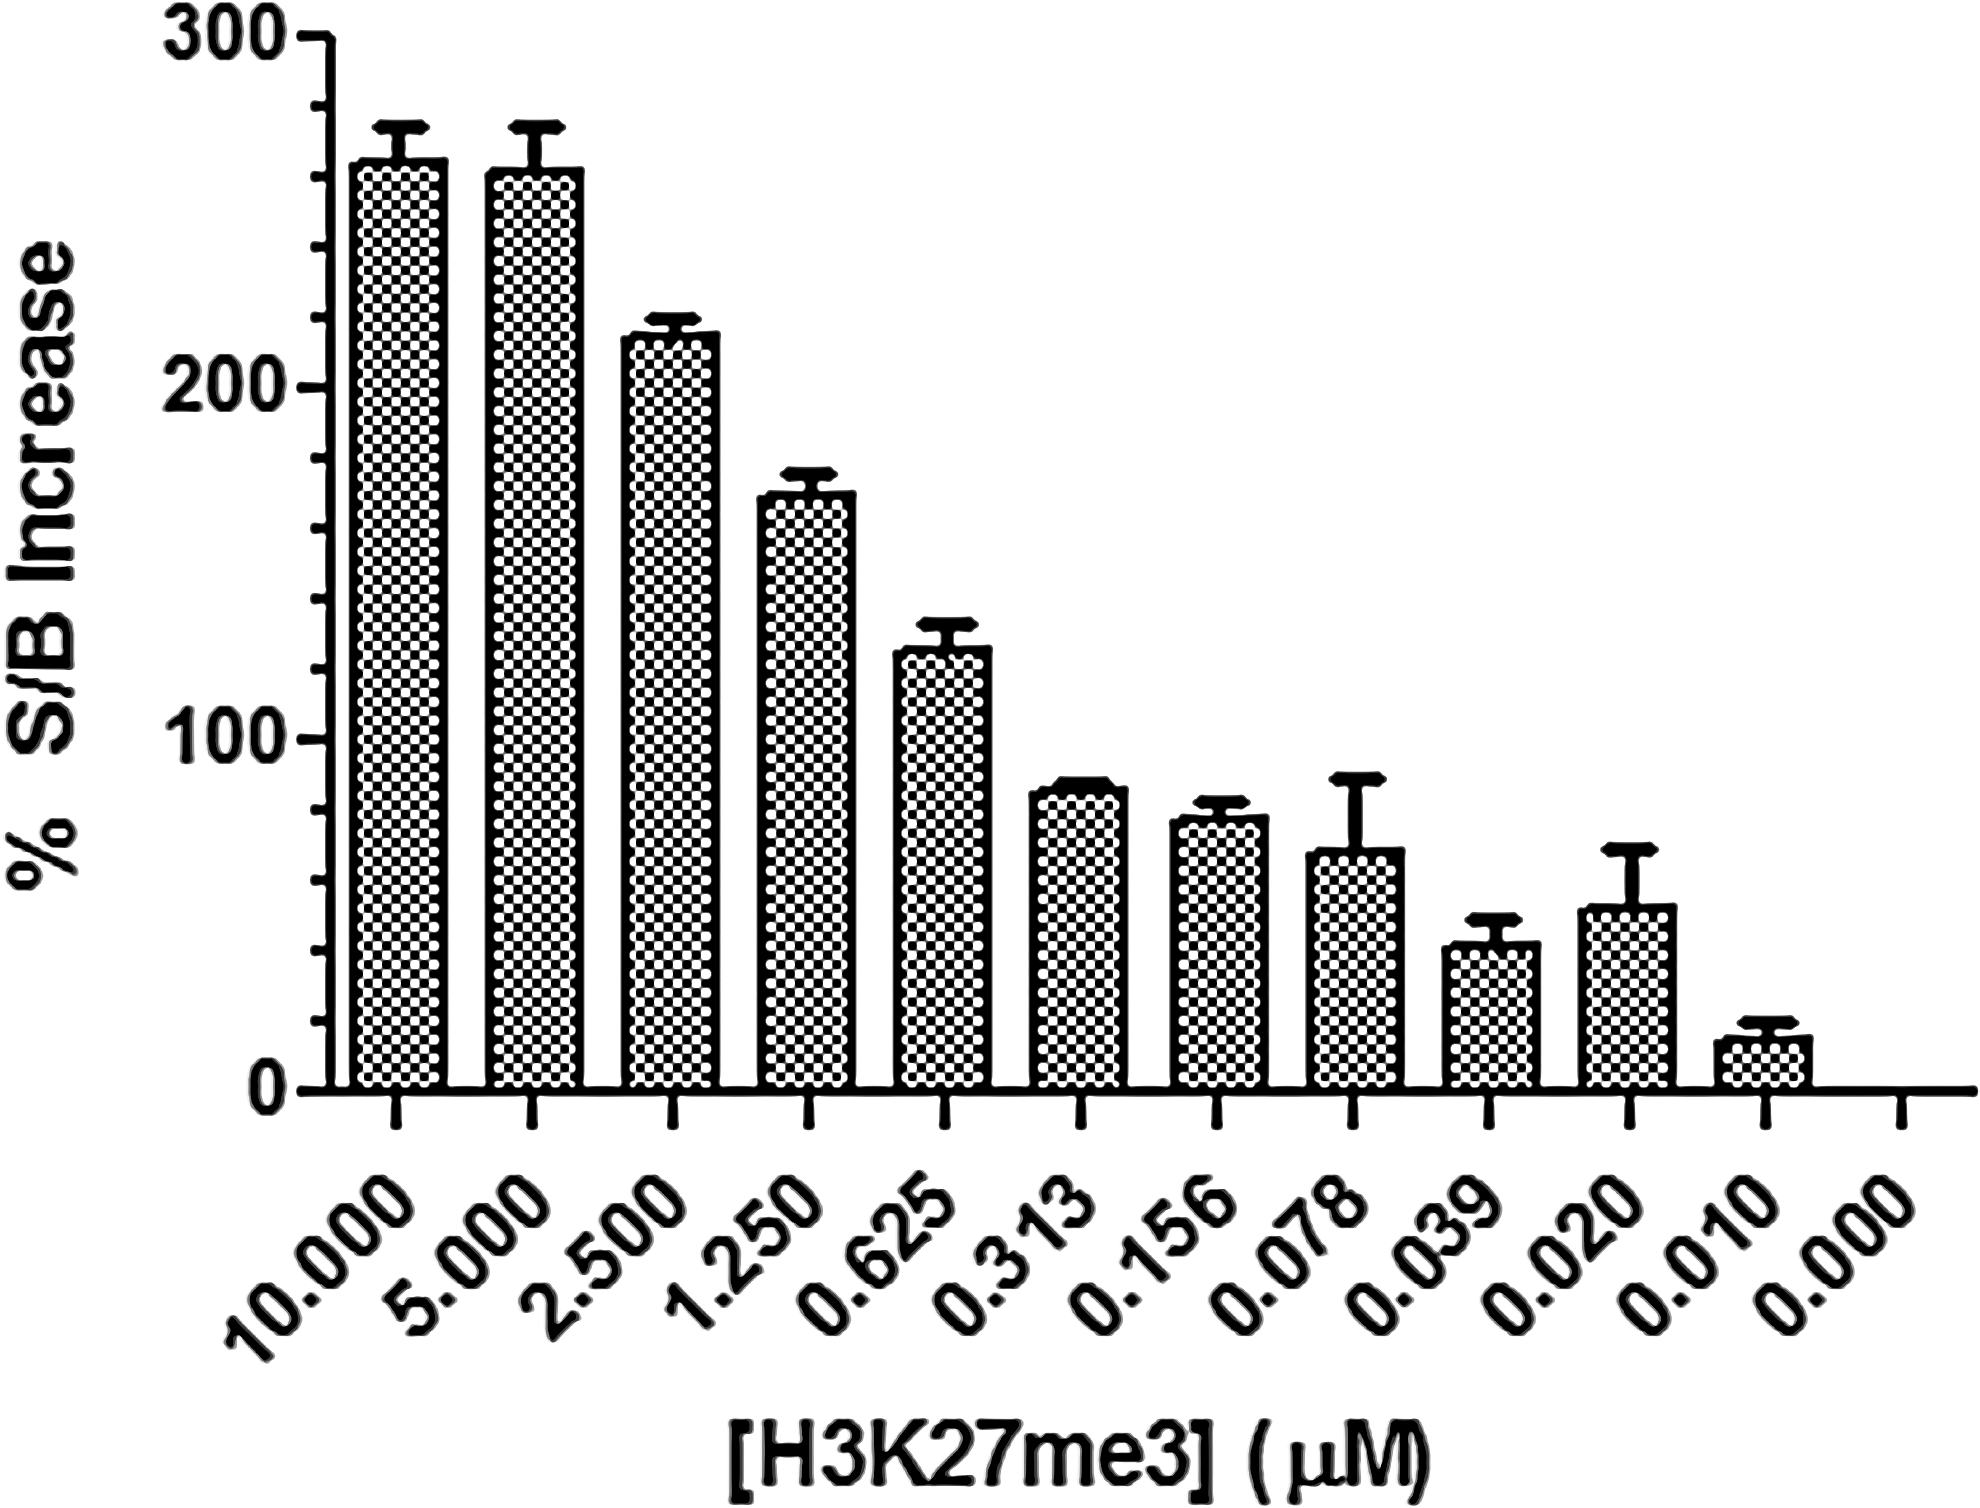
Effect of potentiating peptide on EZH2 activity. Representative experiment to assess the allosteric modulation of EZH2 activity by nonbiotinylated H3K27me3 peptide. Enzyme reactions were performed using 7.5 nM PRC2 Complex, 200 nM biotinylated H3K27me0 peptide, and 750 nM SAM in HMT Buffer 2, incubating for 2 h at RT. Reactions were carried out in the presence of 0–10 μM H3K27me3 peptide. S/B was determined by using signal observed in the absence of enzyme as background. For samples containing H3K27me3, data are plotted as a percentage increase in S/B when compared to S/B measured in the absence of potentiating peptide. Error bars represent standard error of the mean of duplicate determinations. HMT, histone methyltransferase; PRC2, polycomb repressive complex 2; RT, room temperature.
Although the use of H3K27me3 peptide in our EZH2 assay might be an attractive approach for identifying allosteric inhibitors of EZH2 activity, it could be accompanied by complicated analysis, and interpretation of primary HTS data aimed at identifying inhibitors that bind directly to EZH2. For example, compounds that neutralize only the effects of boosting peptide would look like partial inhibitors. Therefore, we chose to focus instead on further optimizing EZH2 activity by examining other components and characteristics of the reaction buffer, such as detergent and pH.
It is well known that detergent can dramatically affect enzyme activity as well as compound potency (IC50) or affinity (Kd ) in biochemical assays. 33 –35 We added 0.005% BSA to detergent-free HMT Buffer 2 and examined the effect of Triton X-100 concentration (0%–0.1%) on EZH2 activity (Fig. 3A). We found that increasing detergent concentration had a parabolic effect on EZH2 activity with a maximum S/B of ∼95 occurring in the presence of 0.002% Triton X-100. The effect of Tween 20 was also examined, and a maximum S/B of ∼75 was achieved in the presence of 0.0008% Tween 20 (data not shown). Interestingly, no assay window was obtained in detergent-free HMT Buffer 2 (Fig. 3B). This suggests that the activity of EZH2 is enhanced in the presence of an optimal concentration of detergent.
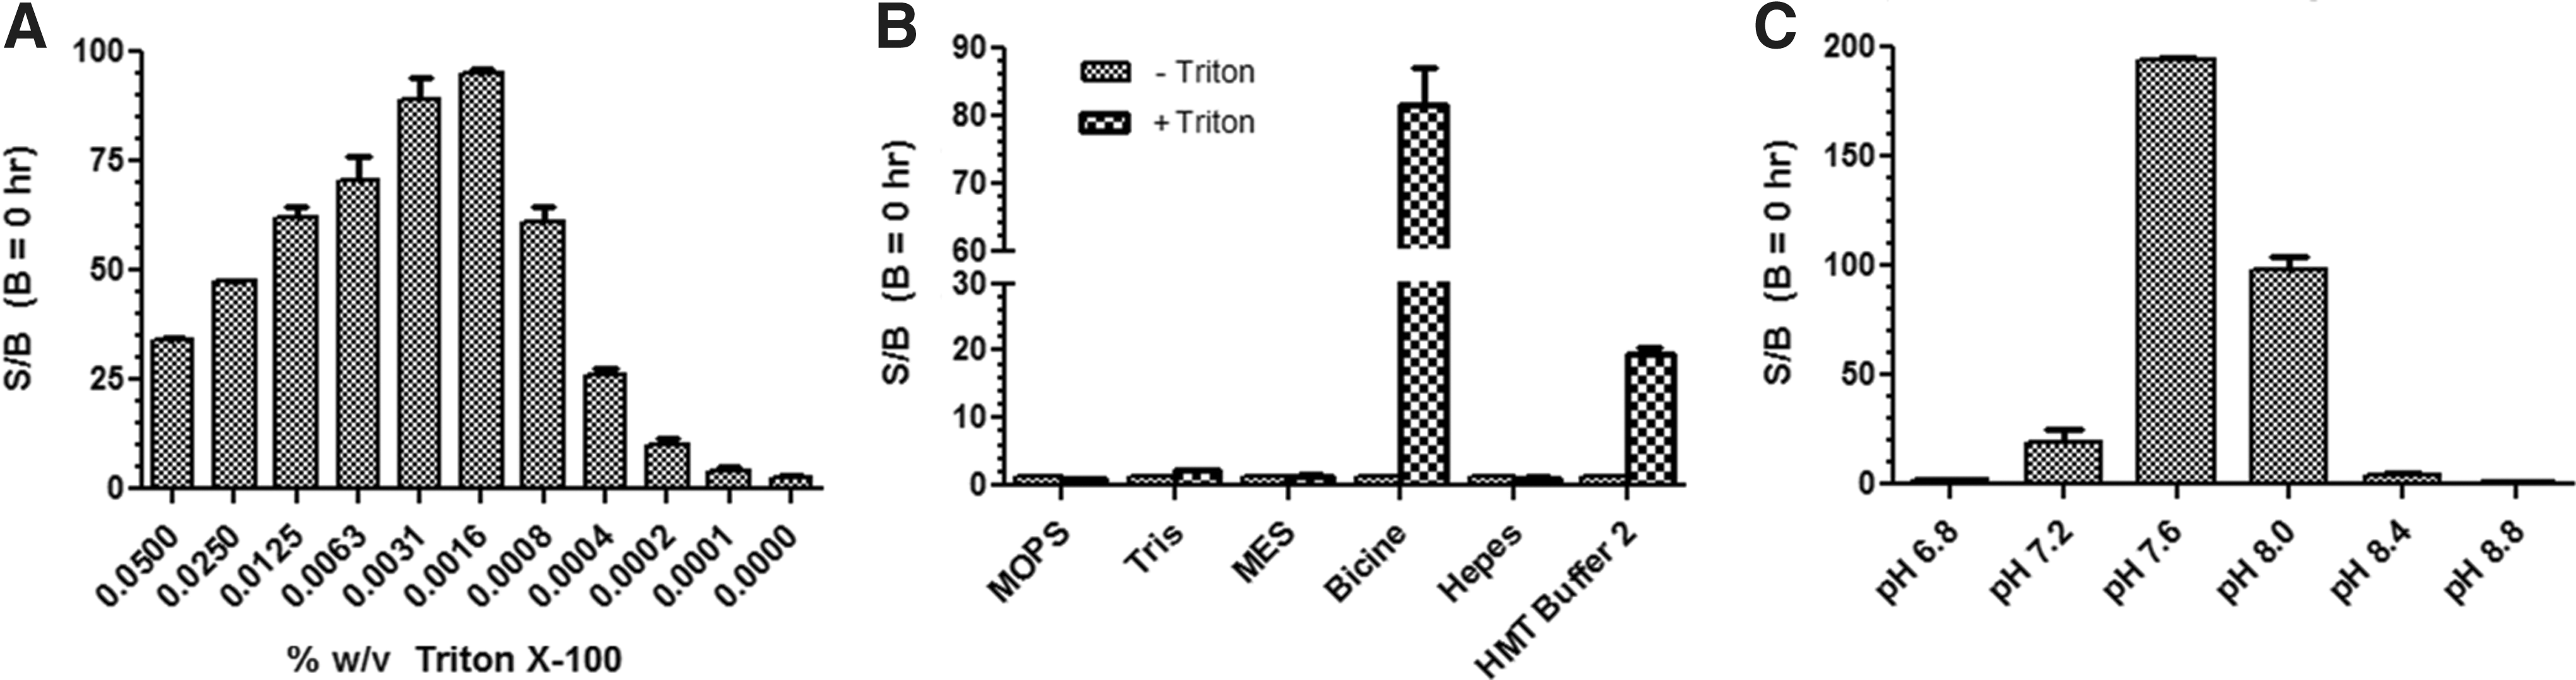
Effect of detergent, buffer type, and pH on EZH2 activity.
Next, a panel of different buffers, including Tris, Bicine, Hepes, MES, and MOPS, was evaluated at pH 8.0 to see if improved activity could be achieved compared to the commercial HMT Buffer 2 for EZH2 (Fig. 3B). Since we already found that EZH2 is not active in detergent-free HMT Buffer 2, each type of buffer was tested with and without a fixed amount (0.01%) of Triton X-100. The standard HMT Buffer 2 (±0.01% Triton X-100) was also included as a reference. After a 3-h reaction, none of the buffers resulted in an S/B higher than 2 in the absence of detergent. However, the addition of 0.01% Triton X-100 to HMT Buffer 2 restored enzyme activity and resulted in an S/B of ∼20. This effect was even more pronounced when Triton X-100 was added to Bicine buffer, which resulted in an S/B of ∼80. All other buffers tested performed worse than the standard HMT Buffer 2. We thus used the Bicine buffer with 0.01% Triton X-100 to examine the pH-dependence of EZH2 (Fig. 3C). We observed that enzyme activity and S/B were optimal at pH 7.6 with an S/B of ∼200 while appreciable enzyme activity remained at pH 8.0 with a S/B of ∼100. There was a sharp loss of S/B below pH 7.6 and above pH 8.0. Finally, we reassessed the effects of Triton X-100 on assay performance using the Bicine buffer at pH 7.6 and found that the optimal conditions were comparable to those originally observed with HMT Buffer 2. Thus, the final key elements of the optimized enzyme reaction buffer included Bicine, pH 7.6, and 0.002% Triton X-100. This optimized EZH2 buffer was used in all subsequent studies to biochemically characterize EZH2 and for the detection and potency determination of inhibitors by HTS.
EZH2 Enzyme Reaction
To determine conditions for the detection of SAM and peptide-competitive inhibitors, substrate affinity and reaction linearity experiments were performed. SAM Km was determined in the presence and absence of 1% (v/v) DMSO, since our test compounds are solubilized in DMSO, and our compound-screening concentration of 10 μM would correspond to 1% (v/v) DMSO in the EZH2 enzyme reaction (Fig. 4A). In the presence of DMSO, we observed a noticeable lag phase at the start of these progress curves, which lasted for ∼40 min. Interestingly, this lag phase was absent when the same experiment was carried out in the presence of 10 μM H3K27me3 peptide (data not shown). Starting at 50 min, signal increased linearly for up to 3 h, and the initial velocities (v 0) obtained from a linear regression fit of these progress curves allowed us to determine an apparent SAM Km of 560 nM (Fig. 4B). Interestingly, when using a concentration of SAM similar to that used in the pH-dependence study, there was approximately a 50% reduction in S/B after the same 3-h incubation time in this experiment. We suspect that this loss of S/B is due to the addition of both DMSO and BSA to the reaction buffer, both of which were absent in the pH-dependence study. Although the reason for this initial lag phase is unclear, we can only postulate that the level of H3K27me1 generated under these conditions is under the detection limit of the assay during this initial time period. It is interesting to note that this lag phase was not observed when the reaction progress was monitored by more-sensitive mass spectroscopic methods (data not shown), indicating that it was specific to the AlphaLISA assay.
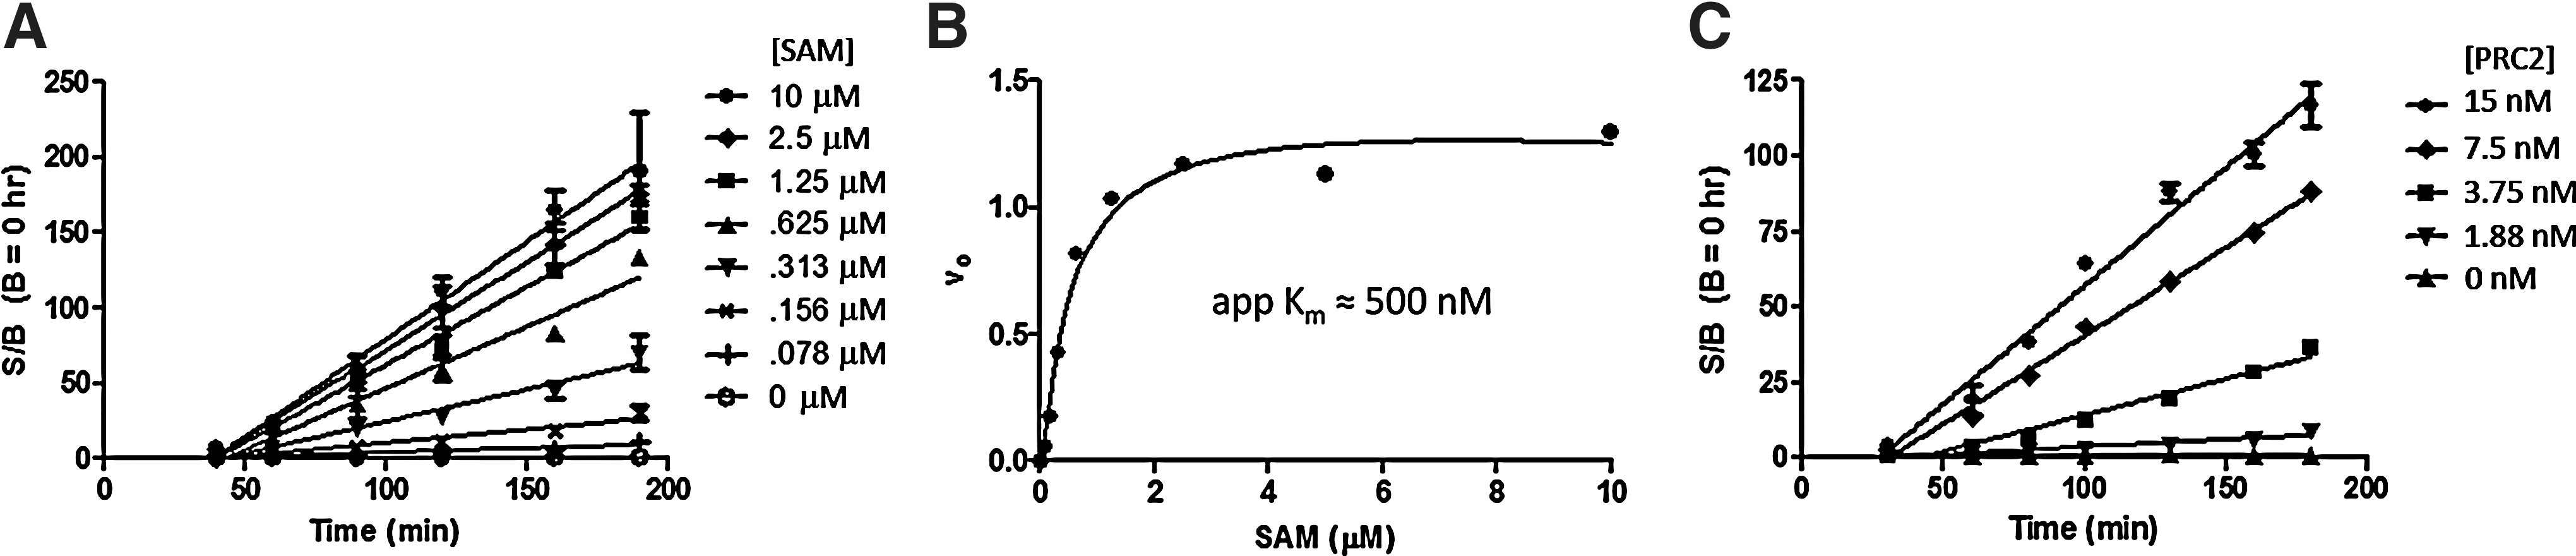
SAM Km
and linearity of the optimized EZH2 enzyme reaction using the AlphaLISA assay.
Next, we performed linear regression analysis on curves generated using different concentrations of PRC2 (containing the EZH2 catalytic subunit; Fig. 4C). For these experiments, we used 500 nM SAM (at apparent Km ) together with 100 nM H3K27me0 peptide (below its published Km ) 18 to determine the lower limit of enzyme needed to maintain an S/B that is suitable for HTS. We found that the PRC2 concentration in the enzyme reaction could be reduced to 3 nM (i.e., 0.7 nM EZH2) and still yield S/B of ∼25 under these assay conditions. For the determination of H3K27me0 peptide Km , enzyme reaction progress curves were determined using a range of peptide concentrations in the presence of saturating amounts of SAM. Samples were subsequently diluted to ensure that the peptide concentration was within the previously determined linear range for detection. However, using the v 0 values obtained from progress curves obtained at increasing peptide concentrations, we were unable to fit the resulting plot using nonlinear regression to determine the peptide Km (Fig. 5A). As peptide concentration increased, the initial velocities increased as expected, but then decreased again at the highest concentrations of peptide used in the enzyme reaction. This pattern is consistent with the documented AlphaLISA hook effect caused by unoptimized ratios of detection reagents relative to analyte. 36 However, when the samples were serially diluted to ensure that analyte concentrations were within the linear range of detection, the pattern persisted. Since peptides can modulate the activity of EZH2 (Fig. 2) by binding elsewhere on the PRC2, 22 we next investigated whether the H3K27me0 peptide may have inhibited EZH2 activity at concentrations >200 nM by an unknown mechanism. We employed an orthogonal FP assay that measures the concentration of SAH generated in the enzyme reaction. Using this assay, we obtained a typical saturation curve when plotting v 0 values and successfully determined a peptide Km of 290 nM for H3K27me0 (Fig. 5B). A peptide Km of 300 nM was also validated by mass spectroscopic methods (data not shown). Thus, the AlphaLISA format was not suitable for peptide Km determinations, and we relied instead on the Km value measured with the orthogonal assays. Furthermore, the v 0 values obtained from the orthogonal formats rule out inhibition of catalytic activity in the presence of high peptide concentrations.
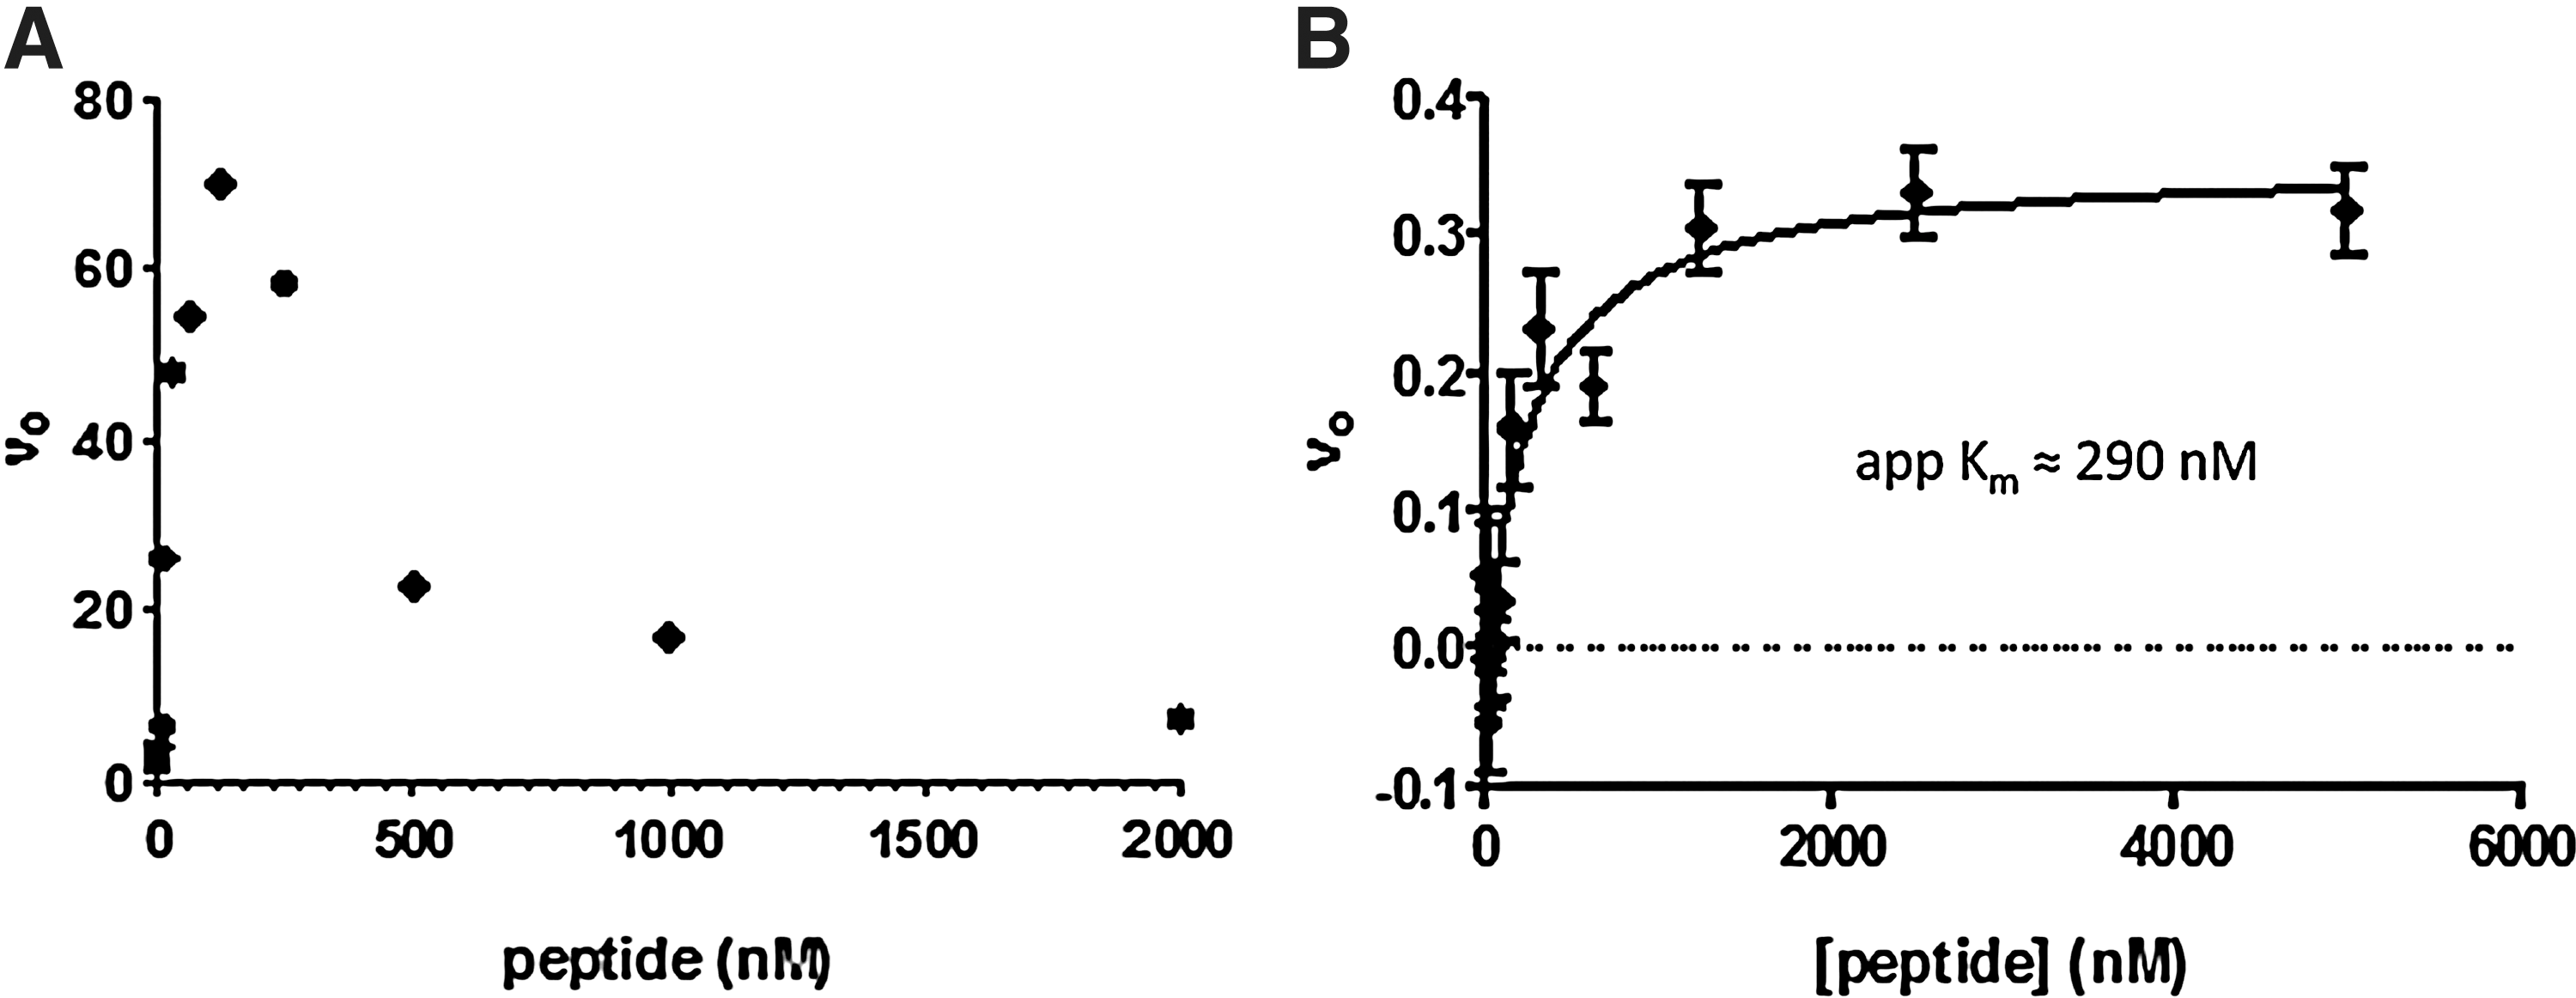
Determination of peptide Km
using AlphaLISA and FP assays.
Validation of the EZH2 AlphaLISA Assay with Reference Compounds
We determined the potency of several reference compounds with different mechanisms of action to validate the use of our optimized EZH2 AlphaLISA assay. We first tested poly-

Mechanism of action and IC50 determinations using the AlphaLISA assay for EZH2. Enzyme reactions were carried out in an optimized EZH2 assay buffer using 3 nM PRC2 Complex, 500 nM SAM, and 100 nM H3K27me0 peptide and incubating for 3 h at RT. Inhibition is plotted as percent of control (POC), based on observed S/B obtained for negative (no enzyme) controls and positive (vehicle only) controls.
EZH2 AlphaLISA Performance in a High-Throughput Screen
Given the high structural similarity in the purine and ribose portions of adenosine triphosphate (ATP) and SAM, we focused on compounds that were originally synthesized to target the ATP pocket of various kinases for initial screening. The hypothesis was that this subset of compounds would improve the probability of identifying inhibitors of EZH2, despite the differences in the H-bond networks formed with the respective enzyme classes. In addition, an internal computational program was run to generate create a diverse subset of 6,000 compounds based on Daylight fingerprint similarity. 39 This collection of compounds contained molecules originally designed and synthesized for binding to the ATP pocket of kinases. In this screen, compounds were screened at 10 μM using the optimized EZH2 AlphaLISA assay. We obtained an average-plate S/B of 17, and average Z′ was 0.7 (n=18 plates). Using an arbitrary primary hit cutoff of 50% inhibition, 280 primary hits (a hit rate of 4.6%) were chosen for further characterization. Since the AlphaLISA technology is known to be sensitive to several buffer additives, heavy metal ions, compounds that are fluorescent, colored, or interact with the 1 O2 transfer, 40,41 it was necessary to triage the primary hits in an AlphaLISA artifact detection assay, in which all compounds were added after completion of the enzyme reaction and immediately before the addition of detection reagents. Thus, all primary hits were counterscreened to identify compounds that were potential false-positive hits due to interference with the detection technology rather than inhibition of EZH2. From the hits identified in this subset of 6,000 compounds, ∼60% of the primary hits reduced the AlphaLISA signal in the artifact assay by more than 30% and were therefore flagged as artifacts. These AlphaLISA false positives were also confirmed in an orthogonal mass spectrometry assay to not inhibit EZH2 (data not shown).
The EZH2 AlphaLISA potency of all primary hits was determined in parallel with the artifact assay. Using a top concentration of 50 μM, 95 compounds produced measurable IC50 values. Only those compounds that had IC50 values <5 μM were considered as on-target hits and were progressed further. This corresponded to 83 validated hits and a validated hit rate of 1.4% from the original screen of 6,000 compounds, demonstrating the potential of this approach to identify inhibitors of methyltransferases. The EZH2 AlphaLISA IC50 values for the 83 remaining compounds were reproducible and correlated well with a Pearson r of 0.81 and a linear relationship of R 2=0.7 (Fig. 7).
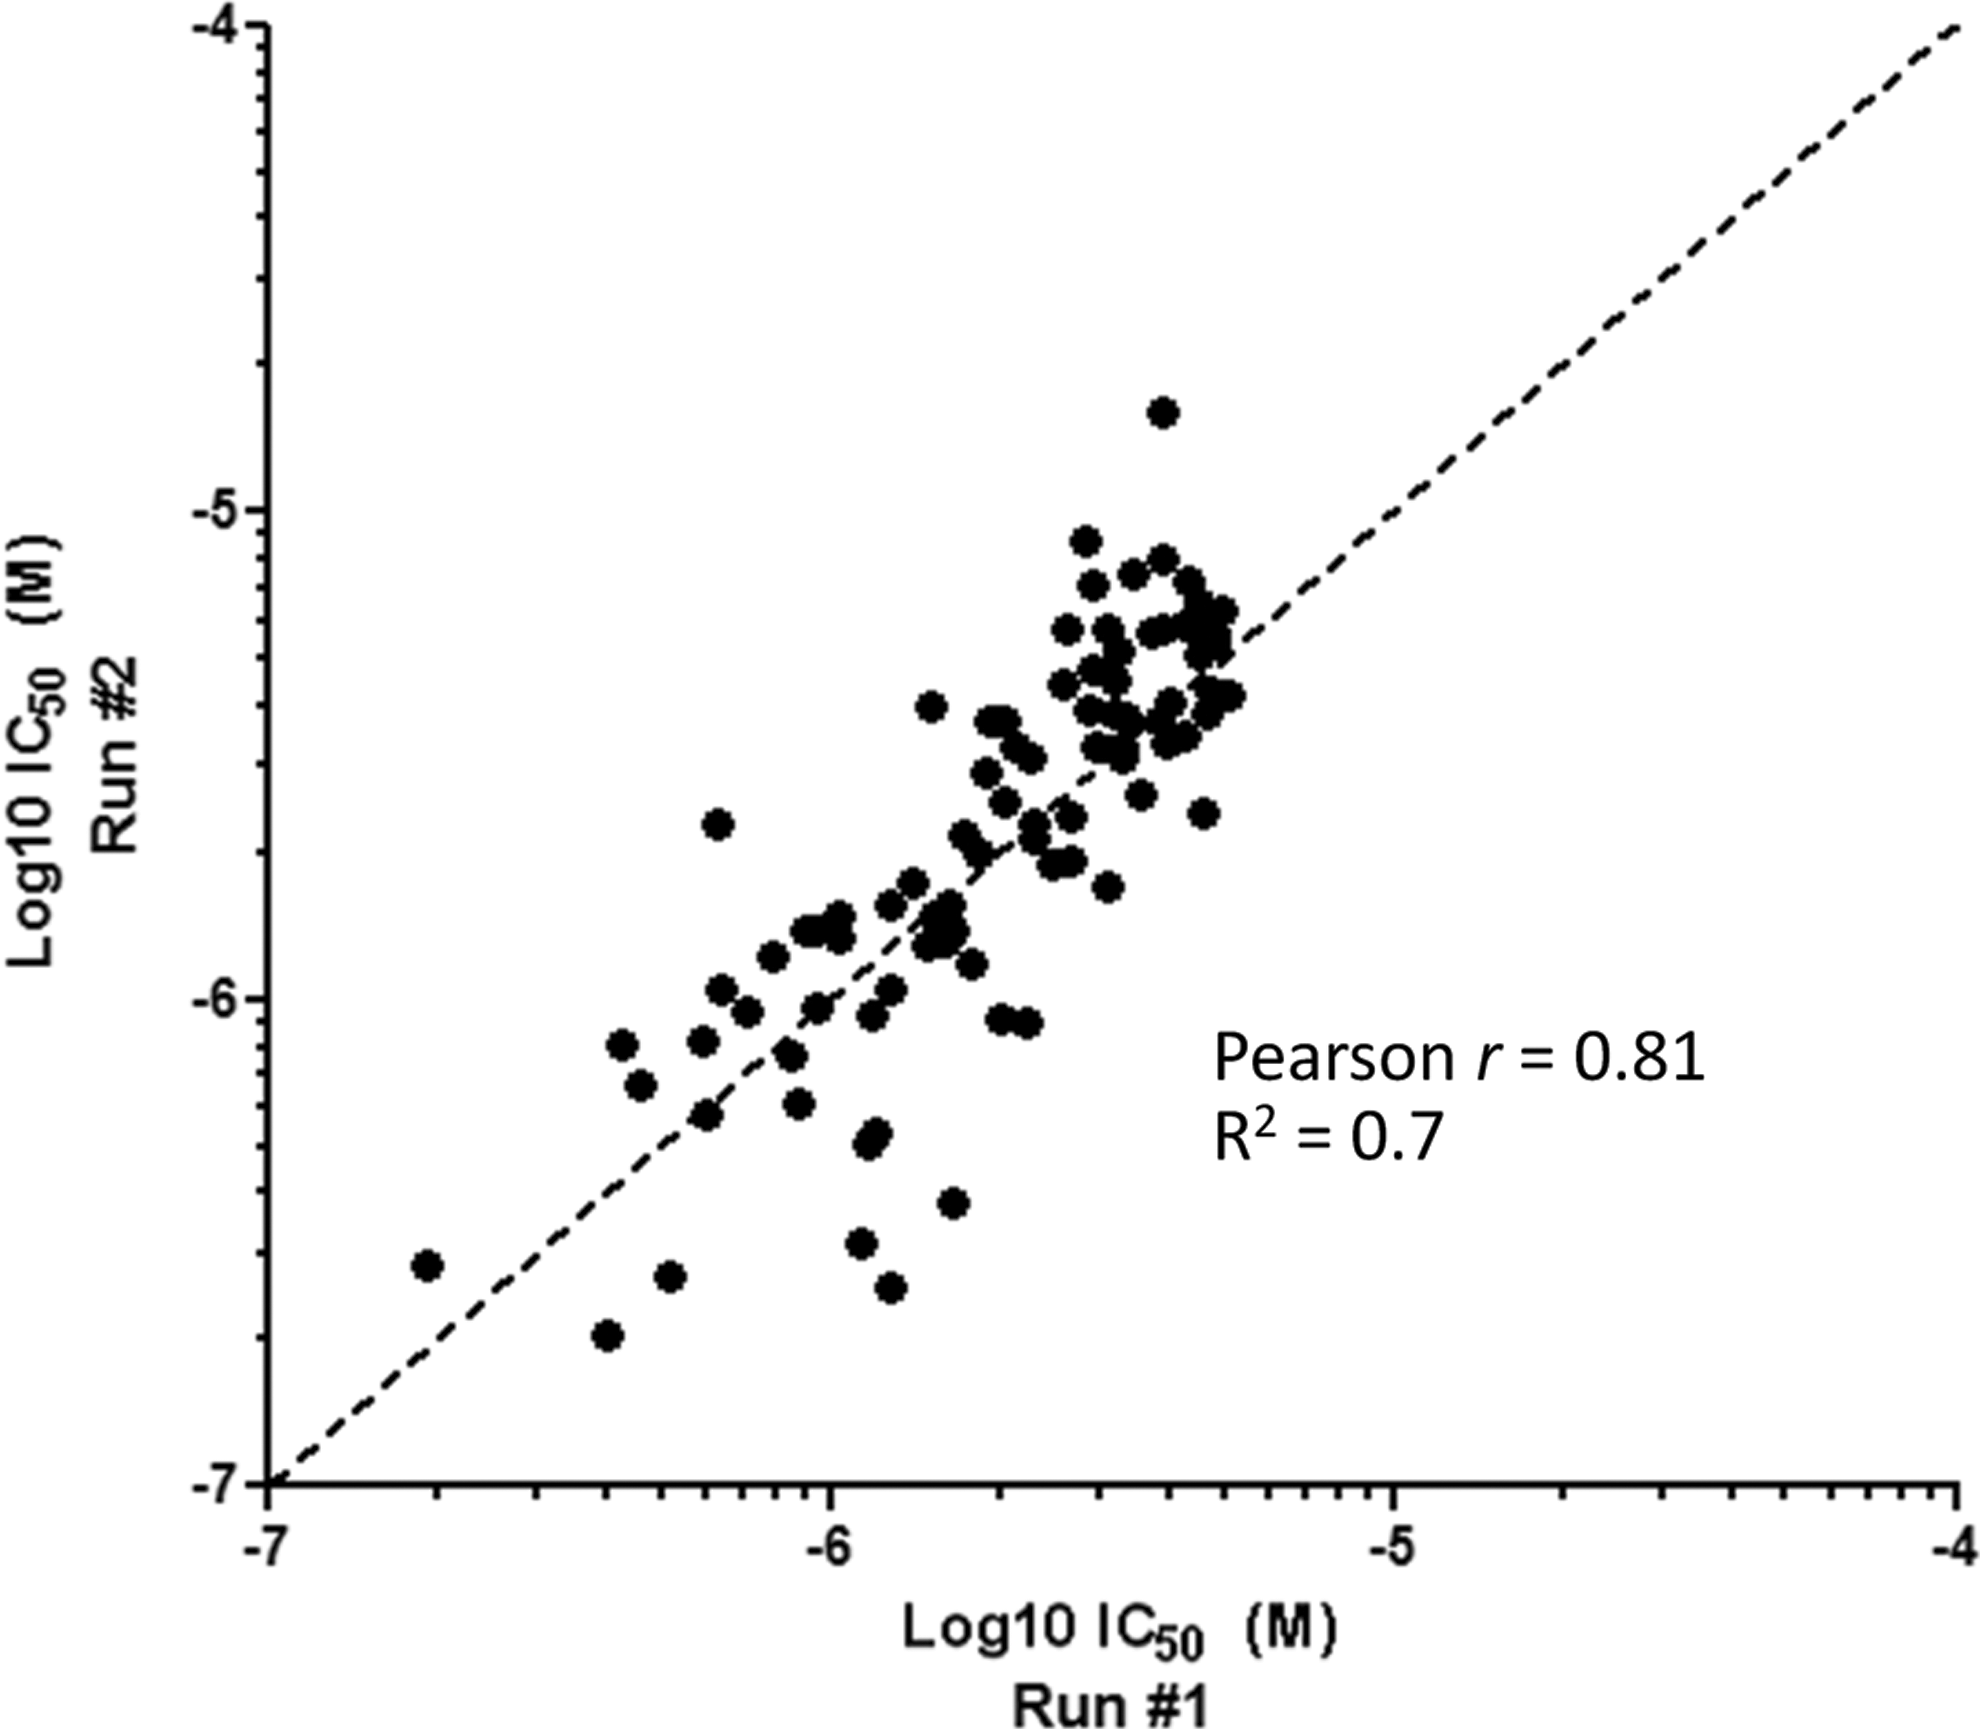
Correlation plots to determine EZH2 AlphaLISA assay quality. Assay performance was assessed by correlating replicate Log10 IC50 values (M) obtained for a set of 83 compounds, which were confirmed as hits with IC50 values <5 μM and reduced the AlphaLISA signal in the artifact assay by <30% POC at 10 μM. All initial hits that did not meet these criteria were excluded from further analysis. Linear regression (R 2) and correlation (Pearson r) of two sets of IC50 values were performed to assess the reproducibility of the assay for determining compound potency. R 2=0.81 and Pearson r=0.7 for two independent sets of IC50 determinations.
Overall, the EZH2 AlphaLISA assay was straightforward to implement in a high-throughput setting. However, it is unclear whether an assay that uses a peptide substrate would be predictive of EZH2-catalyzed turnover of more complex and biologically relevant substrates in cells. In the case of the PRC2 complex, larger and more complex substrates may interact with much higher affinity. Binding of these substrates to remote sites in the PRC2, as shown in this study with the addition of an H3K27me3 peptide to EED, may result in the allosteric modulation of EZH2 activity. In doing so, compounds that may act in this manner may provide ways of specifically targeting EZH2. Furthermore, there may be additional methylation sites available in more biologically relevant complex substrates, and depending on the nature of the interaction of the PRC2 with different methylation sites, it is important to keep in mind that the potency of compounds identified using simpler biochemical assays may not necessarily correlate with cellular activity. It is interesting to note that recent work by Diaz et al. demonstrated that the same tractable chemical series could be identified with either peptide or nucleosome as the substrate for EZH2. 42
In conclusion, we developed an AlphaLISA assay for EZH2 that allowed methylation of K27 of Histone H3 to be measured reliably in a high-throughput setting. The assay was nonradiometric and sensitive, requiring only 3 nM of PRC2 Complex (<1 nM EZH2) to achieve a robust signal (Z′>0.7) upon methylation of an H3 peptide substrate. This assay may serve as a valuable tool for the rapid screening of large compound libraries to aid in the identification of inhibitors of EZH2 activity and ultimately for the further development of innovative anticancer therapeutics that are capable of targeting abnormal changes in the epigenome.
Footnotes
Acknowledgments
AlphaLISA is a registered trademark of PerkinElmer Corp. The authors thank Dan La and Yax Sun for helpful discussions.
Disclosure Statement
No competing financial interests exist.