
Abstract
A more relevant in vitro cell culture model that closely mimics tumor biology and provides better predictive information on anticancer therapies has been the focus of much attention in recent years. We have developed a three-dimensional (3D) human tumor cell culture model that attempts to recreate the in vivo microenvironment and tumor biology in a miniaturized 384-well plate format. This model aims to exploit the potential of 3D cell culture as a screening tool for novel therapeutics for discovery programs. Here we have evaluated a Matrigel™ based induction of 3D tumor formation using standard labware and plate reading equipment. We have demonstrated that with an optimized protocol, reproducible proliferation, and cell viability data can be obtained across a range of cell lines and reagent batches. A panel of reference drugs was used to validate the suitability of the assays for a high throughput drug discovery program. Indicators of assay reproducibility, such as Z′-factor and coefficient of variation, as well as dose response curves confirmed the robustness of the assays. Several methods of drug activity determination were examined, including metabolic and imaging based assays. These data demonstrate this model as a robust tool for drug discovery bridging the gap between monolayer cell culture and animal models, providing insights into drug efficacy at an earlier time point, ultimately reducing costs and high attrition rates.
Introduction
Despite our understanding of many cancers, and their molecular biology becoming increasingly clear, the number of drugs failing clinical trials remains high. Although there are many complex reasons for the current failure rates, the use of more precise and predictive in vitro models is critical. The search for better preclinical models, which have a tangible impact on future research outcomes represents an area of high priority. Two-dimensional (2D) monolayers of cancer cell lines grown on tissue culture plastic represents the current standard for early stage research and discovery. However, cell based assays that can incorporate many of the physical and spatial cues found in tumor biology have increasingly become the focus of attention over the last decade. 14,15 Assays that utilize models that take advantage of extracellular matrix (ECM) interactions, cell-to-cell contacts and signaling, as well as nutrient gradients, are believed to provide more physiologically relevant conditions (Fig. 1). 16 3D cell culture and assays based on these models may in turn produce better predictive data on new therapeutics in early stage research. 17,18

Comparison of in vivo tumor complexity and the in vitro three-dimensional (3D) cell culture model. The tumor complexity
There is no clear definition, or set standards, for 3D in vitro models. Models range from simple excision of human tumor tissue, to multicellular tumor spheroids formed by rotating vessels or hanging drops of media, as well as the more recent scaffold based approaches. 19 –22 Multicellular in vitro models have been used for over 30 years in cancer research. 23 However, quantifying the real value of these models remains elusive, even today. Current trends utilizing scaffold, or hydrogel based, technologies aim at capturing more of the micro-environmental cues than other model systems. Scaffold based 3D cell culture, using a biological basement membrane, captures many aspects of the spatial cues (cell-to-cell communication, cell-to-matrix adhesion, physical characteristics) and provides a unique compromise between complexity and practicality. 24 The choice of a biological scaffold is not simply to deliver an anchorage site for cells but also to provide a complex structure enabling communication linked to cell behavior and function. 25 The formation of 3D structures within the culture also reproduces aspects of the nutrient and oxygen gradients found across in vivo tumors. 10,16 The natural scaffold based method has many practical advantages over other technologies, in that it is compatible with existing automated equipment, such as liquid handlers, microscopes, and plate readers. The implementation of automated microscopy platforms and liquid handlers in an increasing number of academic research and drug discovery laboratories requires models that are compatible with these systems.
There are currently several limitations of 3D cell culture, including ease of use, costs, reproducibility, and validation of application. Although several 3D based cell culture technologies have overcome some of these limitations, no single model has thus, far gained the full support of the scientific community. 15 The widespread adoption of 3D cell culture, particularly in early research and drug discovery, requires evidence that these models can provide reproducible results that deliver greater insights in tumor biology by recapitulating the complex tumor microenvironment. These models need to better mimic in vivo responses to novel therapeutics and ultimately increase the success of delivering these new therapeutics to the clinic.
Here we aim to explore a biological scaffold based 3D culture model for suitability as a high-throughput screening (HTS) assay and to evaluate the relevance of this model for preclinical studies. Cell viability and proliferation measurements will be used to establish assay suitability. Standard measurements of assay reproducibility will be used, including % coefficient of variation (% CV) and Z′-factor, which is a direct measurement of assay quality. 26 The antiproliferative effects and relevance of these findings will be discussed in relation to the potential for this new model to find utility in cancer investigations and drug discovery programs. Well characterized and established cell lines with substantial 2D supporting data were chosen for this initial study. Pancreatic and breast cancer cells representative of various states of disease progression were selected for the 3D culture studies. With little standardization of 3D cancer cell cultures currently available, the future of this field depends on obtaining high quality quantitative data that can be used as a reliable tool for cancer research. This model aims to establish a standardized and highly reproducible high-throughput 3D cell culture model that can be used for cell based screening for anticancer compounds. A range of anticancer drugs that represent several distinct mechanisms of action, as well as a panel of clinically diverse compounds were selected for the examination and validation of this model.
Materials and Methods
Materials and Reagents
Three hundred eighty four-well black/clear tissue culture treated plastic bottom optical imaging microplates (Perkin Elmer) were used for both 2D and 3D cell culture assays. The 3D assays used Growth Factor Reduced Matrigel (GFR Matrigel; BD Biosciences) as the artificial basement membrane to induce 3D growth. Dimethyl sulfoxide (DMSO; Sigma-Aldrich) was the solvent used for all compounds and as the negative (0.4% DMSO) and positive controls (10% DMSO). Resazurin sodium salt (Sigma-Aldrich) was used to measure the cell viability and antiproliferative effects of the compounds. The chemotherapeutic drugs and drugs used in the pilot screen for this study were sourced from Sigma-Aldrich, Sinova Incorporated, and Tocris Biosciences.
Cell Line Maintenance
The human pancreatic cell lines AsPc-1, BxPc-3, Panc-1 (pancreatic adenocarcinoma), and human breast cell lines MCF-7 (estrogen and progesterone receptor-positive, metastatic origin), BT-474 (ErbB2 receptor overexpression, invasive tumor origin), and MDA-MB-231 (estrogen, progesterone, and ErbB2 receptor-negative, metastatic origin) were purchased from the American Type Culture Collection (ATCC). BxPc-3 and Panc-1 are derived from primary tumors, while AsPc-1 is of metastatic origins. AsPc-1, BxPc-3, Panc-1 cells were cultured in RPMI-1640 (Invitrogen) supplemented with HEPES (25 mM; Invitrogen) and 10% heat-inactivated fetal bovine serum (HI-FBS; Invitrogen). MCF-7, MDA-MB-231, and BT-474 were cultured in phenol red free DMEM/F12 (Invitrogen) with 10% HI-FBS. All cell lines were maintained in a 5% CO2 incubator at 37°C, were cultured and expanded under standard tissue culture conditions and tested routinely for mycoplasma contamination.
Monolayer Culture
Cells were grown in the indicated media conditions until 70–85% confluence was achieved. The cells were then disassociated from flasks with accutase (Invitrogen) and resuspended in media. The number of viable cells was determined counting trypan blue stained cells with a haemocytometer. Cells were directly plated into 384-well microplates in 45 μL of media, with cell seeding densities ranging from 250–600 cells per well. The cells were allowed to adhere overnight in standard culture conditions described above. Compound or control DMSO (final concentration of 0.4% for negative and 10% positive) was dispensed using the Bravo (Agilent Technologies) automated liquid handler 24 h after cell seeding according to the dosing schedule.
Hydrogel Based 3D Culture
Growth factor–reduced Matrigel (GFR Matrigel; BD Biosciences Lot #'s 00983 10.8 mg/mL, 16253 8.9 mg/mL) was removed from −20°C storage and thawed slowly overnight at 4°C. Fifteen microliters of a 7.6 mg/mL protein concentration of GFR Matrigel diluted in cold serum-free media was pipetted into the bottom of wells and plates were placed at 37°C for at least 1 h. To limit the batch-to-batch variability associated with different protein concentrations of Matrigel, the protein concentration of the batch used for assay development was maintained throughout at 7.6 mg/mL. Maintaining the protein concentration of Matrigel provided uniformity in matrix consistency between independent batches. Cells were obtained, as above, from monolayer culture and plated at the appropriate density (ranging from 1,000 to 5,000 cells per well dependent on the size of spheroid formation) onto the Matrigel in 50–100 μL of media. Compound, positive/negative controls and media were dispensed using the Bravo automated liquid handler 72–144 h after cell seeding according to the dosing schedule (Table 1).
Three-Dimensional Assay Protocol
%CV and the Z′-factor were calculated as follows: 100% inhibition was calculated using 78 wells containing 10% DMSO (final concentration). Maximum signal (no inhibition of growth) was calculated using 78 wells with a 0.4% DMSO concentration, which was the final concentration used in compound test samples.
Spheroid size and distribution were determined using images taken either on an Olympus CellR microscope (4×or 10×objectives) or the IN Cell Analyzer 1000™ (GE Healthcare) with the 10×objective (described in Tables 2 and 3). Analysis was completed using an ImageJ based macro script or a protocol created using the IN Cell Analyzer 1000 analysis program, Developer Toolbox, to measure spheroid size. A spheroid was defined as three cells or more in direct contact and therefore, cell structures less than 30 μm in diameter were excluded from measurements.
Protocol to Obtain Size and Morphology Data from the IN Cell Developer Software
Step 6 is optional.
3D, three-dimensional.
Protocol to Segment and Analyze Size and Morphology Data from ImageJ Software
Step 3 is optional.
Drug Treatment
The 2D monolayer assays were undertaken over a period of 7 days, while the 3D cell culture assays were performed over either a 9 or 12 day period, depending on the cell line. However, the cells in both assays were exposed to the drugs for the same 6 day period. For the 3D assay, compounds were added to the media once cell aggregates had reached 50–100 μm in diameter (generally day 3). Allowing the cells to form 3D structures before the addition of drug treatments produced a more relevant phenotype in an attempt to emulate existing micro tumor formations in vivo. Stock solutions of 10 or 50 mM were prepared for each drug, depending drug solubility, and serial diluted in 100% DMSO using the Bravo liquid handler. Drug concentrations were further diluted 1:25 in sterile water in an intermediate dilution plate to achieve a final DMSO concentration of 4%. Compound dilutions from this plate were then added directly to the cells resulting in a further 1:10 dilution. Fresh media and drug/controls were added every 48 h using the Bravo liquid handler for the duration of the test period. In plate controls were used to normalize the data for both assays (0.4% DMSO for the no inhibition control and 10% DMSO for the 100% inhibition control). IC50 values were calculated using nonlinear regression and sigmoidal dose-response curves (GraphPad Prism).
Metabolic Activity Assay
Resazurin was added to a final concentration of 600 μM per well on the final day of the assay and incubated for the appropriate time according the conditions optimized for each cell line. Resazurin was used to detect metabolic activity in human cells by the oxidation of the blue dye to a red fluorescent product in metabolically active cells. A measurement of fluorescent intensity was recorded on a PerkinElmer EnVision® (excitation: 530 nm; emission: 595 nm).
Live Cell Staining and Image Analysis
Wells were rinsed three times with phosphate buffered saline (PBS; Invitrogen) and 2 μM of calcein AM was added to each well and incubated at 37°C for 2 h. 3D cell culture images were captured with the PerkinElmer Operetta® imaging platform using the 20×objective. Five Z-sections of each well were taken with six fields imaged per well, with slices of cell aggregates combined using a maximal projection image for subsequent quantification using the Harmony™ (PerkinElmer) analysis software. A 384-well plate would be imaged in 45 min with “on the fly” analysis. Morphological features, including size, shape, and number of objects were selected and used to determine cell viability and drug efficacy in an automated fashion using the Harmony analysis software.
Pilot Screen
Seven hundred and forty-one clinically relevant compounds/drugs for a variety of unrelated disease indications were tested using a 72 h cell monolayer (2D) viability assay described above. Compounds or drugs which exhibited equivalent or greater anticancer activity to that of selected standard of care drugs were subsequently tested using the 3D culture method described above.
Statistics
All dose response curves are presented as the mean and the standard error, and are representative of n≥3 experiments unless otherwise stated. Analysis was performed using Graphpad Prism™ software.
Results
Development of a 3D Cell Culture Assay for Cancer Cell Lines
We discuss here a new assay designed to improve the current 3D culture assays used for the evaluation of cancer cell lines. Our objective was to overcome the current limitations of these cell models for HTS. Two separate automated technologies were used to measure parameters associated with either cell viability or metabolic activity. Initially, characterization of the miniaturized 3D cell culture into a 384-well format using reconstituted basement membrane (Matrigel) for breast and pancreatic cell lines was performed to ensure consistency with spheroid size, distribution, and overall reproducibility. The established 3D cell culture assay is comprised of two parts: (1) the measurement of metabolic activity using total well fluorescence in response to drug activity, and (2) the measurement of cell viability within the spheroid structure using live cell imaging.
Three-dimensional cell structures or spheroids increase in size over time at different rates depending on the cell line and media conditions. Spheroids appear healthy until at least Day 12 of culture (Fig. 2A). A healthy spheroid was defined as one where the cell mass remained tightly packed and the number of shedding apoptotic cells present in the basement membrane was minimal. To determine consistency and reproducibility of the model over time, as well as between batches of reagents, the mean diameter of the spheroids within wells was measured over a period of 12 days. Mean diameter is defined as the combination of mean diameter measurements from multiple spheroids per well for n≥3 experiments. We found that the spheroid size remained consistent for the breast (Fig. 2B) and pancreatic cancer cell lines (Fig. 2C) throughout the period tested. After 12 days of 3D growth, cell lines began to decline in health primarily due to overcrowding in the well and 3D structures merging together. This resulted in a loss of reproducibility for image analysis and loss of linearity for fluorescent readings. Morphological parameters for the six cancer cell lines investigated were measured using protocols generated using the proprietary IN Cell Developer Toolbox software (Fig. 3 and Table 2) and the open source ImageJ software (Fig. 4 and Table 3). Protocols were designed to analyze growth of spheroids in 3D culture over time in an automated manner.
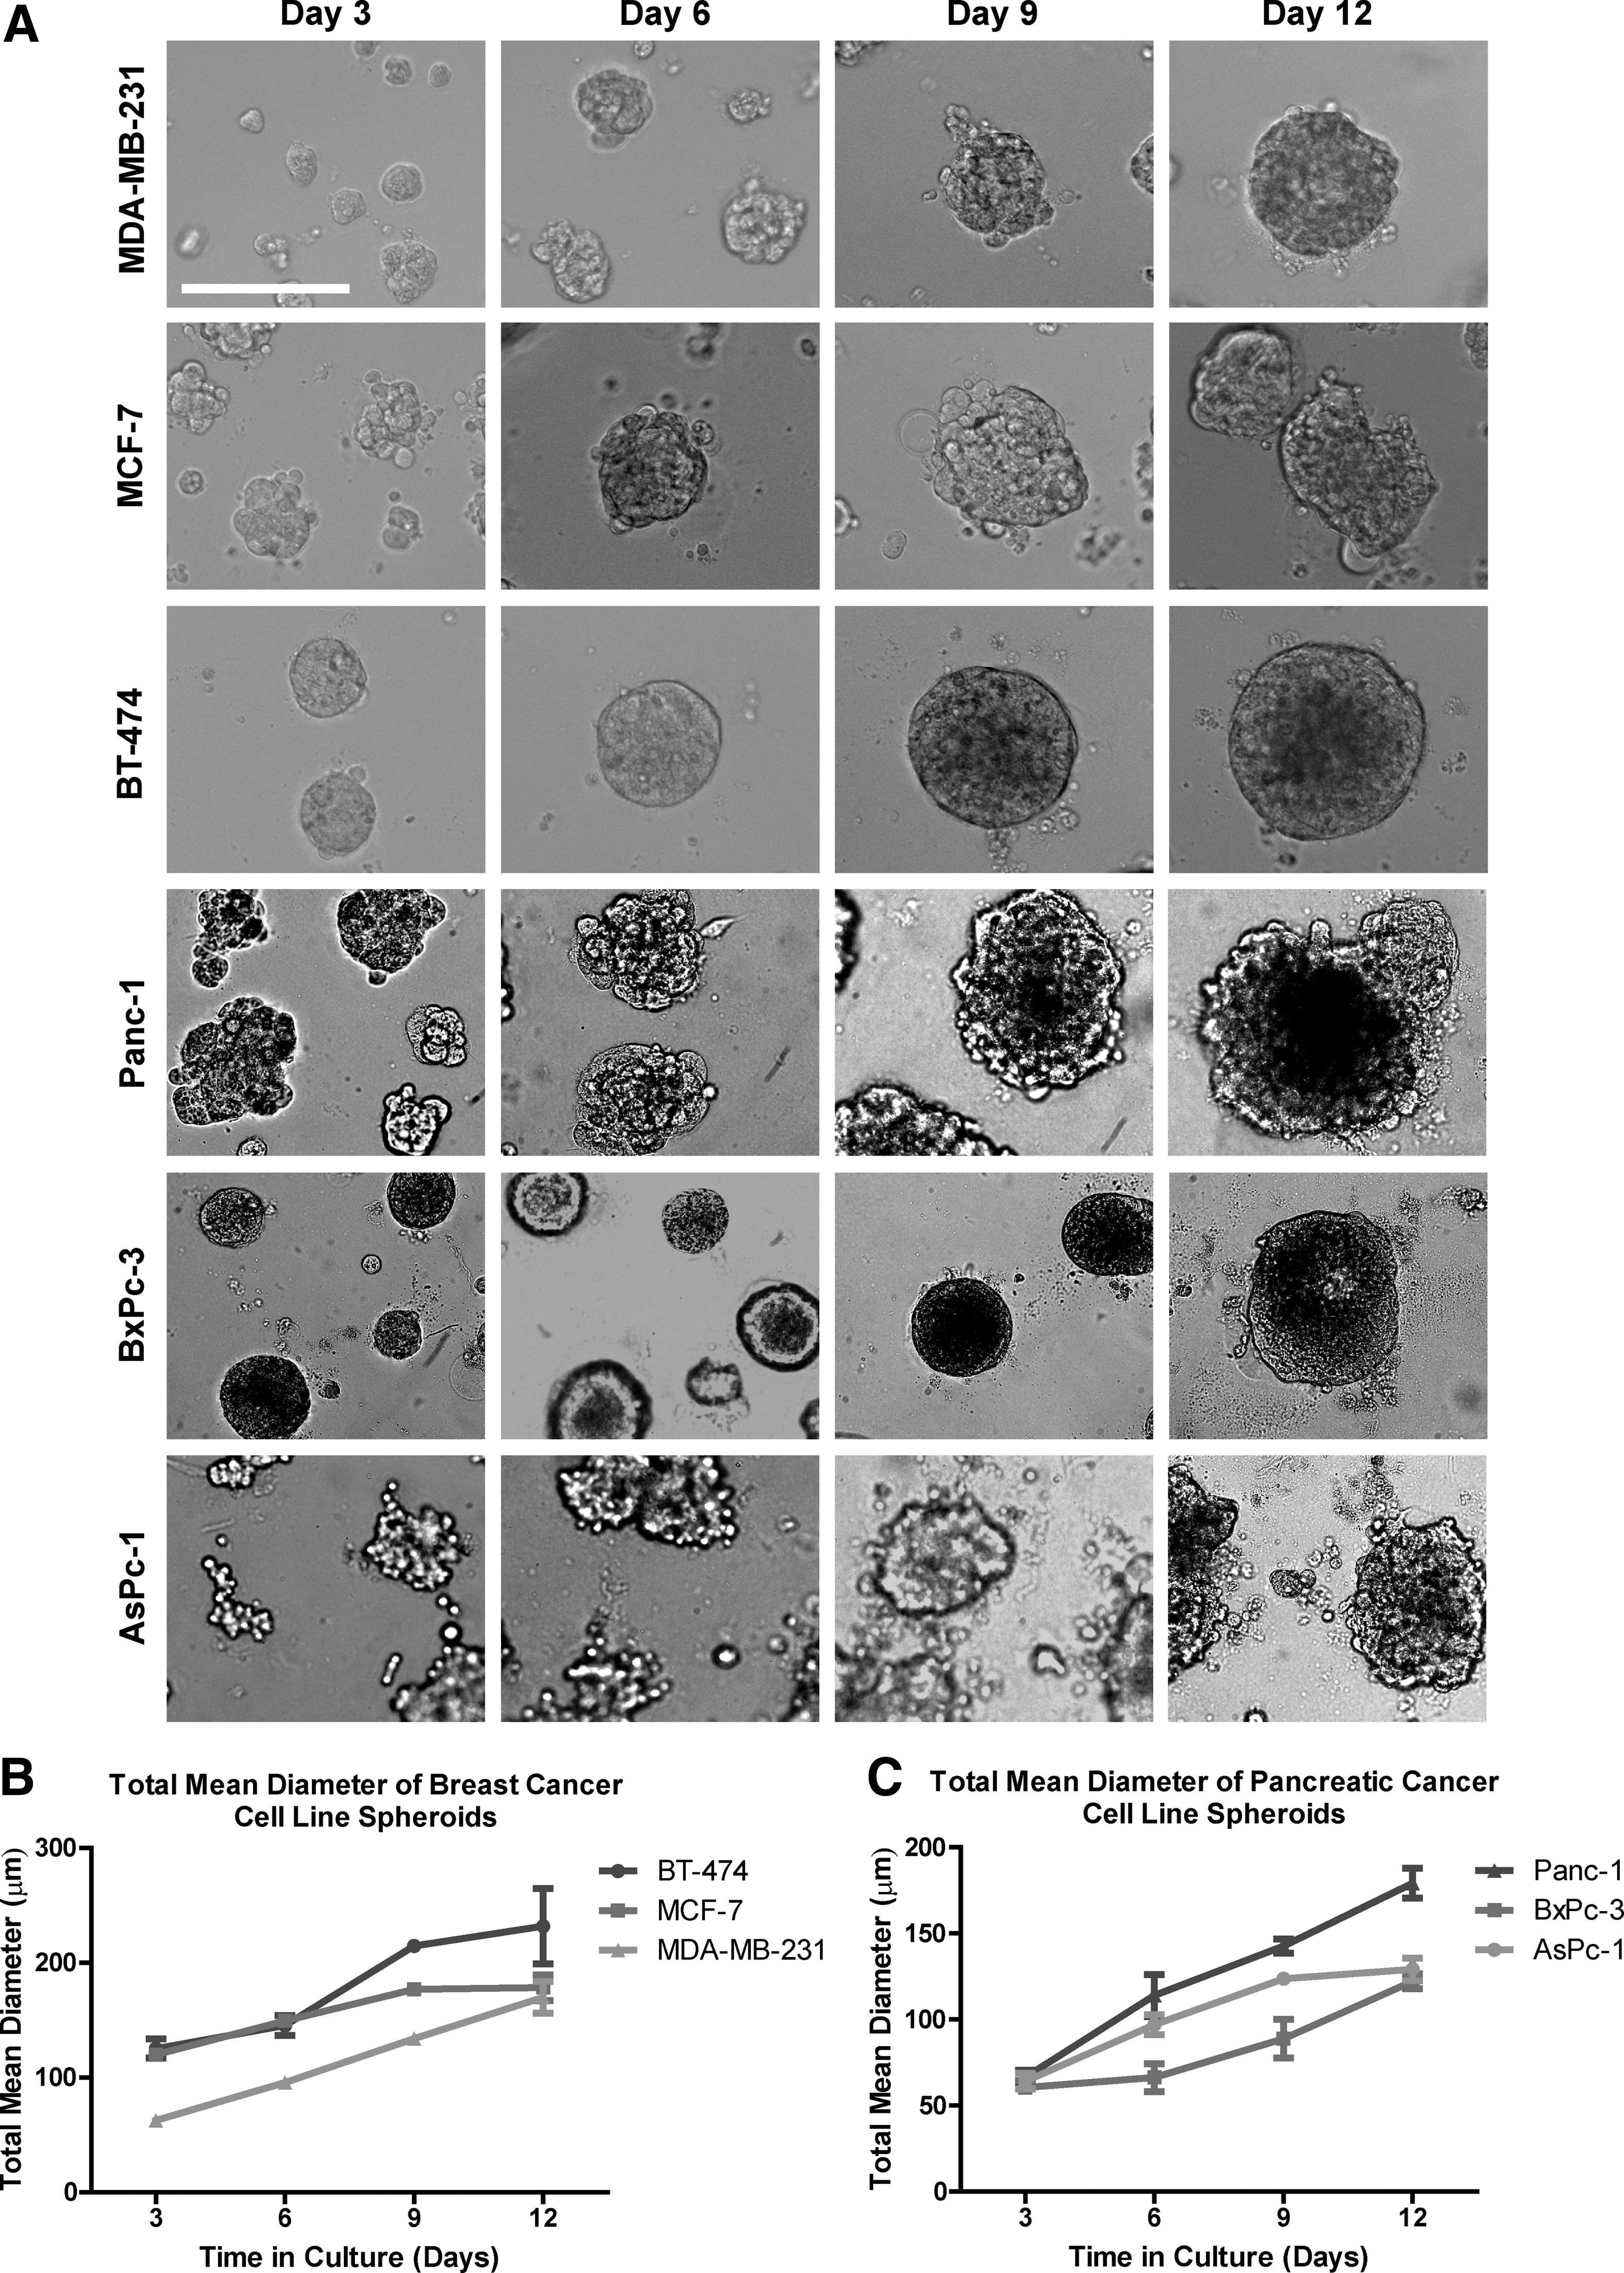
Size measurements of 3D spheroids over time.

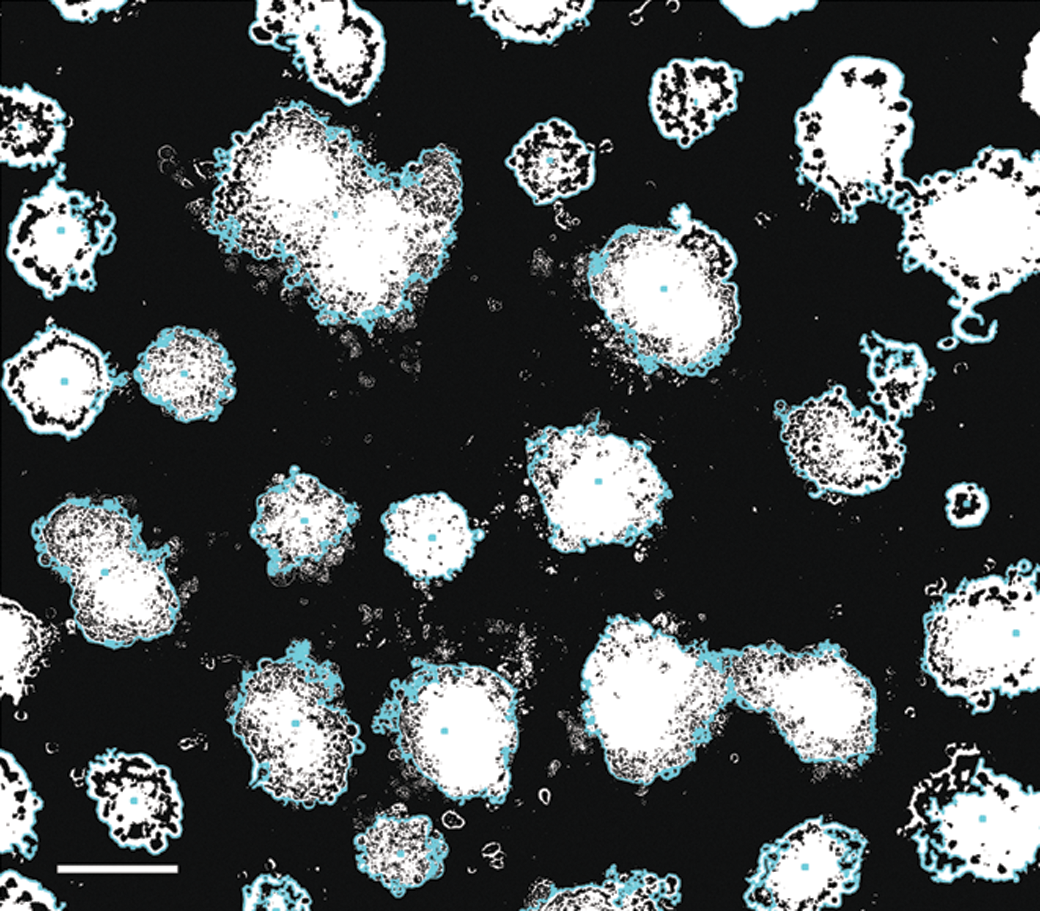
A representative brightfield image of untreated Panc-1 spheroids on Day 9 from the IN Cell imaging platform overlaid with the object segmentation outline from the Developer Toolbox software clearly able to identify 3D objects from the background signal. Scale=200 μm. Color images are available online at
A representative image of untreated Panc-1 spheroids on Day 9 illustrating output from ImageJ with an overlay of the automatic segmentation identifying the 3D cell structures. Scale=200 μm. Color images are available online at
The spheroid distribution within wells was considered important as having wells containing between 40–50 healthy spheroids may be more biologically relevant compared to assays that contain only one spheroid per well. The spheroid size distribution follows a Gaussian distribution for all cells lines over a 9 day period as illustrated by Figure 5A and B, which show the spheroid size distribution for BT-474 breast cancer and Panc-1 pancreatic cancer cell lines, respectively, at Day 9. In addition, the number of spheroids per well at Day 9 provided statistically robust image-based data for analysis (Fig. 5C, D).
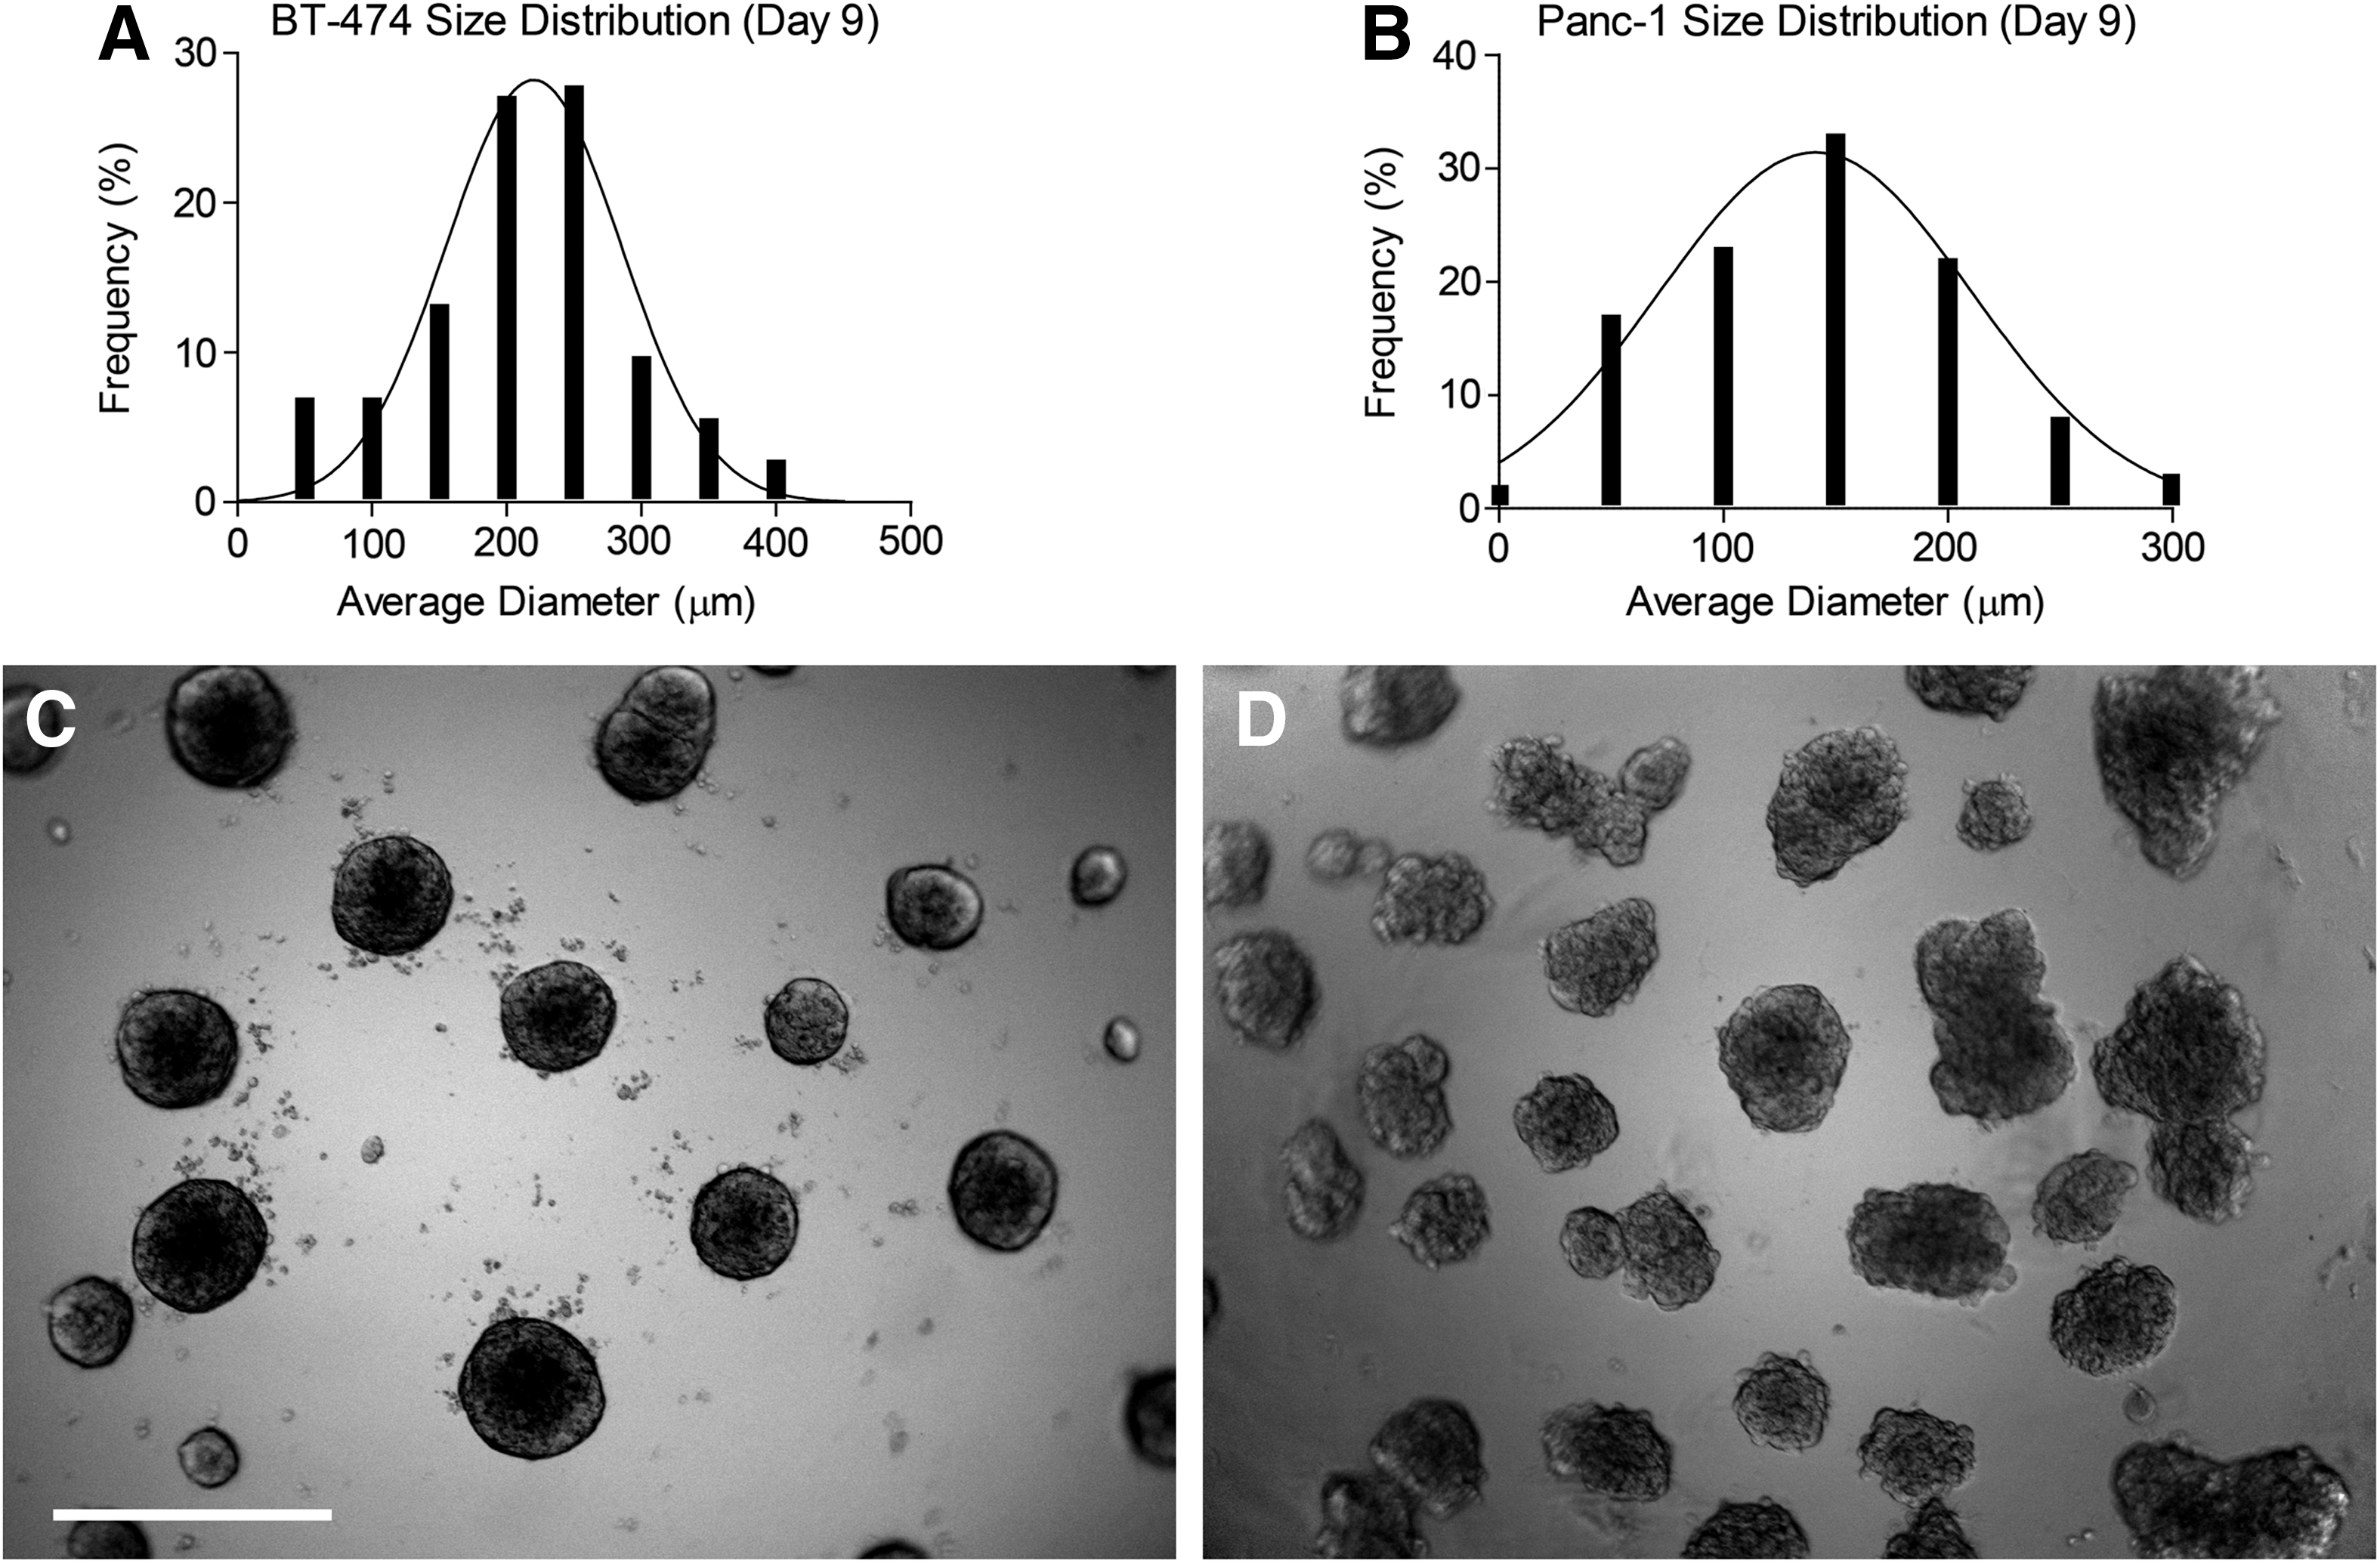
Size distribution in breast and pancreatic cell lines BT-474 and Panc-1 measured on Day 9
Reproducibility and suitability of the 2D and 3D assays described for HTS were evaluated based on the %CV and the Z′-factor. For the breast cancer cell lines tested, the intra-plate %CV was less than 7% for 2D cultures and 11% for 3D. The Z′-factor was greater than 0.74 for 2D and 0.58 for 3D. For the pancreatic cell lines assessed, the intra-plate %CV was less than 12% for 2D and 15% for 3D and the Z′-factor was greater than 0.52 for 2D and 0.46 for 3D. These data indicate that the 2D monolayer and 3D cell culture assays described herein are robust assays.
To determine if resazurin was suitable for detecting the proliferation and metabolic activity of cells under the monolayer and spheroid assay conditions described, measurements of fluorescent intensity were made in wells seeded with a range of cell densities. The results indicate that there is a linear relationship between the fluorescent intensity and the number of cells in monolayer culture (data not shown) and the number of cells that have formed spheroids per well for all breast (Fig. 6A) and pancreatic cell lines tested (Fig. 6B). Loss of linearity was observed with cell numbers that were initially seeded beyond 1,250 cells per well for MDA-MB-231, 5,000 cells per well for MCF-7 and BT-474; and 2,500 cells per well for AsPc-1, BxPc-3, and Panc-1 cell lines. These results indicate that resazurin is suitable for measuring the anticancer properties of compounds or drugs.
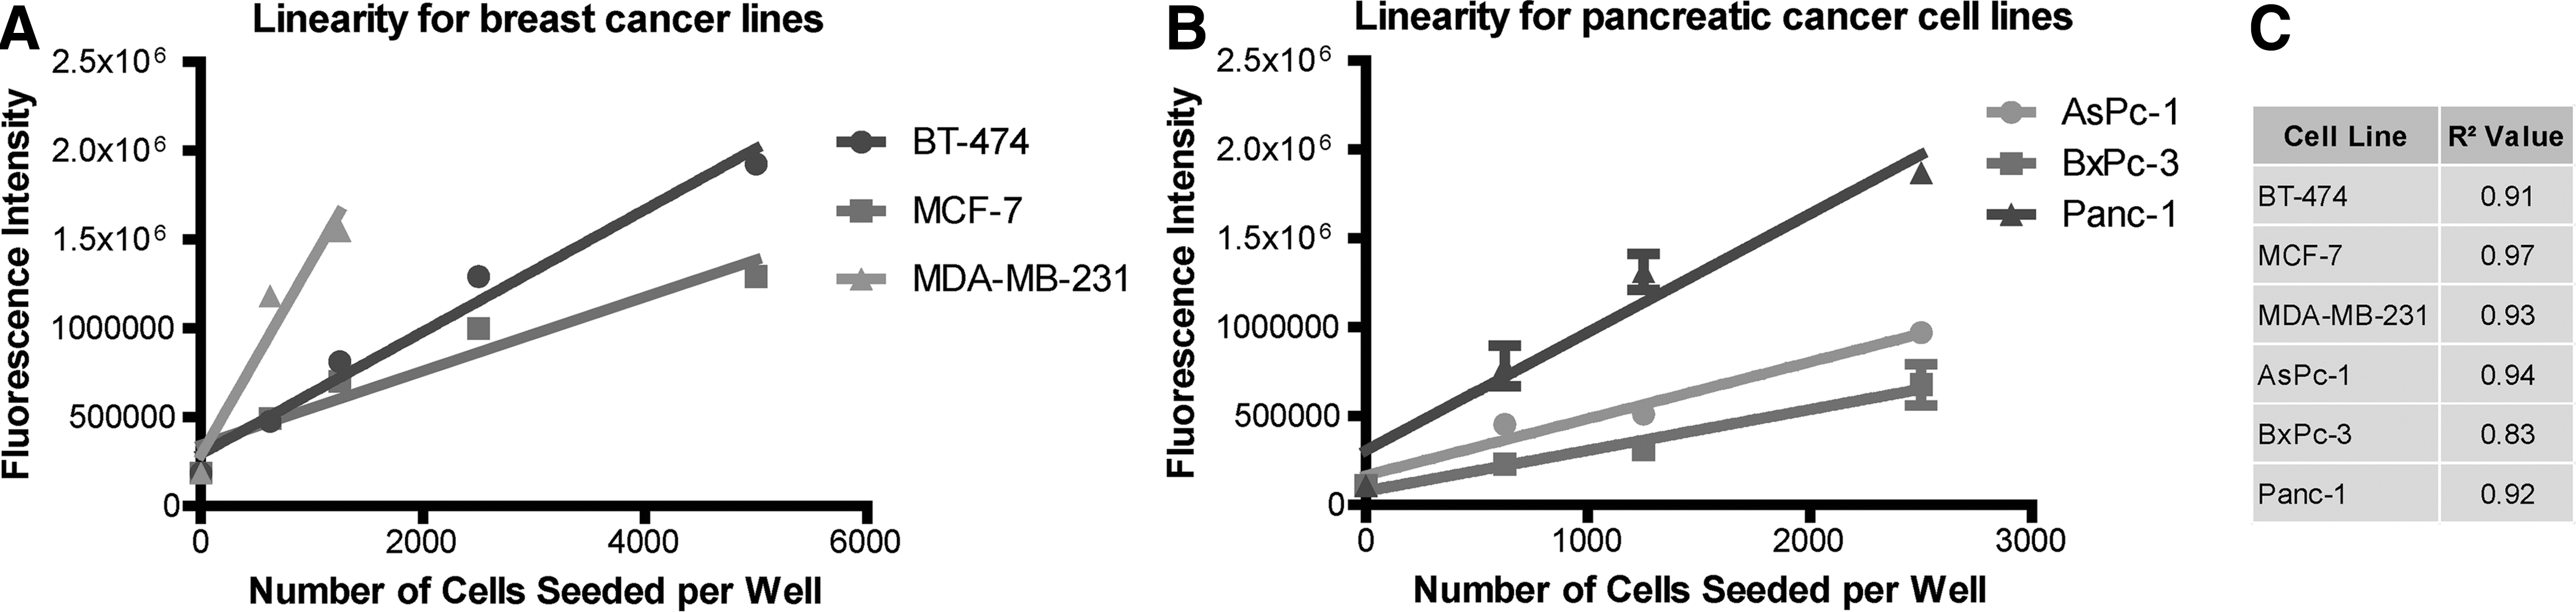
Linear relationship between resazurin and number of cells initially seeded per well for breast and pancreatic spheroids measured on Day 9
Measuring Drug Activity Using the Developed 3D Cell Culture Assays
Several chemotherapeutic drugs, (doxorubicin, vinorelbine, gemcitabine, docetaxel, paclitaxel, 5-fluorouracil, and epirubicin) were used for assay validation and identification of reference drugs demonstrating reproducible dose response curves. Epirubicin is presented here as a representative anticancer drug. Determination of drug activity involved measurement of (1) metabolic activity based on resazurin fluorescent intensity measurements using the PerkinElmer EnVision, and (2) image acquisition and analysis using the PerkinElmer Operetta. The metabolic indicator dye resazurin was used to measure drug activity and calculate IC50 values. An example of the data generated is shown in Figure 7A and B, which shows the inhibitory effects of epirubicin against one breast (BT-474) and one pancreatic (Panc-1) cancer cell line.
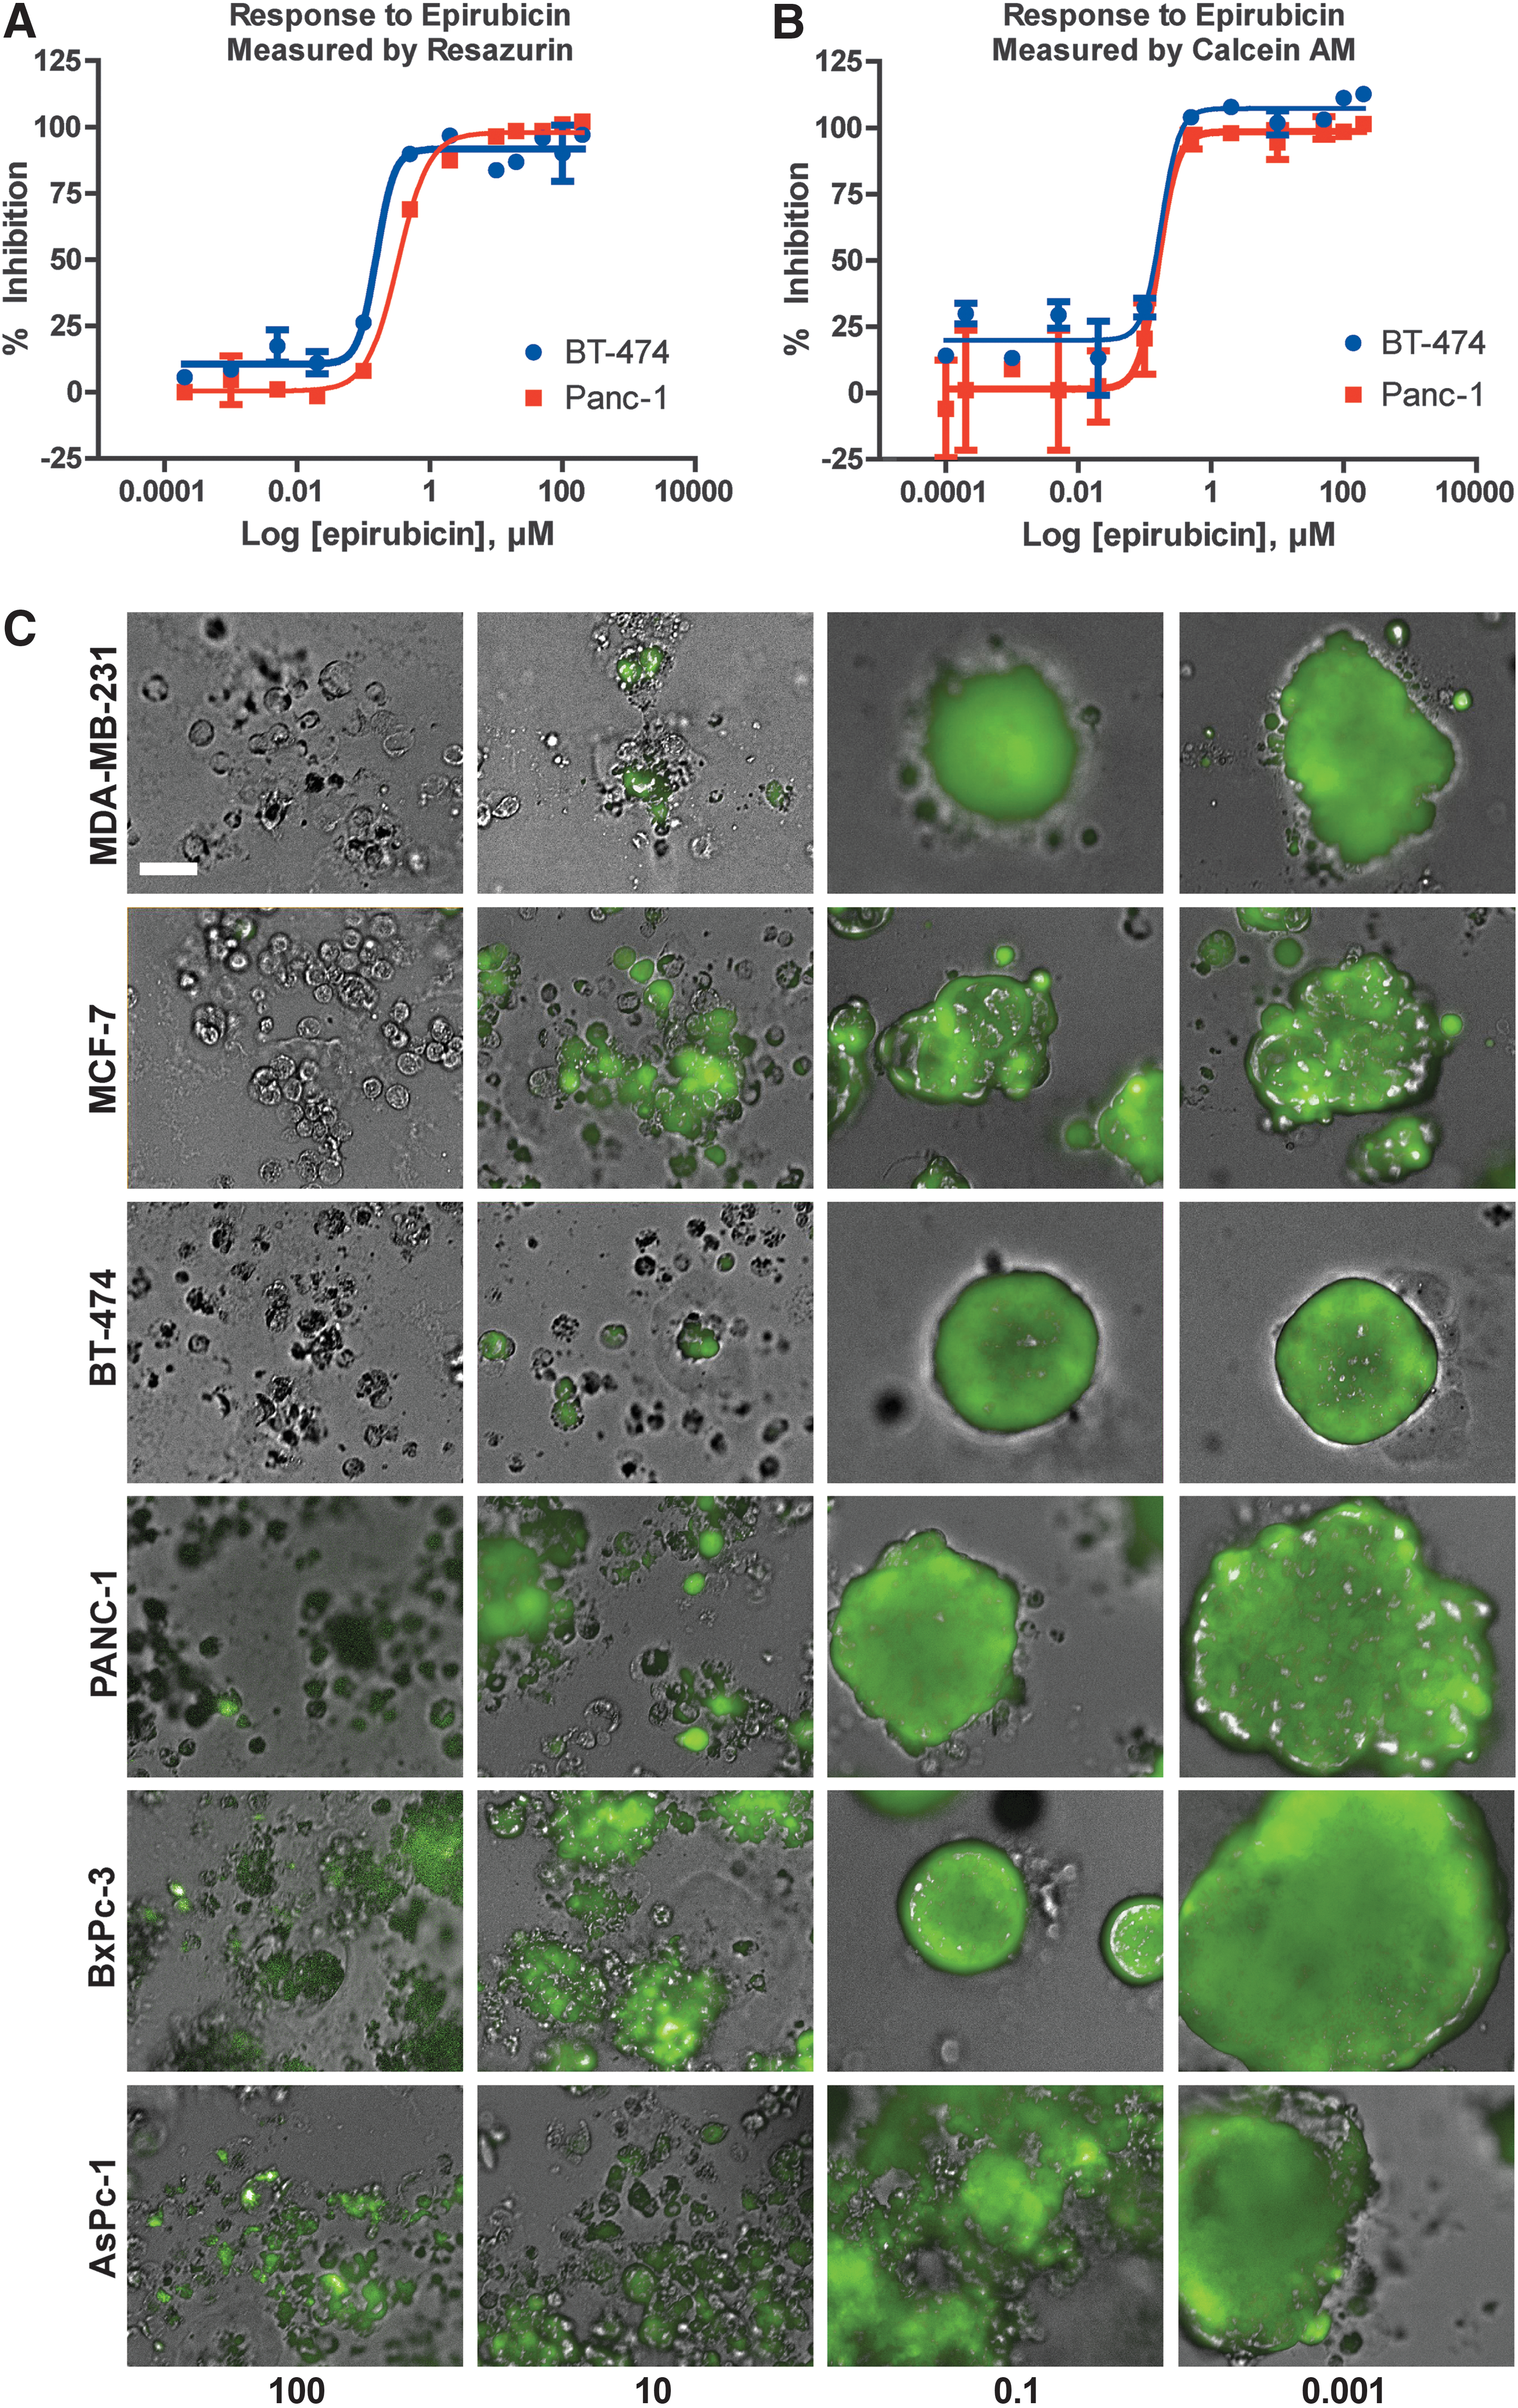
Resazurin and calcein AM 3D spheroid activity after treatment with epirubicin
Using live cell imaging, calcein AM stained spheroids exposed to epirubicin over a period of 6 days were evaluated (Fig. 7C). The images, which show the effect of epirubicin on cells within the spheroid are determined by parameters, such as morphology, size, and live/dead status, also allow quantification using an image analysis protocol created in the Harmony (PerkinElmer Operetta) software (Fig. 8 and Table 4). The image analysis data combined was normalized to generate a dose-response curve and IC50 values (Fig. 7B). Collectively, these results show the extensive capabilities of this 3D cell culture assay, which is able to determine metabolic activity, define spheroid structure and spheroid viability using both automated measurements of total well fluorescence and live cell imaging.

An example screenshot from the Harmony image analysis software depicting threshold detection of fluorescent 3D spheroids (untreated BT-474 day 9) using the calcein AM live stain (20× objective). Color images are available online at
Size Analysis Protocol Developed in the Harmony Software Using the Operetta Imaging Platform
2D, two-dimensional.
Pilot Screen Using the Developed 3D Culture Assays
Seven hundred and forty-one clinically relevant drugs for a multitude of disease indications were tested blind in three doses ranging from 0.22 to 22 μM using a 2D monolayer cell culture. Those drugs that displayed anticancer activity (sub micromolar range) in breast and pancreatic cancer cell lines, comparable to that observed for known cancer drugs tested, were evaluated in the 3D culture assays. As anticipated, a number of chemotherapy agents in this collection were identified, including doxorubicin, vinorelbine, epirubicin, gemcitabine, docetaxel, paclitaxel, 5-fluorouracil (data not shown). Drugs identified with activity warranting further investigation in the 3D cancer cell culture assay were selected from the 2D screening of 741 drugs (Table 5). This selection of nonstandard therapy drugs were retested in the 3D cell culture assay with the aim of determining whether a dose-response curve could be generated and reproducible IC50 data obtained.
Inibition of Cell Proliferation in the Two- and Three-Dimensional Resazurin Assays
IC50 values were derived from a single determination (n=1). 95% confidence intervals for IC50 values of duplicate points are given in parentheses.
Not active at the highest dose tested (40 μM).
N/A, the IC50 value was approximated due to the inability of the standard sigmoidal dose-response (variable slope) equation to complete the calculation.
The majority of the drugs identified as having activity against breast and pancreatic cancer cell lines have previously been shown as having anticancer activity and include simvastatin, 27,28 ciclopirox olamine, 29 cerivastatin, 30 salinomycin, 31,32 mitoxantrone dihydrochloride, 33 digitoxin crystalline, 34,35 mycophenolic acid, 36,37 rubitecan, 38,39 and topotecan hydrochloride. 40,41 The identification of such a wide variety of chemically diverse compounds with previously recorded activity against cancer cell lines validated our in vitro 3D cancer model. As shown in Table 5, IC50 values were successfully determined in a single independent study using duplicate wells across six cell lines with unique 3D morphology.
A representative example, cerivastatin (a member of the statins class used in cardiovascular disease prevention), demonstrates that different breast cancer cell lines exhibit different cell line dependent activities. In addition, the pancreatic cell line response to cerivastatin was considerably different to that observed with the breast cancer cell lines (Fig. 9A). This illustrates the need to compare several cell lines when evaluating drug activity (Table 5). The data shown in Figure 9A and B demonstrates the ability to reproduce dose-response curves from duplicate wells of the 3D assay to accurately assess drug activity. Several potential novel anticancer candidates, such as maduramycin ammonium were also identified, while other drugs such as racecadotril failed to reconfirm anticancer activity. We have shown that the 3D cell culture assay described here has the ability to evaluate drug activity, is reproducible and is sensitive for multiple cancer lines from a particular cancer, as well as between different types of cancers.

A comparison between 2D monolayer and 3D cell culture in Table 5 reveals decreases in activity or greater resistance in the 3D culture system, in some cases up to a fivefold difference. Observed increases or decreases in compound activity are cell line and compound dependent. This change in cell line sensitivity over standard 2D monolayer culture systems may be due to a number of factors, including the inability of compounds to diffuse through a compact cell mass, increased cell-to-cell, and cell-to-matrix interaction affecting survival signaling, changes in cell proliferation rates or a yet to be elucidated mechanism.
Discussion
We have developed a novel 3D cell culture assay for use in early stage drug discovery in cancer research, which is well suited for screening. The assay has been miniaturized, semiautomated and well characterized for consistency and reproducibility. This model has been utilized with two distinct automated technologies allowing spheroid metabolic activity, spheroid structure and spheroid viability to be measured in response to drug activity.
Our 3D cell culture assay using laminin-rich ECM, expands on previous anchorage-dependent models used for drug evaluation in lung 42 and prostate cancer. 43 This model is an alternative to the anchorage-independent models developed for drug evaluation, 15,17,44 which use spheroids suspended in liquid; thus, not attached to a scaffold for interaction with ECM. In addition, we have created a 3D model using reconstituted basement membrane that allows higher-throughput imaging and analysis for the testing of novel compounds than previous protocols developed for breast 45 and pancreatic cancer. 46,47 The improvements made to current Matrigel based 3D cell culture cancer models include miniaturization to a 384-well format and subsequent automation, specifically in liquid handling; determination of spheroid size using batch analysis protocols created using both open source (ImageJ) and licensed software (Developer Toolbox; GE Healthcare); segmentation protocols created for image analysis (Harmony; PerkinElmer); and reproducible and sensitive measurement of metabolic activity using resazurin. In addition, two different technologies are used to measure assay output: (1) imaging-based measurements on the Operetta and (2) whole-well fluorescence on the EnVision, allowing flexibility and data acquisition for multiple parameters from a single assay. The ability to utilize more than one technology indicates the versatility and potential use of this assay in many different laboratory set-ups.
We have provided evidence to support the occurrence of an altered response to drug in cancer cells cultured in a monolayer compared to those cultured in reconstituted basement membrane. In pancreatic cancer, cell lines cultured on components of ECM have also been shown to have increased resistance to conventional chemotherapies and possess altered signaling pathways. 46,48 In addition, differences in signaling profiles 49 and sensitivity to targeted therapies in 3D culture compared to 2D culture have been noted in breast cancer cell lines. 50,51 Furthermore, there is increasing evidence that the 3D culture model better mimics tumor biology compared to monolayer cell culture. 52 –54 Creating cheaper, automated, reproducible assays for cancer drug discovery that recapitulate tumor architecture have the potential to reduce the requirement for extensive testing of novel compounds in animal models, and provide insights into the effects of a compound throughout the tumor-like structures in an in vitro high-throughput manner. Using novel 3D culturing techniques for cancer has the potential to contribute to the reduction in the failure rate of anticancer drug candidates.
In this study, we have developed two semiautomated segmentation protocols for analysis of spheroid size using several different software packages, including open source ImageJ and propriety Developer Toolbox (GE Healthcare). There have been methods developed for determining size, which are suitable for analysis of anchorage-independent multicellular tumor spheroids; 17,55 however, we present a number of novel segmentation protocols suitable for anchorage-dependent 3D cell culture analysis. Using segmentation protocols from both open source (ImageJ) and proprietary based analysis programs (Developer Toolbox; GE healthcare), we were able to confirm the total mean spheroid size per well and that spheroid size followed a Gaussian distribution. Determining drug activity from wells with greater than 40 spheroids enables higher-throughput than previously referenced protocols, while simultaneously provided statistically significant data.
Alamar Blue® (Invitrogen), has previously been used in 3D cell culture and found to be suitable for measurement of spheroid viability in response to drug activity, as the cell number was found to be proportional to the fluorescence intensity readout of Alamar Blue. 15 In addition, we found that resazurin, the active component of Alamar Blue, 56 can distinguish between different cell numbers in spheroid cell culture, where there was a linear relationship between the fluorescence intensity and the number of cells initially seeded per well. Our results support the use of resazurin for measuring metabolic activity in 3D cell culture in response to drug activity.
To confirm the potential of our 3D cell culture model for use in drug discovery, we tested a variety of previously clinically approved drugs. Our model is sensitive and was successful in evaluating the drugs tested against two different cancers, distinguishing a false-positive activity from anticancer activity and providing IC50 data for each drug with either novel anticancer activity (maduramycin ammonium) or known anticancer activity (epirubicin). Changes in drug activity and dose response curves across a number of different compounds from monolayer to 3D cell culture assays were presented.
The assays described here form the basis of future 3D co-culture research, which may overcome the inherent limitation of the current homogeneous format. Candidates for co-culture include the use of endothelial cells and/or fibroblasts, as these cells are considered important in the tumor microenvironment. 57 –59 The development of automated, miniaturized, more complex cancer models that provide information on multiple aspects of anticancer drug activity in the form of a single assay would be valuable for use in future drug discovery.
In conclusion, we have developed a well-characterized, reproducible, robust, and miniaturized 3D cell culture assay suitable for early stage drug discovery. Drug activity in our 3D assay can be measured using multiple parameters, including spheroid metabolism, morphology, and viability determined from a single assay by utilizing more than one form of automated technology. By increasing our understanding of the role ECM components play in the tumor microenvironment and thus, impact on compound activity, we may ultimately provide better predictive data from a more biologically relevant model. Using this more complex assay has the potential to enable more selective use of animal models and improve the success rate of new therapeutics.
Footnotes
Acknowledgments
C.J.L. is supported by an Australian Postgraduate Award and a Cancer Therapeutics CRC top-up scholarship. T.B.S. is supported by an Australian Postgraduate Award and a Discovery Biology top-up scholarship.
Disclosure Statement
The authors have no conflicts of interest to declare.