3D Cocultures of Multiple Cell Types: What do they do and Where do they Go?
Fang C, Avis I, Salomon D, Cuttitta F: Novel phenotypic fluorescent three-dimensional platforms for high-throughput drug screening and personalized chemotherapy.J Cancer2013;4:402–415.
Abstract: We have developed novel phenotypic fluorescent three-dimensional co-culture platforms that efficiently and economically screen anti-angiogenic/anti-metastatic drugs on a high-throughput scale. Individual cell populations can be identified and isolated for protein/gene expression profiling studies and cellular movement/interactions can be tracked by time-lapse cinematography. More importantly, these platforms closely parallel the in vivo angiogenic and metastatic outcomes of a given tumor xenograft in the nude mouse model but, unlike in vivo models, our co-culture platforms produce comparable results in five to nine days. Potentially, by incorporating cancer patient biopsies, the co-culture platforms should greatly improve the effectiveness and efficiency of personalized chemotherapy.
Commentary:Tumors are three-dimensional (3D) and require angiogenesis or lymphangiogenesis to expand beyond a small size. Recapitulating the 3D environment during in vitro cell assays is thought to be important for having accurate cellular functions and signaling networks. The authors used stably transfected fluorescent cell lines to image the location of differently colored individual cell types within a 3D matrix. Their goal was to create an in vitro model system that could be used for drug screening and ultimately for personalized medicine. The 3D method that was used here involves a 1.5% agarose layer at the bottom of a 96-well plate followed by endothelial cells dispersed around either a tumor spheroid or a xeno-biopsy (i.e., a fluorescent human tumor biopsy from a mouse xenograft) in Geltrex (see
figure
). To more accurately re-create the complexity of the extracellular matrix (ECM), the tumor spheroids could also be grown with a third component cell type (mast cells or pericytes). The tumor spheroid (∼400 cells) was shown through fluorescence high-content imaging to vascularize in a 9-day assay and time-lapse MP4 movies created from the image z-stack showing the real-time cell interactions of this advanced 3D platform are available online. Because of the differently colored cell types, the authors could track the cell–cell interactions. The A549 colony had peripheral vessels and the PC-12, 92.1, and SK-LMS-1 cell lines had both peripheral and internal vessels. An interesting finding was the ability to observe, by imaging frozen sections, the angiotrophic migration (i.e., individual tumor cells migrating along the endothelial vascular pathways) of tumor cells and to differentiate tumor colonies that were angiogenic from those that were nonangiogenic. In some cases secondary colonies were observed post migration. The vascularization in the tumor xenografts compared favorably to those observed in the 3D system, while the two-dimensional (2D) system did not exhibit angiogenesis that correlated with the in vivo results. The anti-angiogenic results that the authors obtained for Avastin, sunitinib, thalidomide, and fumagillin in their 3D platforms had the same rank order as their results from a nude mouse xenograft. The authors note that the xenograft requires 50 days, while the 3D platform renders the results in 5 days, thereby saving both time and money. This phenotypic 3D fluorescence assay format could prove to be a useful model for some of the aspects of metastasis, and the miniaturized format makes it amenable to high-throughput high-content screening. Contributed by Mindy I. Davis.
Tumor microenvironment and development/validation of the phenotypic fluorescent 3D platforms. (a) Schematic of the tumor microenvironment consisting of malignant cells, nonmalignant cells, and ECM. (b) Flowchart showing the development of phenotypic fluorescent 3D platforms. 2D Assays: EC tubule formation—the light blue is a solidified layer of gel matrix (Geltrex) and the red objects with dark blue spheres are endothelial cells; Modified EC Tubule Formation/2D Co-Culture—the dark blue with red spheres in the center is a monolayer of tumor cells at 70%–80% confluence; the light blue is a solidified layer of Geltrex, and the red objects with dark blue spheres in the center are endothelial cells. Basic 3D platforms are basic phenotypic fluorescent 3D platforms. The black at the bottom is a solidified layer of 1% agarose; the light blue is a layer of Geltrex with evenly dispersed endothelial cells (red objects with dark blue spheres in center) and a tumor spheroid (dark blue sphere cluster). Advanced 3D Platforms are advanced phenotypic fluorescent 3D platforms. The black at the bottom is a solidified layer of 1% agarose and the light blue is a layer of Geltrex with evenly dispersed endothelial cells (red objects with dark blue sphere in center) with either a tumor colony (dark blue sphere cluster) and a third cell component (yellow) or xeno-biopsy tissue (black sphere cluster). Xeno-biopsy, a biopsy from a mouse human tumor xenograft. (c) The vascularization of freshly dissected nude mouse tumor xenografts. (d) Vessel formation in 2D and modified 2D endothelial cell tubule formation assays at 6 hours of incubation. On the top row, the left and middle images were generated from the traditional 2D endothelial cell (PAE, an immortalized porcine aortic endothelial cell line in red) tubule formation assays with/without FBS supplement. The remaining images were taken from the tumor monolayer induced endothelial cell tubule formation assays, described as “modified 2D endothelial cell tubule formation assays.” (e) The vascularization in our fluorescent basic 3D platforms of PAE cells (red) and a tumor colony (dark blue) at 9 days in culture. 3D-rendered images of our 3D platforms demonstrate that endothelial cell vascularization clearly depends on the type of tumor cell colonies used in the assays and reveal how these two component cell types interact with each other. See the following in the full article and its Supplementary Material: Supplementary Figure 1 for a variety of tumor colony induced vascularization in the 3D platforms; Movie 1, Movie 2, and Figure 2 for intensive angiogenesis and the interactions between the tumor and endothelial cells. Scale bar = 100 μm. EC, endothelial cells; TC, tumor cells; A549, a human lung adenocarcinoma cell line; SK-LMS-1, a human leiomyosarcoma cell line; PC-12, a rat pheochromocytoma cell line; 92.1, a human ocular melanoma cell line.
Employing Myosin to Feel Out Antigens
Natkanski E, Lee WY, Mistry B, Casal A, Molloy JE, Tolar P: B cells use mechanical energy to discriminate antigen affinities.Science2013;340:1587–1590.
Abstract: The generation of high-affinity antibodies depends on the ability of B cells to extract antigens from the surfaces of antigen-presenting cells. B cells that express high-affinity B cell receptors (BCRs) acquire more antigen and obtain better T cell help. However, the mechanisms by which B cells extract antigen remain unclear. Using fluid and flexible membrane substrates to mimic antigen-presenting cells, we showed that B cells acquire antigen by dynamic myosin IIa–mediated contractions that pull out and invaginate the presenting membranes. The forces generated by myosin IIa contractions ruptured most individual BCR-antigen bonds and promoted internalization of only high-affinity, multivalent BCR microclusters. Thus, B cell contractility contributes to affinity discrimination by mechanically testing the strength of antigen binding.
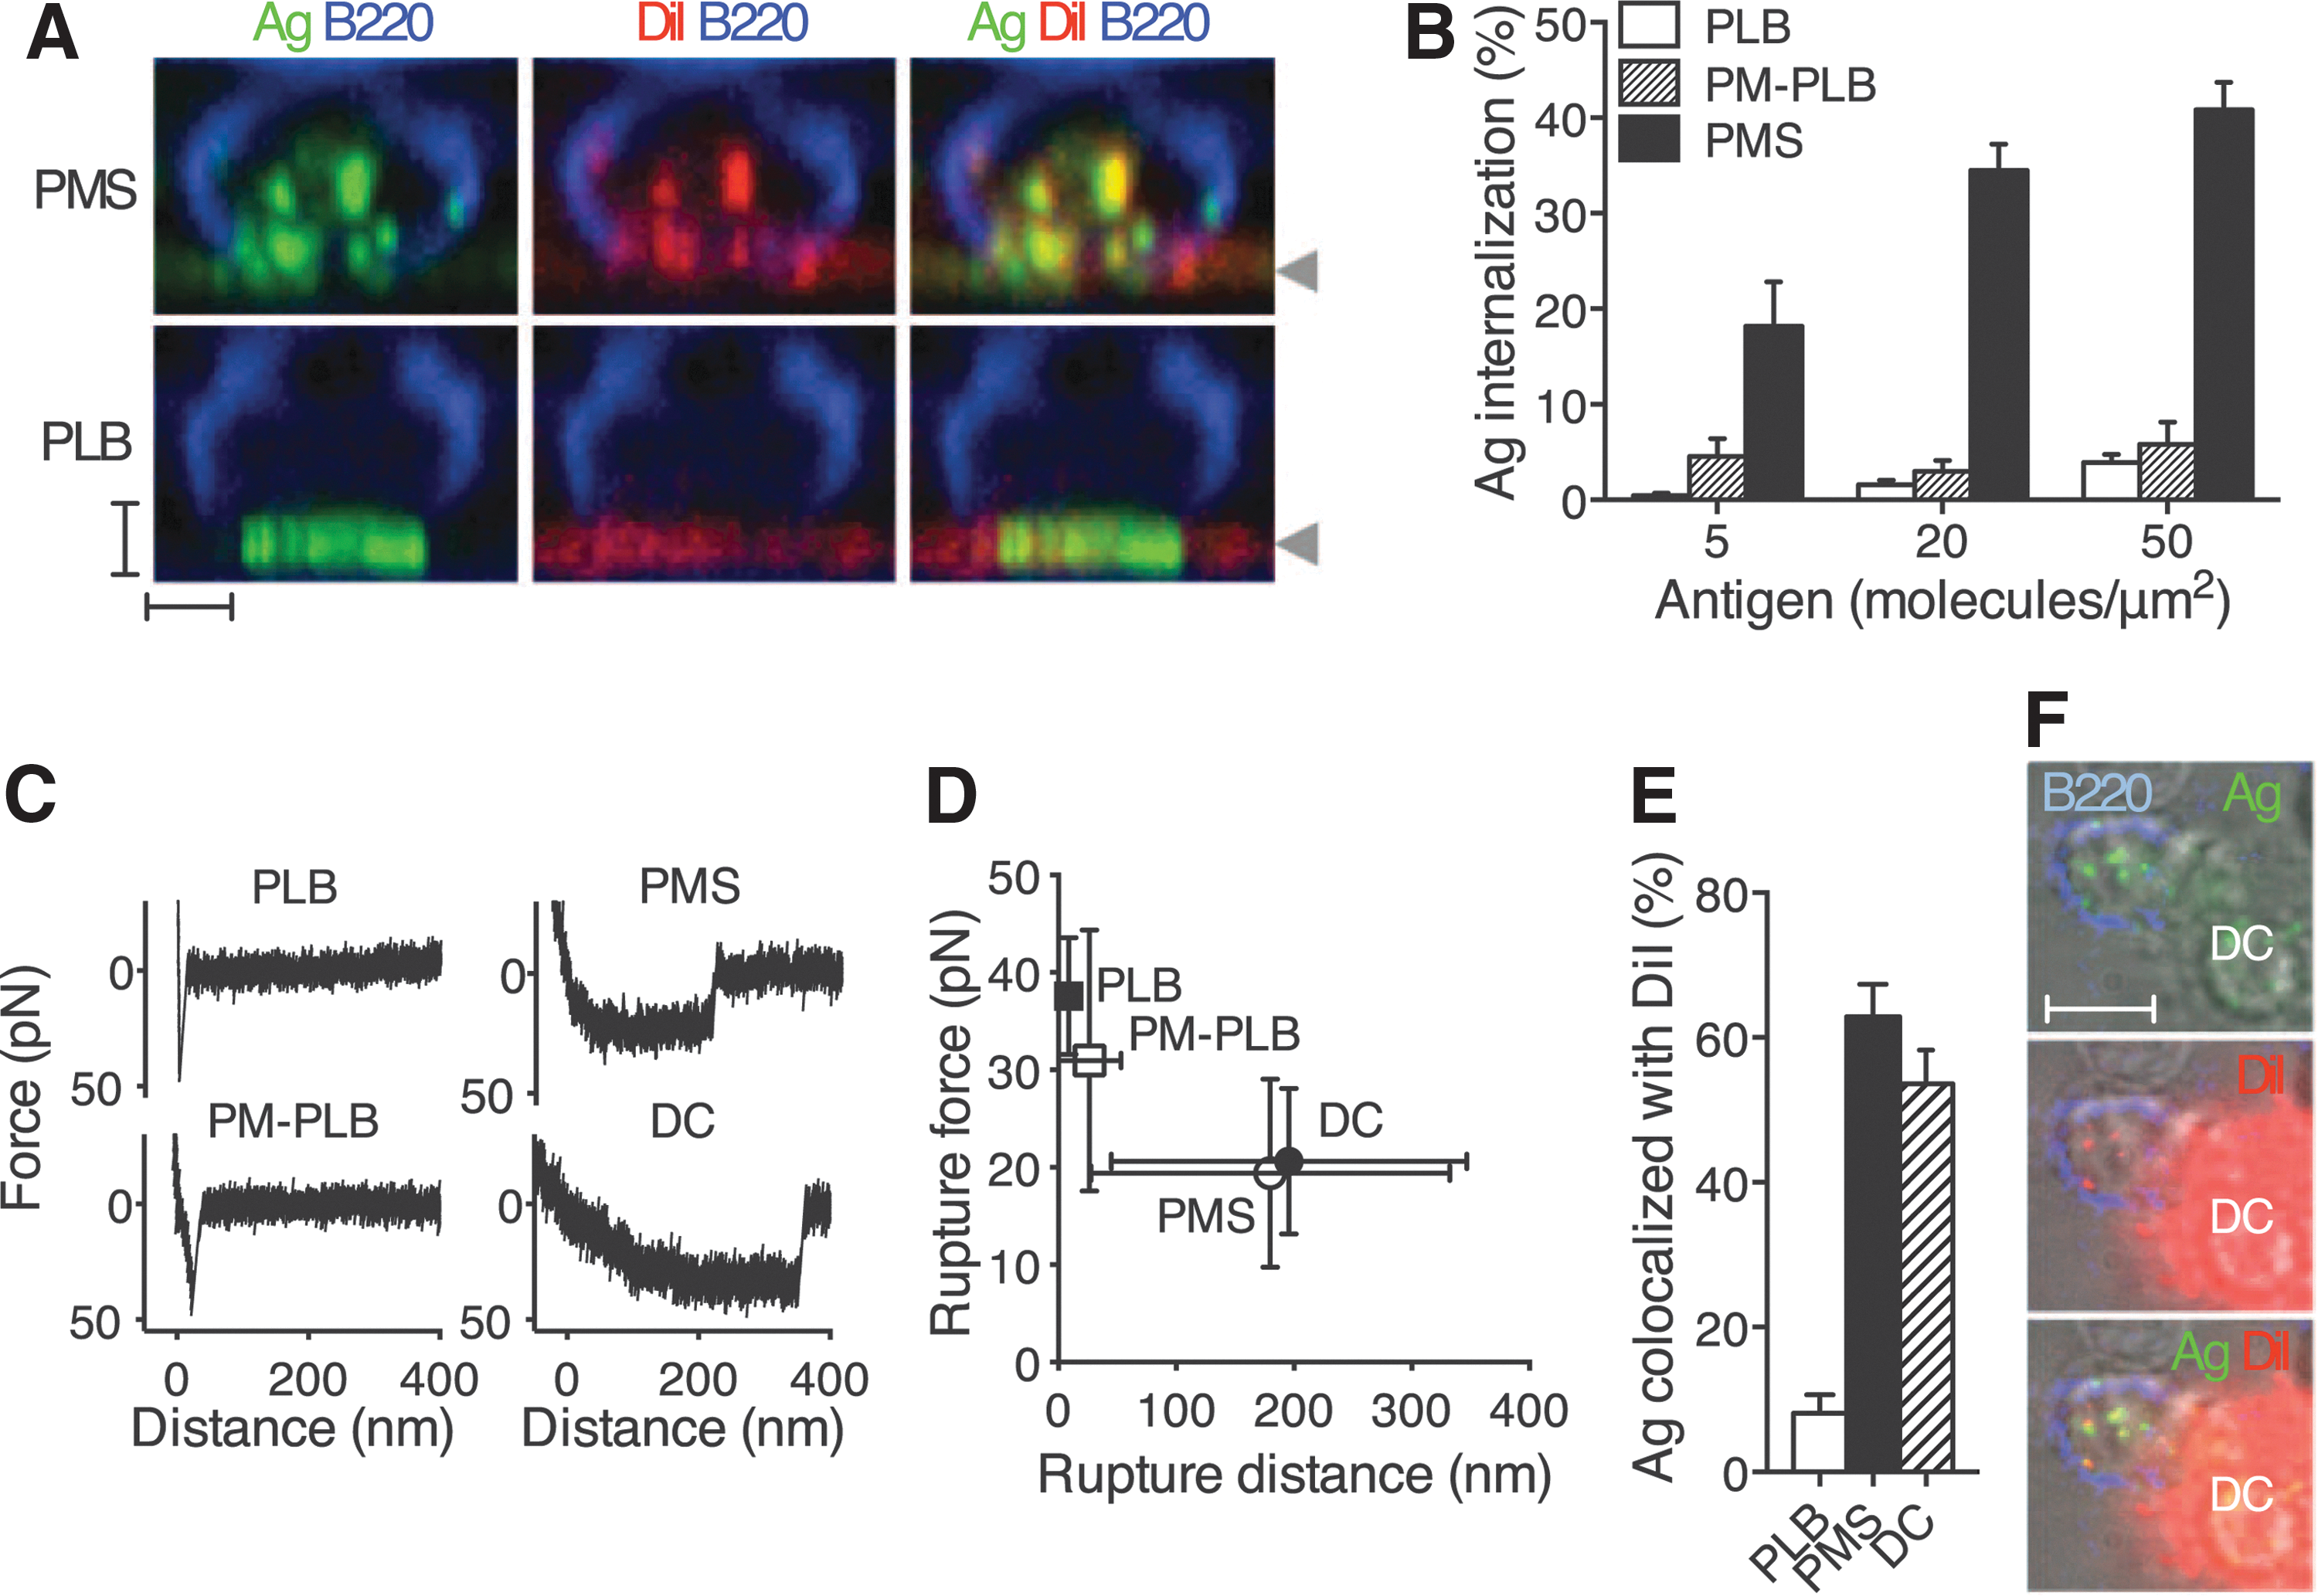
Commentary:The ability of B cells to sample across a wide range of affinities of antibody clones towards surface-presented antigens is crucial for the process of affinity maturation and clonal selection but has remained poorly understood. Here, Natkanski and colleagues present a platform to study the interaction between B cells and antigen-presenting cells (referred to as immune synapse) using immobilized plasma membrane sheets (PMSs) composed of plasma membranes derived from adherent cells positioned ∼10 nm above coverslips. Using these PMSs, the team could demonstrate antigen-dependent B-cell spreading and synapse formation. Using a hydrophobic dye (1,1′-dioctadecyl-3,3,3′,3′-tetramethylindocarbocyanine perchlorate) to label PMSs revealed that small pieces of PMS membrane were internalized by the B cells along with the antigen, thus resembling the in vivo process (see
figure
). Through a combination of atomic force microscopy, RNA interference, and pharmacological inhibition approaches, the team identified a key role of myosin IIa in the process of membrane invagination and antigen internalization from PMSs (see Fig. 4 in the article). The bivalency of the B-cell receptor and the multivalency of most physiologically relevant antigens create a situation in which the half-lives of the corresponding recognition complexes can exceed an hour, resulting in a binding system no longer relevant to processes taking place within the physiological time scale of seconds. The authors hypothesize that myosin IIa–generated forces shorten the lifetime of synaptic B-cell receptor–antigen bonds, thereby enabling affinity discrimination on the more physiologically relevant time scale of seconds. The countervailing mechanical force effect of myosin in essence shifts the “gain settings” of the system allowing the B cell to discriminate between binders even within the high-affinity binding space. The lessons learned from the present study will undoubtedly have implications on the field of antibody generation and future platforms providing in vivo–like affinity maturations for therapeutic antibodies. Contributed by Anton Simeonov.
B cells acquire antigens from flexible membranes. (A) Sideview reconstruction of B220-stained primary B cells forming synapses with DiI-stained and anti-Ig κ Ag PMSs or PLBs. Arrowheads indicate the position of the substrate. Scale bars, 2 μm. (B) Image quantification of primary B-cell antigen internalization (means ± SEM, n = 23–60 cells). (C) AFM force retraction curves of streptavidin-coated AFM tip and biotinylated antigens. Antigens were anti-Ig κ for PLBs, PM-PLBs, and PMSs, and immune complexes of NIP antigen for DCs. Speed of retraction was 0.1 μm/s. (D) Rupture distances and forces (mean ± SD, n = 31–109 retraction curves). (E) Colocalization of internalized antigen with DiI in primary B cells after internalization from the substrates (means ± SEM, n = 12–21 cells). (F) B220-stained B1-8 primary B-cell–internalizing immune complexes of NIP antigen from a DC stained with DiI. Scale bar, 5 μm. PMS, plasma membrane sheet; PLB, planar lipid bilayer; PM-PLB, PLB prepared from plasma membrane; anti-Ig κ, antibody against immunoglobulin κ; Ag, antigen-loaded; SEM, standard error of the mean; AFM, atomic force microscopy; NIP, 4-hydroxy-3-iodo-5-nitrophenylacetyl; DC, dendritic cell; SD, standard deviation; DiI, 1,1′-dioctadecyl-3,3,3′,3′-tetramethylindocarbocyanine perchlorate.
Culturing Primary Cells
Swoboda JG, Elliott J, Deshmukh V, Lichtervelde L, Shen W, Tremblay MS, Peters EC, Cho CY, Lu B, Girman S, Wang S, Schultz PG: Small molecule mediated proliferation of primary retinal pigment epithelial cells.ACS Chem Biol2013;8:1407–1411.
Abstract: Retinal pigment epithelial (RPE) cells form a monolayer adjacent to the retina and play a critical role in the visual light cycle. Degeneration of RPE cells results in retinal disorders such as age-related macular degeneration. Cell transplant strategies have potential therapeutic value for such disorders; however, risks associated with an inadequate supply of donor cells limit their therapeutic success. The identification of factors that proliferate RPE cells ex vivo could provide a renewable source of cells for transplantation. Here, we report that a small molecule (WS3) can reversibly proliferate primary RPE cells isolated from fetal and adult human donors. Following withdrawal of WS3, RPE cells differentiate into a functional monolayer, as exhibited by their expression of mature RPE genes and phagocytosis of photoreceptor outer segments. Furthermore, chemically expanded RPE cells preserve vision when transplanted into dystrophic Royal College of Surgeons (RCS) rats, a well-established model of retinal degeneration.
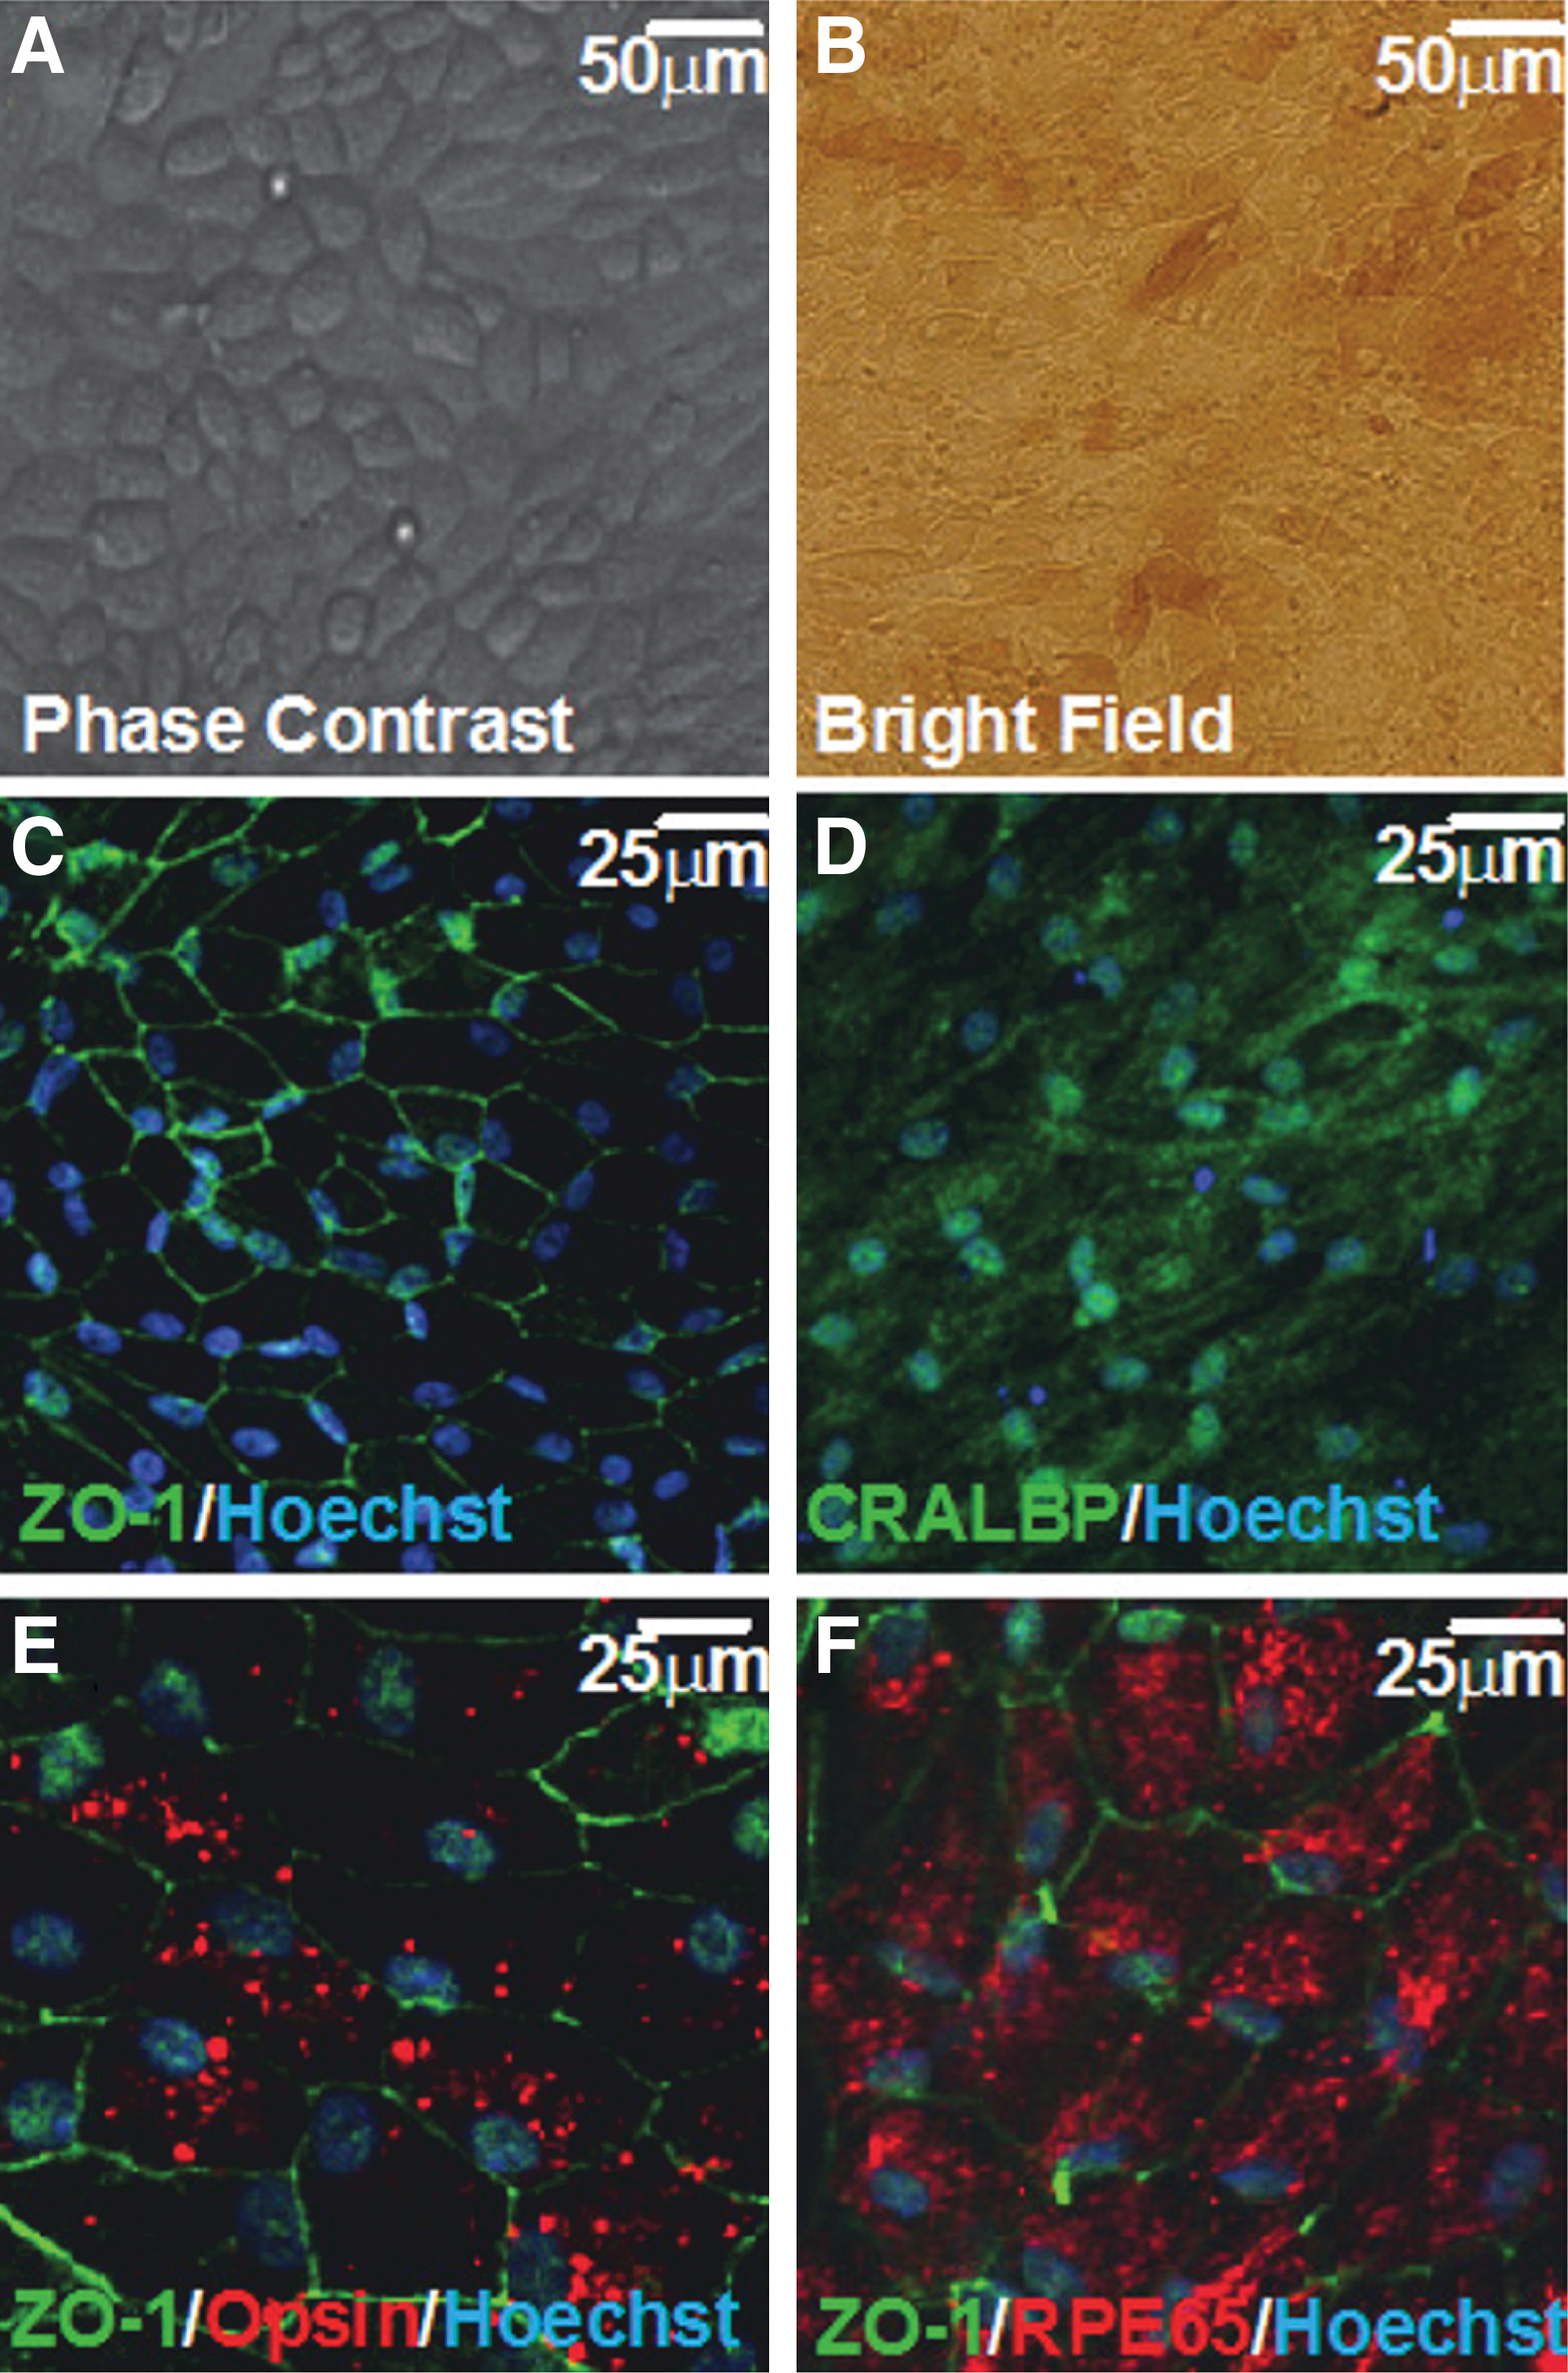
Commentary:The ability to work with primary cells ex vivo can enable the development of more physiologically relevant assays. Primary retinal epithelial cells (RPE) typically enter senescence after six passages. A supply of RPE cells would be useful not only for studying the pathways involved with RPE cell health but potentially as a therapy for ocular diseases such a age-related macular degeneration (AMD) through transplantation of healthy cells into the eye. This article demonstrates that a small molecule (W3), originally identified as a proliferative molecule for β cells, can promote culturing of RPE cells through 15 passages. After approximately 15 passages the RPE cells entered senescence without evidence of cell death. Optimal proliferation of RPE cells occurred when W3 was added prior to passage 6. Cytogenic analysis of passage 10 RPE cells did not show karyotype aberrations. Additionally, when the RPE cells were allowed to reach confluence, they differentiated into a cobblestone monolayer and became pigmented, and cell staining showed the presence of tight junctions (see
figure
). RPE cells are one of the most active phagocytic cells known and this activity is required to recycle the discs containing visual pigments at outer photoreceptor segments. The W3-expanded and differentiated RPE cells were found to be phagocytic as measured by the internalization of oposin (see
figure
). The target of W3 in β cells is Erb3 binding protein 1 (Ebp1), a tyrosine kinase related to the epidermal growth factor receptor (EGFR) receptor tyrosine kinase family. Pull-down experiments using a biotinylated analog of W3 supports that Ebp1 is also a primary target of W3 in RPE cells. To demonstrate that the W3-expanded RPE cells are functional in vivo, the authors transplanted these cells into rats harboring a mutation that inactivates photoreceptor outer segment phagocytosis resulting in a decrease in visual acuity with age. The RPE grafted eyes showed improved luminance threshold values and optokinetic responses. Additionally, P90 rats showed four to six layers of photoreceptors compared to only one found in untreated rats. The fact that W3 acts as proliferative molecule in both β cells and RPE cells with a common target suggest that this could be useful for the expansion of other primary cell types. Contributed by Doug Auld.
(A,B) WS3-expanded fetal human retinal pigment epithelial (RPE) cells grown in the presence of WS3 and differentiated for 5 weeks. (C–F) Staining of differentiated fetal RPE cells show the formation of tight junctions, expression of mature RPE markers, and function in vitro as determined by phagocytosis of internalized opsin.
Bottled Water
Lockett MR, Lange H, Breiten B, Heroux A, Sherman W, Rappoport D, Yau PO, Snyder PW, Whitesides GM: The binding of benzoarylsulfonamide ligands to human carbonic anhydrase is insensitive to formal fluorination of the ligand.Angew Chem Int Ed2013;52:7714–7717.
Abstract: It's the water that matters. Pairs of benzo- and perfluorobenzoarylsulfonamide ligands bind to human carbonic anhydrase with a conserved binding geometry, an enthalpy-driven binding, and indistinguishable binding affinities (see picture). These data support the pervasive theory that the lock-and-key model disregards an important component of binding: the water, which fills the binding pocket of the protein and surrounds the ligand.
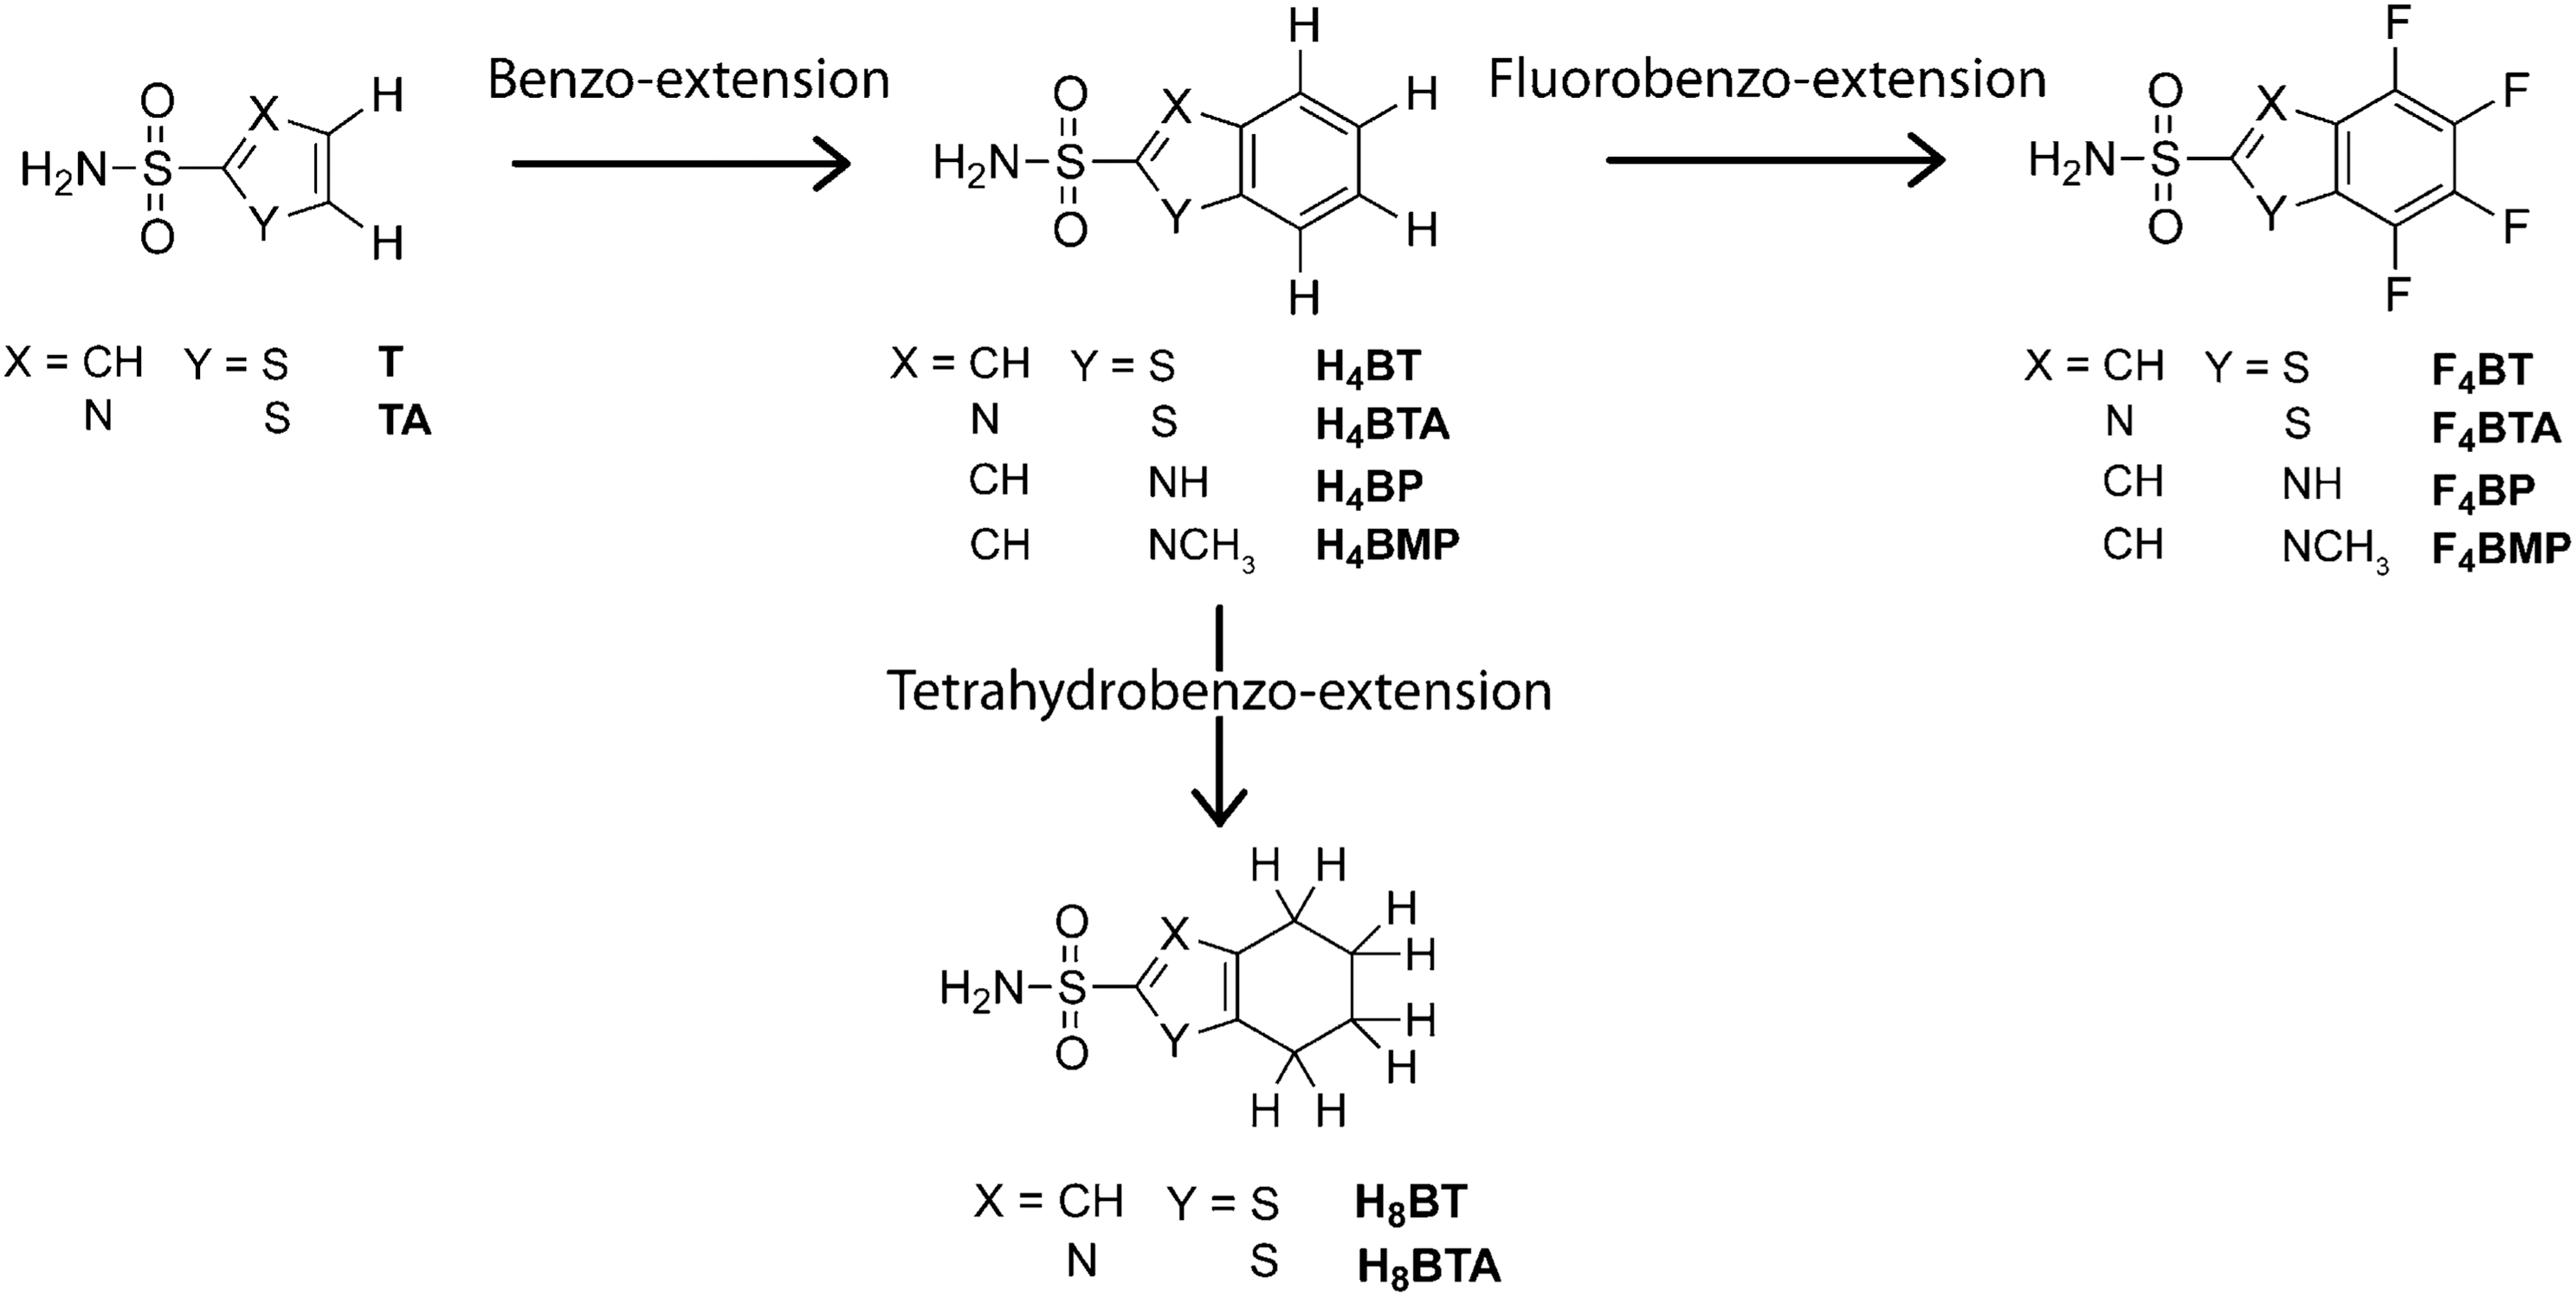
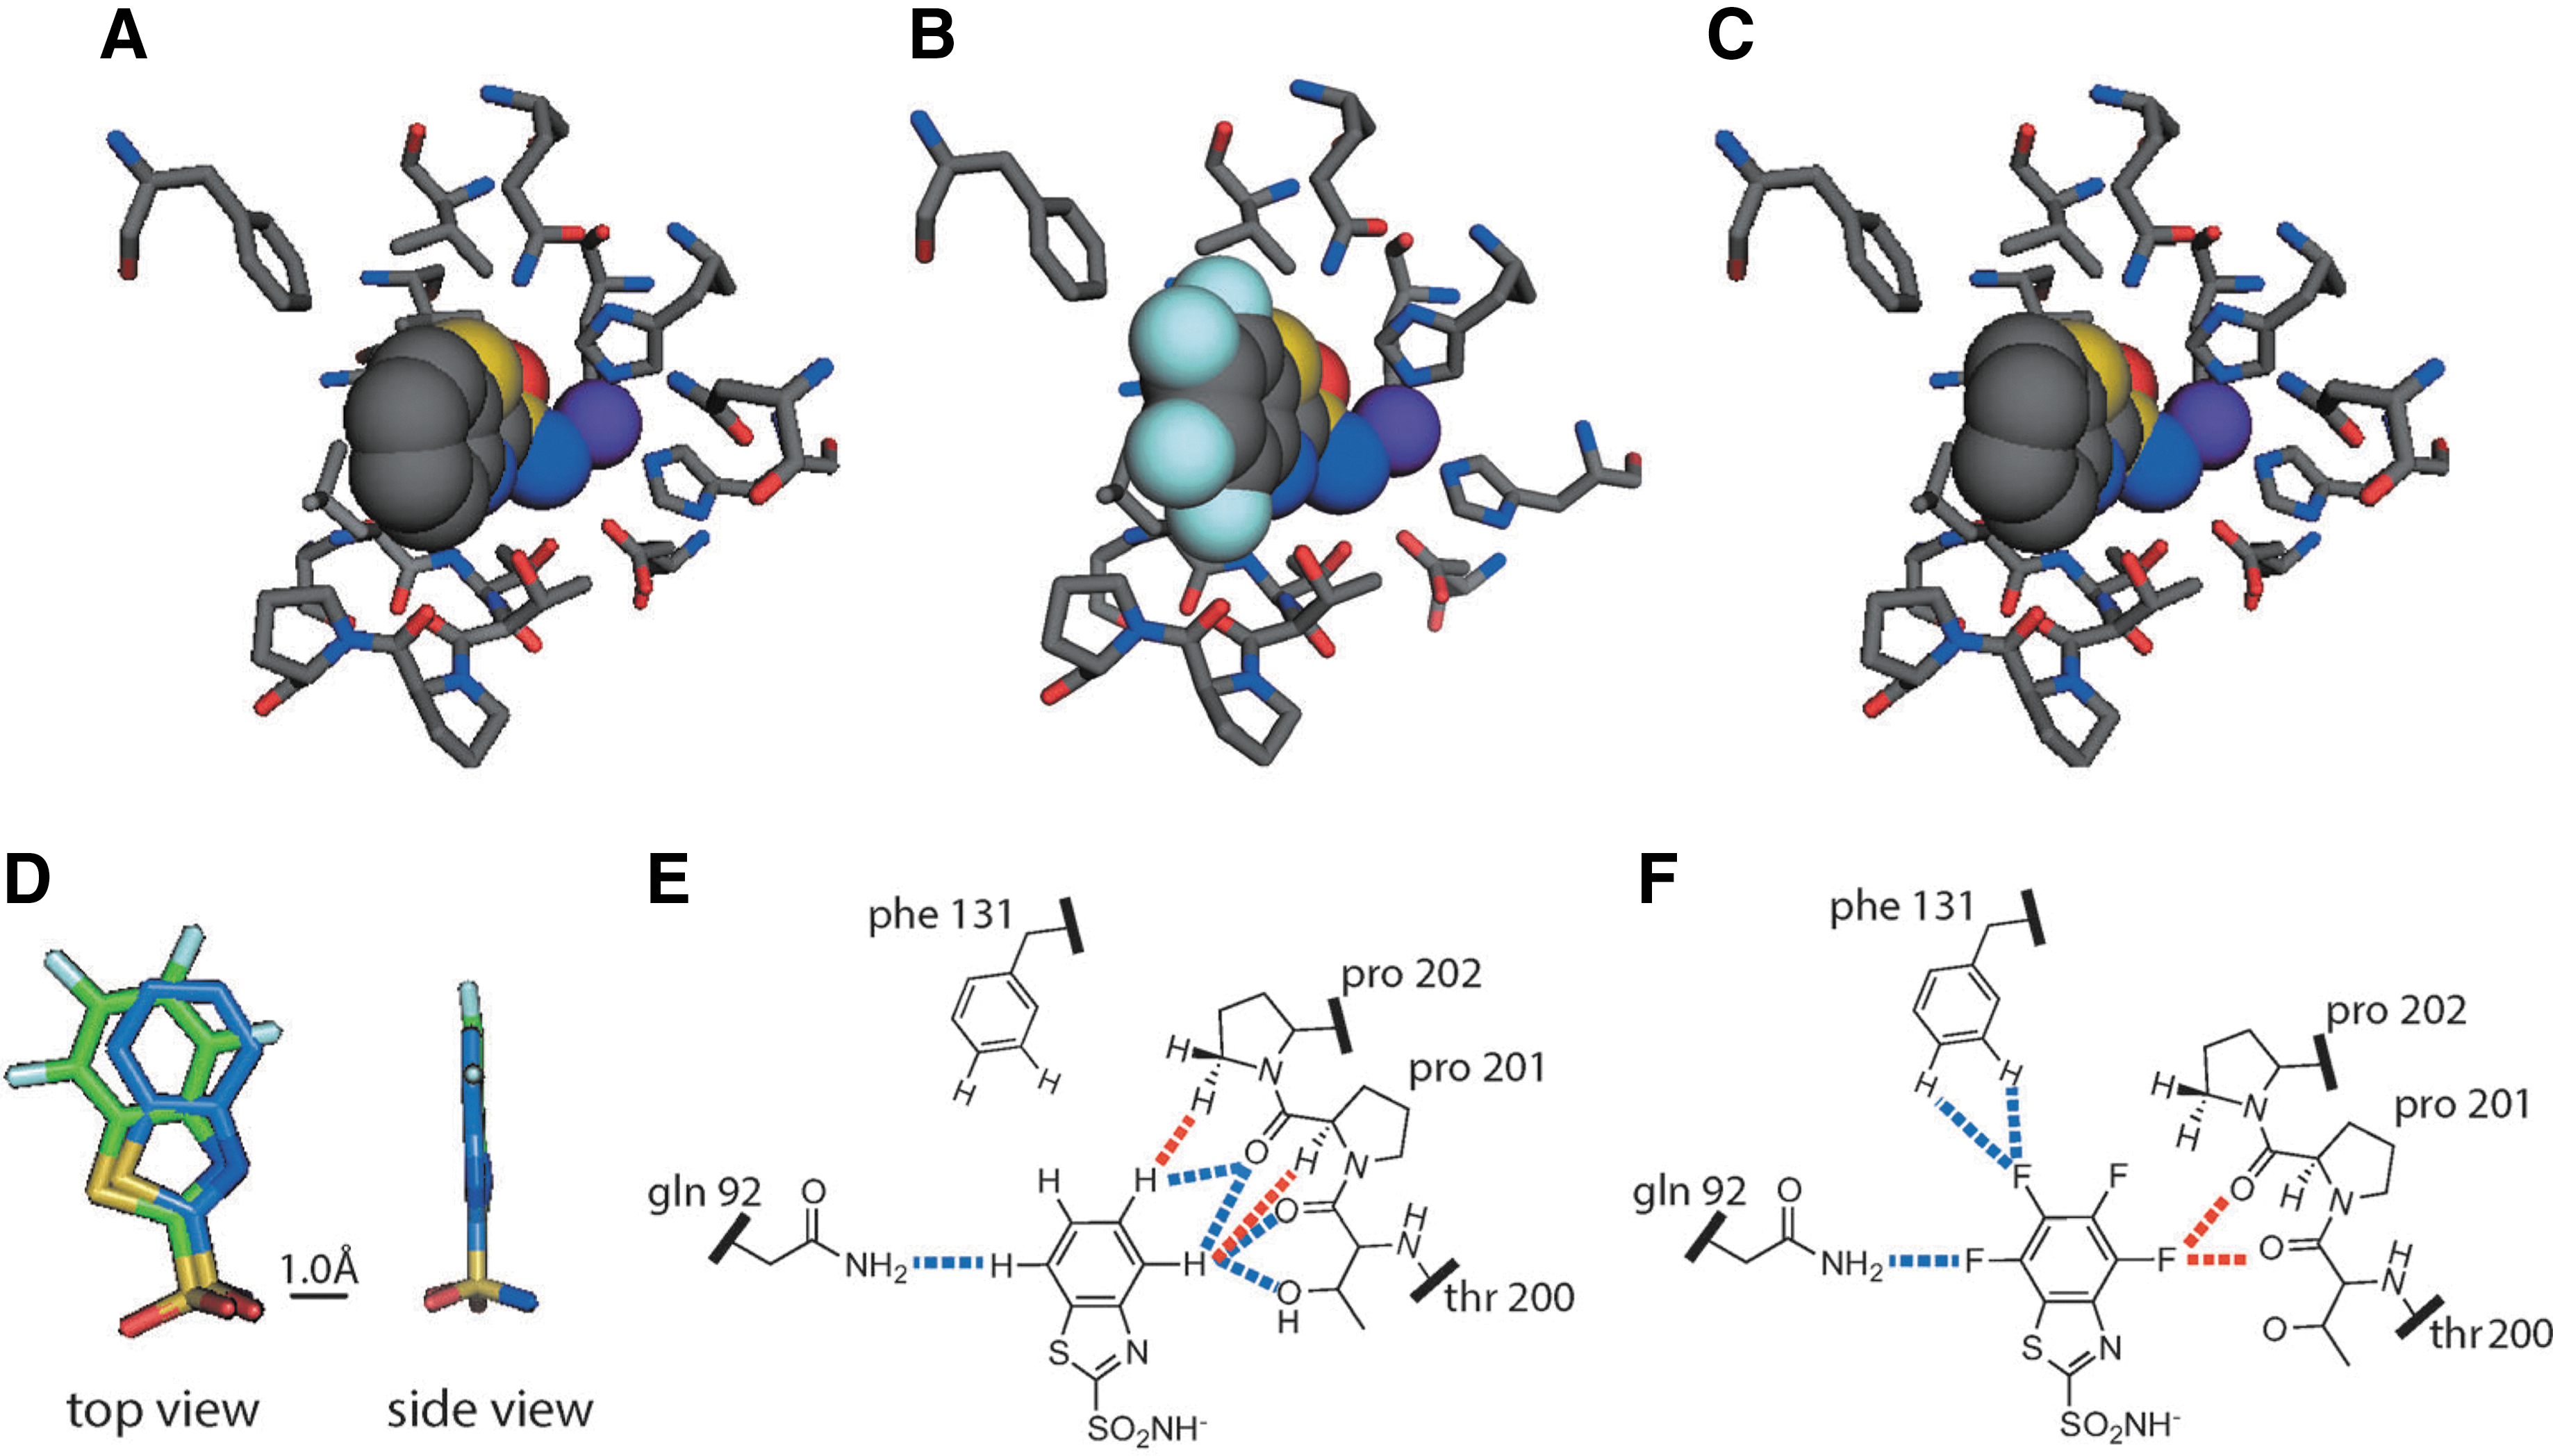
Commentary:The role of water in ligand binding has classically been attributed to a release of ordered water from the ligand upon binding. This article investigates the role of the hydrophobic effect and ligand–protein contact interactions in a series of inhibitors targeting human carbonic anhydrase II (HCA). Previous work on a set of arylsulfonamide inhibitors with increased hydrophobic surface area (“benzo-extended” analogs; see
first figure
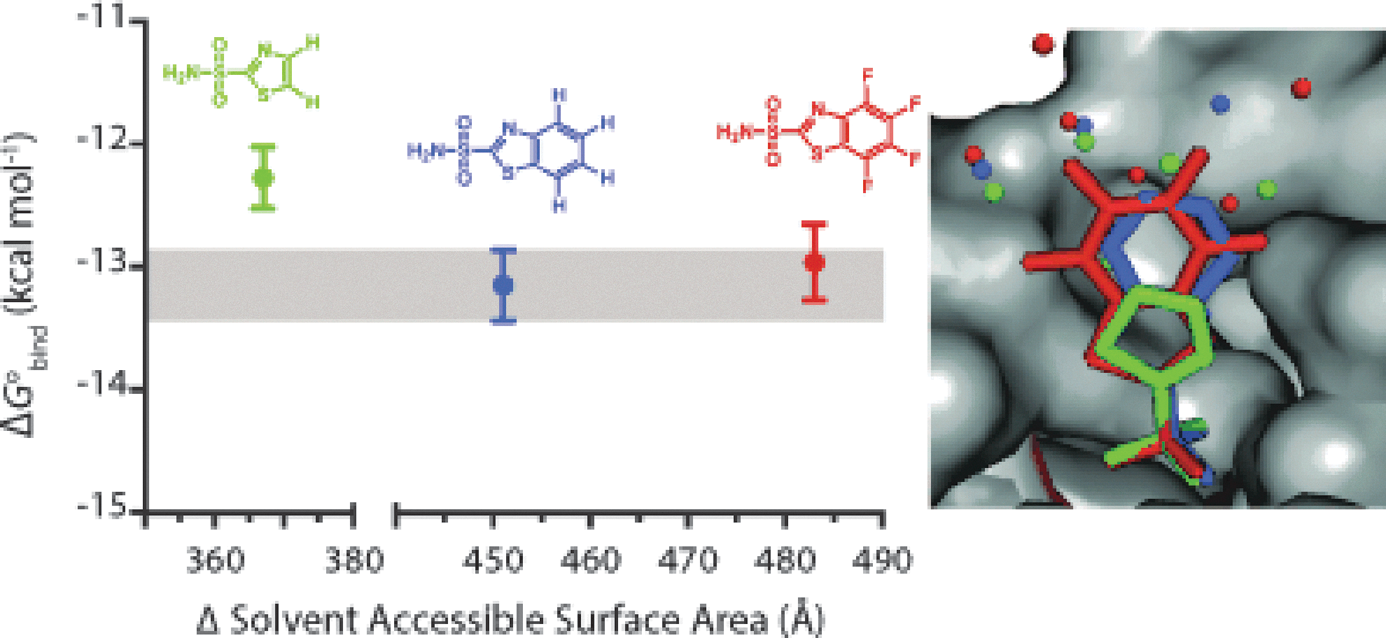
) showed that the binding energy of these analogs didn't correlate with LogP values (measured in an octanol/buffer system), and despite increased affinity of these inhibitors, few new contacts with the protein were observed. This study emphasized that there is not a single hydrophobic effect and the balance of enthalpy–entropy terms in an octanol/buffer system is different than between free and bound ligand. A nonclassical hydrophobic effect involving enthalpic interactions in which unfavorably bound water molecules in the binding pocket were released upon inhibitor binding to HCA was also noted in this study. Here, the authors further explore these aspects by replacing the four C–H bonds in the benzo moiety with C–F bonds. Fluorination can lead to an increase in hydrophobicity for compounds, and for the compounds studied here a modest increase in the hydrophobic surface area of 1.1 cal·mol−1·Å−2 was measured by octanol/buffer partitioning. Both benzo- and fluorobenzo-containing compounds bound to HCA in a similar orientation, with no changes in the amino acid side-chains lining the binding pocket, although there is a 0.7 Å shift in the position of the fluorinated inhibitor (see
second figure
). Through isothermal-titration calorimetry (ITC), the free energies and entropies of binding for the ligands were measured. The free energy of binding between the benzo and fluorobenzo analogs was indistinguishable, although different entropy–enthalpy terms were found. However, a large difference in heat capacity (ΔΔCp = −44 cal·mol−1·K−1), a hallmark of the hydrophobic effect, was observed upon fluorination that could not be attributed by difference in buried surface area of the inhibitors. Instead, the difference could be attributed to an increase in bound waters found in the cocrystal structures of the fluorinated inhibitors compared to the hydrocarbon equivalents. Four additional waters are fixed in the binding pocket of the fluorinated ligand, and the difference in heat capacity is consistent with ordering this number of water molecules. Therefore, the binding energy of inhibitors to HCA is a combination of interactions between HCA and the ligands as well as the water that fills the binding site and is released upon ligand binding. Importantly, this study suggest that the overall hydrophobic effect depends the structure of water in the binding pocket and simply examining protein–ligand contacts will often prove inadequate when trying understand the binding of protein–ligand complexes. Contributed by Doug Auld.
Arylsulfonamide ligands. Hydrophobic surface area is added to the heterocyclic ligands by: a “benzo-extension,” denoted with an H4; a “fluorobenzo-extension,” denoted with an F4; or a “tetrahydrobenzo-extension,” denoted with an H8. Ligand acronyms: (B)TA, (benzo)thiazole; (B)T, (benzo)thiophene; (B)P, (benzo)pyrrole; (B)MP, N-methyl-(benzo)pyrrole.
Crystal structures of the active site of HCA complexed with (A) H4BTA, (B) F4BTA, and (C) H8BTA. The purple sphere in each structure represents the Zn2+ ion. (D) An overlay of the heavy atoms of the H4BTA (blue) and F4BTA (green) ligands from aligned crystal structures. Diagrams of the amino acid residues in contact with the (E) benzo-extended portion of H4BTA, and (F) the fluorobenzo-extended portion of F4BTA. The dashed lines represent favorable (blue) and unfavorable (red) interactions between the ligand and the protein.
Driven to Cancer by Obesity
Yoshimoto S, Loo TM, Atarashi K, Kanda H, Sato S, Oyadomari S, Iwakura Y, Oshima K, Morita H, Hattori M, Honda K, Ishikawa Y, Hara E, Ohtani N: Obesity-induced gut microbial metabolite promotes liver cancer through senescence secretome.Nature 2013;499:97–101.
Abstract: Obesity has become more prevalent in most developed countries over the past few decades, and is increasingly recognized as a major risk factor for several common types of cancer. As the worldwide obesity epidemic has shown no signs of abating, better understanding of the mechanisms underlying obesity-associated cancer is urgently needed. Although several events were proposed to be involved in obesity-associated cancer, the exact molecular mechanisms that integrate these events have remained largely unclear. Here we show that senescence-associated secretory phenotype (SASP) has crucial roles in promoting obesity-associated hepatocellular carcinoma (HCC) development in mice. Dietary or genetic obesity induces alterations of gut microbiota, thereby increasing the levels of deoxycholic acid (DCA), a gut bacterial metabolite known to cause DNA damage. The enterohepatic circulation of DCA provokes SASP phenotype in hepatic stellate cells (HSCs), which in turn secretes various inflammatory and tumor-promoting factors in the liver, thus facilitating HCC development in mice after exposure to chemical carcinogen. Notably, blocking DCA production or reducing gut bacteria efficiently prevents HCC development in obese mice. Similar results were also observed in mice lacking an SASP inducer or depleted of senescent HSCs, indicating that the DCA–SASP axis in HSCs has key roles in obesity-associated HCC development. Moreover, signs of SASP were also observed in the HSCs in the area of HCC arising in patients with non-alcoholic steatohepatitis, indicating that a similar pathway may contribute to at least certain aspects of obesity-associated HCC development in humans as well. These findings provide valuable new insights into the development of obesity-associated cancer and open up new possibilities for its control.
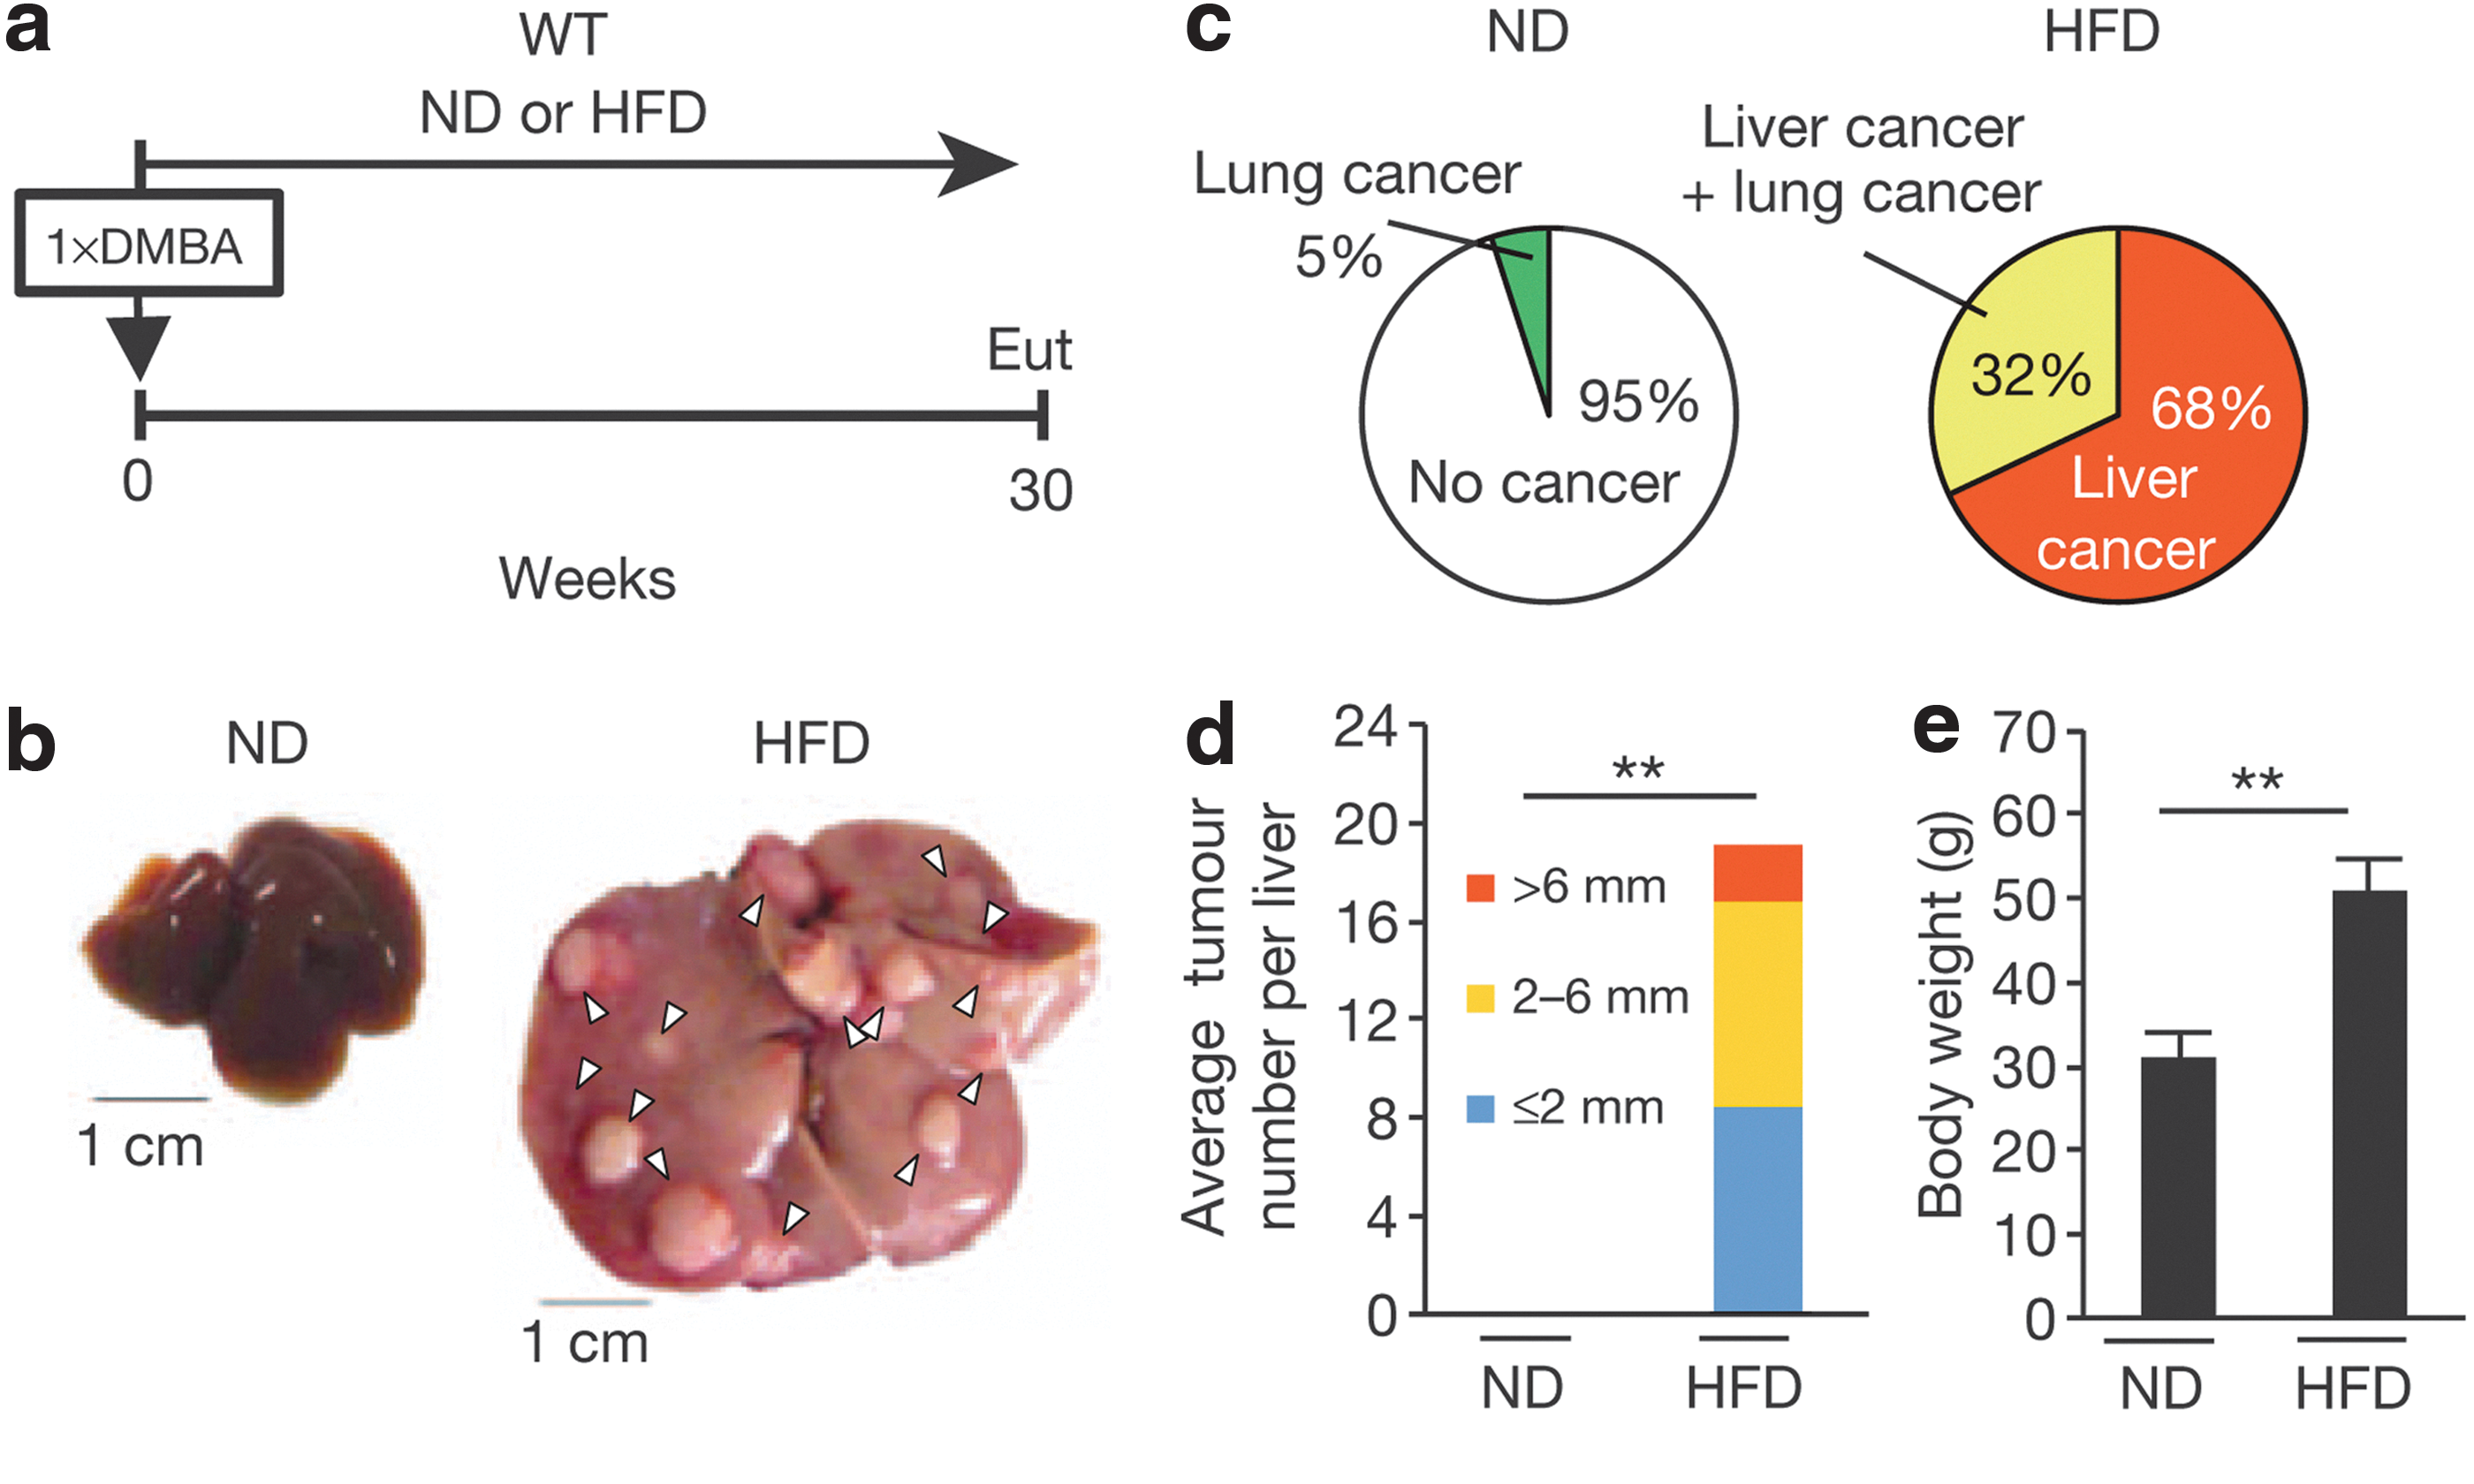
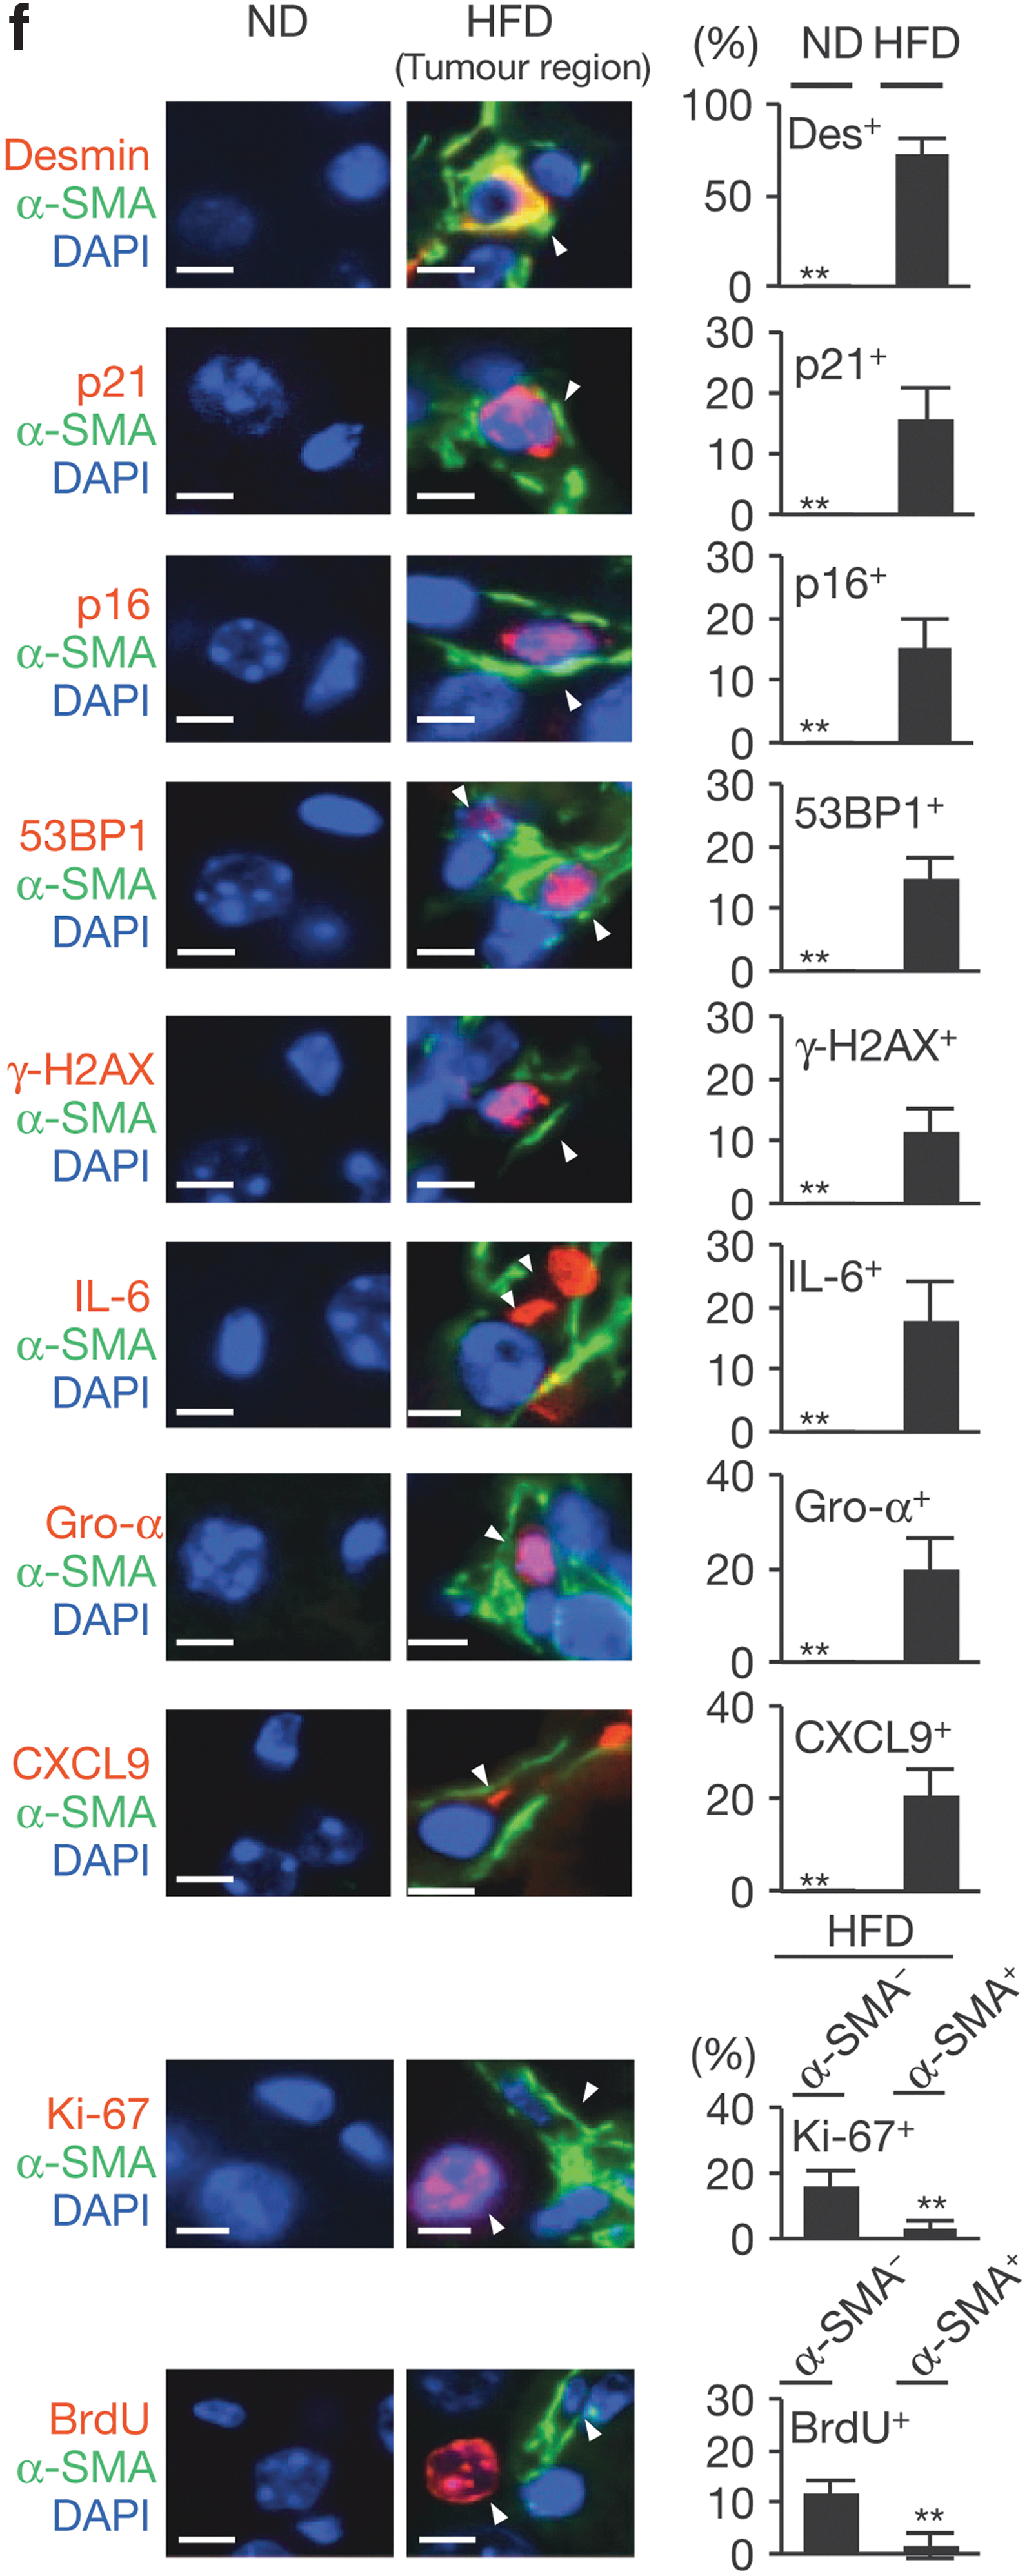
Commentary:During the past decade, as the incidence of obesity has risen dramatically throughout the world, so has the appreciation that obesity can actually be a causative factor for the development of cancer. The exact agent(s) leading up to cancer in obesity settings have remained unknown. In the present report, the team used a mouse model to study the effect of high-fat diet in combination with an application of a mild dose of oncogenic stimuli: obese mice fed a high-fat diet (HFD) and lean mice fed a normal diet were also subjected to a treatment with the known carcinogen DMBA (7,12-dimethylbenz[a]anthracene). The cellular senescence marker p21Waf1/Cip1 was monitored in p21-p-luc mice noninvasively using luciferase-based bioluminescence imaging. The team found an increase of the bioluminescent signal in the abdomen of the obese mice, and it originated mainly from liver cancer (see
first figure
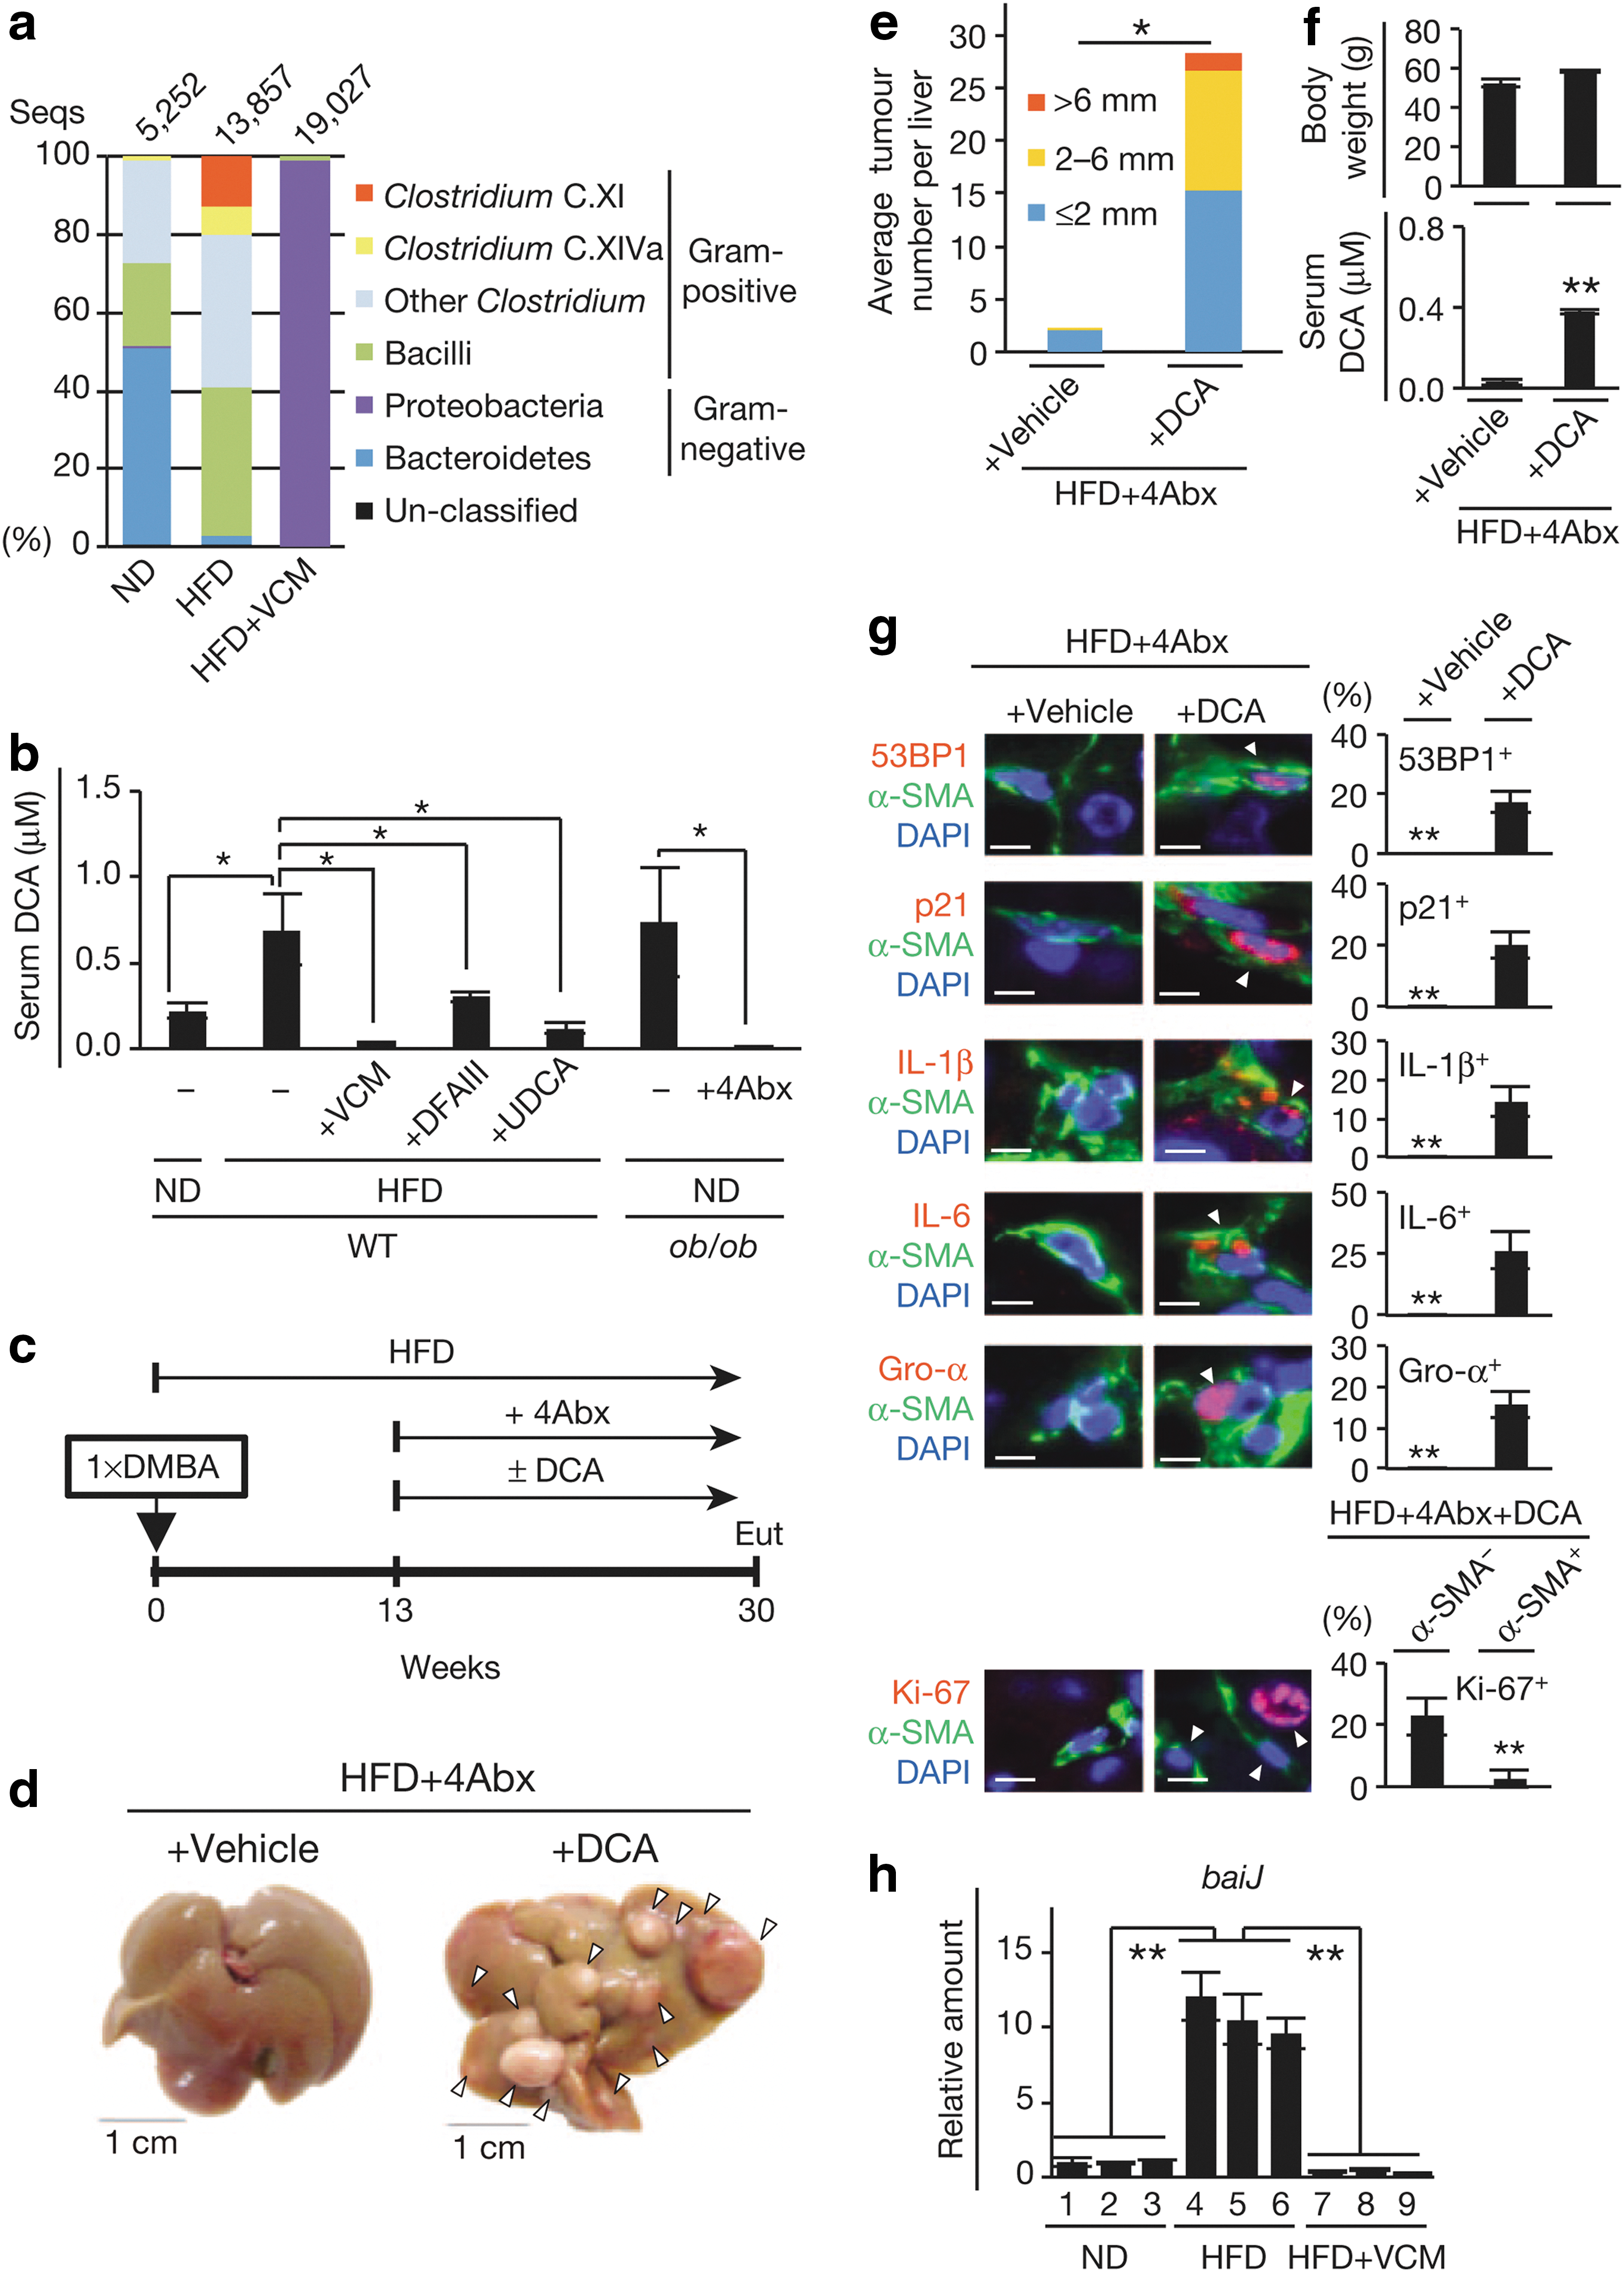
). Interestingly, the mice in the high-fat diet group developed cancer only in the liver, while the control (lean-diet) group developed sporadic tumors in the lung but not in the liver (presumably baseline-level tumors formed as a result of the DMBA application). This finding prompted the team to search for the causative agent within the gut microbiota and after a series of liquid chromatography mass spectrometry (LC-MS) analyses of the metabolites associated with the two treatment groups, a prominent elevation in the concentration of deoxycholic acid (DCA), a secondary bile acid produced by the 7α-dehydroxylation of primary bile acids, was detected. DCA is produced primarily by gut bacteria belonging to Clostridium cluster XI and XIVa6 (VCM-sensitive gram-positive bacteria), and the level of these bacteria was found to be elevated upon placement of mice on high-fat diet (see
second figure
); importantly, humans do not possess an efficient metabolic path toward degradation/elimination of DCA. Earlier studies had demonstrated that DCA caused DNA damage and resulted in increased incidence of liver and colon cancer. Here, the team found that modulation of the DCA levels affected the rate of HCC development (see Fig. 3 in the article). Thus, modulation of the microbiota represented within the Clostridium cluster XI could be considered as a potential strategy to at least partially alleviate the cancer-causing effects of high-fat diet. Contributed by Anton Simeonov.
Cellular senescence in HSCs. (a) Timeline of the experimental procedure (n = 19 per group). (b) Representative macroscopic photographs of livers. Arrowheads indicate HCCs. (c) The ratios of cancer formation. (d) The average liver tumor numbers and their relative size distribution. (e) The average body weights at the age of 30 weeks. (f) Immunofluorescence analysis of liver section. HSCs were visualized by α-SMA staining and DNA was stained by DAPI. Scale bars, 2.5 μm. Arrowheads indicate α-SMA–expressing cells that were positive for indicated markers. The histograms indicate the percentages of α-SMA–expressing cells that were positive for indicated markers. At least 100 cells were scored per group. For all graphs, error bars indicate mean ± s.d. **p ≤ 0.01. HSC, hepatic stellate cell; HCC, hepatocellular carcinoma; α-SMA, alpha–smooth muscle actin; DAPI, 4′,6-diamidino-2-phenylindole; s.d., standard deviation; WT, wild type; ND, normal diet; HFD, high-fat diet; DMBA, 7,12-dimethylbenz(a)anthracene; Eut, euthanasia; Des, desmin; IL, interleukin.
Bacterial metabolite promotes obesity-induced HCC development. (a) The relative abundance of OTUs (%) in the fecal bacterial community. Data are representative of five mice per group. (b) Serum DCA concentration (ND, n = 4; HFD, n = 6; HFD + VCM, n = 3; HFD + DFAIII, n = 3; HFD + UDCA, n = 3; ob/ob, n = 3; ob/ob + 4Abx, n = 3). Error bars indicate mean ± s.e.m. (c) Timeline of the experimental procedure (n = 3 per group). (d) Representative macroscopic photographs of livers. Arrowheads indicate HCCs. (e) The average tumor numbers and their relative size distribution. (f) The average body weight and serum DCA concentration. (g) Immunofluorescence analysis of liver sections. Scale bars, 2.5 mm. The histograms indicate the percentages of α-SMA–expressing cells that were positive for indicated markers. At least 100 cells were scored per group. (h) The qPCR analysis of baiJ gene in the feces (180 mg) of indicated mice used in (a). For all graphs except (b), error bars indicate mean ± s.d. *p ≤ 0.05; **p ≤ 0.01. DCA, deoxycholic acid; VCM, vancomycin; DFAIII, difructose anhydride III; UDCA, ursodeoxycholic acid; 4Abx, oral antibiotic; s.e.m., standard error of the mean; qPCR, quantitative real time PCR.
Fluorescence and Mass Spectroscopy Assays to Study a Metabolic Enzyme
VanderPorten E, Frick L, Turincio R, Thana P, LaMarr W, Liu Y: Label-free high throughput assays to screen and characterize novel lactate dehydrogenase inhibitors.Anal Biochem2013;441:115–122.
Abstract: Catalytic turnover of pyruvate to lactate by lactate dehydrogenase (LDH) is critical in maintaining an intracellular NAD+ pool for continuous fueling of the glycolytic pathway. In this paper, we describe two label-free high-throughput assays (a kinetic assay detecting the intrinsic NADH fluorescence and a mass spectrometric assay monitoring the conversion of pyruvate to lactate) that were designed to effectively identify LDH inhibitors, characterize their different mechanisms of action and minimize potential false positives from a small molecule compound library screen. Utilizing a fluorescence kinetic image-based reader capable of detecting NADH fluorescence in the ultra-high-throughput screening (uHTS) work flow, the enzyme activity was measured as the rate of NADH conversion to NAD+. Interference with NADH fluorescence by library compounds was readily identified during the primary screen. The mass spectrometric assay quantitated the lactate and pyruvate levels simultaneously. The multiple reaction monitoring (MRM) mass spectrometric method accurately detected each of the two small organic acid molecules in the reaction mixture. With robust Z′ scores of >0.7, these two high-throughput assays for LDH are both label-free and complementary to each other in the HTS workflow by monitoring the activities of the compounds on each half of the LDH redox reaction.
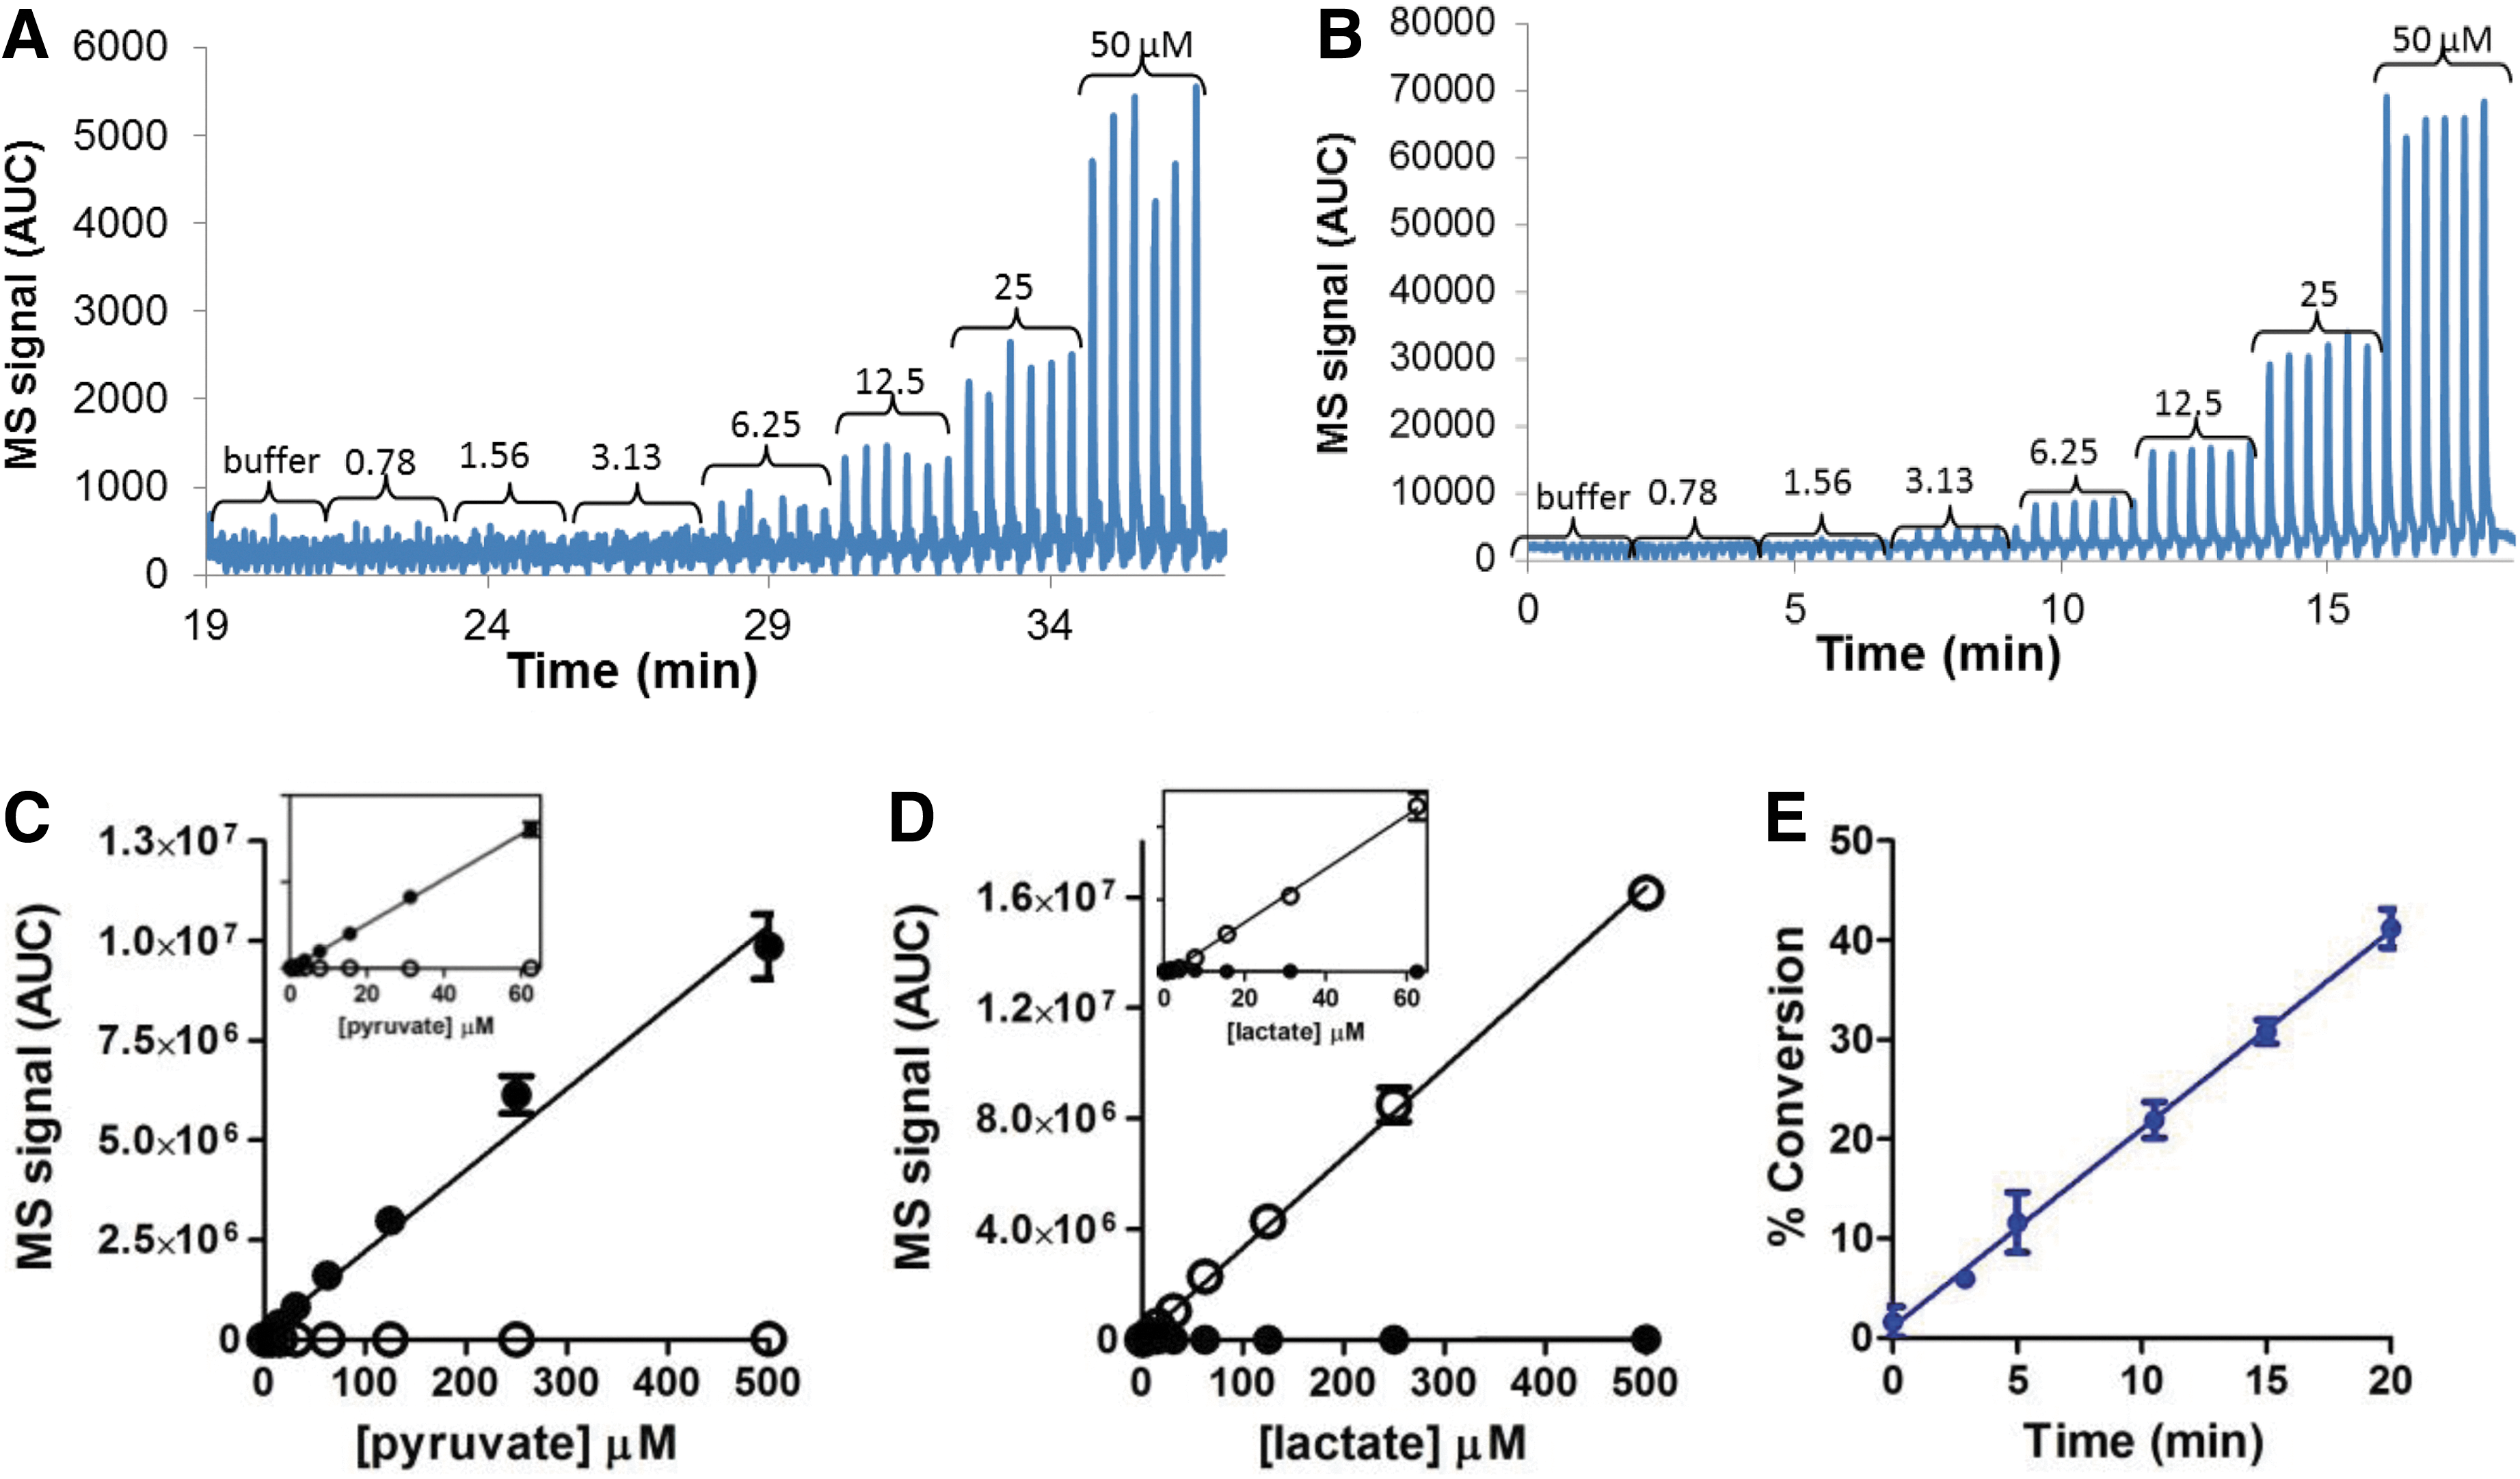
Commentary:Aberrant metabolism is a hallmark of cancer. Cancer cells often switch from normal cell respiration to aerobic glycolysis, called the Warburg effect. This allows cancer cells to rapidly produce ATP as well as other intermediates that may be needed for rapid cell division. Lactate dehydrogenase (LDH) is an enzyme that is important for maintaining the NAD+ pool needed for the glycolytic pathway, by using NADH to turn pyruvate into lactate and produce NAD+. LDH has historically been used as a coupling enzyme for the development of other assays, such as pyruvate kinase kinetic assays, but has more recently emerged as a target in its own right. Levels of LDH have been shown to be elevated in tumor cells impacted by the Warburg effect. The authors here report the development of a 1,536-well assay that monitors the fluorescence of NADH in kinetic mode for LDH-A enzyme. The rapid reaction is allowed to progress for 3 minutes and the data from 1 to 2 minutes are used because that is the linear range for this reaction. Many compounds are fluorescent at this wavelength (excitation = 340 nm and emission = 482 nm), so a fluorescence preread was done with enzyme, pyruvate, and compound to gauge the fluorescence prior to adding NADH. Other strategies to mitigate the fluorescence of compounds at this wavelength include right shifting the fluorescence through coupling enzymes, such as diaphorase, but the authors point out that this then requires the use of counterassays to eliminate the possibility that the compound is impacting the coupling system. Using this NADH kinetic LDH assay, the authors screened a large library (>1 million compounds) using acoustic dispensing of their compounds to generate assay ready plates, and the observed hit rate was 0.3%. After removing fluorescent artifacts, the hit rate was just 0.06%. After confirming the hits in 384-well format, the hits were tested in a lower throughput mass spectroscopy assay using a RapidFire 300 High-throughput Mass Spectroscopy System that quantitated the presence of the substrate pyruvate and the product lactate by using multiple reaction monitoring. Both assays had Z′ scores over 0.7 and recapitulated the reported Km values of NADH and pyruvate. The authors were readily able to separate and identify lactate and pyruvate levels despite the small difference in size of just 2.1 Da, and the limit of detection of lactate and pyruvate was 1 μM (see
figure
). The authors determined that some of their hits were irreversible inhibitors even though they had a structure similar to oxamate, a known reversible inhibitor of LDH. The correlation between the IC50 values obtained from the two assay formats was quite good, with a 72% confirmation rate of nonfluorescent actives from the NADH kinetic assay in the mass spectroscopy assay, and the majority of the compounds (∼82%) that had been flagged in the NADH kinetic assay preread as fluorescent did not confirm in the mass spectroscopy assay. One interesting observation that will be important for others studying this enzyme to consider is that the authors also discovered a series of compounds that decreased both pyruvate and lactate levels through an as yet unknown mechanism. If only substrate or product levels were being monitored this likely unwanted effect of the compound on the reaction would have been missed, showing the power of monitoring multiple reaction components at the same time. A few of the hits were further characterized and were found to be competitive with pyruvate and not NADH. The possibility of NADH uncompetitive inhibitor binding could not be confirmed or refuted using these assays due to the limit of detection. Recent crystal structures of two inhibitor series (PDB ID: 4JNK and unreleased) coming from this 1 million compound screen show that these inhibitors bind to the pyruvate binding site. Contributed by Mindy I. Davis.
Titration of pyruvate (A) and lactate (B) in replicates in mass spectrometric assay. Mass spectrometric signal of pyruvate MRM (C) and lactate MRM (D). The titrations of pyruvate (closed circles) and lactate (open circles) were linear and the MRM detection was specific to each acid. The linearity was shown in the inserts for lower concentrations of the analytes. (E) The LDHA reaction (0.25 nM LDHA with 75 μM pyruvate and 50 μM NADH) showed good reaction kinetic linearity up to 20 minutes in mass spectrometric assay. Approximately 30% conversion was achieved after 10 minutes of reaction, which was consistent with the conversion observed in NADH fluorescence kinetic assay. MRM, multiple reaction monitoring; LDHA, lactose dehydrogenase A; NADH, reduced nicotinamide adenine dinucleotide; AUC, area under the curve.
NTA Probe
Backmark AE, Olivier N, Snijder A, Gordon E, Dekker N, Ferguson AD: Fluorescent probe for high-throughput screening of membrane protein expression.Prot Sci2013;22:1124–1132.
Abstract: Screening of protein variants requires specific detection methods to assay protein levels and stability in crude mixtures. Many strategies apply fluorescence-detection size-exclusion chromatography (FSEC) using green fluorescent protein (GFP) fusion proteins to qualitatively monitor expression, stability, and monodispersity. However, GFP fusion proteins have several important disadvantages; including false-positives, protein aggregation after proteolytic removal of GFP, and reductions in protein yields without the GFP fusion. Here we describe a FSEC screening strategy based on a fluorescent multivalent NTA probe that interacts with polyhistidine-tags on target proteins. This method overcomes the limitations of GFP fusion proteins, and can be used to rank protein production based on qualitative and quantitative parameters. Domain boundaries of the human G-protein coupled adenosine A2a receptor were readily identified from crude detergent-extracts of a library of construct variants transiently produced in suspension-adapted HEK293-6E cells. Well expressing clones of MraY, an important bacterial infection target, could be identified from a library of 24 orthologs. This probe provides a highly sensitive tool to detect target proteins to expression levels down to 0.02 mg/L in crude lysate, and requires minimal amounts of cell culture.
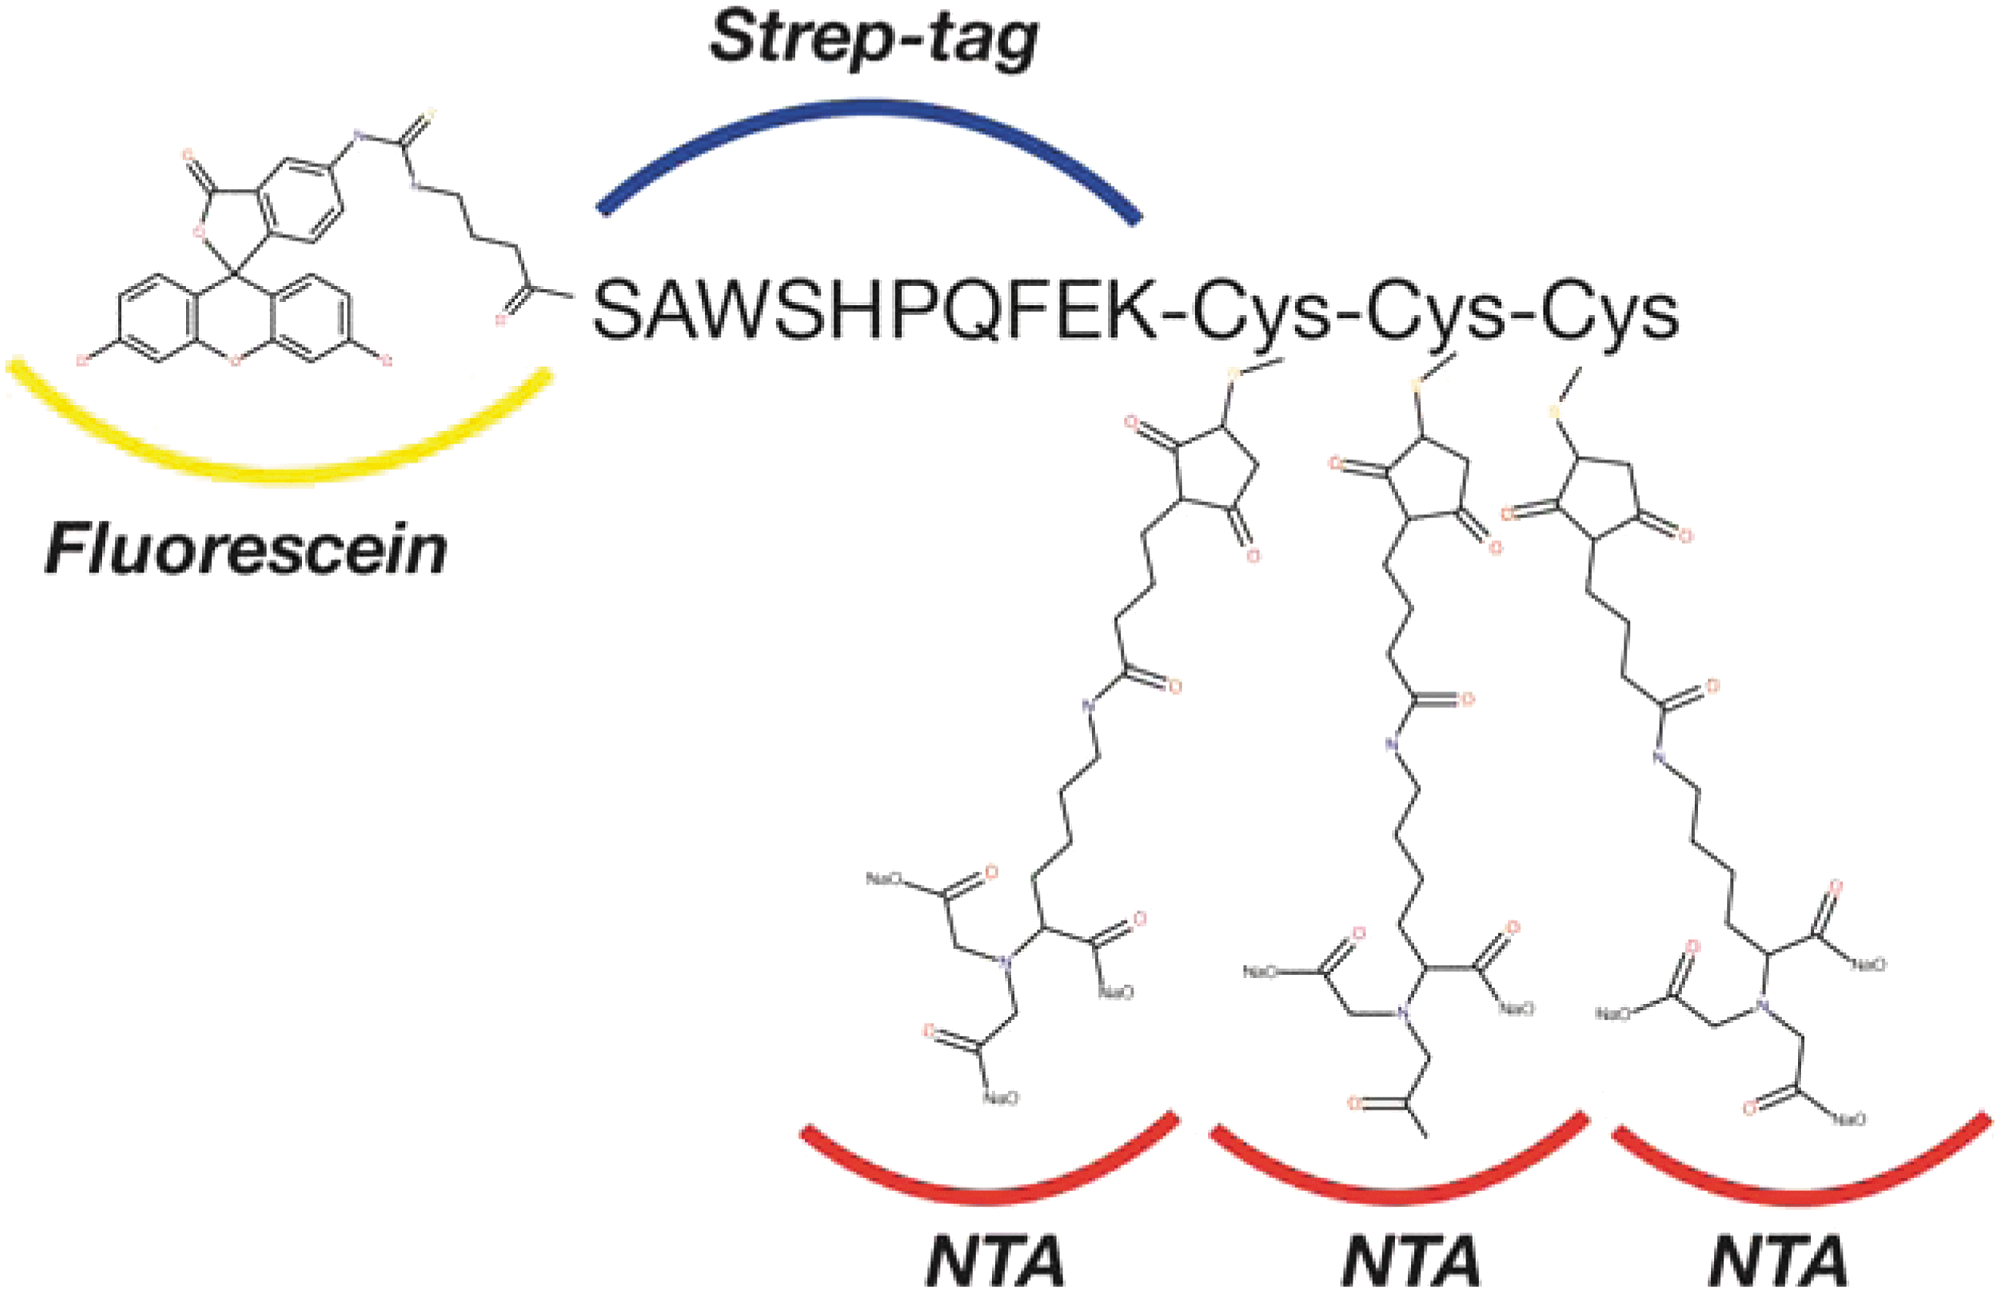
Commentary:Fluorescence-detection size-exclusion chromatography (FSEC), initially described in 2006 by Kawate and Gouaux (Structure 2006;14:673–681), is a strategy combining the utility of GFP fusion as a fluorescence readout and the power of size-exclusion chromatography (SEC) to characterize protein properties. These properties include degree of monodispersity, expression level, stability, localization, and molecular mass. FSEC has been successfully shown to evaluate unpurified targets in nanogram quantities for various integral membrane and water-soluble proteins. In particular, this approach has served as a useful tool for the purpose of precrystallization screening. Some disadvantages associated with target protein fusion with GFP are the alteration of target protein behavior and challenges encountered upon GFP removal. In order to obviate the compromising effects brought about by GFP, herein, Backmark and coworkers presented an alternative fluorescence channel by utilizing a creative nitrilotriacetic acid (NTA) probe (P3NTA). This probe contains three components: a fluorescein label, a 10-residue strep tag, and a moiety that has three thiol groups covalently modified by maleimido-C3-NTA (see
first figure
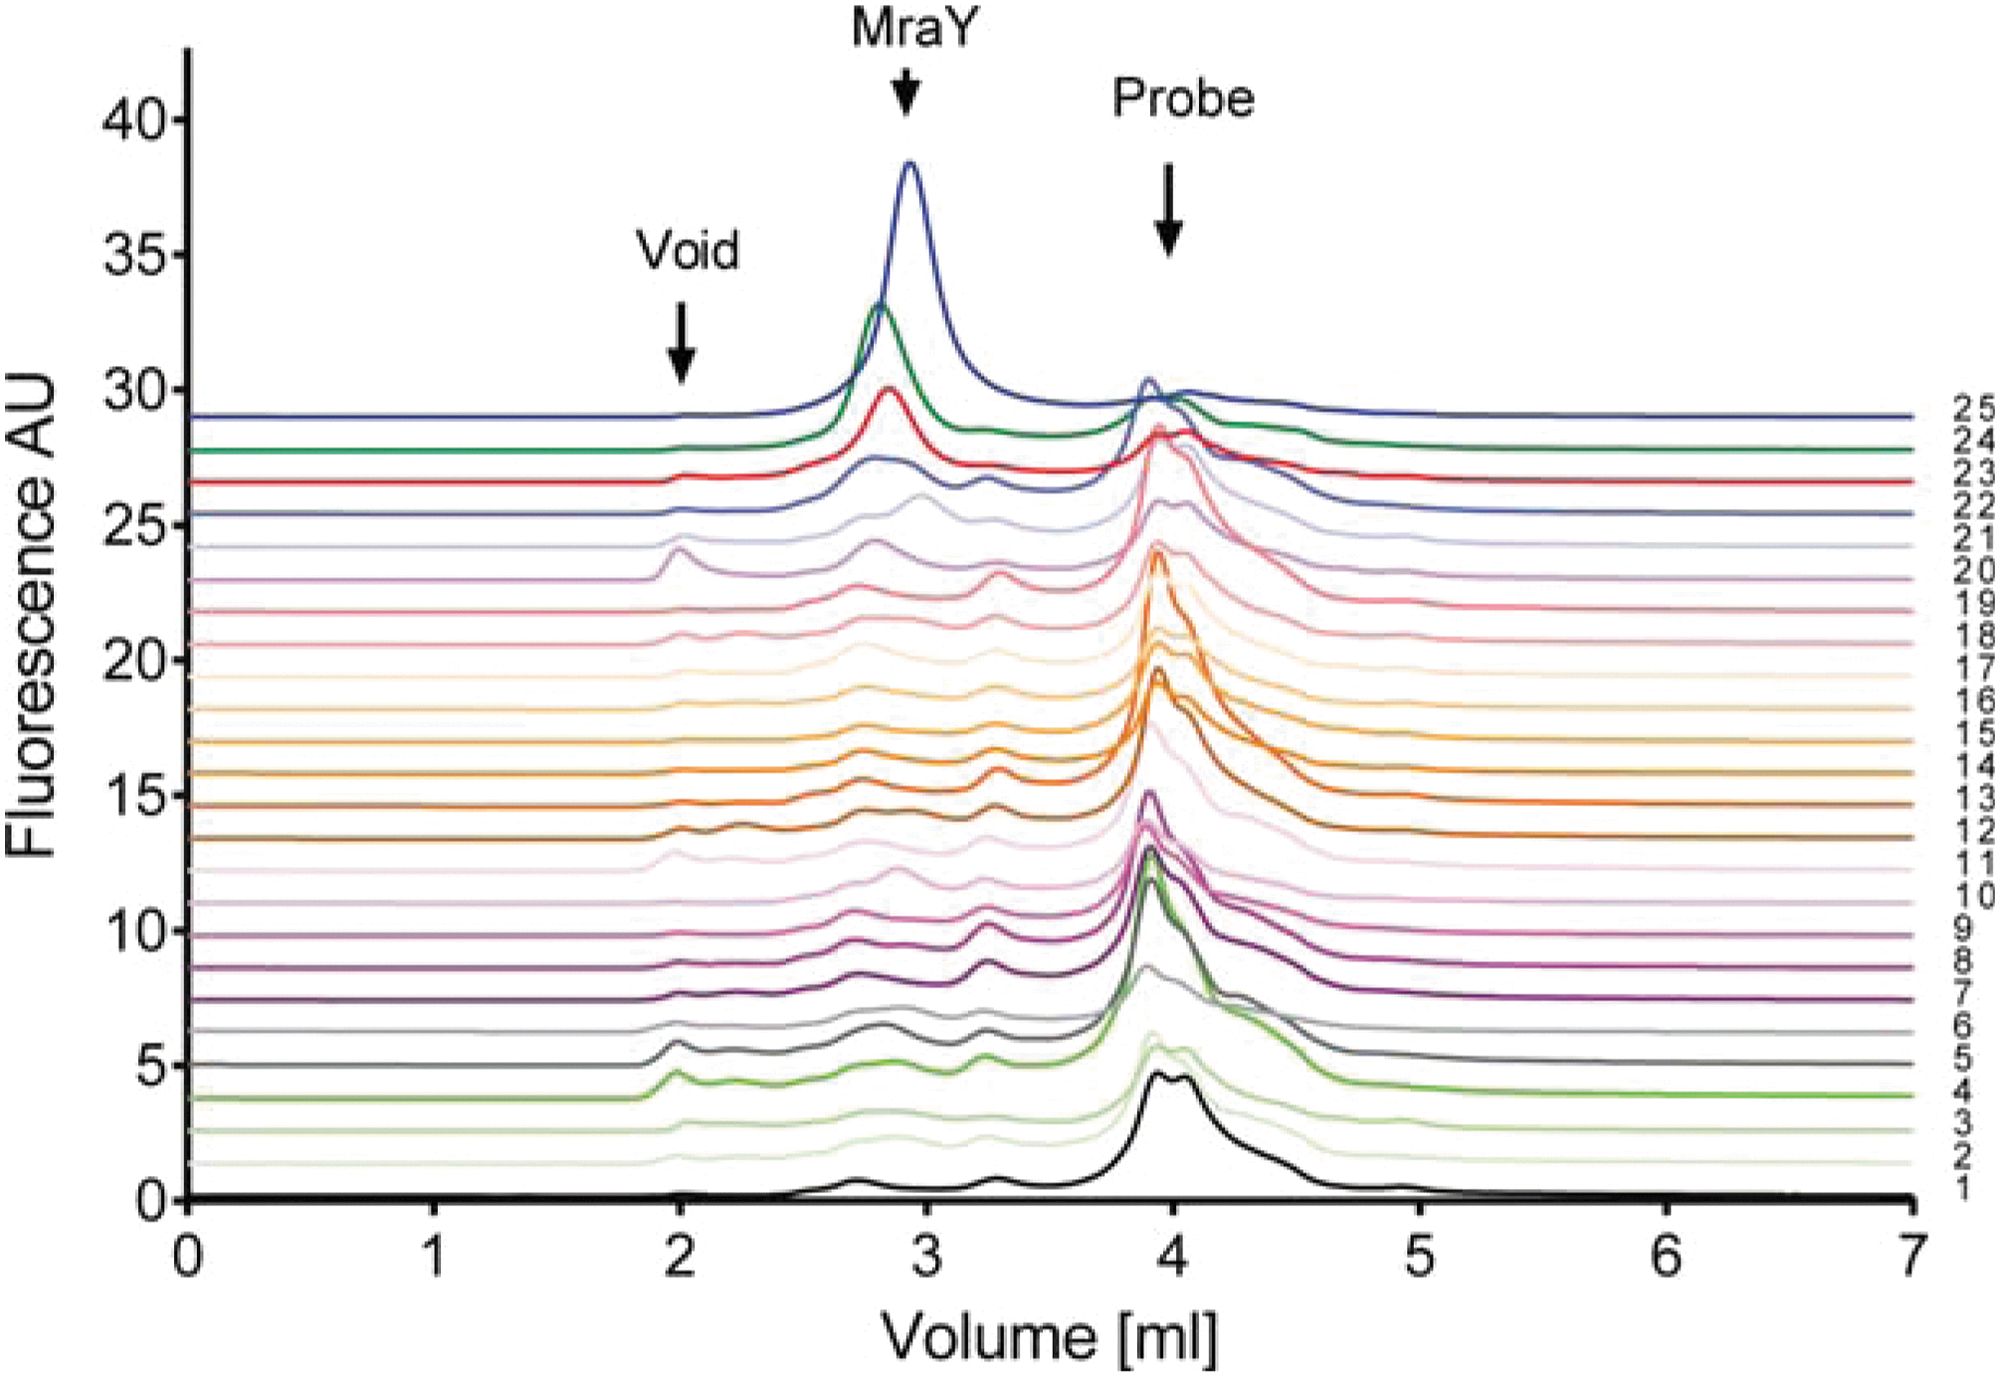
). In addition, prior work has established that interaction between the NTA-containing probe and target follows a 1:1 stoichiometry at saturating probe concentrations. The function and performance of this probe were validated using human adenosine 2a receptor as a model membrane protein that had been well characterized in its purification procedures. Specifically, when the P3NTA probe was added to detergent-solubilized membranes, the same elution volume was observed for an A2a-eGFP fusion protein compared to P3NTA being absent. Thus, the small mass of P3NTA exhibits little impact on the elution profile of the target protein (provided that the mass ratio of the target protein versus the probe is sufficient). The P3NTA probe was subsequently applied in a high-throughput manner, and it was successfully demonstrated to yield reliable protein level assessments and to identify well-behaving clones. For example, MraY, a bacterial membrane protein, is a target whose ortholog presents challenges in overproduction and purification. P3NTA, coupled with FSEC, was applied to rank the expression level of 24 MraY ortholog members (see
second figure
). Overall, for the aim of protein production and purification, the application of a high affinity–based capture of target protein clearly illustrates its advantages compared to GFP fusion to target protein, the linkage of which is of a covalent nature. Comparable detection sensitivity and reduced risks in adversely affecting protein function and yield are some of the points that have been evidenced in this work. Moreover, the synthesis of such a modified NTA probe should be accessible to most protein biochemistry laboratories. Contributed by Wendy Lea.
Chemical structure of the peptide-based fluorescence-detection size-exclusion chromatography (FSEC) probe P3NTA.
Ortholog screening of a bacterial membrane protein using FSEC. Orthologs were expressed in E. coli, and whole cell lysates were solubilized with dodecylmaltoside prior to addition of probe. Monodisperse protein elutes at 2.9 mL, whereas the free probe elutes at 3.9 mL. Cells transformed with empty expression vector were used as a negative control. To ensure that the full expression range was observed, detergent-solubilized samples were analyzed with increasing probe concentrations until a significant peak of free probe was observed at 3.9 mL. Samples: 1, empty vector control; 2, Corynebacterium diphteriae; 3, Comamonas testosteroni; 4, Chlamydia trachomatis; 5, Escherichia coli; 6, Enterococcus faecalis; 7, F.nodosum; 8, Ferroglobus placidus; 9, Faecalibacterium prausnitzii; 10, Hyphomonas neptunium; 11, Helicobacter pylori; 12, Myceliophthora thermophila; 13, Methanococcus voltae; 14, Porphyromonas gingivalis; 15, Pyrococcus horikoshii; 16, Rickettsia rickettsii; 17, Streptococcus pneumoniae; 18, Thermoanaerobacter mathranii; 19, Thermoproteus neutrophilus; 20, Methanothermobacter thermautotrophicus; 21, Moorella thermoacetica; 22, Leuconostoc gasicomitatum; 23, Thermus thermophilus; 24, Clostridium bolteae; 25, Bacillus subtilus.