




Abstract
The current landscape of in vitro models used to identify drug- or chemical-induced hepatotoxicity relies heavily on cell culture models consisting of HepG2, induced pluripotent stem cell–derived, or primary hepatocytes. While these in vitro models offer powerful approaches for predicting toxicity, each system has challenges, including variable metabolic capacity, brief ex vivo life span in culture, and adoption with standard automated microscopy high-content screening (HCS) systems to measure reproducibility data at the single-cell level. In this report we introduce a novel primary hepatocyte coculture model, HepatoPac™, as an alternative to current model systems for evaluation of in vitro hepatotoxicity in 96-well microtiter plate format examined by HCS. The coculture model consists of primary hepatocytes that are micropatterned to form a discrete microarchitecture or “hepatocyte islands” that are surrounded by supporting fibroblasts resulting in long-term viability and metabolic function of primary hepatocytes. Using multiple HCS image capture and image analysis strategies, we established methods to interrogate various morphometric parameters, such as size, shape, and intensity, at the island or single-cell level. We applied these approaches to identify subpopulations of both fibroblasts and hepatocytes that exhibited alterations in nuclear parameters, cell permeability, mitochondria function, and apoptosis using known reference control compounds and an eight-point dose curve. Subpopulation analysis with additional bioprobe sets can provide a powerful means of addressing differential cell and tissue susceptibilities during compound profiling. Our data show that the HepatoPac is amendable for HCS imaging applications and provides a unique approach for studying hepatotoxicity over prolonged periods of time.
Introduction
Prediction of human hepatotoxicity from animal or in vitro data continues to be a significant challenge. Despite the extensive use of both in vitro systems and in vivo animal models to evaluate hepatic disposition and toxicity of drugs and other chemicals, unexpected hepatotoxicity continues to be a leading cause of drug failures during clinical trials. 1 Most in vitro systems, especially with cultured hepatocytes, present several challenges for conducting long-term metabolism and toxicity testing. First, there is variable attachment and rapid deterioration of histotypic architecture, cellular polarity, and functionality of hepatocytes maintained on standard plasticware. 2 A second problem is the lack of other relevant cell types (i.e., non-parenchymal cells) required for normal function. A third challenge involves supplying cultures with adequate nutrients and paracrine factors to support the wide array of cellular functions performed by hepatocytes in vivo (e.g., phase I and II biotransformation reactions, biosynthesis of bile acids, and serum proteins).
There is evidence that the mode of action for many types of chemical- or drug-induced hepatotoxic responses often involves multiple cell types and perturbation of pathways over prolonged exposure periods. 3 –5 Chemical-induced changes in nuclear-receptor activity and changes in multiple target genes can eventually lead to overwhelming of an organism's adaptive responses and may occur over many days or even weeks at low, but physiologically relevant, exposure levels. 6,7 Immune-mediated responses that are associated with reactive metabolites or that occur upon exposure to endotoxins require interactions between hepatocytes, endothelial cells, and Kupffer cells. 3,5,8 Clearly, there is a need to develop more physiologically relevant, long-term culture model systems for assessing the hepatotoxic effects of compounds during development.
Over the past decade, there has been a growing trend to utilize newer generations of in vitro hepatocyte models to study predictive toxicology. Nonetheless, many challenges remain with the use of primary human hepatocytes in traditional assay development in part due to the fragile nature of handling ex vivo tissue samples. Early drug discovery programs often face challenges with commonly used validation strategies due to accessibility and expense of primary donor cells in addition to expected and observed variability between individual batches of cells. It is also difficult to verify reproducibility within the same donor lot due to processing steps, such as the addition of Matrigel overlay, that are used to maintain the viability and functionality of the cells. Finding and establishing primary donor cells for highly specialized techniques, such as high-content screening (HCS) imaging approaches, is expensive. Even with well-trained personnel, cryopreserved cells often do not meet minimal morphological requirements and freshly isolated cells are unreliable; therefore, they are typically difficult to use for compound screening. Recently, Khetani and Bhatia reported a miniaturized, multiwell culture system for human liver cells with optimized microscale architecture that are functional for several weeks. 9 This approach utilizes microtechnologies adapted from the semiconductor industry to both optimize and miniaturize an in vitro model of the liver in a multiwell format. The Hepregen HepatoPac™ is a commercially available micropatterned coculture of primary animal or human hepatocytes and murine fibroblasts that has been engineered to possess extended cell viability with retention of in vivo–like hepatocyte functions in culture, for example, albumin secretion, urea synthesis, and drug metabolizing activities. 9 –11 The precise microscale architecture and optimal stromal interactions create culture conditions that allow the hepatocytes to maintain phenotypic stability for several weeks in vitro. The cocultures display high levels of phase I and II enzymes as well as transporter expression for several weeks. 11,12 Hepatocytes maintained in the HepatoPac platform outperform those in conventional culture models (monolayer on rigid collagen, collagen gel sandwich, Matrigel overlay, and Matrigel substratum) with respect to the magnitude and longevity of liver-specific functions. 9,13
In the current study, we evaluated the use of the HepatoPac system as an HCS imaging tool for identifying hepatotoxic compounds. Consequently, specific screening strategies and optimized methods were devised to interrogate compound-induced effects on the morphometry of the hepatocyte islands as well as the surrounding fibroblast layer. Full dose–response profiles were generated for various morphometric endpoints, such as nuclear size and intensity, cell permeability, mitochondrial integrity, and apoptosis using prototype hepatotoxic drugs and chemicals. Both compound- and cell-specific effects were observed that were in keeping with the known mechanism of action for each compound. Overall, the results from these studies demonstrate that the hepatocyte micropatterned coculture platform is amenable to routine HCS imaging applications and represents a promising new tool for evaluating the hepatotoxic potential of new compounds during development.
Materials and Methods
HepatoPac Micropatterned Coculture Liver Model
Plateable cryopreserved primary human hepatocytes were purchased from a commercial vendor (e.g., Life Technologies, Carlsbad, CA). The cryopreserved hepatocyte vials were thawed at 37°C for 90–120 s followed by dilution with 50 mL of prewarmed customized and proprietary hepatocyte culture medium (HCM) from Hepregen Corporation (Medford, MA). The cell suspension was spun at 50g for 5 min, supernatant was discarded, cells were resuspended in HCM, and viability was assessed using Trypan blue dye exclusion (viability was at least 85%). To create the micropatterned cocultures (HepatoPac; Hepregen Corporation) in a ANSI/SLAS standard 96-well microplate (e.g., BD Biosciences, Franklin Lakes, NJ), a hepatocyte pattern was first produced by seeding hepatocytes on rat-tail collagen (BD Biosciences) type I-patterned substrates that mediate selective cell adhesion. 9,11 Liver-derived nonparenchymal cells, as judged by their size (∼10 μm in diameter) and morphology (nonpolygonal), were consistently found to be <1% in these preparations with approximately a total of 5,000 hepatocytes attached per well of a 96-well plate. After 4–6 h the plates were washed to remove any unattached cells, and the hepatocyte cultures were incubated in HCM with 10% serum overnight. 3T3-J2 murine embryonic fibroblasts were seeded 12–18 h afterward to create cocultures. To maintain hepatocyte viability and prolong stabilization of liver-specific functions in cocultures, growth medium was replaced using an automated multichannel pipettor every 2 days (64 μL/well) for 8 days prior to use for studies. 9,13
Cell Culture, Compound Treatment, and Fluorescent Probes
HepatoPac micropatterned cocultures were produced in a 96-well format using cryopreserved human hepatocytes at the Hepregen Corporation facility. The cultures were maintained at 37°C, 10% CO2 for 8 days prior to use in the study. On day 8 of culture, the cells were washed one time in dosing medium (phenol-red-free medium containing 5% serum) and treated with the compounds of interest or vehicle control (<0.5% DMSO). The compounds were tested in duplicate at 250, 125, 62.5, 31.3, 15.6, 7.8, 3.9, and 0 μM. The test compounds included rotenone (Sigma R8875), valinomycin (Caymen 10009152), diclofenac (Sigma D6899), ibuprofen (Sigma I110), aspirin (Sigma A5376), and acetylcholine chloride (Sigma A6625). After 48 h of incubation the medium was removed and the cells were re-dosed as described earlier. After another 72 h of incubation the media were removed and the cells were stained and fixed using the Thermo Cellomics Multiparameter Cytotoxicity 3 Kit (8408102). This kit contains all necessary buffers, fluorescent dyes, and antibodies for labeling cytochrome c (cyt c), mitochondrial membrane potential (MitoTracker Orange [MTO]), membrane permeability (YoYo-1), and nuclear staining (Hoechst 33342). At time of staining, MTO and YoYo-1 dyes were first introduced for ∼30 min and then cells were fixed with 4% paraformaldehyde and permeabilized with Triton X-100. The cells were subsequently blocked and labeled with intracellular cyt c primary mouse antibody (clone 2B5.F8) that was indirectly coupled with goat anti-mouse DyLight 649 secondary antibody followed by Hoechst nuclear dye counterstain. The mouse cyt c antibody (clone 2B5.F8) used in the Thermo Cellomics Multiparameter Cytotoxicity 3 Kit has cross-reactivity with human, cow, horse, and dog but not with mouse and this clone is commercially available from multiple sources. 14 –16
At the completion of the staining protocol, 300 μL of 1× phosphate-buffered saline was added to each well, and the plates were sealed, stored with cold gel packs, and shipped overnight to The Hamner Institutes for Health Sciences facility in Research Triangle Park, North Carolina, for subsequent HCS image capture and analysis within 48 h.
Image Acquisition
Two commercially available HCS instruments were used to capture images. The BD Pathway™ 435 imager was equipped with an Olympus 10×/0.4NA UPlanSApo objective lens to capture transmission light or fluorescent signals triggered with a PhotoFluor®II lamp (89 North, Burlington, VT). Fluorescent bioprobes Hoechst 33342 (ex 377/em 435/ev 0.85), YoYo-1 (ex 482/em 536/ev 0.08), MTO (ex 543/em 593/ev 0.4), and DyLight 649 (ex 628/em 692/ev 1.3) were collected. For montage optimization, 2×2 camera binning was used; otherwise, full-resolution unbinned camera images were captured at a single-frame resolution of 1,392×1,024 using 12-bit Lumenera® Infinity CCD camera (Ottawa, Ontario, Canada). During optimization, a defined array size for image montage was captured from 1×1, 2×2, 3×3, 4×4, 5×5, 6×6, and 7×7. We used the 3×3 montage array as an acceptable capture area for full-plate scan and was therefore integrated into the macro algorithm to collect images in each well of the 96-well plate (Fig. 1). In instances where 3D image stacks were collected for image reconstruction we used the Olympus 40×/0.6NA LucPlanFl objective lens and captured a series of 20 individual images at 1-μm intervals with a defined XY montage array of 4×5. The second instrument Cellomics ArrayScan® VTI reader (Thermo Scientific, Pittsburgh, PA) is equipped with a Zeiss 10×/0.45NA Plan-ApoChromat objective lens. Fluorescent signal was triggered using a seven-color LED light source (Lumencor, Beaverton, OR) and it was collected through BrightLine® quad-band filter set (Semrock, Rochester, NY) to measure fluorescent probes: Hoechst 33342 (ex 386/em 446/ev 0.009); YoYo-1 (ex 485/em 523/ev 0.001); MTO (ex 549/em 600/ev 0.0035); and DyLight649 (ex 650/em 677/ev 0.03). Full-resolution images (1×1 binning) were captured at the maximum allowable pixel resolution of 1,024×1,024 using 12-bit Orca ER-II CCD camera (Hamamatsu Photonics K.K., Hamamatsu, Japan). A total of 16 non-montage image fields were captured using serpentine motion (Fig. 2).

Montage scan area depiction of a well of a 96-well plate using 10×/0.3NA objective lens.
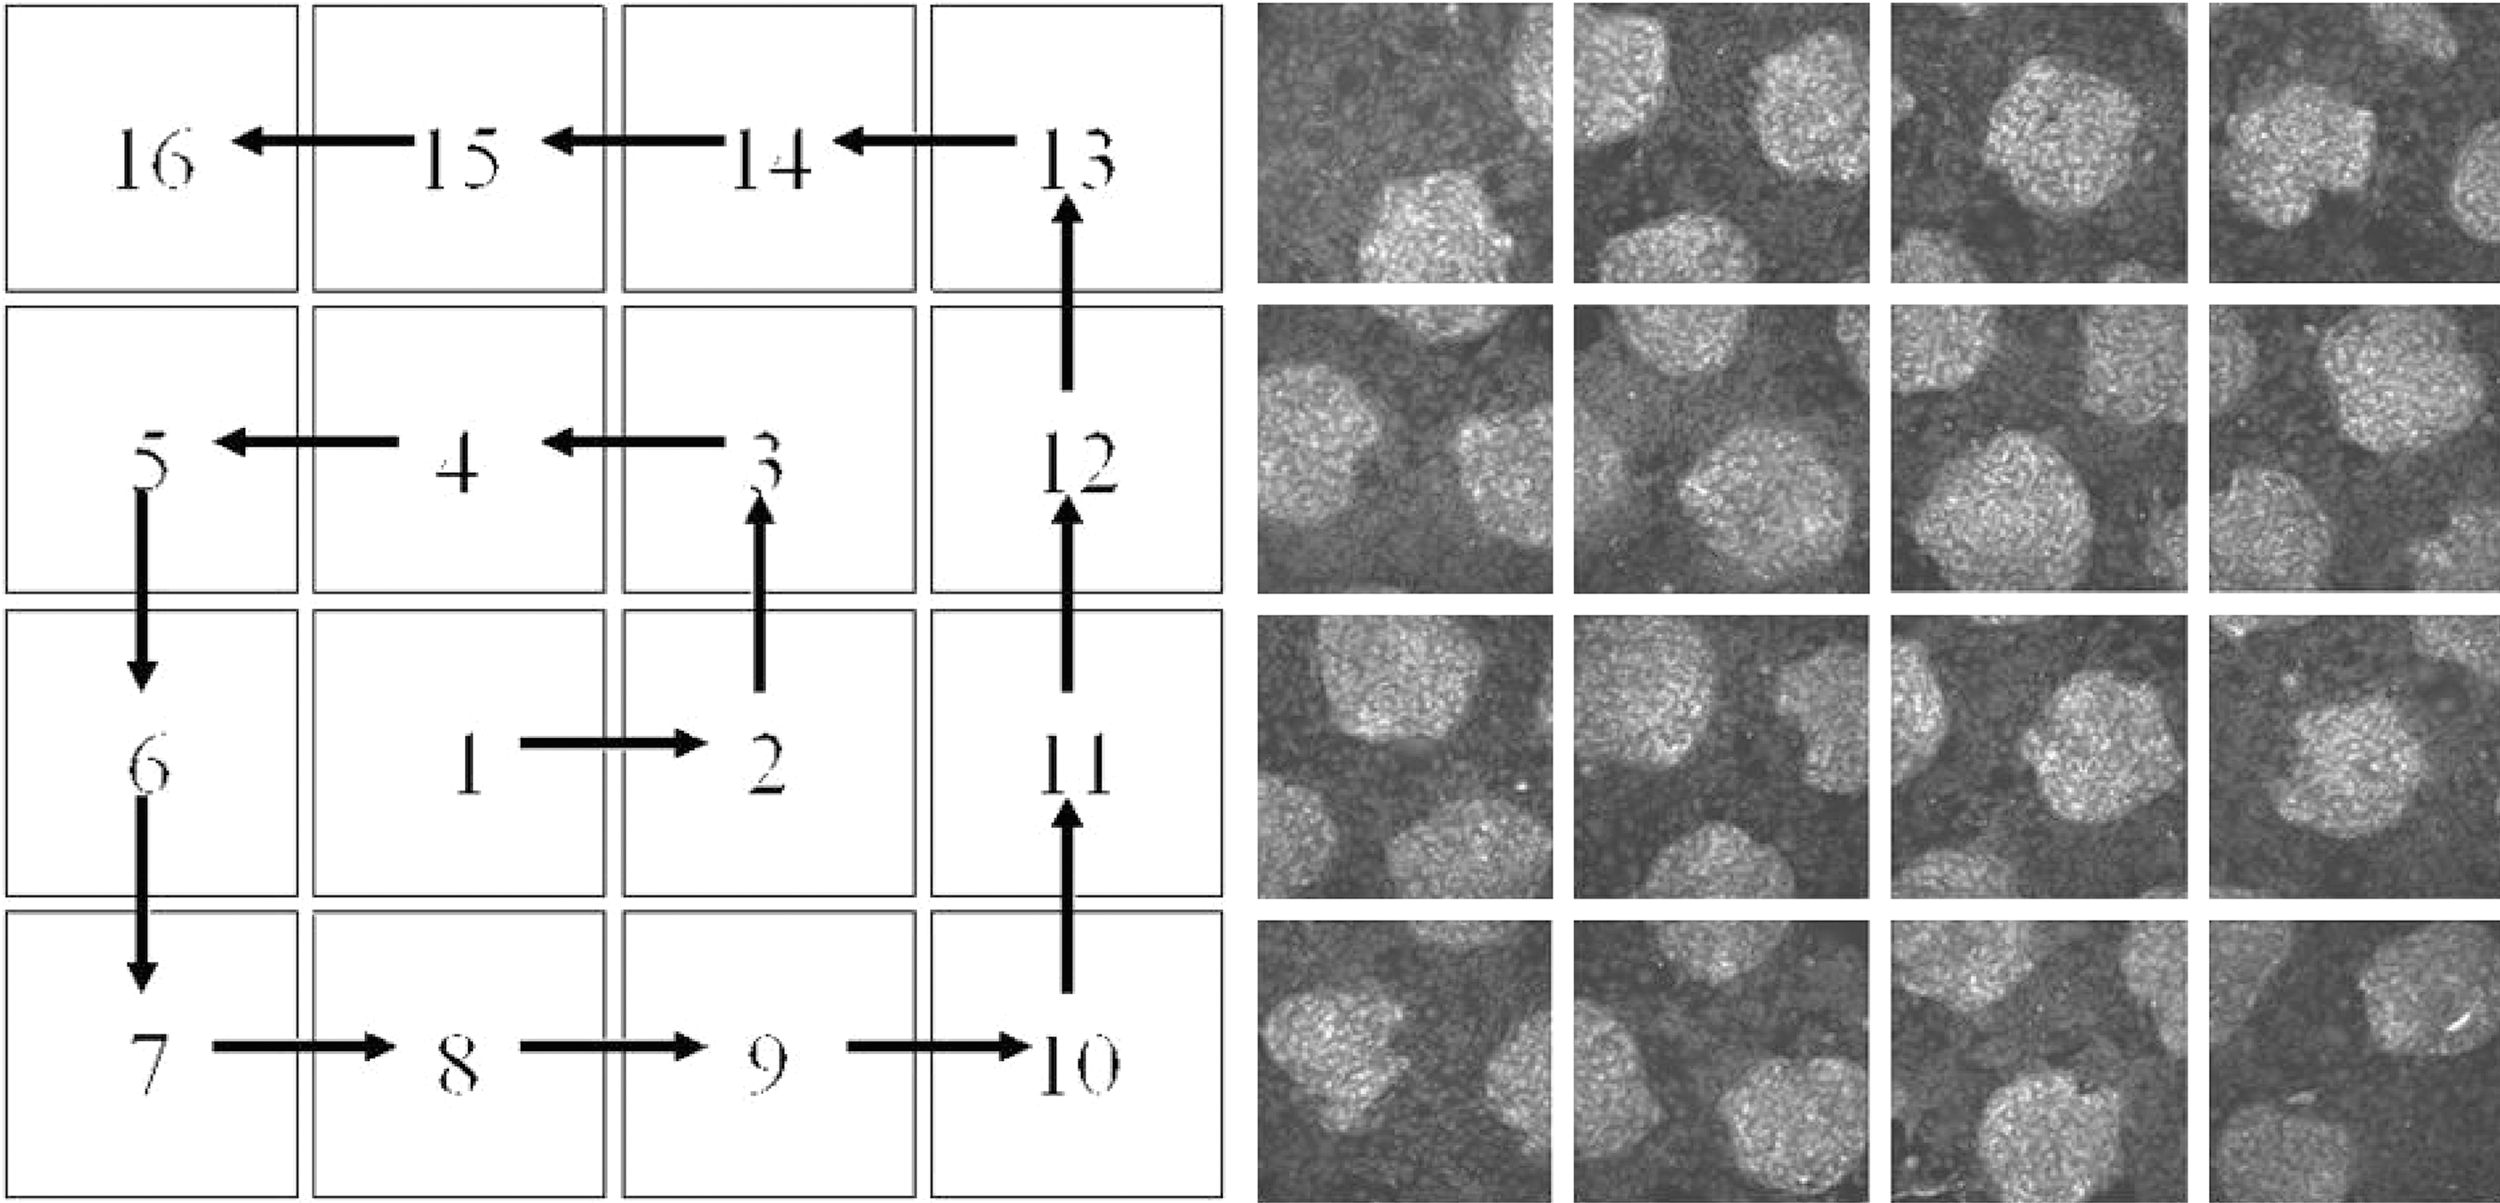
Image capture scanning direction using the Thermo Scientific Cellomics ArrayScan® VTI reader.
Image Analysis
Two commercially available software algorithms were used: (1) Developer XD, v 2.02 (Definiens, Munich, Germany) and (2) Compartmental Analysis, v 3 bioapplications (Thermo Scientific), both with unique image analysis setup as demonstrated by the mask overlays (Fig. 3). To identify individual islands to make quantitative measurements from montage images that were captured on the BD Pathway imager, a customized algorithm rule set was written in the Definiens' Developer XD software to determine a region of interest (ROI) by (1) creating a defined threshold above background fluorescence of surrounding mouse fibroblast cells using a specific marker to human cyt c antigen and bright-field image to determine the location, size, and area of the islands within the captured image montage array. (2) If the ROI touched the boundary of the image field and the area size was <75% of the mean area of an untouched ROI in the image, then the ROI was rejected for analysis. (3) Valid ROIs that were identified and created were then masked and segmented to measure intensity, size, and shape characteristics for all subsequent bioprobes: Hoechst 33342, YoYo-1, MTO, and cyt c–DyLight 649 (DL649). Additionally, a transmission light image was captured and used for both visual observation of the island and for validating the ROI mask creation; this process was implemented in the customized algorithm rule set. To quantify single-cell-derived population statistic measurements from captured fields by the Cellomics ArrayScan VTI reader, we used Thermo Scientific Compartmental Analysis bioapplication algorithm to calculate well-level average mean responses: (1) individual nuclei in all cells stained with Hoechst 33342 above a defined background threshold were identified; (2) cell objects were then segmented and masked to determine location, size, shape, and intensity of nuclei; and (3) image masks were created for subsequent captured probes to identify and measure nuclear intensity of cell permeability indictor YoYo-1, cytoplasmic spot, and area intensity of MTO and cyt c–DL649 antibody. Boolean algorithmic methods were used for cell subpopulation analysis to discriminated mouse fibroblast cells from human hepatocytes using a gating strategy similar to that of flow cytometric approach. First, the hepatocytes were identified by masking the cells that were labeled with cyt c antibody and measuring the mean average area intensity above a defined background. Then for each of the HCS classifiers, measurements for the cytotoxic endpoints were determined in each subpopulation (cyt c-positive hepatocytes or cyt c-negative mouse fibroblasts) using the average mean intensity of YoYo-1 above the cyt c-positive identification. Subsequent gating measurements of other HCS-classified features were also done based on cyt c-positive-gated cells.

Image analysis algorithm mask overlay.
Results and Discussion
Cell Health and Morphological Integrity
In DMSO vehicle control, the morphology of the fibroblast and hepatocytes appeared to be “normal” as defined by hepatocytes that exhibit cobblestone appearance with tight cell-to-cell contact, no increase in vacuolization, and without any observable cell shrinkage or swelling from 12 replicate wells. Approximately 98.7% of cells were considered viable and “healthy” with an average mean of 1.3% of total cells labeled with the YoYo-1 nucleic acid bioprobe measuring cell permeability.
Image Reconstruction
A reconstructed 3D multicolor image stack of a single hepatocyte “island” clearly showed a distinct contrast from the surrounding fibroblasts that are neither on top nor underneath the identifiable island location of human hepatocytes (Fig. 4). However, upon closer examination of the 3D image stack projection, there is evidence of nuclei without the human-specific cyt c label in voided areas within the island and near the interface edge of island, indicating the likelihood of infiltration of a small number of surrounding mouse fibroblasts. The opposing side of the reconstructed image stacks, where the island interfaces with the surface of the plate, revealed several concave cervices that likely provided an entrance area for active motile mouse fibroblasts, although the trigger and mechanics of fibroblast migration into the hepatocyte island is not fully understood (Fig. 5).

A reconstructed 3D multicolor image stack of a single hepatocyte island from a vehicle control well captured on BD Pathway 435 using 40×/0.6NA objective lens. Note the infiltration of cyt c-negative cells near the interface edge of the island and hepatocyte voided areas (yellow arrows). Image labeled with Hoechst 33342 (blue), MitoTracker Orange (MTO; green), cyt c (red), and YoYo-1 (magenta).

A reconstructed 3D image of a single island from a vehicle control well captured on BD Pathway 435 using 40×/0.6NA objective lens. Image was rotated 10° and was inverted for contrast display of the attachment area on the bottom of the plate.
ROI Island-Level Statistics
A complete island is defined as an ROI from vehicle control wells that does not touch more than 25% of the boundaries of the image frame and has a calculated mean pixel area of 710,058±76,869 standard deviation (SD). A partial island is defined as having >70% of the ROI area touching the image boarder with a mean pixel area calculated at 460,935±146,178 SD. A partial island may also be defined as a result of loss of cell integrity from cytotoxicity and/or detachment from the surface of the plate. To determine the optimal number of islands that were captured using a 10×/0.4NA objective lens on the BD Pathway 435, a montage collection array from 1×1 to 7×7 was used. As a point of reference, a 10×11 (X axis=10 fields, Y axis=11 fields; 110 fields) montage array was used to capture the entire well in a 96-well plate resulting in 39 complete and 5 partial islands (Supplementary Fig. S1; Supplementary Data are available online at

Summary of the ROI island count per montage captured area from a single scanned well. X-axis represents the montage scan area; Y-axis is the number of ROI islands identified.
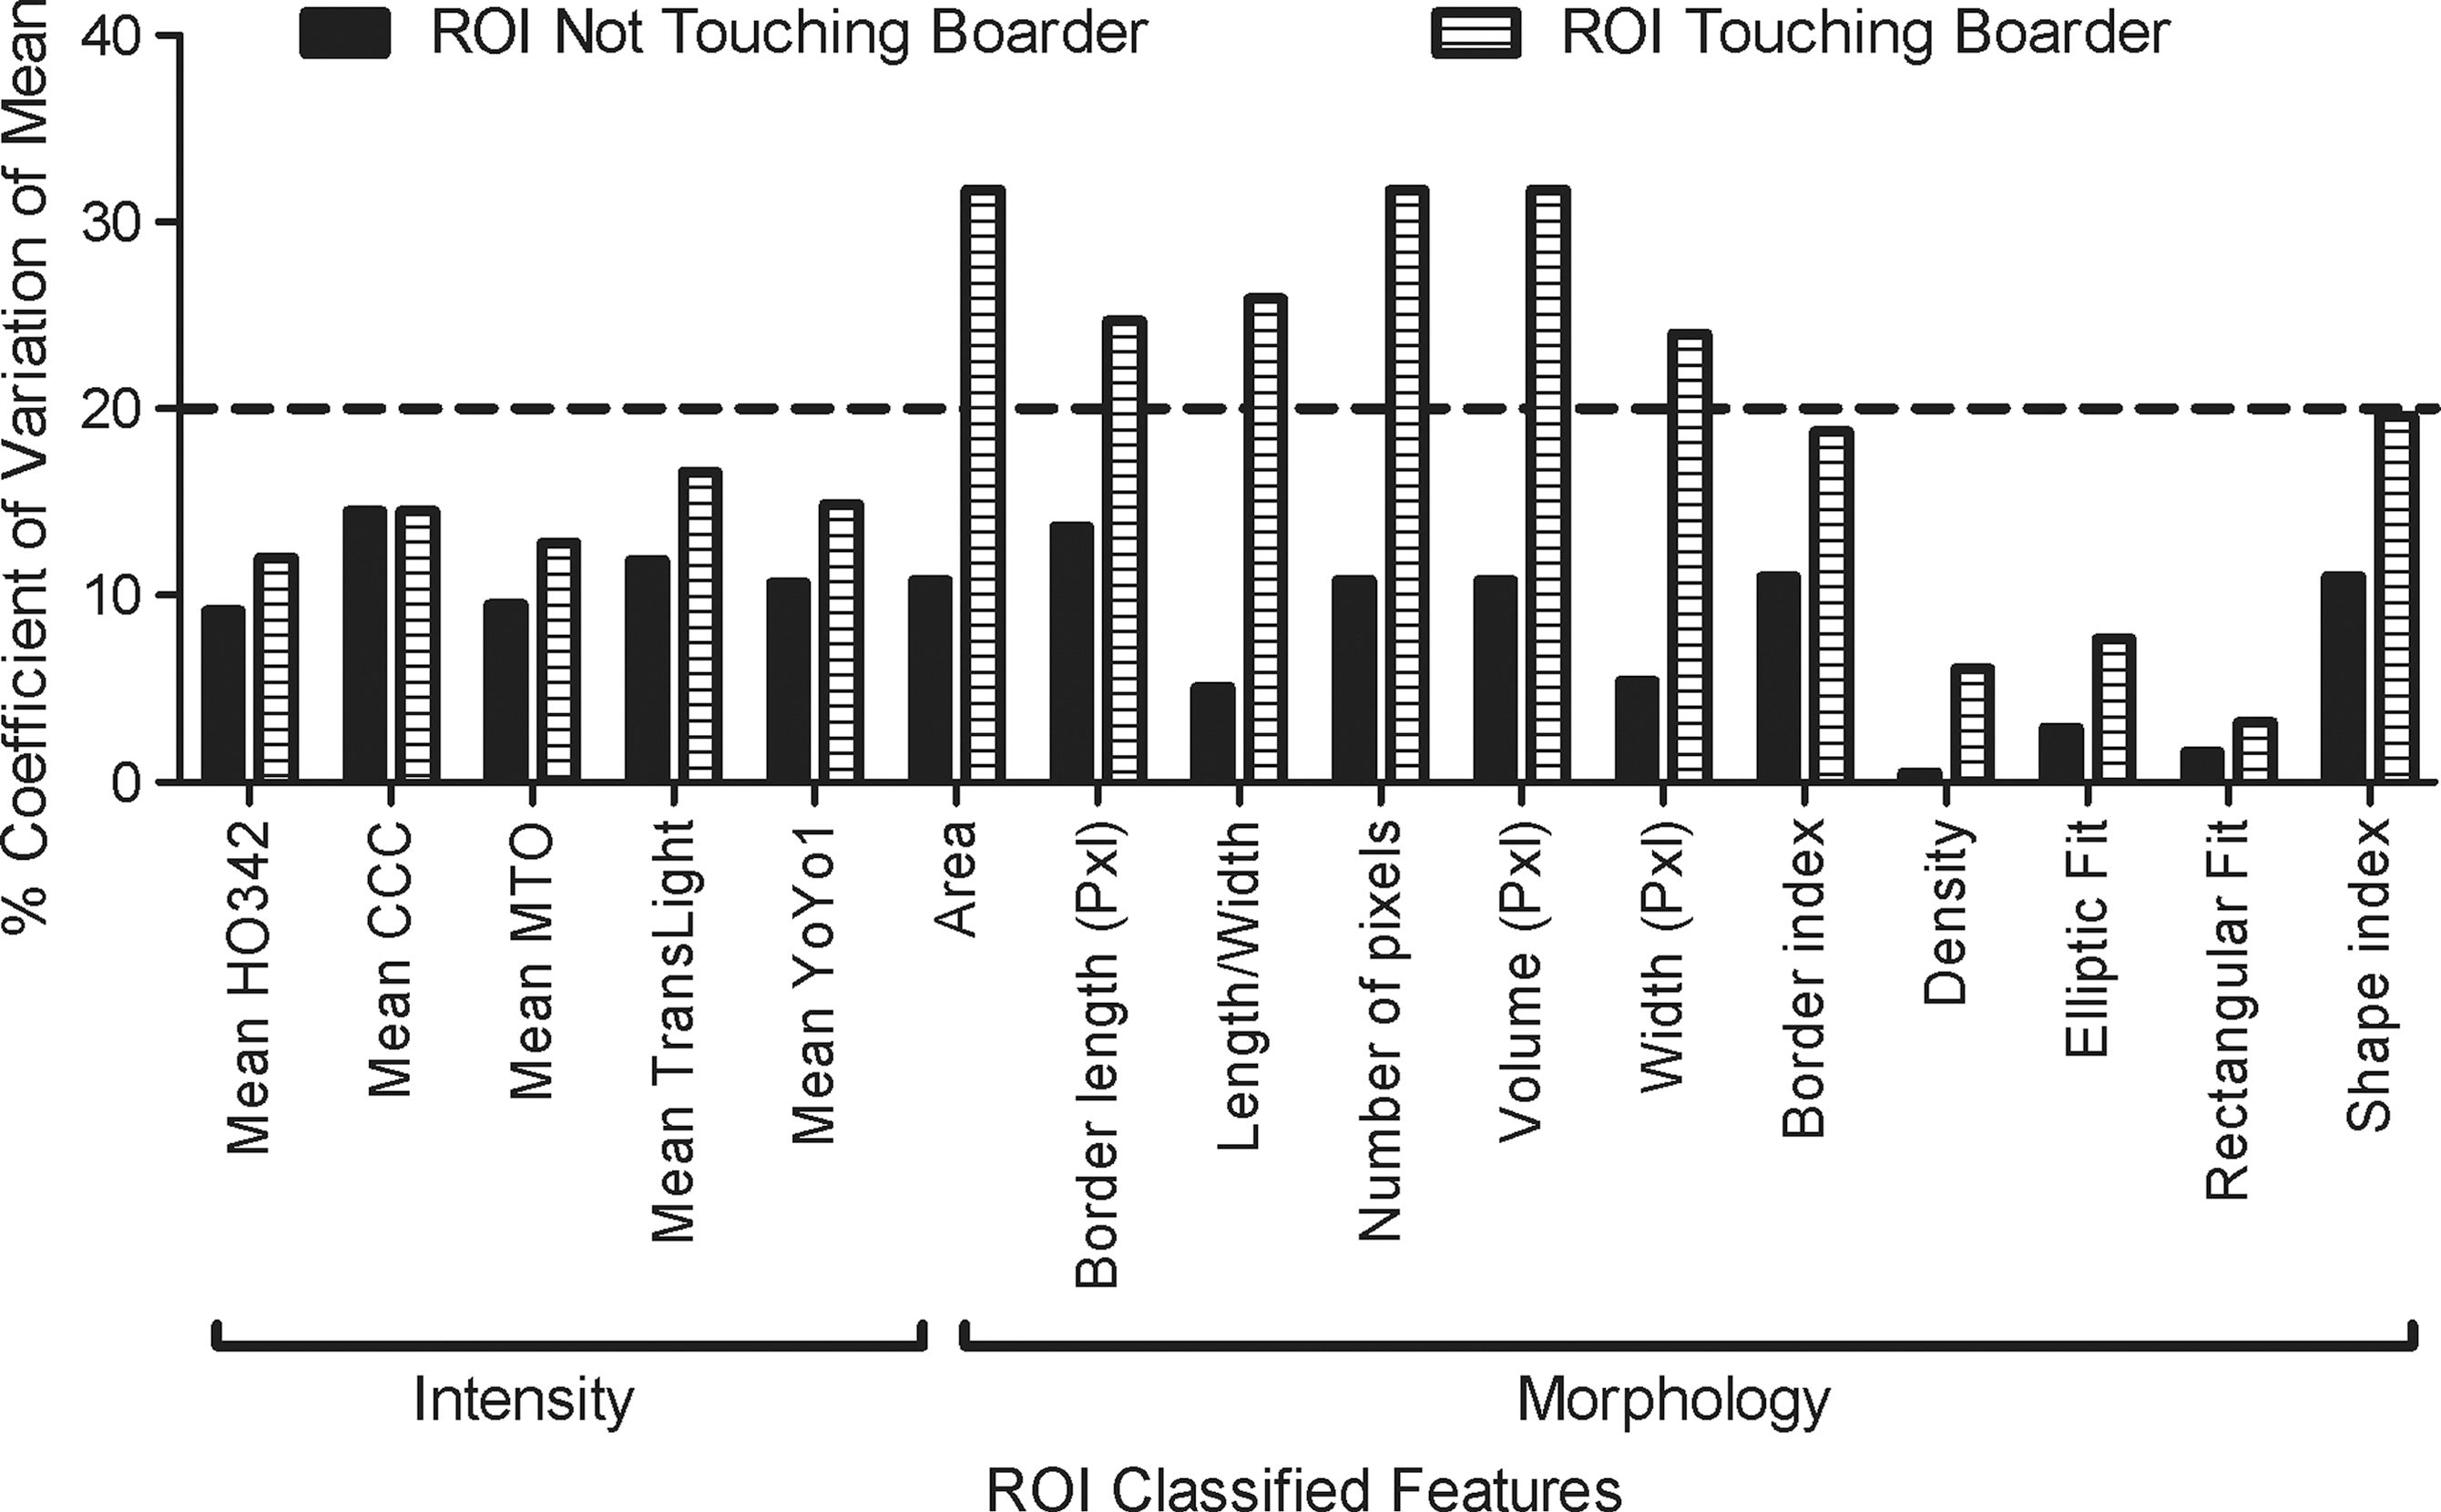
Difference of island ROI mask classified features touching or not touching the boarder boundary from replicate wells. X-axis is separated for ROI classification of HCS features—intensity (left) and morphology (right). Y-axis represents the %CV difference from calculated mean. HCS, high-content screening.
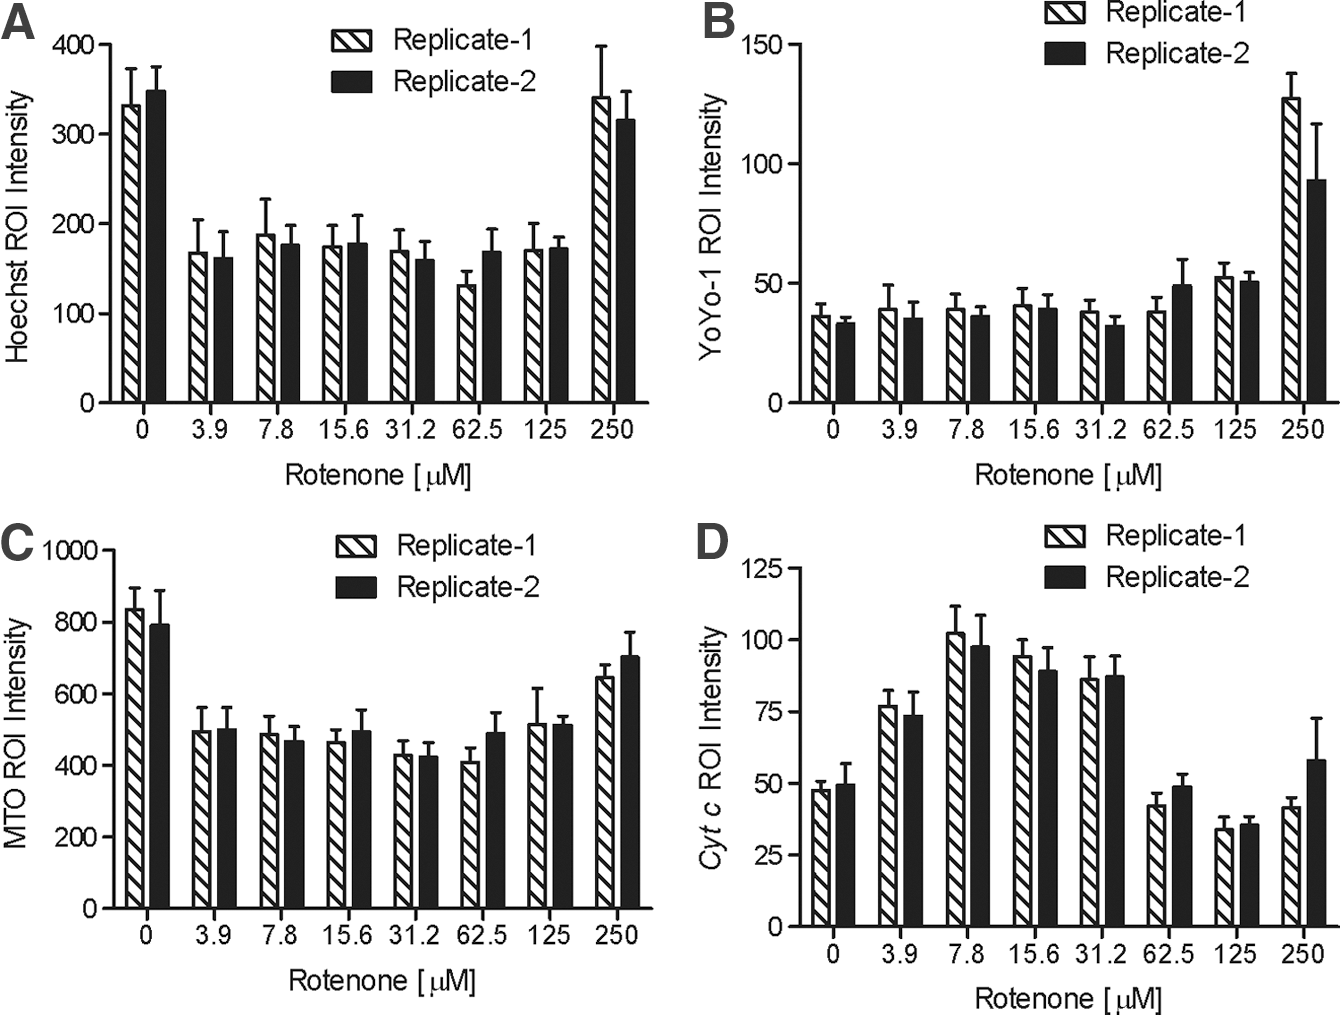
Replicate data show well-to-well±SD variability of biological fluorescent bioprobe marker intensity in Definiens-defined ROI from 4×4 scan area captured on the BD Pathway 435. SD, standard deviation.
Cell-Level Statistics
To summarize population-level measurements from the compound dose response treatments, non-montage images from 16 fields were captured on the Cellomics ArrayScan VTI reader and then analyzed with the Compartmental Analysis bioapplication algorithm. To assess overall cytotoxicity of hepatocytes and fibroblasts from compound treatment, the total object cell counts from 16 fields per well are shown in Figure 9. The average vehicle control cell counts were 4,787 with CV of 3.4%; rotenone and valinomycin showed statistical significance (P value<0.0001) to vehicle control at the lowest dose of 3.9 μM; ibuprofen showed a significant decrease in cell counts (P value=0.0109) at 125 μM but returned to the baseline average at the 250-μM dose; diclofenac, aspirin, and acetylcholine treatment did not show any statistically significant effects over the dose response range up to 250 μM after 5 days of treatment (Fig. 9).

Cell cytotoxicity determined from object cell counts of Hoechst 33342–stained nuclei. X-axis is the compound concentration and Y-axis is the valid object count (n=2 wells,±SD).
To assess cell membrane integrity, the YoYo-1 bioprobe was detected within the nuclear mask region by measuring mean average intensity. This permeability indicator bioprobe penetrates compromised cell membranes and labels unbound DNA. There was a statistically significant (P value<0.0004) response at the lowest dose of 3.9 μM in rotenone and valinomycin, a slight recovery at 7.8 μM (P value <0.01), and an increase over the dose response with three-parameter EC50 value of 92 and 116 μM, respectively. There was no supporting evidence of a statistically significant dose response in all other compounds tested.
The MTO bioprobe was used to detect mitochondria potential and function and was measured by mean average spot intensity. An increase in intensity indicates a hyperpotential mitochondria response and a decrease, as shown in the valinomycin response, indicates a hypopotential mitochondria response. The results showed a statistically significant response at the lowest dose of 3.9 μM in cultures treated with rotenone (P value=0.0404), valinomycin (P value=0.0188), diclofenac (P value=0.0158), and ibuprofen (P value=0.0023). There was no statistically significant difference in the full-dose response range with chemical compounds acetylcholine and aspirin.
Cyt c release from the intracristal spaces of mitochondria is associated with activation of caspases and is considered an indicator of mitochondria-induced apoptosis. The cyt c antibody binds with endogenous cyt c, and following cell stress or insult, the cyt c interacts with apoptotic protease activating factor-1 at the beginning of apoptosis, as the mitochondrial electron transport chain is altered cyt c is released. 17 –20 An increase in cyt c intensity by image analysis is evidence of cyt c mitochondria-induced apoptosis. We observed that cyt c antibody labeling of endogenous cyt c in mitochondria is not only useful in determining the degradation of mitochondrial function but it also provides a method for specifically identifying human bound antigens in the HepatoPac coculture system or, in other words, specifically the human hepatocyte islands. cyt c intensities were dramatically shifted in rotenone and valinomycin at the lowest dose tested of 3.9 μM with statistically significant P value of <0.0001 and <0.0003, respectively. Valinomycin cyt c intensity increased at the lowest concentration tested and remained at constantly high levels for all doses. By contrast, rotenone-treated cells showed that cyt c intensity decreased below statistical significance at concentrations >62 μM. This decrease was due to a decrease of the cytoplasmic area from cell shrinkage at high concentrations of compound, thus limiting the ability to properly measure cyt c with this standard image analysis algorithm. To overcome this biological process of cell shrinkage due to compound toxicity using automated image analysis, measurement of the cytoplasm and nuclear areas as well as the ratio or difference between these two cellular compartments was performed. Interestingly though, we found that ratiometric image analysis approach was not optimal for all compound treatments, such as rotenone dose response, where changes in non-mitochondria compartments (nucleus) did not reflect biological observations in the images (data not shown). However, the difference of intensities between the nucleus and cytoplasm was observed in cases of serve toxicity where cell rapidly shrinks, such as valinomycin, whereas the ring spot intensity feature was not reflective of the biological observations in the images. Figure 10B captures the separation at the two highest concentrations of valinomycin in the cell-level data that is representative of the ring spot intensity measurement feature that failed to properly reflect biological changes at the highest concentration.
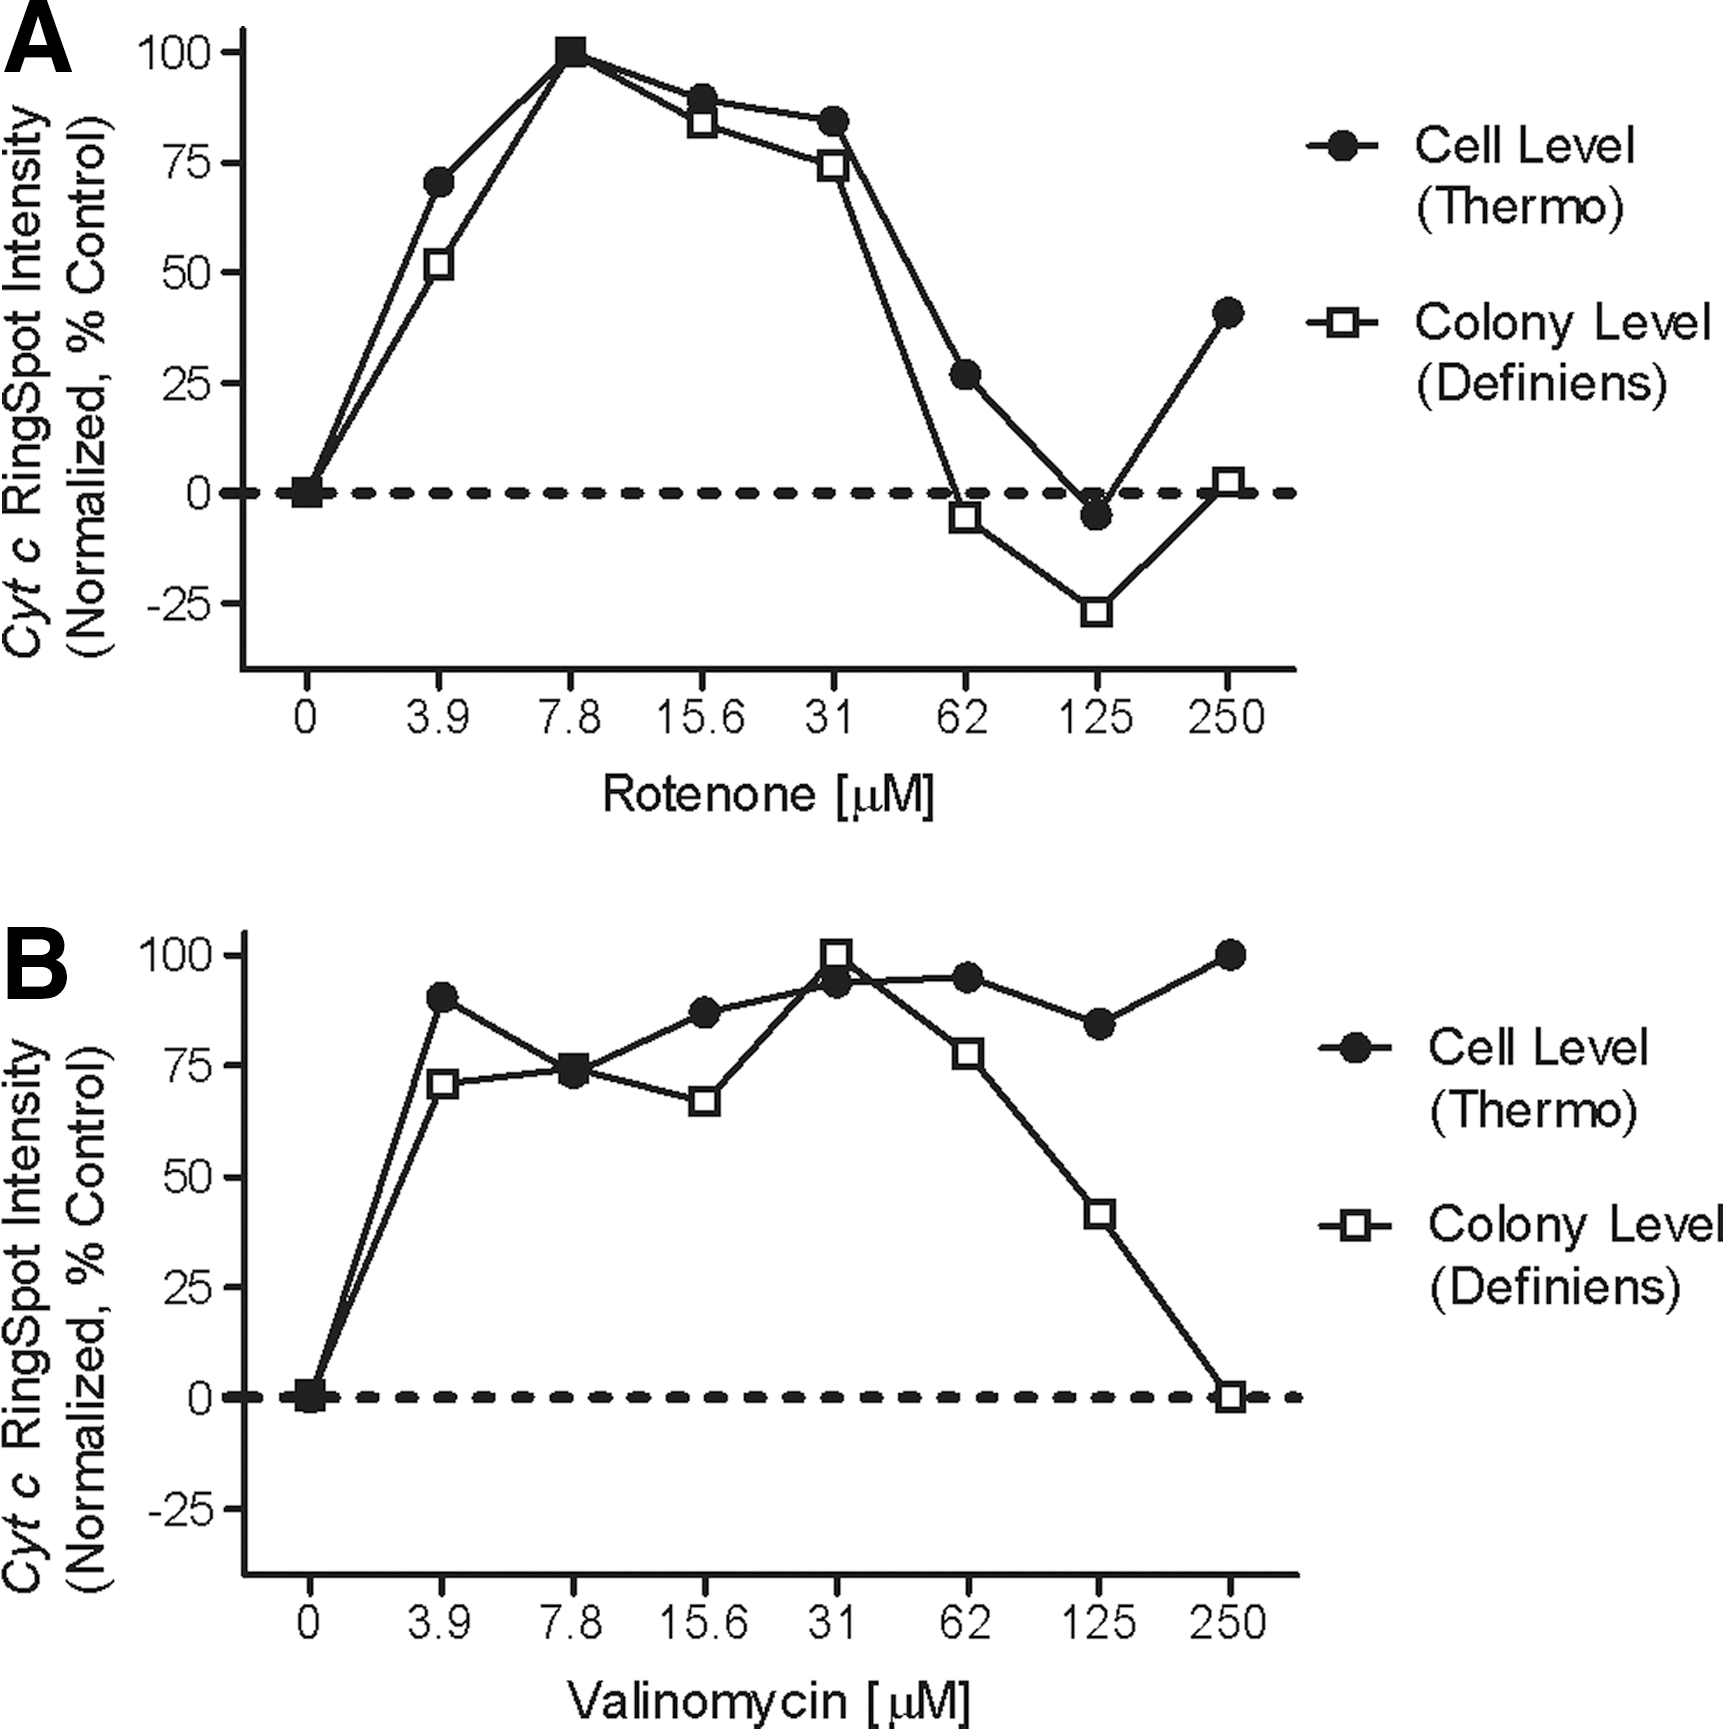
Correlation of cyt c detection normalized as percent control at the single-cell level versus island level of identified ROI. Pearson correlation for eight XY pairs across the dose response showed a two-tailed P value of 0.0002 and R 2 value of 0.9206 indicating high significance.
All other compounds did not exhibit any statistically significant differences in cyt c intensity for the dose response (Supplementary Fig. S2). In addition, principle component analysis statistics were applied with JMP software (SAS JMP v10.0.1, Cary, NC) to measure and visualize multivariate relationships from 56 HCS classified features generated at the single-cell level using the Compartmental Analysis algorithm to compare and contrast differences in vehicle control with 62.5 μM acetylcholine, 62.5 μM rotenone, and 62.5 μM valinomycin. While not all 56 classified features were necessary to determine biological responses using functional endpoint measurements, these HCS classifiers demonstrate the uniqueness of the compound effects in this micropatterned coculture platform (Supplementary Fig. S3).
Subpopulation-Cell-Level Statistics
Defined Hoechst 33342–labeled cells were gated at a threshold above the background staining of cyt c intensity in vehicle control wells to discriminate and identify cells expressing only the human-specific cyt c antibody marker. A mean average of 50.9%±1.1% of the total cell count from the images was positive for cyt c, suggesting that the gated cell population was human hepatocytes and not mouse fibroblasts. In the dose response measurements for three of the reference compounds, we found that the average number of cyt c-positive cells (hepatocytes) in acetylcholine was unaltered, while rotenone showed a significant decrease in the hepatocyte subpopulation that expresses cyt c at 125 μM (P value=0.0073), indicating that the hepatocytes, not the mouse fibroblasts, were more sensitive to rotenone. At 250 μM, valinomycin showed a significant increase in the hepatocyte subpopulation (P value=0.0393) that expresses cyt c, suggesting that the mouse fibroblasts, not hepatocytes, were more sensitive to compound treatment (Fig. 11). Interestingly, when measuring subpopulations of cells for membrane integrity using the YoYo-1 bioprobe, we found that >15% of the hepatocytes treated with 3.9 μM or higher of either rotenone or valinomycin were considered “dead” while the murine fibroblasts appeared to be more resistant until concentrations reached >31 μM of rotenone or 62 μM of valinomycin (Fig. 12).

Subpopulation of identified hepatocytes in coculture from reference compound dose response. X-axis is the compound dose response expressed in micromolar. Y-axis is the percent of identifiable hepatocytes based on cyt c humanized antibody marker above a defined background threshold; error bar is SD.
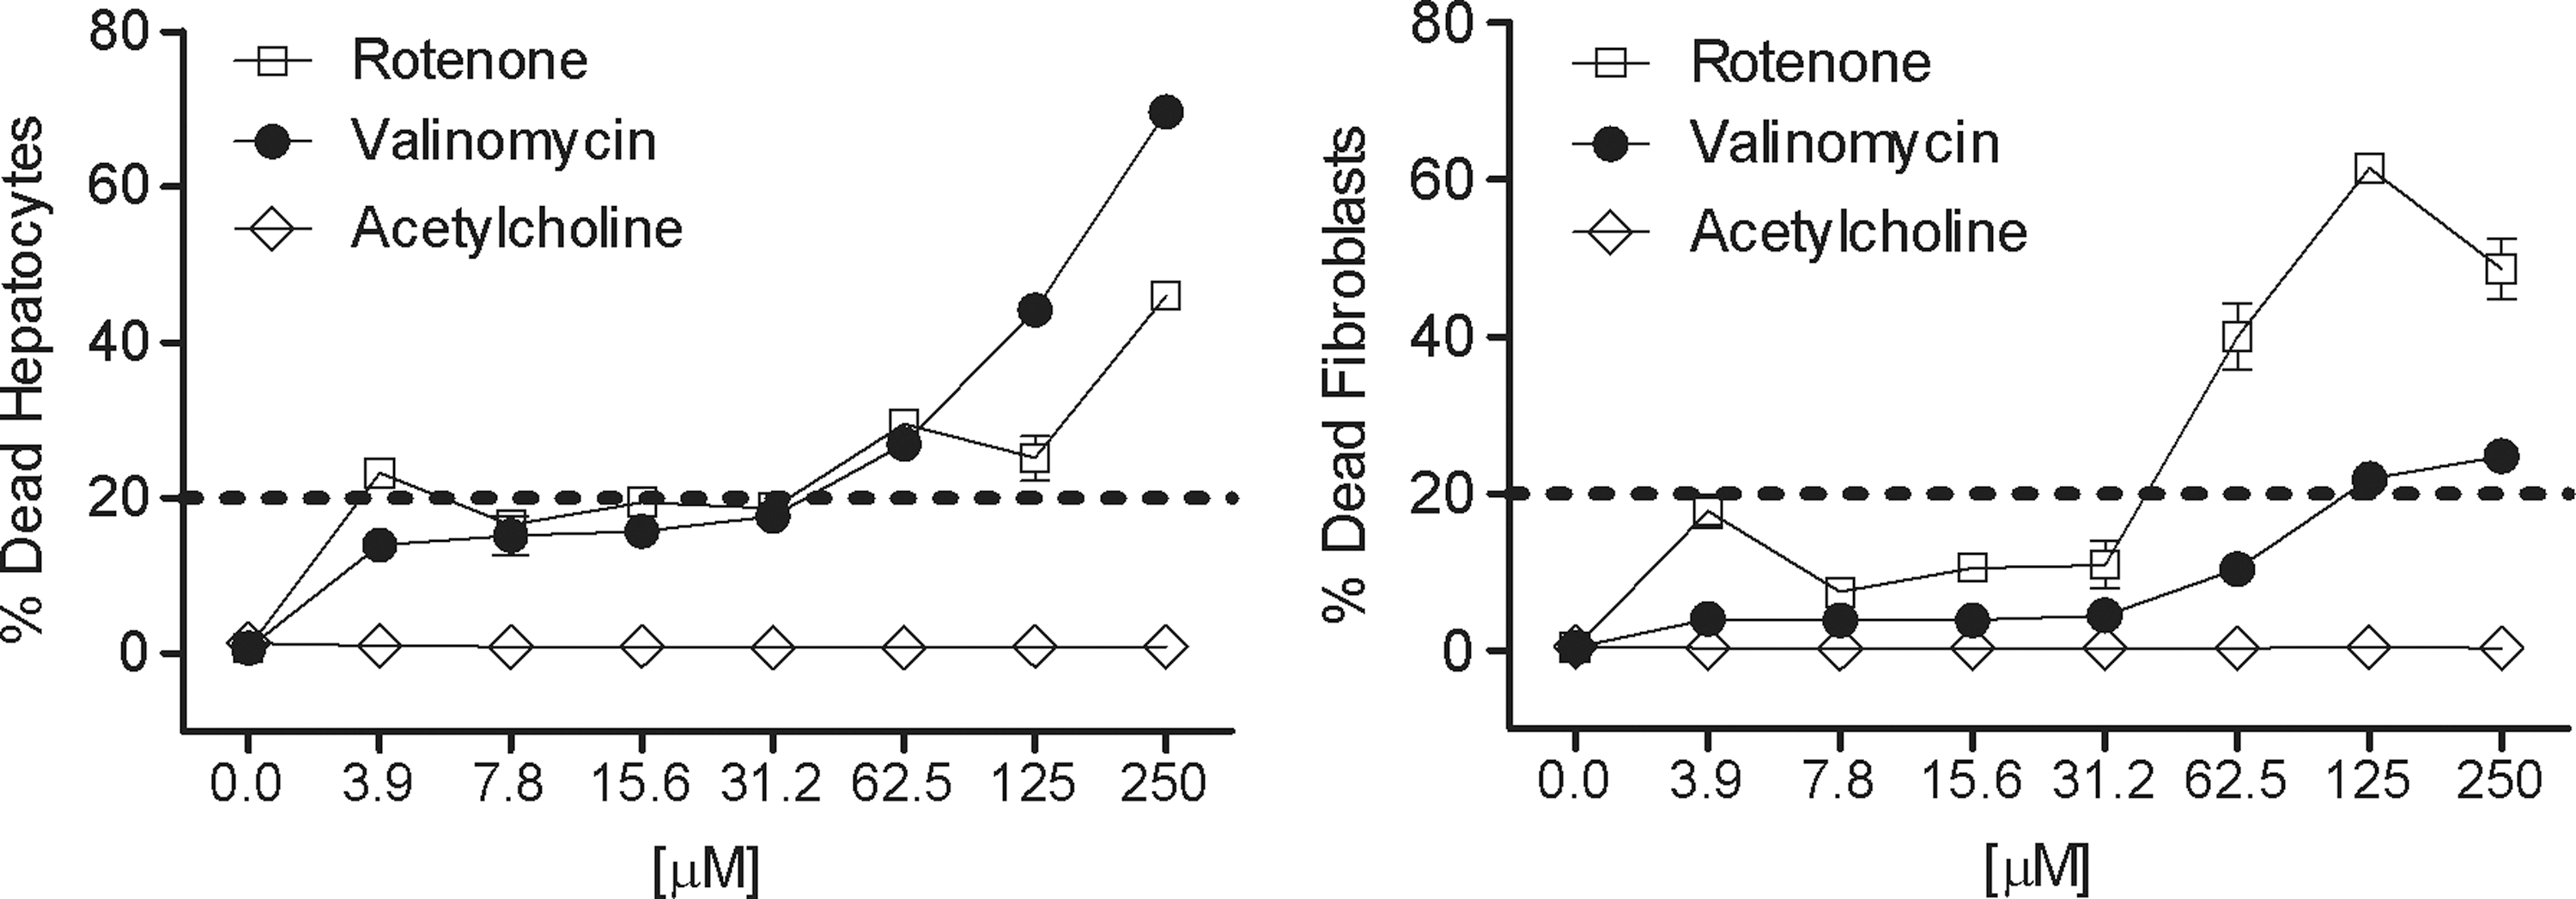
Subpopulation of dead cells in the hepatocyte cyt c gate from three reference compounds. X-axis is the compound dose response expressed in micromolar. Y-axis is the percent of positive hepatocytes above a defined background threshold (n=2 wells,±SD).
These observations are further supported by measuring the variability of intensity of the Hoechst 33342–labeled nuclei in each subpopulation. As the cells begin to die, the texture of the nucleus also changes as the chromatin is reorganized. This resulted in variable Hoechst 33342 staining across the cell nuclei (Fig. 13). 21,22 We found no significant changes in the acetylcholine-treated cells. Valinomycin showed differential sensitivity of hepatocytes in a dose-dependent fashion compared with the fibroblasts. In the rotenone-treated wells, the percentage of nuclei variability for both the hepatocytes and fibroblasts tracked well together with the exception of 125 μM, which showed a statistically significant difference (P value of 0.0495) of 8.8%±2.09% hepatocytes and 20.7%±3.2% SD fibroblasts.

Subpopulation of hepatocytes and fibroblasts nuclear texture feature measurement of acetylcholine
Island and Single-Cell Population Statistics Comparison
To decrease image-processing demands, we performed correlation statistics for each of the endpoint measurements using the ROI islands instead of summarizing single-cell population statistics. The rotenone dose–response curve was used for this analysis. Normalized cyt c intensity (with the highest value equal to 100% using GraphPad Prism) showed a significant correlation value of 0.0002 two-tailed P value and a Pearson r value of 0.9595 across the eight-point dose–response curve. A comparable three-parametric EC50 value was calculated of 131 and 137 μM for island and cell population, respectively (Fig. 10). Normalized mean average YoYo-1 intensity comparison of island and cell-level population statistics was significant with two-tailed P value of 0.004 and Pearson r of 0.8789. However, the ROI islands and cell-level population statistic correlations for the average normalized intensity of MTO and Hoechst 33342 were not significant. Valinomycin, with a defined six-point dose response from 0 to 62.5 μM, showed a good correlation of normalized cyt c mean average intensity between island- and cell-level population statistics with a two-tailed P value of 0.0045 and Pearson r of 0.9448. When the normalized values of the two highest concentrations of valinomycin (125 and 250 μM) were included, the data did not correlate because the cell-level population values significantly decreased. These comparison results suggest that “ROI islands” and “single-cell population” do not correlate. Therefore, it is recommended to perform either single-cell measurements within a defined ROI or with hepatocyte-specific bioprobe markers and gating strategies.
Number of Image Fields and Variability
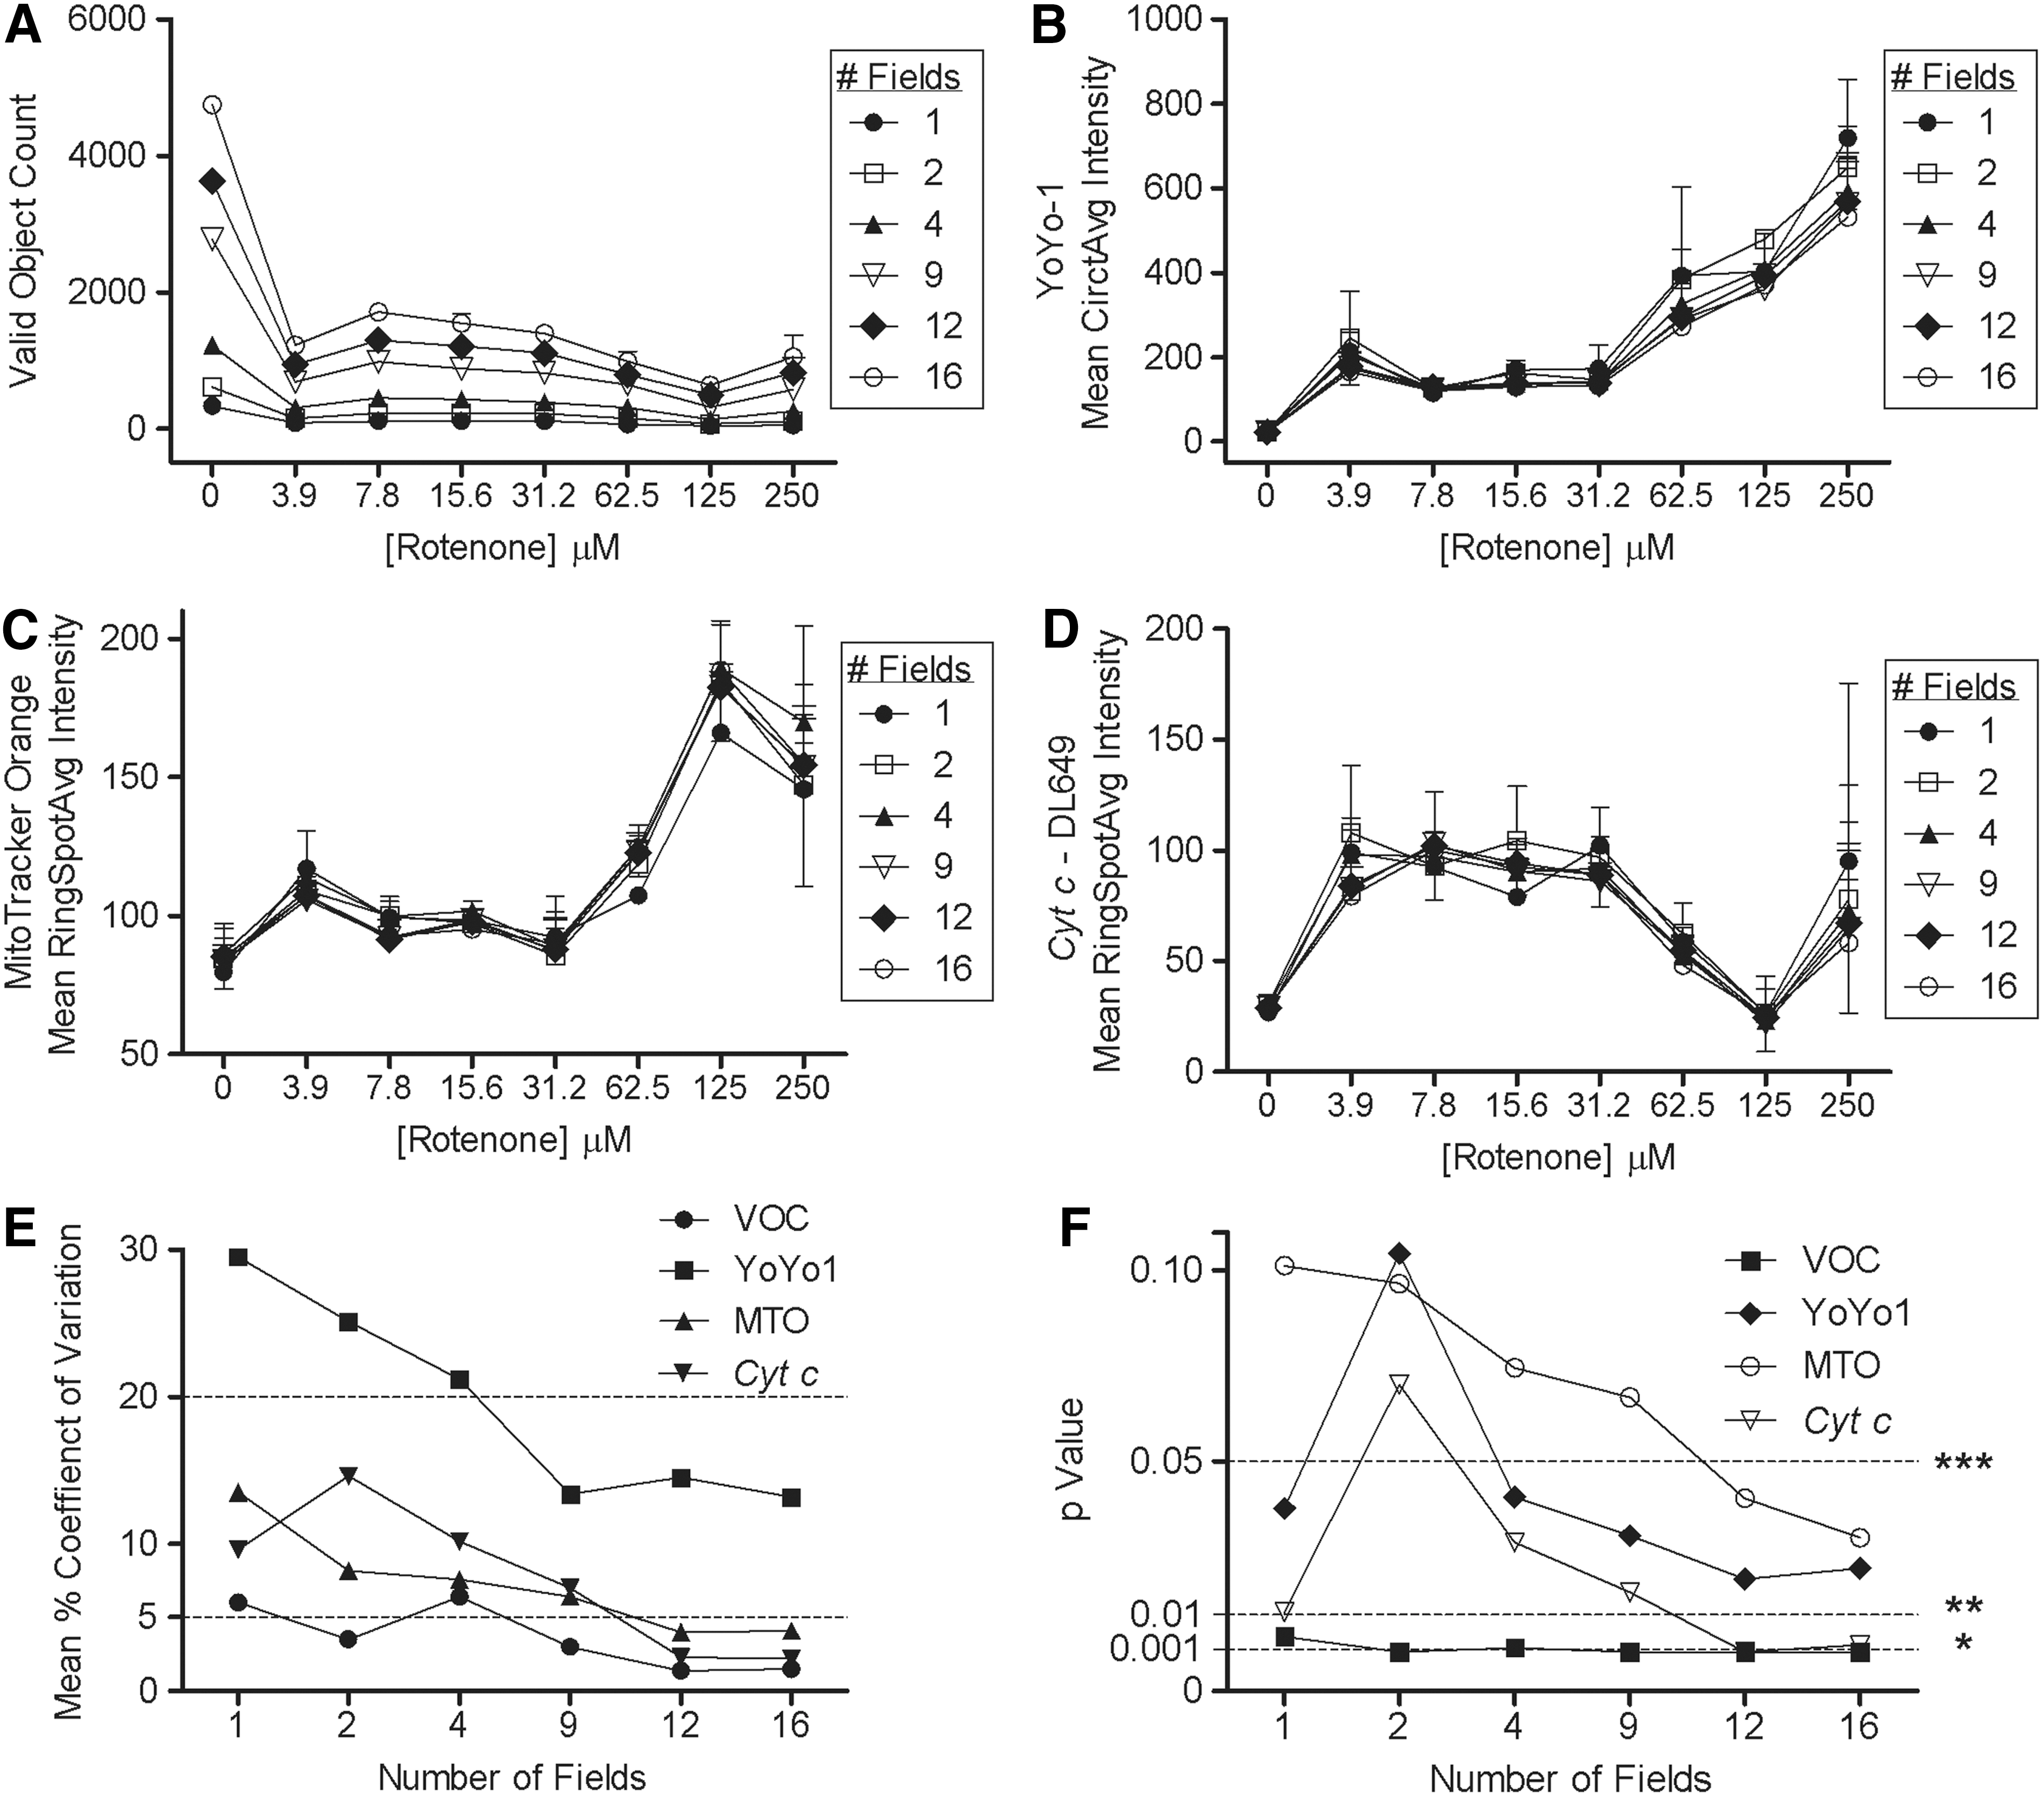
The Cellomics ArrayScan VTI reader collects image fields in a serpentine non-montage manner and the number of hepatocyte islands captured in any given image field is variable. To assess the overall variability it was important to determine the variability of each classified feature. To do this we performed a retrospective image analysis assessment of the reference control compound rotenone by measuring the CV of the replicate means (n=2 wells) in 1, 2, 4, 9, or 16 fields per well. As expected, there are an increasing number of identified cellular objects with increasing number of fields interrogated with CVs ranging from 0.1% to 1.4% in vehicle control wells and from 0.8% to 21.2% in treated wells. CVs of <9.9% and 8.9% were calculated in valinomycin and acetylcholine dose–response curves, respectively (Fig. 14A). Rotenone dose–response curve of YoYo-1 bioprobe mean circ average intensity across all fields was very tight with no observable changes. Measuring intensity of the bioprobe markers, such as MTO (Mean RingSpotAvg Intensity), that label both hepatocytes and fibroblasts revealed differences in IC50 curves, resulting in three-parametric calculated values of 169, 116, 85, 99, 101, and 90 μM in fields captured 1, 2, 4, 9, 12, and 16, respectively (Fig. 14C). Overall, as expected, as the number of fields analyzed increased the CV of the data decreased. The highest CVs in MTO were observed in the vehicle control wells; 2 fields showed 24.8% CV and 16 fields showed <5% CV. In the analysis of data for the hepatocyte-specific marker cyt c, the CVs fluctuated with the highest CV in the lowest number of fields collected. For example, 15.6 μM of rotenone revealed >20% CV in 1 or 2 fields captured, but this was significantly reduced to 0.3% and 1.9% in 12 and 16 fields captured per well (Fig. 14D). Likewise, using the Student's t-test, P value statistical power increased with statistically significant P value <0.05 when analyzing 12 or more fields per well for all bioprobe markers. Each bioprobe indicated an optimal P value calculated that corresponds to the CV calculation and number of fields. The valid object count data were statistically significant for all fields, whereas YoYo-1 and cyt c required at least four fields for statistical significance. MTO feature showed increased CVs that was reflected in the Student's t-test P value calculation that required more than nine fields to become statistically significant (Fig. 14F).
Conclusions
There continues to be an emerging trend in in vitro cell–based screening strategies to recapitulate in vivo biological response. More sophisticated in vitro cell models, such as the HepatoPac model described here, can be used to predict toxicity and provide a means of addressing questions about cell- and sub-population analysis in concert with HCS technology. HepatoPac offers several unique features, such as increased culture longevity, stable phenotypic architecture, and reduced well-to-well variability without cumbersome manipulation of the extracellular matrix environment. The coculture model appears to be amendable for higher throughput applications such as HCS imaging and offers an alternative approach when working with primary hepatocytes. However, use of the system to address specific biological questions will require proper validation and development of appropriate algorithms to measure the hepatocyte and fibroblast subpopulations within the HepatoPac coculture model.
In considering the landscape of HCS imaging platforms, the HepatoPac model initially posed a modest challenge for most commercial HCS imagers to fully detect entire discrete islands of hepatocytes within each well of a microtiter plate. However, detection of a complete intact island may not be necessary if the proper image acquisition and image analysis strategy is applied. 23,24 This of course is directly dependent on several factors, including (1) the specification of the microscope lens; (2) the array size of the detection device, that is, CCD, sCMOS, or PMT; (3) collection of images for montage display and analysis; (4) software to stitch or montage the images; and (5) software to analyze large image formats including subpopulation analysis. When using low-resolution microscopy, such as wide-field imaging with a 10× or lower objective lens, it is less challenging to capture a complete intact island than when using objective lenses higher than 20× where the collection requirements to stitch or montage the images together for identification and measurement of the island are more difficult. One of the most common detector sensors that is installed on many existing commercial HCS imagers 25 is the Sony 285i monochrome CCD chip with an XY pixel resolution of 1,392×1,024. This unique image frame capture size of 10× or higher objective lens is unable to detect a random discrete island unless a predefined position is designated. Because the hepatocyte micropatterning location variance from well to well is very close, it is feasible to program an HCS imager with a more precise starting location, although there can be plate-to-plate variability due to processing of plates and precision of stage and plate handling devices. Even with today's evolving HCS instrument landscape, the larger scientific camera format resolution of ∼2,048×2,048 is not large enough for single-frame image capture with a 10× objective lens and requires the need to montage several fields to create an image containing at least one complete island of hepatocytes (Supplementary Fig. S4). Montage imaging array of at least 2×2 provides enough of a captured image area within the well for at least one island to be detected; however, statistically speaking, having several complete islands is theoretically better but perhaps not necessary. In a 4×4 montage array with the large camera format, approximately seven complete islands and five partial islands were captured as these were considered not intact due to overlap with the frame wall of the image. Without image montaging on the fly, an alternative straightforward strategy is to capture all objects in the field or frame. In this scenario random nonadjacent image fields are captured in a non-biased manner. Following image capture, these images can be subjected to a series of gating techniques to specifically measure only cells of interest, for example, human hepatocyte islands. In our experimental study design we used a human-specific antibody against cyt c; therefore, only the human hepatocytes were quantified and not the murine fibroblasts. Alternatively, since transmission light image of the hepatocyte island is visible, it can be considered a useful strategy to identify the majority of hepatocytes if the appropriate image-contrasting algorithm is used to distinguish from surrounding cells. However, the challenges of this approach are twofold: (1) the bright-field transmission light image contrast above background may not be consistent across all fields or wells on a plate to accurately identify all hepatocyte islands with current imagers and image analysis processing; (2) infiltrating fibroblasts may be part of this ROI and, without a specific human hepatocyte fluorescent marker, it is difficult to discriminate only hepatocytes in the island. The approach of utilizing a subpopulation detection strategy with cyt c marker is similar to the principles applied in flow cytometry applications to selectively include a population of interest (hepatocytes) or remove a population of cells (fibroblasts) from the endpoint measurements. We have demonstrated that this methodology can work to interrogate the mechanisms of action involved in primary human hepatocyte toxicity. However, in principle, other more prominent phenotypic markers of hepatocytes, such as albumin, may be a better choice for validation and perhaps be necessary when human-specific antibodies for shared antigens are not available or in cases where mouse or rat hepatocytes are used in coculture with the murine fibroblasts. Compatibility issues may also arise in an event where antibody probe binding or signal is altered by chemical conditions in the well creating false-positive or false-negative measurements in the subpopulation analysis. 26 –28
Quantitative measurements at the single-cell level can be achieved using software algorithms from many commercial HCS companies, such as those from Definiens and Thermo Scientific, but can also include open-source products such as Cell Profiler. 29 The critical requirement for computer-assisted image analysis is directly dependent on accurately measuring size, shape, and intensity to determine the status of biological function at the single-cell level with indicators measuring nuclei labeled with Hoechst 33342, cell membrane permeability using DNA exclusion dye YoYo-1, mitochondria function using MTO, and cyt c release as an indicator of mitochondria-induced apoptosis. 30,31 Because these measurements were carried out on all cellular objects labeled with fluorescent indicators in the image field, including mouse fibroblasts and human hepatocytes, it was important to capture enough cellular objects for statistical significance to apply subpopulation gating strategies to determine the outcome that could otherwise negate the “true” biology responses at the single-cell level. 32,33 If the ROI is used to identify and measure the hepatocyte response, then it is important to note that, as evidenced by a 3D reconstruction image of the island, the ROI likely contains fibroblasts as well as hepatocytes. This further supports the need to perform subpopulation analysis measurements of gated cellular objects at the single-cell level.
In this initial assessment we have observed that primary human hepatocyte islands after 12 days in culture exhibit stable histotypic architecture and are very healthy with >98% viable cells in vehicle control conditions. The reproducible stability in cell integrity and health along with single-cell subpopulation measurements represents an exciting new approach to examine the “true” in vitro biological variability in cell response within the hepatocyte population as opposed to an “average” experimental or assay response that has otherwise been a challenge in other primary hepatocyte models. Further validation is needed to fully optimize the HCS conditions for screening of chemical compounds, including an analysis of the mouse fibroblast cells without the presence of hepatocytes to verify that the subpopulation gating strategy is correct using cyt c or other bioprobe indicators. Expanding the methods and algorithms to include additional batches of primary human hepatocytes is necessary to determine liver donor variability. The model itself can also be used to look at the heterogeneity of hepatocyte populations from different zones of the liver (periportal vs. pericentral) and further expanded by adding other non-parenchymal cells, such as Kupffer cells, provided there are appropriate biomarkers to identify subpopulations for single-cell quantification. Overall, the HepatoPac micropatterned coculture platform represents a promising new approach for HCS strategies using primary human hepatocytes for hepatotoxicity testing of new drugs and chemicals.
Footnotes
Acknowledgment
Funding for this project was provided by the Long-Range Research Initiative (LRI) of the American Chemistry Council (ACC).
Disclosure Statement
No competing financial interests exist.