
Abstract
Epigenetic regulation has been implicated in diverse diseases including cancer, diabetes, and inflammation, and high-throughput screening for histone methyltransferase (HMT) inhibitors is an area of intense drug discovery effort. HMTs catalyze the transfer of methyl group from S-adenosylmethionine (SAM) to lysine or arginine on histone tails forming the methylated products and S-adenosylhomocysteine (SAH). HMTs are challenging to incorporate into biochemical assays for a number of reasons. They have slow turnovers and low Km values for SAM, which leads to low levels of product formation, and thus requires very sensitive detection methods and/or high levels of enzyme. They also have diverse acceptor substrate requirements, ranging from peptides to intact nucleosomes. Additionally, some HMTs function as complexes of three or more proteins. Developing assays for individual HMTs, including sourcing and acquiring high quality enzymes and acceptor substrates, therefore can be laborious and expensive. We recently developed the Transcreener® EPIGEN Methyltransferase assay, a sensitive SAH detection method with a fluorescence polarization readout, to enable universal HMT detection independent of acceptor substrate. To facilitate screening and profiling of HMTs, we describe the development of turnkey assay systems for thirteen HMTs including identification of optimal acceptor substrates and their concentrations, optimization of detection reagents, determination of initial velocity enzyme concentrations, and measurement of inhibitor potencies.
Introduction
Histone methyltransferases (HMTs) play a central role in epigenetic regulation of transcription via covalent modification of histones, and these have recently come under intense focus as potential drug targets. Two major classes of HMTs have been identified: protein lysine methyltransferases that catalyze methylation of the ɛ-amino groups of lysine residues and protein arginine methyltransferases that methylate the Nη nitrogen atoms of the guanidine side chains of arginine. The reactions involve direct transfer of methyl group from S-adenosylmethionine (SAM) to the nitrogen atom of the acceptor protein suggesting that the enzyme simultaneously binds to both SAM and the acceptor protein. 1 The by-product of this reaction therefore generates a universal product S-adenosylhomocysteine (SAH) and the methylated protein/peptide.
HMTs play critical roles in normal development and susceptibility to diverse diseases including diabetes, cardiovascular diseases, cancers, and inflammatory diseases. 1 –4 They have been most intensively studied and linked to specific disease mechanisms in cancer, including cancers of the breast, prostate, and colon in addition to leukemia and myelomas. 4 Genetic alteration of HMTs, including overexpression, gene amplification, chromosomal translocations, and point mutations are increasingly being linked to tumorigenesis. 5 Similar to the situation with kinase tumorigenesis drivers such as Abl or EGFR, some mutant HMTs have a gain of function or change of function that is causative in the tumorigenic phenotype. 6 –9 Highly selective HMT inhibitors have been identified 5 and at least two drug candidates, for HMT DOT1L in MLL-rearranged leukemia 7 and HMT EZH2 in non-Hodgkin lymphoma, 10 have entered clinical trials.
Developing sensitive, nonradioactive enzymatic assays for HMTs has been challenging and even with an assay in hand, assay development for individual HMTs can be laborious and expensive. They are generally very slow enzymes, with turnovers in the range of less than 1 min−1 in many cases and they tend to have low Km values for SAM, many in the sub-micromolar range. 11 These properties impose very high sensitivity requirements on assay methods, necessitating detection of nanomolar levels of product under typical screening conditions (initial velocity conditions using Km concentrations of SAM.) Without sufficient sensitivity, high HMT concentrations are required to generate a detectable signal, which can lead to inaccurate potency measurements if enzyme concentrations exceed inhibitor IC50 values. 12 Though longer incubation times would theoretically allow increased product formation, in practice most HMT reactions begin to slow after 3–4 h, most likely from enzyme instability. Moreover, many HMTs function as complexes, with as many five proteins required for full activity, which results in high enzyme production costs—another driver for more sensitive detection methods. Diverse substrate requirements add another layer of complexity, with some enzymes able to use peptide acceptors, whereas others require full-length histones or even intact nucleosomes, which are difficult to produce and are prone to batch to batch variability.
HMT enzyme activity is generally measured by detecting the methylated products or SAH. Detection of methylated products is complicated, because HMTs can add up to two methyl groups at arginines and up to three at lysines, resulting in a total of six possible methylation states. The products can be quantified nonselectively using radioassays (with 3H-SAM as donor) or separated and quantified using LC/MS. However, radioassays are avoided in many high-throughput screening (HTS) laboratories because of the disposal costs and LC/MS requires expensive equipment that is not available to some laboratories; therefore, immunodetection is more widely used. The diversity of methylated reaction products combined with variability in surrounding amino acids complicates development of immunochemical assay methods, as a single antibody generally does not recognize all of the products formed by a single HMT. Despite these drawbacks, immunoassays for methylated products have been formatted with a number of different HTS-friendly readouts, including ELISA, TR-FRET, and AlphaLISA. 13,14
SAH detection avoids the complexities of detecting diverse methylation products and provides a universal assay method. Direct detection of SAH is a challenging molecular recognition problem as it differs from the substrate SAH by only a single methyl group. Though antibodies capable of discriminating between SAH and SAM have been developed (BellBrook-Labs; unpublished data), 15 they lack the affinity required for a highly sensitive HMT assay. Recently, an SAH immunodetection assay with a TR-FRET readout was introduced by CisBio with a stated lower limit of 200 nM SAM (CisBio BioAssays, Codolet, France). 16 Enzymatic conversion of SAH to a molecule that can be detected directly, that is, enzyme-coupled assays, has been used to circumvent the difficulties in direct SAH detection. 17 –22
We recently developed an SAH assay for HTS, called the Transcreener® EPIGEN Methyltransferase Assay, 23 which relies on conversion of SAH to adenosine monophosphate (AMP) in two enzymatic steps and detection of AMP using the Transcreener AMP2/GMP2 assay, a fluorescence polarization immunoassay (FPIA) (Fig. 1). 24 The Transcreener monoclonal antibody is more than 1,000-fold selective for AMP versus SAM and purine nucleotide triphosphates, including the dGTP used to drive conversion of SAH to AMP. The high selectivity combined with high affinity 24 enables detection of nanomolar levels of AMP in the presence of large excesses of the other nucleotides. The dynamic range of the assay can be calibrated by adjusting the concentration of the AMP antibody, and the lower practical limit for initial velocity measurements (i.e., ≤20% SAM conversion) is between 250 and 500 nM SAM, depending on other assay components; the highest concentration tested was 50 μM. For instance, in standard curves mimicking enzyme reactions, a polarization value of approximately 60 mP was observed for 20% conversion of 500 nM SAM, whereas 20% conversion of 1 μM SAM resulted in a signal of greater than 100 mP. 23 The coupling enzymes are present at fixed concentrations several-fold higher than necessary to rapidly convert SAH to AMP over the dynamic range of the assay.
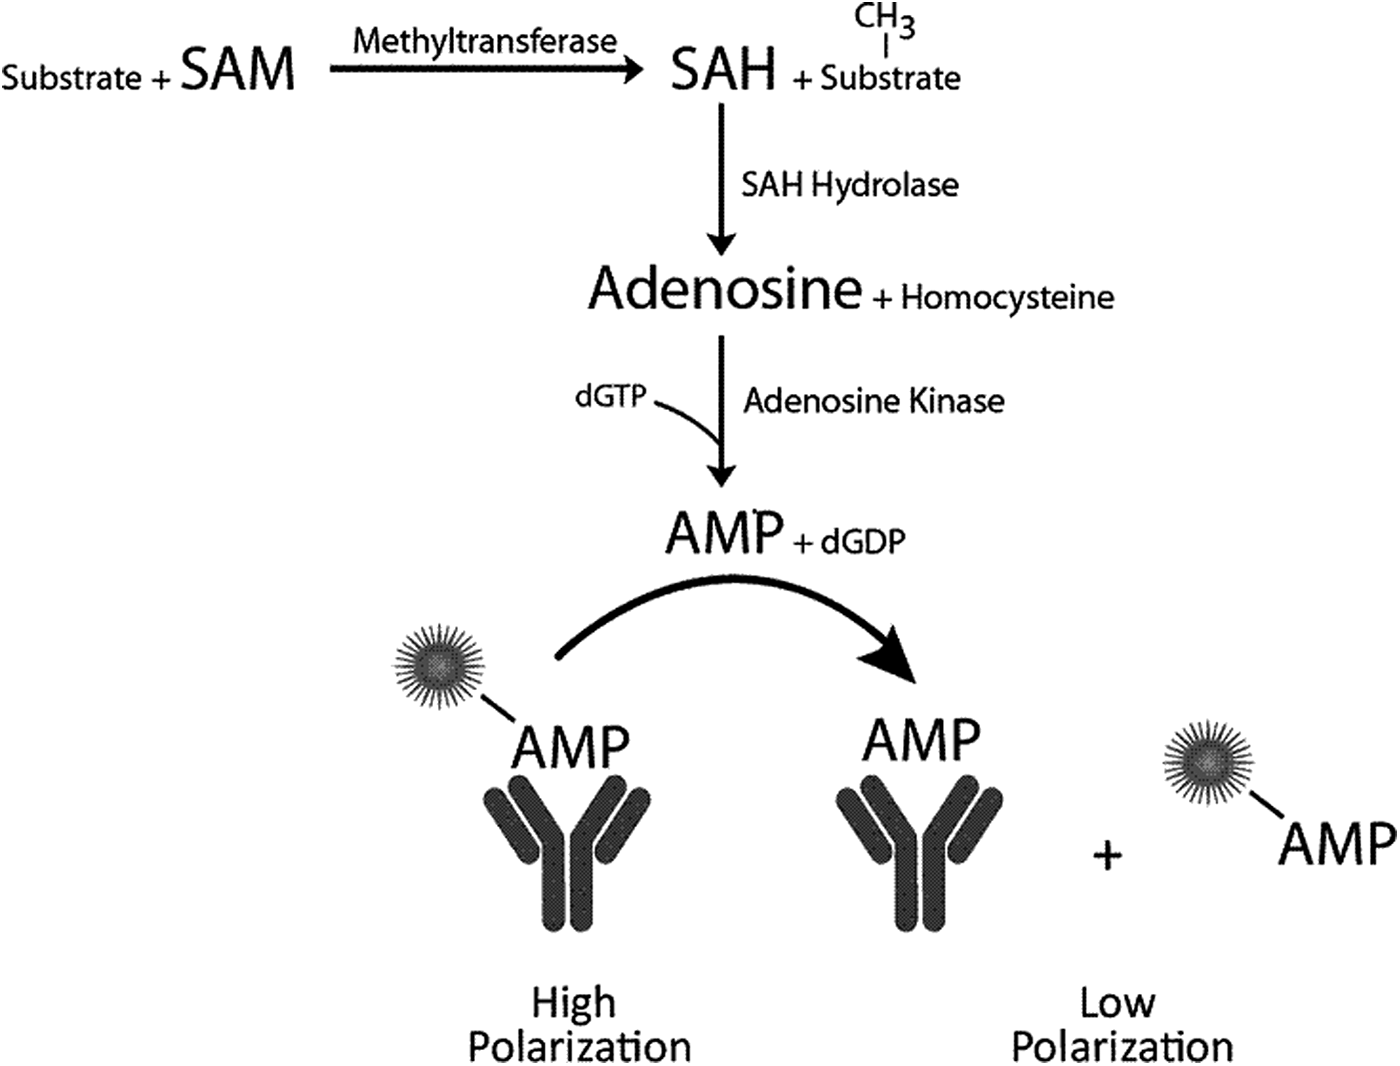
Transcreener Epigen methyltransferase assay principle. SAH produced in a methyltransferase reaction is converted to AMP in two sequential enzymatic steps. AMP is detected using a competitive fluorescence polarization immunoassay. AMP, adenosine monophosphate; SAH, S-adenosylhomocysteine.
The assay was designed for HTS with a homogenous, mix and read format for facile automation and far red, ratiometric readout to minimize interference from fluorescent compounds and light scattering. 25 The suitability of the assay for HTS was reflected in a Z′ value of 0.77 in 384-well plates and in the stability of the reagents and signal at room temperature for at least 8 h. 23 The potential for compound interference with the coupling enzymes is an important consideration for HTS that can be addressed by performing an appropriate counterscreen. For instance, in a pilot screen of 8,800 compounds at 1,536 well density using 1.8 μM SAM, the overall hit rate was 0.41%, which was in the range expected for a robust assay that is not overly affected by artifacts. 23 A counterscreen using mock reactions lacking methyltransferase revealed that half of the hits had effects on the detection system, which is not an unusually high interference rate for an HTS assay.
Regardless of the assay method being used, the complexity and high cost of enzyme and substrates make HMT assay development time consuming and expensive. In this article, we describe the development of turnkey assay systems for thirteen HMTs, including identification of optimal acceptor substrates and their concentrations, determination of initial velocity enzyme concentrations, and optimization of EPIGEN detection reagents. These studies should provide useful information for activity based HMT screening or profiling efforts and advance general understanding of the requirements for reconstituting functional HMT enzyme systems in vitro.
Materials and Methods
Enzymes
All HMT enzymes were purified preparations obtained from Reaction Biology Corp. (Malvern, PA). The HMT enzymes were expressed in Escherichia coli except the EZH2 complex proteins, which were co-expressed in an insect cell/baculovirus system. HMT protein constructs, cDNA accession numbers, and accessory proteins used are listed in Table 1.
HMT Protein Constructs and Accessory Proteins Used in This Study, Including N- or C-Terminal Affinity Tags
Substrates and Reagents
Hela oligonucleosomes (three or more repeating units), HeLa mono/dinucleosomes, full-length human untagged recombinant histone H3, histone H2A, and GST-GAR proteins were obtained from Reaction Biology Corp. Native HeLa and HEK293 nucleosomes and recombinant human nucleosomes (from E. coli) were obtained from BPS biosciences (San Diego, CA). Core chicken histones were obtained from Millipore. Histone H3 (1-25) peptide (ARTKQTARKSTGGKAPRKQLATKAA-NH2), H4 (1-20) (SGRGKGGKGLGKGGAKRHRK-NH2), H4 (15-24) (AKRHRKVLRD-NH2), and trimethylated (Lys(Me3)27) H3 (21-44) (ATKAARK(Me3)SAPATGGVKKPHRTRPGGK) were obtained from Anaspec. HMT inhibitors UNC0638, BIX01294, UNC1999, and GSK343 were obtained from the Structural Genomics Consortium (Toronto).
The Transcreener Epigen Methyltransferase Assay, 23 which contains 5 mM SAM, 500 μM SAH, Transcreener AMP2/GMP2 antibody, 10x MT Detection Mix (20 μg/mL Coupling Enzyme 1, 10 μg/mL Coupling Enzyme 2, 2.5 mM Cofactor, 40 nM AMP2/GMP2 AlexaFluor® 633 Tracer 0.8% Brij-35 in 800 mM HEPES pH 7.5), and Stop Buffer A, was obtained from BellBrook Labs (Madison, WI).
Methyltransferase Assays
All experiments were performed in black Corning 384 Well Round Bottom Low Volume Polystyrene Non-Binding Surface Microplates (Part # 3676). Mixing after additions was performed by orbital shaking for 1 min. Unless otherwise noted, reactions were equilibrated for 1 h at room temperature before reading the plate on the instrument.
Antibody/tracer binding experiments. The Transcreener AMP2/GMP2 antibody was titrated in a mixture containing 4 nM tracer, 2 μM SAM, 1X HMT buffer and acceptor substrates as indicated in the legend to Figure 2. Binding reactions were allowed to equilibrate for at least 1 h and polarization values were read.
Identification of optimal acceptor substrates.
HMT enzyme reactions. Enzymes were incubated at 30°C in HMT buffer (50 mM Tris-HCl pH 8.5, 5 mM MgCl2, 0.01% Triton X-100, and 100 mM NaCl), 2 μM SAM, and 3 mM DTT and acceptor substrates as indicated in Table 2. Enzyme reactions were started with the addition of SAM in 7.5 μL; the final enzyme reaction volume was 15 μL. Control reactions lacking enzyme were used as blanks for calculation of ΔmP values. In addition, control reactions lacking SAM and acceptor substrate were performed at least once for each HMT to insure that nonspecific SAH was not significantly contributing to the assay signal.
Protocol Using Optimized HMT Assay Conditions for Inhibitor Dose–Response Curves as Shown in Table 3
1. Add 7.5 μL of 1×HMT Enzyme Buffer to wells A-F (2-16) and 1×HMT to 384 well LV Corning 4514 plate. Add 7.5 μL of test compound in 1×HMT buffer at 10 μM to wells A1, B1, C1, D1, E1, and F1. Perform a serial titration by transferring 7.5 μL from column 1 to column 2, mix well and transfer 7.5 μL from column 2 to 3 and so on, until column 15. Column 16 will be the control lacking inhibitor. All wells should have a final volume of 7.5 μL.
2. Add 3×HMT (from Table 3) to wells A-F (1-16). All wells should now have 12.5 μL.
3. Gently mix, cover the plate, and incubate at RT.
4. Add 2.5 μL of 6×Substrate (from Table 3) to wells A1-B16. Include controls lacking SAM in wells C1-D16 and controls lacking peptide in wells E1-F16. All wells should now have 15 μL reactions. Mix plate well and place at 30°C immediately for 2 h.
5. Cover the plate to avoid evaporation.
6. Add 2.5 μL undiluted Stop Buffer A and mix.
7. Add 2.5 μL of 8×Detection mix (final [antibody] shown in Table 3) and mix plate well.
8. Cover plate to avoid evaporation for 1.5 to 6 h at RT.
9. Read the plate in a plate reader equipped with fluorescent polarization filters at EXC/EMS 630/670 nm.
Transcreener Epigen Methyltransferase Assays were performed as either end point or kinetic reactions. For end point reactions, 2.5 μL of Stop Buffer A (800 mM MES, 10 mM MgCl2 at pH 6.0) was directly added to the HMT reaction and placed for 1 min on an orbital shaker. Then, 2.5 μL of a mixture containing 8X Transcreener AMP2/GMP2 antibody and 8X MT detection mix was added, and plates were read within 24 h. For kinetic reactions, 5 μL of a mixture containing 4X Transcreener AMP2/GMP2 antibody and 4X MT Detection Mix was added to the enzyme reactions, immediately after SAM addition (Stop Buffer A was not used) and the plates were read periodically. Final concentration of MT Detection Mix components were 2 μg/mL Coupling Enzyme 1, 1 μg/mL Coupling Enzyme 2, 250 μM Cofactor, 4 nM AMP2/GMP2 AlexaFluor 633 Tracer, 80 mM HEPES, and 0.8% Brij-35. Transcreener AMP2/GMP2 antibody was present at concentrations listed in Table 3. Unless indicated otherwise, all reactions were done in duplicates or triplicates; Z′ determinations for EZH2, PRMT3, and G9a were performed with 16 replicates as described. 26
Optimized Assay Conditions for Detection of HMT Initial Velocity with the Transcreener EPIGEN Assay a
a120 min reactions at 30°C.
bnM.
cμg/mL.
dmP.
Standard curves mimicking HMT enzyme reactions were used to determine SAH concentrations from polarization values. Mock reactions mimicking enzymatic conversion (0, 1.0, 2.5, 5.0, 7.5, etc.…… 100%) of SAM to SAH were dispensed into wells in 10 μL of HMT Buffer, followed by the addition of 5 μL of Stop Buffer and 5 μL of Detection Mix as described above. For each standard curve, total [SAM+SAH] remained constant at 0.20, 0.5, 1.0, 5.0, 10, or 50 μM, representing the initial SAM concentrations in MT enzyme reactions and antibody was present at the optimal concentrations for each SAM concentration as determined above. Polarization was measured after 1 h at ambient temperature. The data were plotted as ΔmP vs. % SAM conversion using four-parameter nonlinear regression curve fitting. ΔmP=mPinitial [SAM]–mPsample.
Instrumentation and Analysis
Fluorescence polarization measurements utilizing the AMP-Alexa Fluor 633 tracer were performed on a Tecan Safire2™ (Tecan, Durham, NC) reader using 635 nm excitation (LED) and 670 emission (20 nm bandwidth) settings. The free tracer reference was set to 20 mP, and the buffer (with or without antibody) was used as the buffer blank for both the sample and free tracer reference wells. Data were analyzed and graphed using GraphPad Prism (GraphPad Software, San Diego, CA). ΔmP values are the difference between the polarization values with and without enzymes, unless otherwise indicated. Values in graphs are mean of data from at least two separate experiments±standard errors of replicates. Optimized assay conditions were tested on 3 separate days. EC85 was calculated by using the EC50 and hillslope values, calculated from fitting the equilibrium binding data to a variable slope sigmoidal dose–response curve using the equation: EC85=((85/(100–85))1/hillslope)* EC50. Z′ values were determined from 16 replicates as described. 26
Results
Optimization of Detection Reagents for HMT Enzyme Reaction Components
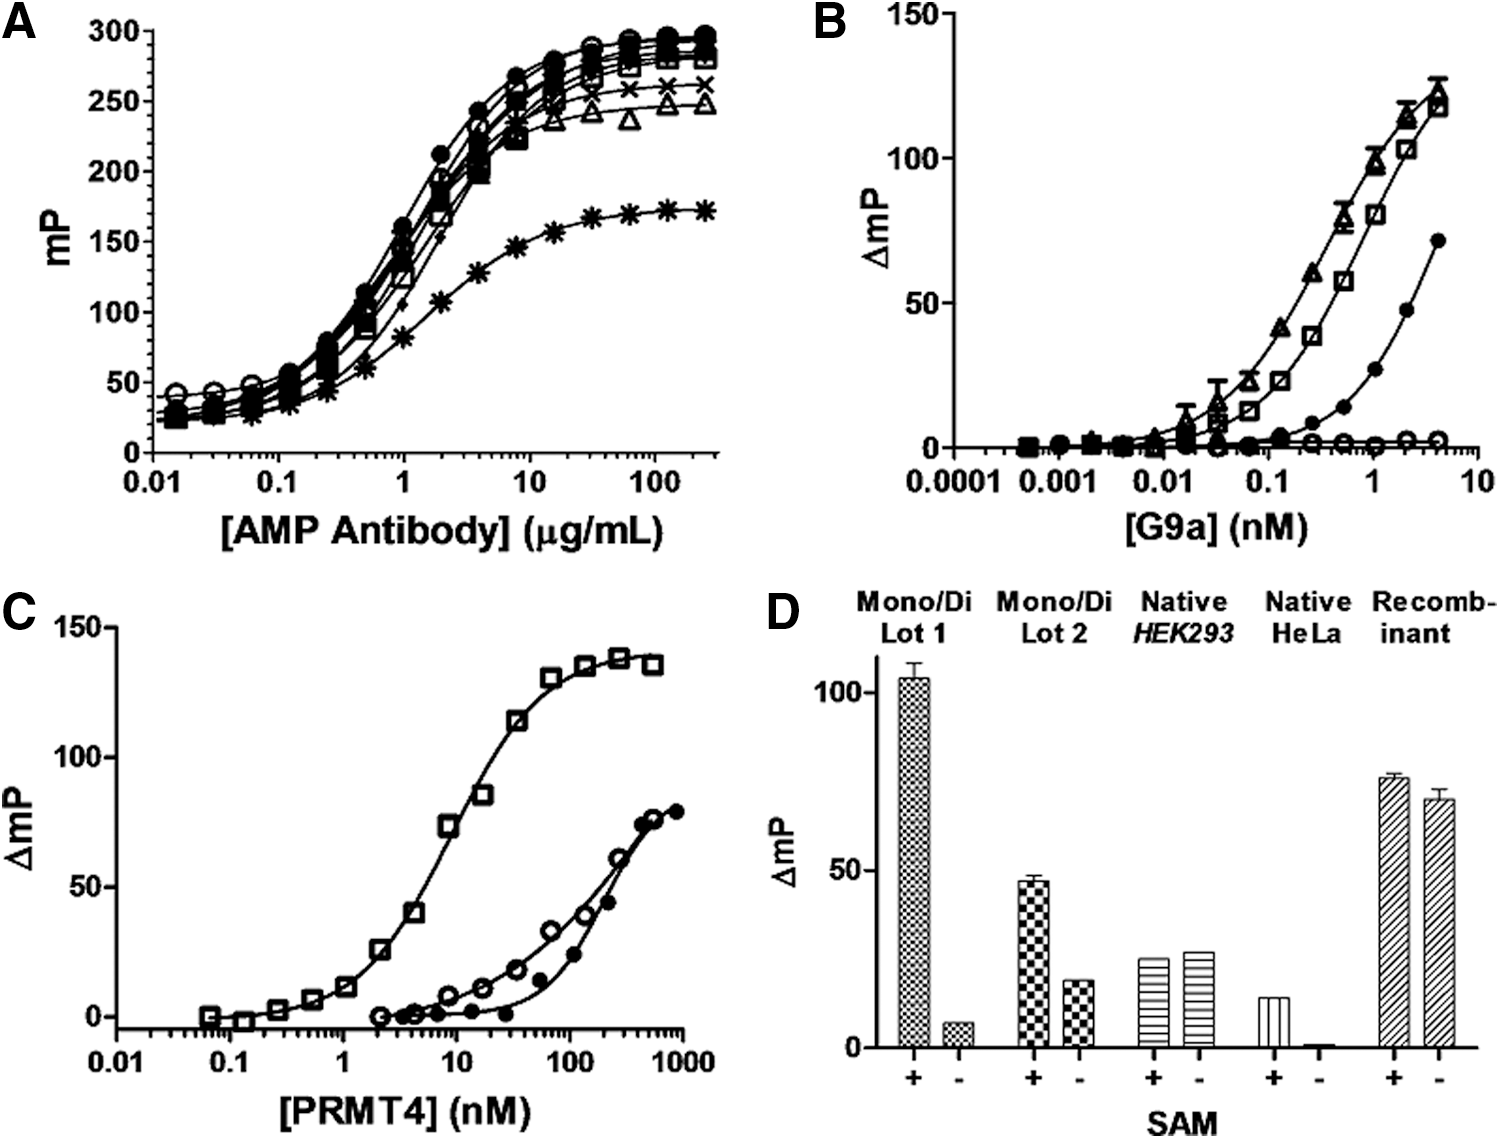
The Transcreener EPIGEN assay relies on a competitive FPIA for AMP, which is formed by enzymatic conversion of SAH (Fig. 1). In this format, the tracer and the coupling enzymes are present at fixed concentrations, and the antibody is varied to adjust the dynamic range of the assay; it is always present in excess over tracer so that the initial polarization is high. As a rule, use of the antibody at a concentration that yields 85% of the maximal polarization shift, the EC85, yields a very good assay window (≥100mP) for initial velocity enzyme detection. 23,24 Using this approach, the assay can be practically used for initial velocity detection in HMT reactions with SAM concentrations from 0.25 to 50 μM. 23 To streamline assay development and data analysis, we fixed the dynamic range by using 2 μM SAM for all of the HMTs in this study. Though the assay is largely insensitive to common enzyme buffers and additives, we calibrated the response in the presence of the various acceptor substrates so that we could maximize the signal window for each. The effects of the substrates on antibody-tracer interaction were relatively minor (Fig. 2A), as reflected in antibody EC85 values of 5–8 mg/mL (Table 3), with the exception of histone H2A, which was not used as a substrate for any of the HMTs in this study. Note all of the antibody titration curves start below 50 mP, indicating that the tracer is not nonspecifically binding to HMT substrates or other reaction components. In the case of HMT MLL4, we increased the antibody concentration to 10 μg/mL because the enzyme itself exhibited some noncatalytic effects on the assay signal.
Identification of Optimal Acceptor Substrates
HMTs have complex and overlapping substrate specificities, which can be affected by the type of histone construct used—from peptides to intact nucleosomes—and by posttranslational modifications adjacent to the methylation site. Guided by previous studies, 27 we tested the substrates shown in Table 3 for each HMT by performing enzyme titrations with substrates at concentrations several fold higher than the 2 μM SAM present. For some HMTs, more than one substrate concentration was tested in an effort to optimize activity (data not shown.) Representative results for HMTs G9a, PRMT4, and DOT1L are shown in Figure 2 and results for all twelve are summarized in Table 3.
HMT G9A, one of two enzymes believed to be responsible for H3K9 methylation in vivo, utilized the H3 (1-25) peptide most efficiently and the H3 (15-39) peptide approximately two-fold less efficiently, whereas the full-length histone was a much poorer substrate (Fig. 2B). These results are consistent with previous in vitro studies that showed G9a methylation at H3K27 in addition of K9. 28 Conversely, the arginine HMT, PRMT4 (also known as CARM1), showed a strong preference for full-length histone H3 over the two peptides tested (Fig. 2C), each of which contains a distinct PRMT4 methylation site (R17 and R26). 29 Unlike G9A or PRMT4, DOT1L was essentially nonfunctional with any of the peptide or full-length histone protein substrates tested (data not shown), and exhibited widely variable activity with different complex nucleosome preparations, including lot to lot variability for the same type of preparation (Fig. 2D). We also observed substantial differences in the SAM dependence, probably reflecting different levels of SAM contamination, with mono-di nucleosomes from HeLa cells yielding the best SAM-dependent signal (Fig. 2D).
Determination of Optimal Enzyme Concentrations and Detection of Inhibitors
We sought to determine enzyme concentrations that would generate a sufficient signal in a 2 h incubation period in linear reactions and with less than 20% conversion of SAM to SAH. Minimizing enzyme usage was an important consideration for controlling the cost of kits. We first used detection in continuous mode to estimate enzyme concentration ranges and insure that reactions continue for at least 2 h; Transcreener EPIGEN detection reagents were added before enzyme and plates were read at intervals. Representative progress curves are shown for PRMT4 and DOT1L in Figure 3. A concentration of 17 nM was sufficient to achieve a robust assay window (80 mP) with PRMT4 in (Fig. 3A), whereas approximately six-fold more DOT1L was required for a similar signal in the 2 h reaction time.

Measurement of PRMT4 and Dot1L activity in continuous mode.
We next performed detailed enzyme titrations using end point assays to determine the optimal enzyme concentrations for screening or profiling inhibitors, which are listed in Table 3. It is important to insure that the end points chosen reflect initial velocity enzyme reaction conditions; that is, linear response to enzyme and time. Because the Transcreener EPIGEN assay relies on a binding reaction (Fig. 1), the polarization response is nonlinear, therefore standard curves were used to convert the data to SAH formation to examine linearity; representative examples for four HMTs with activity shown as polarization and after conversion to SAH formation are shown in Figure 4A and B, respectively. For each of these, SAH formation proportionally increased with enzyme concentration to a point at least as high as the optimal concentration shown in Table 3, and SAM consumption was less than 20%; similar results were obtained for all of the HMTs listed in Table 3. The enzyme concentration required for an assay window of 80–120 mP ranged from 6.25 nM for G9a-GLP to 284 nM for SET8 (Table 3); Z′ values of 0.71, 0.76, and 0.87 were determined for EZH2, G9a, and PRMT3, respectively.

Determination of initial velocity HMT concentrations in end point assay.
We performed dose responses with five HMTs using sinefungin, a naturally occurring nucleoside analog of SAM that is commonly used as a pan inhibitor for SAM-dependent methyltransferases 30 (Fig. 5A). The IC50 values were all in the low micromolar range, indicating the capability for measuring the potency of SAM competitive inhibitors using the optimized HMT reaction conditions. The IC50 values for G9a (2.9 μM) and SET7/9 (1.6 μM) agreed reasonably well with values determined using the [3H]-SAM radioassay and similar enzyme reaction conditions (10.4 μM and 2.38 μM, respectively). 27 We also tested UNC0638, a highly selective inhibitor for G9a and GLP, 31 and observed low micromolar potency with the three target enzymes and at least 100-fold lower potency with two nontarget HMTs (Fig. 5B), confirming the capability for inhibitor selectivity profiling using the optimized HMT assay conditions and the Transcreener EPIGEN assay.

Inhibitor dose–response curves.
Optimization of EZH2 Reaction Conditions and Detection of Inhibitors
EZH2 (enhancer of zeste homology 2) is the catalytic component of the polycomb repressive complex 2 (PRC2), which includes four additional proteins (Table 1). It catalyzes the mono-, di-, and trimethylation of histone H3 at lysine 27. Because of the intense focus on EZH2 as a potential therapeutic target for cancer 5,32,33 and varied reports on its preference for acceptor substrates, we undertook a more detailed optimization effort with this isoform. We initially tested the peptide substrate H3 (21-44) and found it to be a very poor substrate without the addition of the tri-methylated “primer” peptide H3 (21-44/K27(Me3), which has been reported to stimulate EZH2 activity in vitro. 34 We next tested core histones and full-length histone H3, the latter in the presence and absence of the trimethylated peptide. From the standpoint of minimizing enzyme usage, full-length histone H3 was a far better substrate than core histones or the combination of the H3 (21-44) and H3 (21-44/K27(Me3) peptides, resulting in a more than 20-fold reduction in the amount of EZH2 required for a good signal (Fig. 6A); the H3 (21-44/K27(Me3) peptide had no stimulatory effect on methylation of histone H3.
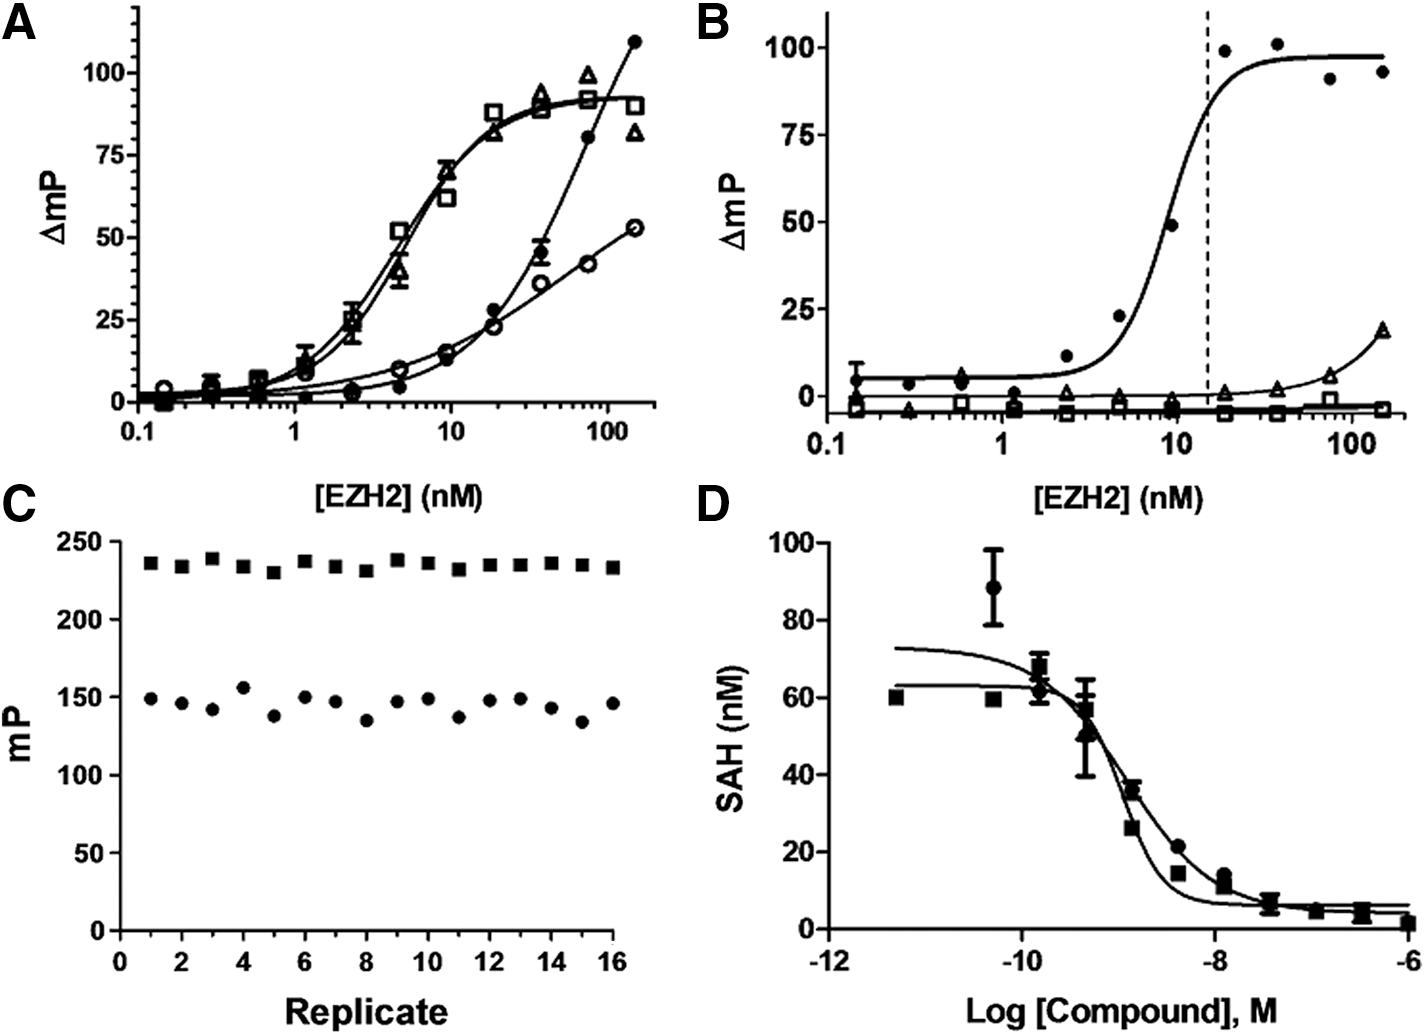
EZH2 reaction optimization and inhibitor dose responses.
Further optimization of the EZH2 reaction with histone H3 resulted in an EC85 of 15 nM (Fig. 6B), which produced an 80–90 mP signal. Contamination of HMTs or acceptor proteins with SAM and nonproductive hydrolysis can both contribute to background signal, but in the case of EZH2 neither of these were evident, as the assay signal was shown to be completely dependent on the presence of both SAM and histone H3 (Fig. 6B). Assay robustness was demonstrated by determination of Z′ (Fig. 6C). The control reactions lacking EZH2 had polarization values of approximately 240 mP and the EZH2 enzyme reactions had polarization values of approximately 150 mP, resulting in a Z′ of 0.71. Note that the value of 150 mP for the EZH2 enzyme reaction is significantly higher than the 30 mP value observed for the free tracer in the presence of histone H3 (Fig. 2A). This is to be expected for a competitive FPIA format since a significant fraction of the tracer is still bound to antibody under initial velocity conditions. Two SAM-competitive inhibitors of EZH2, GSK343, and UNC1999 were tested in dose–response experiments and the IC50 concentrations were determined to be 2.3 and 1.9 nM, respectively (Fig. 6D). These potencies are in good agreement with respective potencies of 4 nM (IC50) 33 and 4.6 nM (Ki) 32 determined using an 3H-SAM radioassay.
Discussion
To facilitate screening and profiling of HMTs, we optimized activity assay conditions for thirteen purified enzymes with the Transcreener EPIGEN methyltransferase assay, which relies on enzyme-coupled SAH detection with a fluorescence polarization readout 23 (Fig. 1). In selecting substrates and optimizing enzyme concentrations, our primary goals were to produce a signal suitable for screening and profiling inhibitors under initial velocity enzyme conditions while minimizing costs for the complete assays. In this regard we considered not only quantities of each component, but their relative cost. We set 80 mP as the minimum acceptable signal. Though Z′ values in excess of 0.6 can easily be obtained with polarization values of 50 mP or less, a window of 80 mP is practical for automated HTS and dose–response measurements. We also arbitrarily selected 2 μM SAM for all of the HMTs to simplify assay development. Though this is higher than the Km for some of the enzymes used, it is not likely to prevent detection of SAM-competitive inhibitors, as evidenced by the facile detection of HMT inhibition by sinefungin (Fig. 5A) and of EZH2 inhibition by GSK343 and UNC1999 at low nanomolar concentrations (Fig. 6D). We note in this regard that the Transcreener EPIGEN assay can be used at considerably lower SAM concentrations if desired, though higher conversion of SAM is necessary to maintain robust assay performance (Z′>0.5 and ΔmP≥60mP) at levels below 1 μM; for example, 10%, 25%, and 40% SAM for conversion for 1, 0.5, and 0.25 μM SAM, respectively. 23
An advantage of the Transcreener EPIGEN assay over methods that rely on detection of methylated products is that it can be used with diverse acceptor substrates without requiring assay development. To validate this capability, we confirmed that most peptide, histone, and nucleosome substrates had relatively minor effects on the antibody/tracer interaction (Fig. 2A). Nucleosomes, the most heterogenous type of HMT substrate tested, had little effect on antibody/tracer interactions, but most of the preparations tested caused unacceptably high background signals (Fig. 2D), most likely due to contaminating SAM or SAH. However, we were able to identify commercially available nucleosome preparations that yielded signals of 80–100 mP for DOT1L (Fig. 2D). Taken together, these results support the ability to use diverse HMT substrates in the Transcreener EPIGEN assay, and at the same time they highlight the importance of testing heterogenous substrates carefully for their effects on the detection reagents.
Our selection of optimal substrates correspond to the known methylation sites for each HMT and all of them have been validated with [ 3 H]-SAM radioassays. 27 Nucleosomes are expensive, so histones or peptides are preferable for minimizing costs. However, though most HMTs will use more than one type of substrate effectively, others including DOT1L (Fig. 2D) and NSD2 (data not shown) exhibit very little activity unless nucleosomes are used. It is not clear whether the lot-specific effects observed with mono/di nucleosomes and DOT1L reflects specific substrate requirements for DOT1L or effects on the assay system. In the case of EZH2, most recent in vitro studies have relied on H3 (21-44) or a very similar peptide substrate and/or nucleosomes, 9,32 –34 with differing results as to preference for one versus the other 9,34 where direct comparisons were done. We did not test nucleosomes, but found that the H3 (21-44) peptide, even with the stimulatory effect of the trimethylated peptide, was a much poorer substrate than full-length histone H3 (Fig. 6A). We observed a similar result with PRMT4, and in both cases histone H3 was selected as the more economical substrate (Table 3).
Because HMTs generally exhibit low turnovers and low Km values for SAM, the ability to obtain accurate IC50 values for inhibitors has been a concern for investigators in the field. Even using an [3H]-radioassay, HMT concentrations can exceed 100 nM. 33 This issue is confounded by the wide variation in SAM Km and inhibitor IC50 values reported using different assay methods and acceptor substrates. 27 For nine of the thirteen HMTs used, we were able to generate a good signal (≥80 mP) using less than 50 nM enzyme, which should enable accurate IC50 determinations in the low micromolar and into the nanomolar range, with limitations as the IC50 approaches the enzyme concentration. This was confirmed by the dose–response measurements yielding IC50 values from 1.0 to 16 μM with known inhibitors of eight different HMTs, including SUV39H1, which was present at greater than 100 nM (Fig. 5A, B) and by determination of IC50 values of less than 10 nM for EZH2 (Fig. 6D). We note that in the case of EZH2, the limitation for IC50 based on the enzyme concentration of 15 nM (Table 3) would be 7.5 nM, however, we observed complete dose–response curves. A possible explanation would be that some of the EZH2 or other required proteins in the PRC2 complex were inactive. In most cases where comparable data were available, including EZH2, the IC50 values we determined were within three to four-fold of those measured using the radioassay. 27,32,33 However, in the case of UNC0638 the IC50 values we measured were 50- to 100-fold higher than those reported using similar reaction conditions and a different enzyme coupled SAH detection method, 31 even though the enzymes were present at relatively low concentrations (Table 3). The reason for this is unclear, though we note that UNC0638 was the only inhibitor tested that competes with the acceptor substrate rather than SAM.
We are hopeful that our efforts at optimizing enzyme reaction conditions for robust detection of initial velocity with an HTS-compatible SAH detection method will reduce the upfront time and costs for initiating HMT screening and profiling efforts. And in this regard, we note that much of the information we have provided should be useful for detection of HMTs with other assay methods that rely on detection of SAH.
Footnotes
Disclosure Statement
All authors are employees and owners at BellBrook Labs, LLC, a commercial supplier of HTS assay kits, including the Transcreener EPIGEN Methyltransferase assay used in these studies.