




Abstract
Factorial experimental design (FED) is a powerful approach for efficient optimization of robust in vitro assays—it enables cost and time savings while also improving the quality of assays. Although it is a well-known technique, there can be considerable barriers to overcome to fully exploit it within an industrial or academic organization. The article describes a tactical roll out of FED to a scientist group through: training which demystifies the technical components and concentrates on principles and examples; a user-friendly Excel-based tool for deconvoluting plate data; output which focuses on graphical display of data over complex statistics. The use of FED historically has generally been in conjunction with automated technology; however we have demonstrated a much broader impact of FED on the assay development process. The standardized approaches we have rolled out have helped to integrate FED as a fundamental part of assay development best practice because it can be used independently of the automation and vendor-supplied software. The techniques are applicable to different types of assay, both enzyme and cell, and can be used flexibly in manual and automated processes. This article describes the application of FED for a cellular assay. The challenges of selling FED concepts and rolling out to a wide bioscience community together with recommendations for good working practices and effective implementation are discussed. The accessible nature of these approaches means FED can be used by industrial as well as academic users.
Introduction
Factorial experimental design (FED) is a proven approach to find optimum conditions for experimental processes 1 –3 and has been widely applied in drug discovery. 4 Although it has been around for many decades, there is evidence that it is still under-exploited in the application of in vitro assays. One observation is that scientists often start with the assumption that an assay has been optimized (e.g., if the assay method has been published) and that reusing the published conditions from another laboratory will be optimal in their laboratory.
The typical historical approach to assay optimization consists of addressing a limited number of factors one at a time, where one factor only is varied keeping all other factors constant (one-variable-at-a-time or OVAT). A hypothetical example to illustrate this approach is shown in Figure 1A–C: seeking to optimize an enzyme assay, a brainstorm of possible processing factors resulted in buffer pH and salt concentration as being the key factors to address at this stage. The set of illustrations highlight the problems associated with OVAT in trying to find optimum assay conditions.

Diagrams to illustrate problems associated with one-variable-at-a-time (OVAT) optimization varying buffer pH followed by salt concentration. ) for a follow-up experiment to improve further.
FED is a general technique for learning about processes efficiently, that can be applied to many different areas. As an illustration, one way to apply FED to the above hypothetical enzyme optimization example would have been to select four reasonable combinations of salt concentration and buffer pH plus a centre point as illustrated in Figure 1D. Analysis of the results from these five experiments would identify the top right experiment as being the best, the bottom left as being the worst, indicating a direction for further experiments to lead toward the true optimum conditions. It is important to note that this is a general finding of experimental design methods in that the approach provides a guide as to which experimental conditions could be explored next. This is in stark contrast with the OVAT approach, which provides no information as to where better conditions might lie. This example serves as a simple illustration; however, the application readily extends in principle to more factors and more levels per factor.
FED provides a structured approach, so that maximum information on experimental factors is obtained from a limited amount of resource. It allows many factors to be examined simultaneously, thereby helping to eliminate plate and time differences, and also enabling a fuller understanding of the potential interdependency between factors.
There are several commercial packages available, including MODDE from Umetrics (
During assay development, FED can be applied to biochemical assays as well as cell assays and some very good specific applications of FED linked to robotics have been reported. 5 –7 In this article we provide an overview of how FED can be applied to the assay development process with a cellular assay example. A cellular assay has been chosen as an example because they have been less commonly reported in the literature, and to demonstrate the broad applicability of the tool independent of programmable liquid-handling systems.
The typical FED workflow is shown in Figure 2. The assay is split into individual building blocks and each process step is assessed for the level of optimization required. To keep the number of variables which are validated in a factorial design within a manageable level, often a pragmatic approach has to be chosen. For example, some assay components, known to be noncritical might not be tested in the FED experiment. The same could apply, where the new assay under investigation is based on prior experimental work. In some cases, the new assay may be planned to run in batches with other existing assays and certain parts of the workflow or reagent batches need to be maintained, so these factors would not be tested in the FED experiment. In addition to assay development, the principles can also be applied to optimized assays, for example, when new batches of reagents such as antibodies have to be validated to show consistency with previous batches.
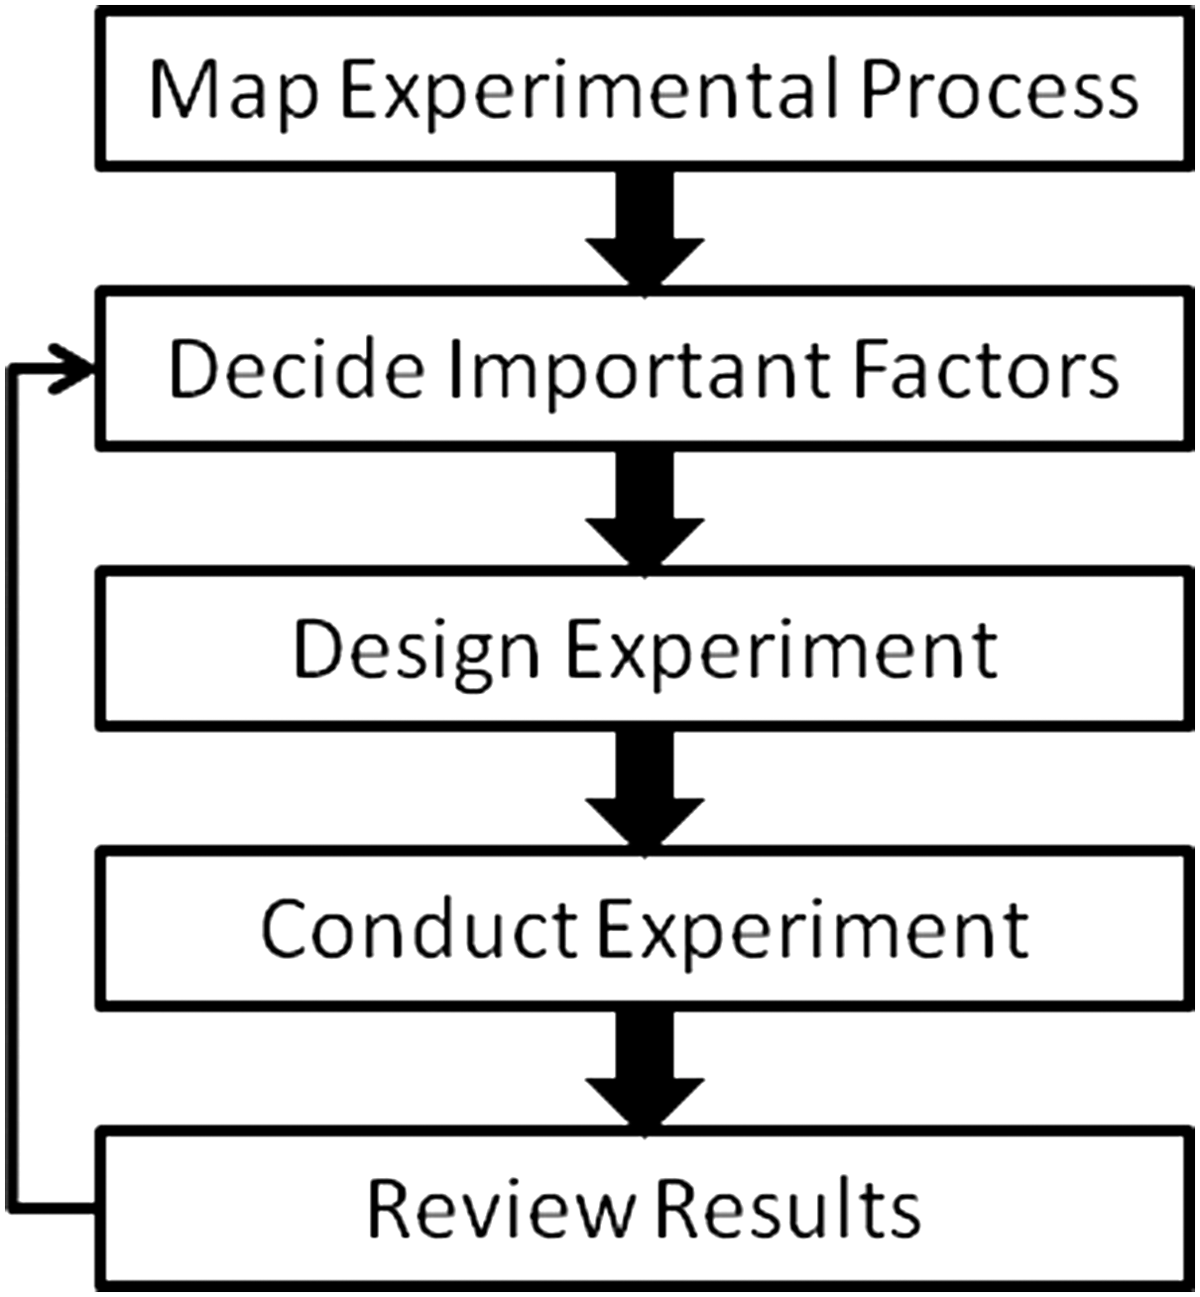
Workflow for applying FED.
The techniques will be illustrated through a GAPDH ELISA assay optimization example for which a full factorial design was used.
A simple Excel-based tool has been developed and can be found in this study. This tool provides details of plate layouts as shown in Figure 3 for varying number of factors and numbers of levels of those factors for typical full factorial and fractional factorial designs; and a mechanism for rearranging the data into the long column format required for data analysis. The final part of the program, which we are unable to share because of licensing restrictions, links the rearranged long-column format data to a graphical analysis tool (e.g., Spotfire). However, transferring the data in this format to a graphical or statistical analysis package is straightforward.
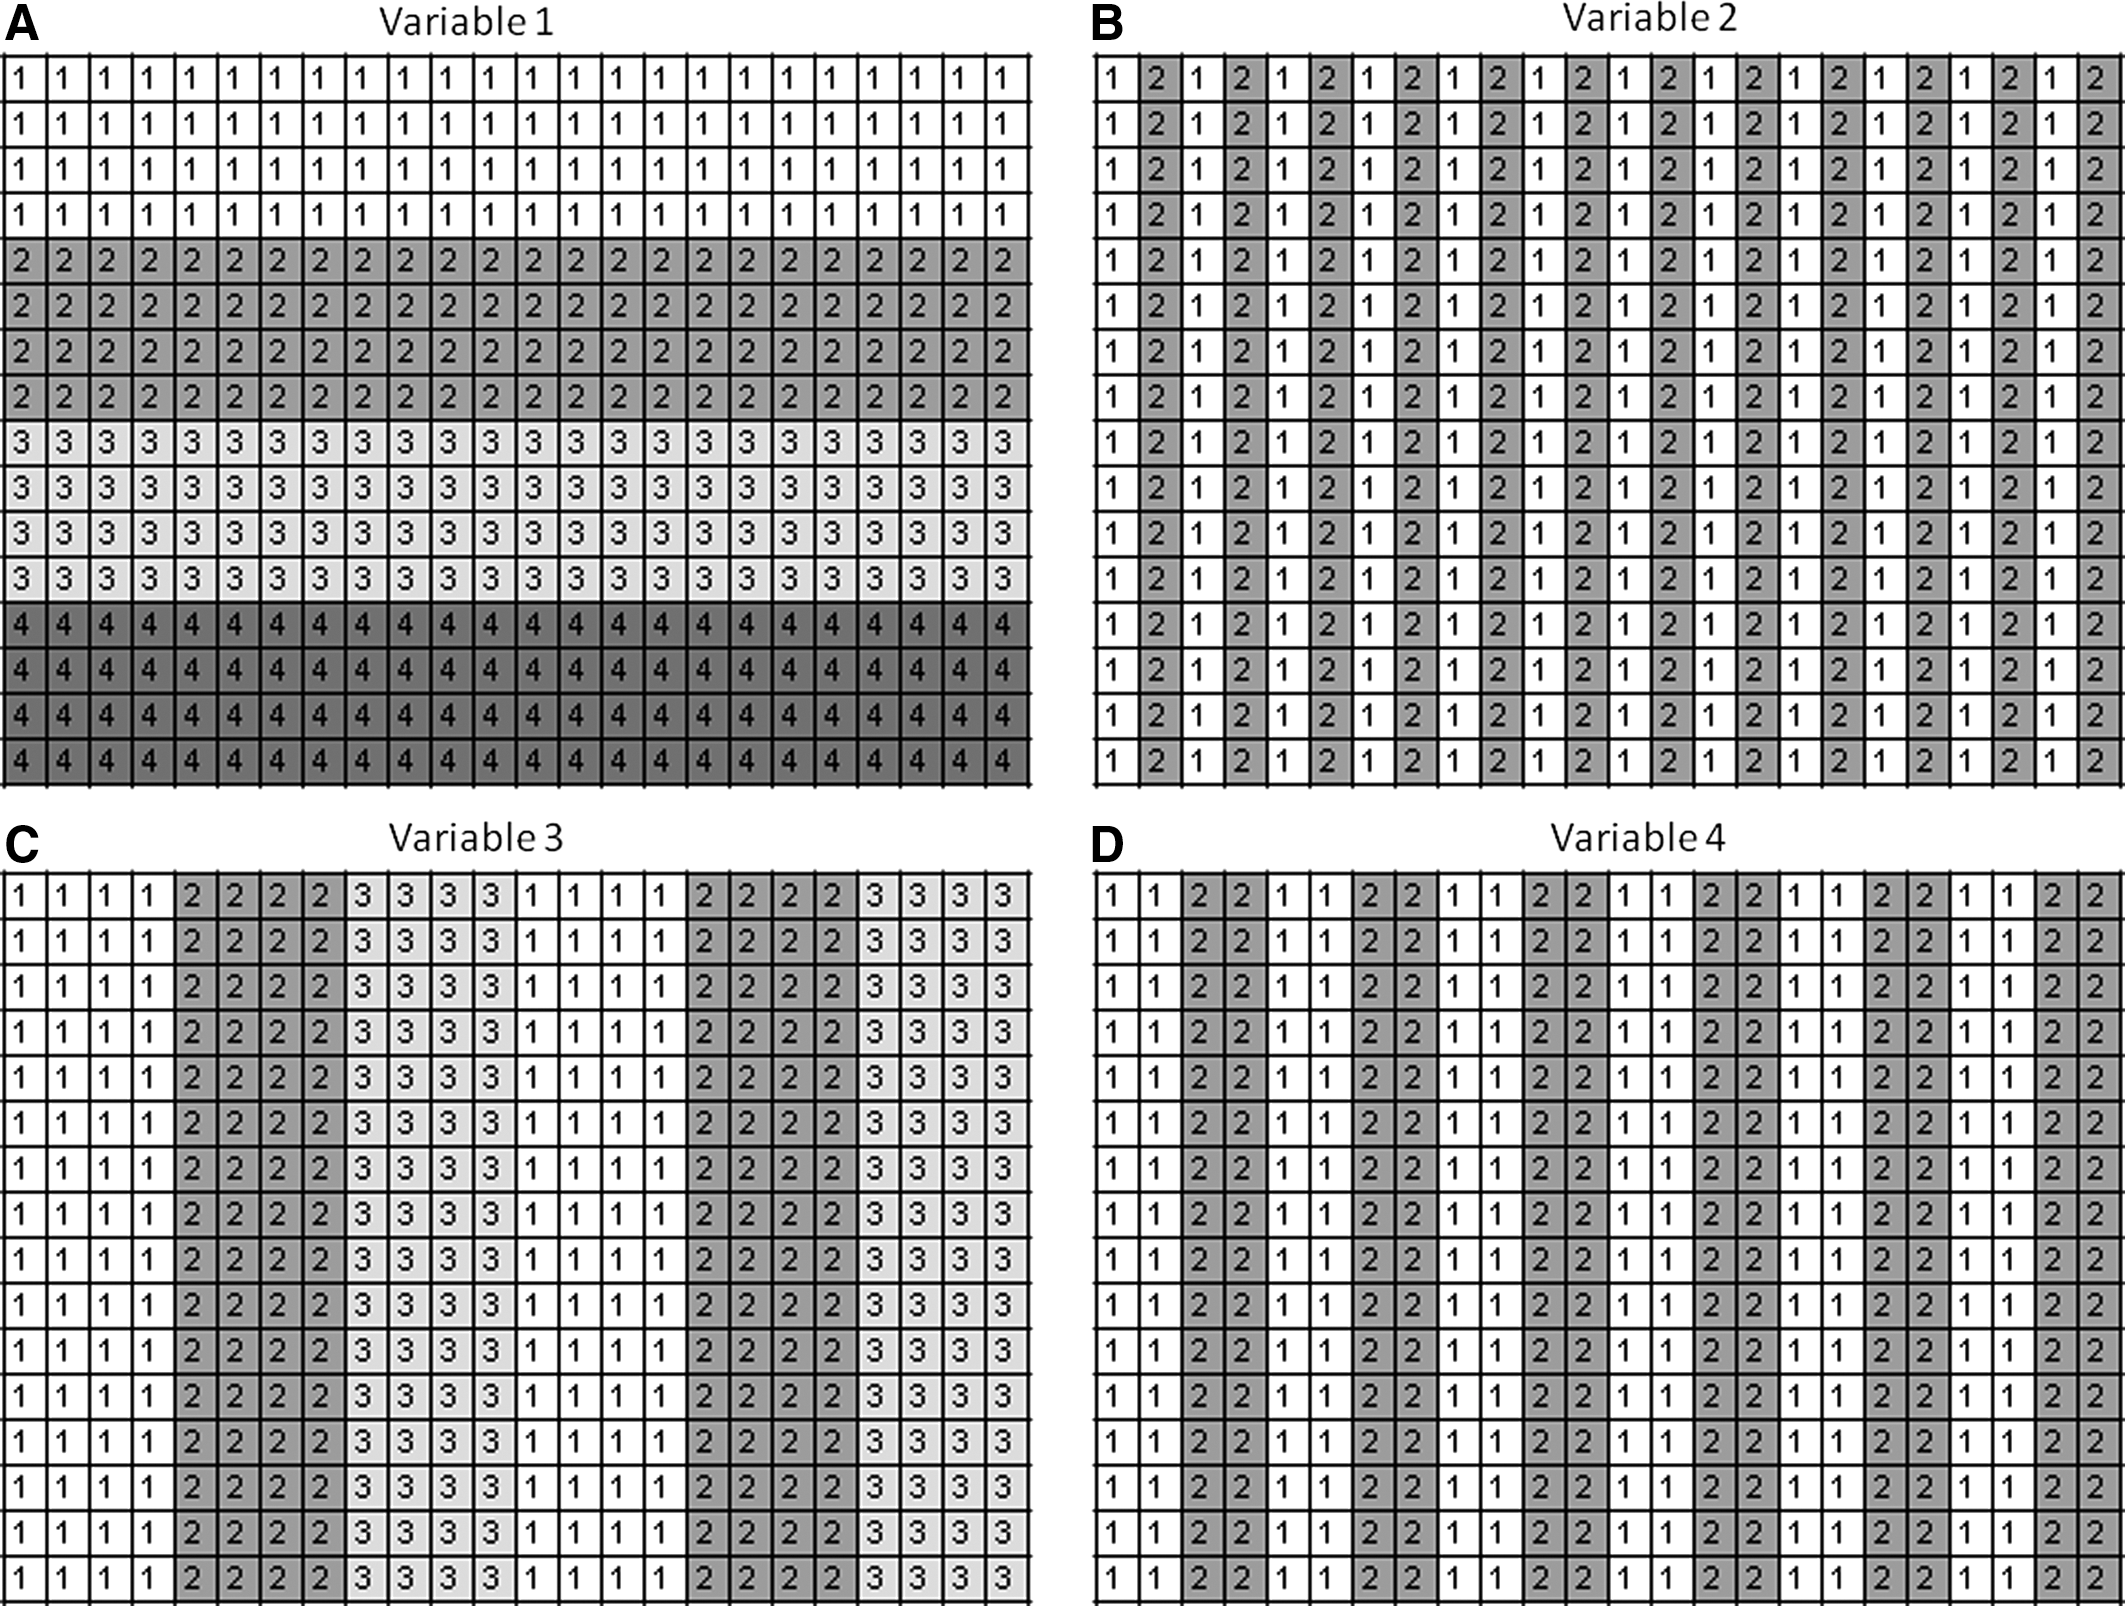
Example of generic plate layout in tool. Each of the four representations
Materials and Methods
Detection of GAPDH in Cellular Lysates by ELISA
The cell lines used were BT474 (human breast ductal carcinoma), HEK293 (human epithelial cells), and MCF7 (human breast adenocarcinoma), all of which were obtained from the American Type Culture Collection (ATCC). The coating antibody used was mouse anti-GAPDH (clone 6C5; Millipore) and primary antibody rabbit anti-GAPDH (Sigma), the secondary antibody is anti-rabbit HRP-conjugated (Cell Signal Technology).
The pipetting template was analogous to that provided in Figure 3. The experiment tested four variables under three to six different conditions, namely concentration of capture antibody, cell number equivalent volume of cell lysate, dilution of primary detection antibody (within plate), cell lines (between plates). Other variables which have been standardized across a range of ELISAs such as blocking reagent and washing conditions were previously optimized 8,9 and have been shown not to be important in generating signal and so were not investigated in this study.
FED Tool
The FED tool described at this time consists of two parts. The first is the design tool (Excel based) and the second covers data analysis.
To support the experimental design, a standard set of plate maps have been created to cover plate formats for 96-, 384-, and 1,536-well plates. The scientist specifies the number of factors and levels per factor and then is presented with a choice of full and fractional factorial design options. The options vary according to the number of levels of each factor and the number of replicate wells. For each option a set of plate maps gives a plate layout for each factor in the design. These plate maps overlay onto a single plate—each map corresponding to a different factor in the design. A four-factor example with one four-, one three-, and two two-level factors in a 384-well plate format is shown in Figure 3. In addition to within-plate factors, the tool caters for factors across multiple plates, for example, temperature, plate type. They are color coded for ease of use and are arranged for user-friendly multichannel dispensing in the case of manual optimization. They can be printed out and used as a template when running the experiment in the laboratory.
A balance needs to be made between using an optimum design and minimizing risk of errors. For robotic experiments the recommendation would be to randomize the position of conditions across the plate. For a manual approach, this would be too complex and lead to too high a risk of error. The process described above allows a manual FED to be run with minimal risk of error. The lack of randomization is compensated by the fact that the layouts are designed so that replicate wells are not all adjacent. In Figure 3 there are a total of 4 (variable 1)×2 (variable 2)×3 (variable 3)×2 (variable 4)=48 combinations, replicated eight times. Cells A1–D1 and A13–D13 are the replicate wells for the four factors at level 1. The number of levels per factor and number of replicates per condition need to be in balance. If, due to a large number of factors and factor levels there are no replicate wells on the plate, the whole plate should be repeated. For some factors it might be necessary to prepare multiple plates with an identical layout, for example, when time points or different plate types/coatings are explored. The tool is flexible to work with any design layout and the user chooses, including randomized layout, fractional factorial design and (for continuous factors at two levels) centre points. The layouts provided give examples of commonly used options, but the user can edit and customize these further if required. The 96-well plate designs include options for fractional design and centre points, and these could be applied to part of a plate for 384- or 1,536-well designs, in the case where reagents need to be conserved.
Once the experiment has been run, the scientist transfers the response data into the tool. The tool brings together the plate layout and raw data and converts it into a tabular format, from where the data can be exported to bespoke statistical or visualization software, for example, Design Expert, JMP, or Spotfire, for more detailed data analysis.
Results
Detection of GAPDH in Cellular Lysates by ELISA
The plotted data in Figure 4 show that the BT474 cell line has reached the maximum signal at a seeding density of 1,250 cells per well, whereas HEK293 and MCF7 cells show an increase in signal up to 5,000 cells per well. This suggests that the target expression in BT474 cells is higher than in MCF7 or HEK293 cells. An OVAT approach would not have highlighted this difference in target expression level between cell lines. A reasonable assay signal can be achieved with capture antibody of 50–100 ng/well and primary antibody dilution of 1 in 1,000 or 1 in 5,000. A second FED experiment is required to narrow down the conditions of these variables more precisely. The final choice of assay conditions will also depend on the cost of the reagent and availability of cells. In the current example the highest signal is at conditions in the top right area of the plot (50–100 ng capture antibody, 1 in 1,000 or 1 in 5,000 dilution of primary antibody) and a larger plating number of MCF7 and HEK293 cells beyond 5,000 cells per well could also result in a larger assay signal. The OVAT approach does not highlight if any components of the assay are limited in the dilution used. This example also highlights another important feature of FED, that is, the observed interaction between two factors, in this case dilution of capture antibody and cell line choice. There is a different pattern of effect of capture antibody dilution for MCF7 and HEK293 cells (continuously increasing signal up to the maximum primary antibody dilution) in comparison to BT474 (a plateau beyond 1 in 1,000 dilution of antibody). Indeed it is not possible to achieve this depth of understanding through an experiment carried out by traditional OVAT.
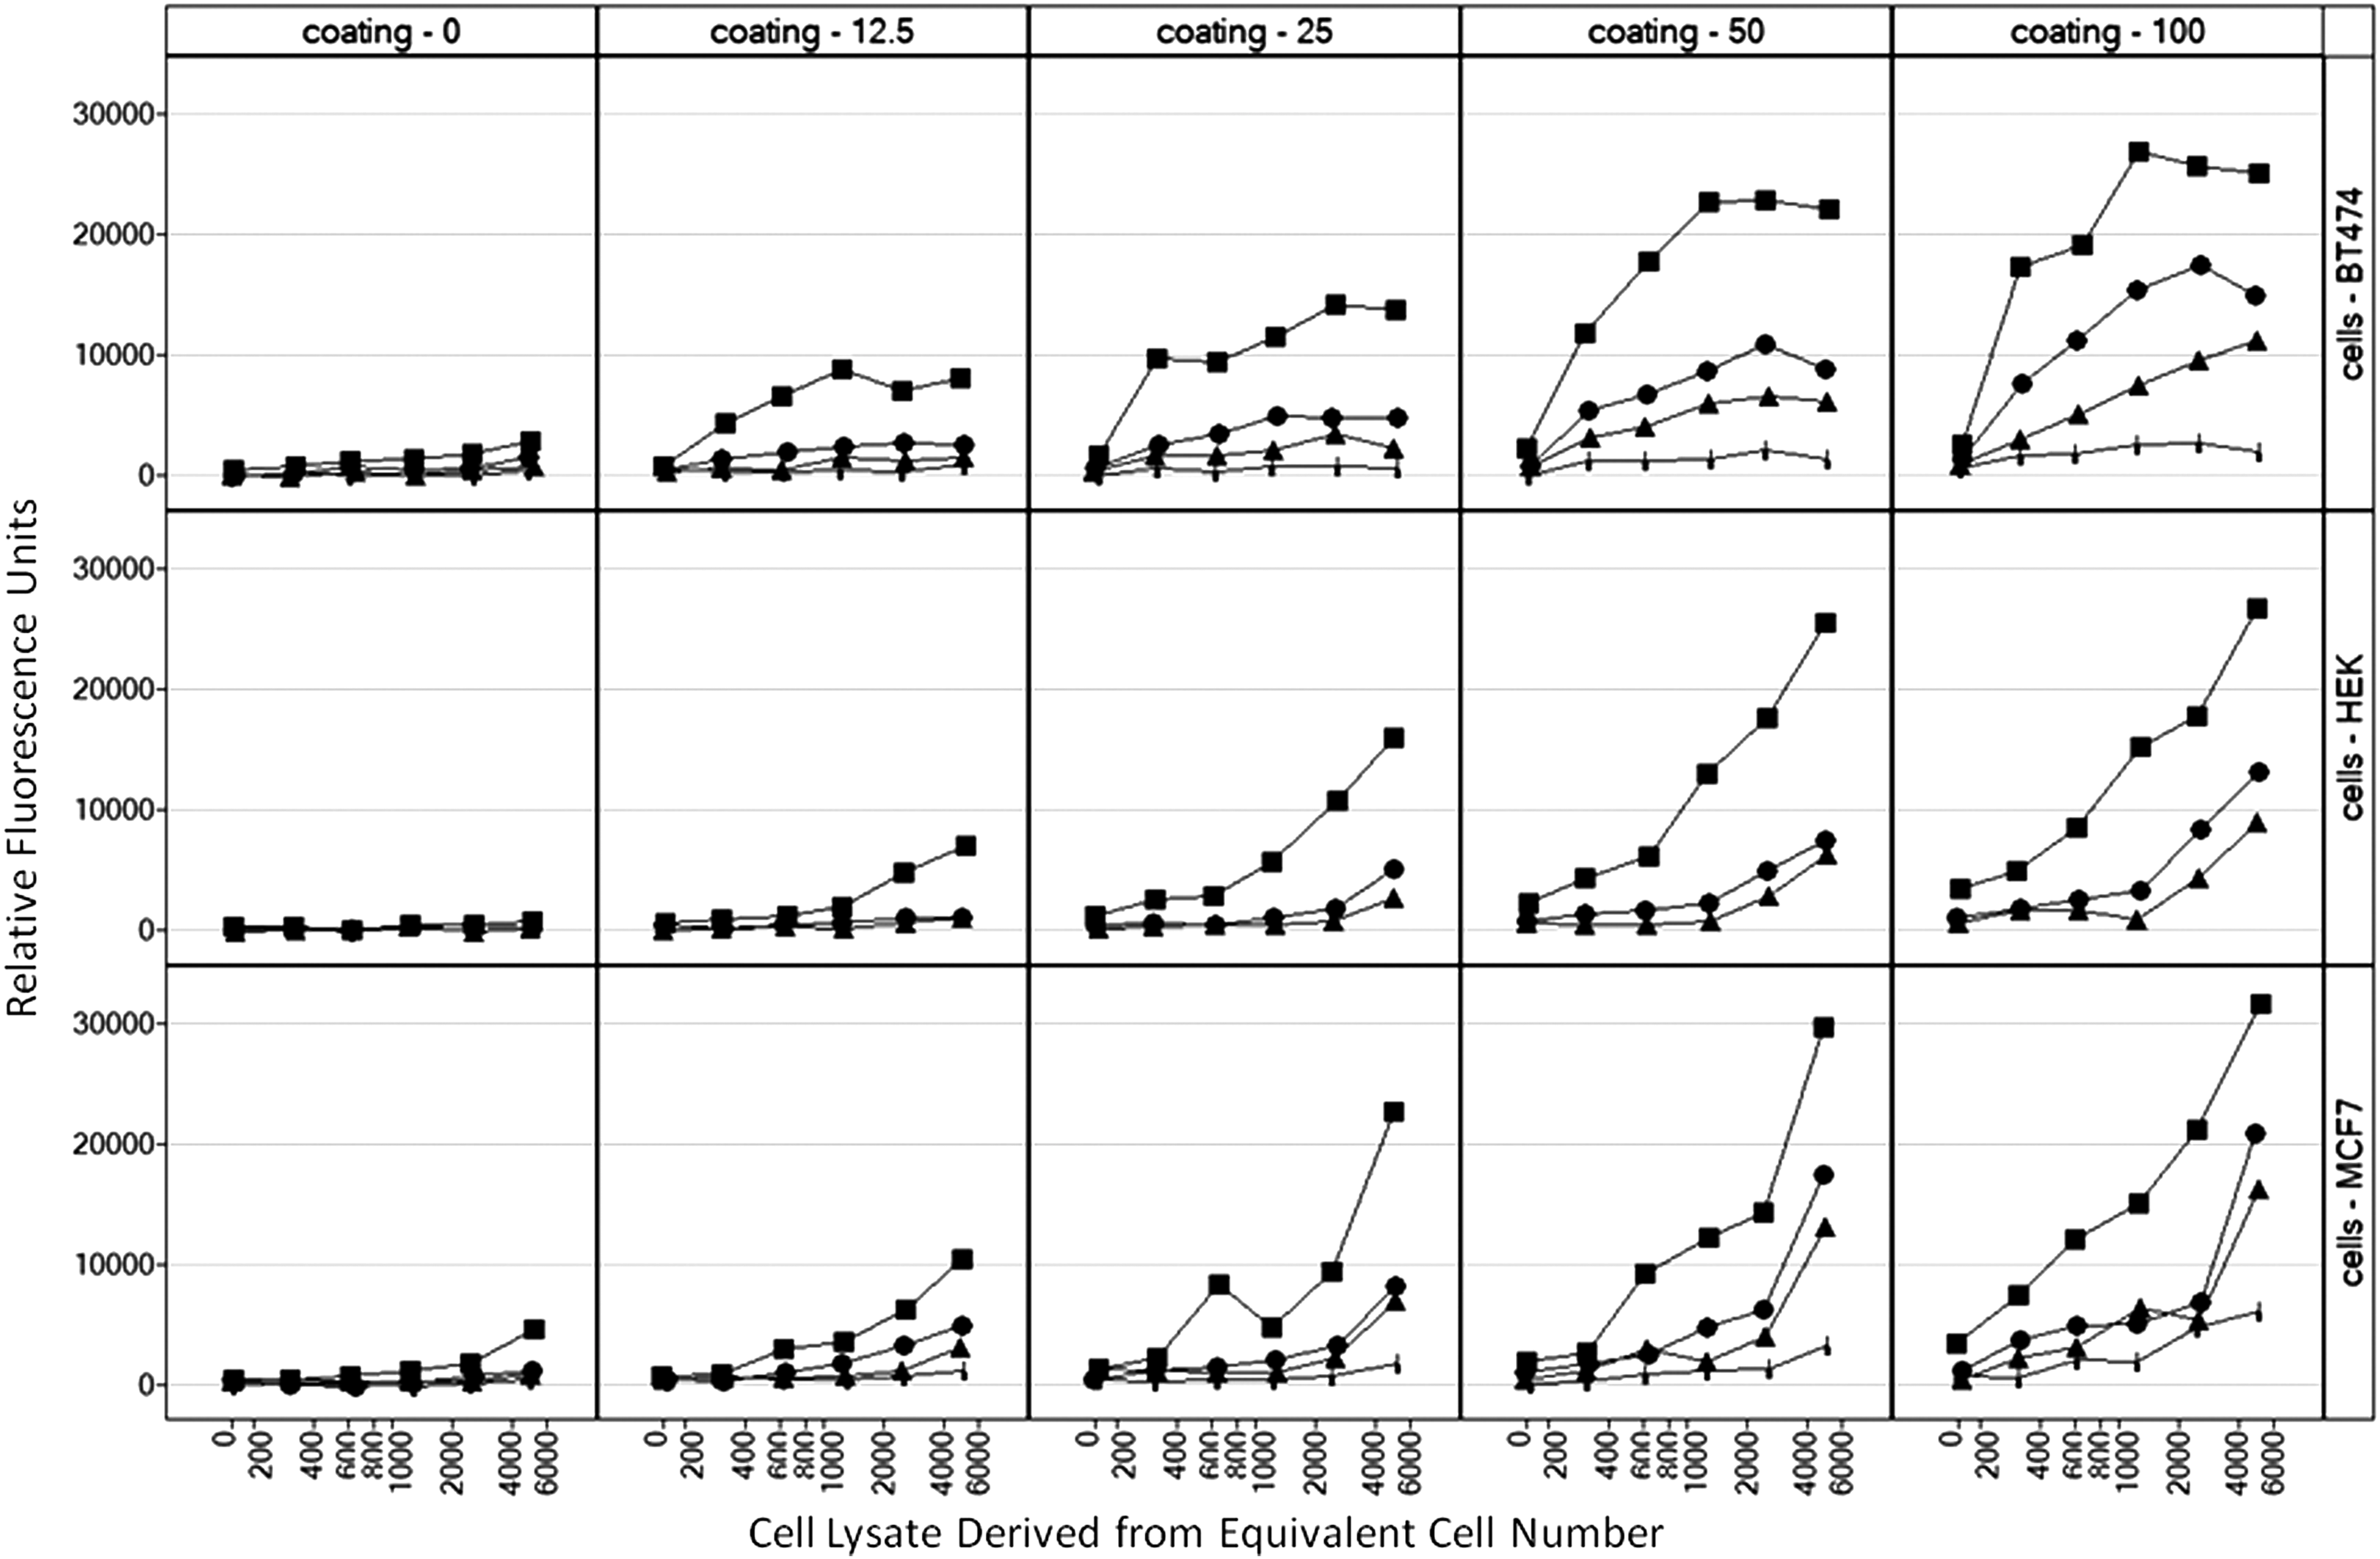
Data from GAPDH ELISA example. Key: Primary detection antibody concentration—1 in 1,000 (■), 1 in 5,000 (●), 1 in 10,000 (▲), 1 in 50,000 (|). Each point represents a single replicate. The coating antibody was tested at 0, 12.5, 25, 50, and 100 ng/well (trellised in columns). The cell lysates used are equivalent to seeding of 0, 312, 625, 1,250, 2,500, or 5,000 cells per well (x-axis). The assay compares the signal in BT474, HEK293, and MCF7 cells (trellised in rows). Data plotted correspond to Emission at 450 nm (y-axis).
Discussion
One of the advantages of the FED approach over the OVAT approach is that for a given number of experiments more data and greater confidence in the conclusions can be gained (or put another way OVAT requires more experiments to get the same quality of information).
In all situations, the choice of design must include resource considerations. These practical considerations can be addressed through prioritization of factors, including number of factor levels, or using a design that provides information on a subset of possible questions. A full factorial design is one where all possible combinations of factors are carried out, whereas a fractional factorial design 2,10 is an option to consider where a fraction of the full design is carried out in a balanced and structured way.
The FED approach will, in the majority of cases, deliver a clear understanding of the optimal assay conditions and suitability of the different reagents within two or three experiments. Optimization of the same assay using the OVAT approach would have required more assay rounds and there is a risk, that individual reagents might be discounted because of the use of nonoptimal conditions. We have observed that the use of FED has both shortened assay development time significantly and also reduced cost. In each of these examples given in this study, FED brought confidence in decisions to strike a balance between the cost saving of material with assay quality.
The utilization of the simple Excel tool has opened the use of FED to bench scientists, independent of the availability of specialized software tools, dispensing equipment, or automation. The plate map in our tool allows the use of multichannel pipettors, which are readily available in most laboratories. This should reduce the risk of pipetting errors. The simplicity of the plate layout also enables application to small-scale automation in the form of dispensing tools.
While it is true to say that FED can be beneficial to any organization, however big or small, the widespread dissemination within a large organization presents particular challenges.
When applying a FED approach to in vitro assay development, the scientist needs to adopt a different mindset, in particular, a greater thought and planning is required at the outset. So the introduction of FED within a large organization can present complexities and barriers, as with any other change process. The following approach was adopted to ensure the successful introduction and roll out of FED to the scientist community. Statisticians worked in partnership with the scientist community on pilot projects. This allowed best practice to be developed jointly with the Therapy Research Areas, whereas at the same time the scientists were helped directly in their current work. Training material was developed based on case studies, thus making the material highly relevant. It was communicated through broad concepts omitting mathematical/statistical details. In addition, best practice was captured through the guidelines to help facilitate roll out and IT tools were developed simultaneously to ensure that roll out and use was efficient and effective. Over time the training material was refined and ongoing support has been provided.
To encourage increased adoption data from pilot projects which had clear impact from the application of FED were shared widely.
Our learning and recommendations to fully exploit this approach within a large organization include: - Collaboration between biologist and statistician is advisable to fully exploit the techniques, particularly for scientists piloting the techniques for the first time and/or scientists dealing with complex assays. Two areas of important collaboration are (a) the planning stage—ensuring all relevant sources of variability are taken into account, and (b) data analysis and interpretation—particularly concerning potential interactions between factors. - Broad applicability—establish case examples to demonstrate the way the techniques can be used with a variety of technologies and assay types, including cell assays and biochemical assays. - In the early stages of implementation, establish senior manager sponsorship for the approaches and identify champion scientists to pilot examples in conjunction with a statistician. - Ensure tools are accessible, user friendly, and output is highly graphical. While general purpose software (such as Design Expert) can be very powerful for more complex assays and situations, the tools described in this study serve flexibly to in vitro assays and have more direct application in this field. - Ensure visibility of good examples through documentation and presentation in seminars. This enables new users to understand the practical application of the techniques and the impact they can have.
Conclusion
A simple tool has been utilized to introduce FED to every scientist accountable for in vitro assay development, independent of access to automation within AstraZeneca. Scientists have benefited in a number of ways, including: reduction in resource (both human and material) requirements; having a clear understanding of what questions can be addressed within a particular assay development round. Through embracing these techniques the scientist is thinking about the assay as a whole to start with.
We have shown that adopting this approach has reduced the overall assay development costs (time plus material costs) from twofold to fourfold. An additional benefit of following a strategy based on sound experimental design principles is that when it is not possible to identify suitable assay conditions, the scientist will have confidence that a rigorous search of the experimental space has been performed. The more structured approach to assay optimization results in increased confidence in the scientific conclusions. The better understanding of assay components and their interactions lead to improved decision making on assay conditions, and faster problem solving if the assay subsequently goes wrong.
Wide application of the approaches has been experienced across different types of assays and technology in the last few years—this has been facilitated through the delivery of user-friendly tools, exploited over time through pilot examples, evaluation of impact, training of staff, and development of good practice guidelines to drive use in the bioscience community more broadly.
Footnotes
Acknowledgment
The authors would like to thank Peter Cook for his support in contributing code for the tool.
Disclosure Statement
No competing financial interests exist.