
Abstract
In this study, we describe the evaluation of a cell-based protein stability assay using β-galactosidase fragment complementation technology performed in two independent laboratories. The assay is based on the ability of certain ligands to bind to a protein leading to a ligand–protein complex that has a different stability than the free protein. The assay employed a prolabeled-tagged MEK1 kinase stably expressed in A549 cells and this was used to evaluate focused sets of compounds containing known MEK1inhibitors as well as a random set of compounds. An assay using a prolabeled-tagged lysine methyltransferase known as G9a expressed in A549 cells was used as a counterscreen. In one study, it was found that the majority of MEK1 inhibitors were either found as inactive (52%) or showed a selective inhibitory response (18%) in the cell-based MEK1 assay; however, eight compounds showed a specific activation response consistent with stabilization of MEK1 in cells. Examination of these stabilizing compounds showed that three of these were analogs of hypothemycin, a known covalent allosteric MEK1 inhibitor, while the remaining compounds covered one structural class. Both laboratories were able to confirm activity in the cell-based MEK1 assay for known MEK1 inhibitors and found that this activity was highly selective over the G9a counterscreen assay. Screening of a mechanism of action library containing compounds with bioactivity annotations against the cell-based MEK1 assay did not reveal any mechanisms leading to an increase in signal other than inhibitors of MEK1. This study supports that the MEK1 cellular protein stability assay is sensitive to certain MEK1 inhibitors, often noncompetitive inhibitors with respect to ATP. The cellular stability assay format could be useful to rapidly filter kinase inhibitor hit lists for allosteric kinase inhibitors and support target engagement in cells.
Introduction
The Monod-Wyman-Changeux model reasons that allosteric transitions occur when ligands stabilize different protein states that are in thermodynamic equilibrium. 1 Oftentimes, the conformational changes, which occur in ligand–protein binding events, lead to a bound complex that is more stable than the free components. This fundamental property has been observed in many protein–ligand interactions and forms the rationale for many biophysical techniques aimed at confirming ligand binding, including differential scanning fluorimetry (DSF) 2,3 and chemical denaturation experiments. 4 Ligand-based stabilization of reporter enzymes can lead to a counter-intuitive artifact in reporter gene assays, where increases in assay signals are observed due to inhibitors that bind and stabilize the reporter enzyme in cells. 5,6 However, ligand-based stabilization/destabilization of proteins in cell-based systems has been used to assist the development of methods for target identification and target validation. 7,8 Recently, an enzyme fragment complementation (EFC) assay has been developed for use as a method to support target engagement of a compound in cells. In this assay, a small fragment (42aa) of β-galactosidase (so-called enhanced prolabel peptide; ePL) is fused to the target of interest, and after incubation with compound, the levels of the target are measured by lysing the cells in the presence of the enzyme acceptor (EA) fragment of β-galactosidase. Reconstitution of β-galactosidase activity is then measured with a chemiluminescent substrate. This cell-based assay can be used to determine if compounds penetrate cells and stabilize the target of interest.
To evaluate this assay format, we performed a pilot study using A549 cells expressing the kinase domain of MEK1 (residues 58–371) tagged at the C-terminus with the ePL peptide (MEK1-ePL) and a series of MEK1 inhibitors. As a counterscreen for either general transcriptional/translational modulators or assay artifacts, we employed A549 cells expressing the unrelated enzyme G9a—a lysine methyltransferase (residues 918–1,193) also tagged at the C-terminus with the ePL peptide (G9a-ePL). Parallel studies were performed independently at two different laboratories (AstraZeneca [AZ] and Novartis) and are described and summarized here.
Materials and Methods
Compound Libraries
A set of 3,493 compounds was obtained from the Novartis compound archive. These were known MEK1 inhibitors identified in a previous biochemical MEK1 assay. The compounds were prepared in half-log serial dilution in 90% DMSO (dimethyl sulfoxide)/10% water in 384-well plates and subsequently reformatted into 1536-well plates. The compound concentrations in the DMSO stocks contained in 1536-well plates ranged from 0.64 μM to 2.0 mM. The compound source plates were 1536-well polypropylene clear plates (Greiner).
A set of 10,701 compounds was obtained from the AZ compound collection. These included 7,500 compounds from a diversity set, 3,177 known MEK1 inhibitors identified in external or internal biochemical MEK1 assays, and 24 G9a inhibitors identified in external biochemical G9a assays. The compounds were dissolved in 100% DMSO and reformatted into 1536-well plates. For single shot screening, a final concentration of 10 μM was used. For concentration–response curves (CRCs), compounds were prepared in half-log serial dilution in 100% DMSO that ranged from 6 pM to 30 μM. The compounds were added directly to the 1536-well white solid assay plates (Greiner 782073).
A mechanism of action library (MoA) was also screened at Novartis. This library contained 1,234 drugs or compounds with validated mechanisms of action, including ligands for GPCRs, protein kinase inhibitors, nuclear receptors, ion channel modulators, histone deacetylase inhibitors, transcriptional or translational inhibitors, phosphodiesterase inhibitors, and protease inhibitors. The library was initially screened as a qHTS 9 at three concentrations (40, 20, and 7 μM) against the MEK1-ePL cellular stability assay, and compounds with inhibition of >30% at 20 μM were selected for confirmation using eight-point CRCs in both the MEK1 and G9a cellular stability assays. The set of compounds for confirmation testing was enhanced with additional compounds, including MEK1 noncompetitive inhibitors (Refametinib, 10 PD184352, 11 and U0126 12 ) and the G9a-positive control UNC0638, 13 as well as CDK inhibitors and general inhibitors of DNA synthesis or ribosomal function. This set totaled 121 compounds and the highest tested concentration of the CRCs was 33 μM.
Cell Culture
Clonally derived A549 cells stably expressing the MEK1 fragment (amino acids from 58 to 371) with the ePL tag fused at the C-terminus (DiscoveRx, Freemont, CA) were maintained in Dulbecco's Modified Eagle's Medium (DMEM) (Invitrogen, Carlsbad, CA) containing 10% v/v fetal bovine serum, 1% v/v penicillin/streptomycin, and 500 μg/mL Geneticin (Invitrogen) under humidified atmosphere containing 5% CO2 and 95% air. Near confluent cells were washed with phosphate-buffered saline, incubated with Detachin (Gelantis, San Diego, CA) for 5 min to dissociate, and then resuspended in culture media or cell plating media. Cells used in the screen were typically harvested for splitting or plating out of Corning T225 flasks at confluence between 80% and 95%, typically at a density of 5.0×10⁶ cells after 72 h. At AZ, vials containing 2.0×10⁷ cells/mL of cryopreserved cell stocks were created from cells cultured as above, using freezing media containing 90% fetal calf serum and 10% DMSO.
EFC Assay
The amount of MEK1 present in cell lysates was measured by the β-galactosidase activity using the InCell Hunter detection reagent (DiscoveRx). The 1×working solution consisted of one part EA Reagent II to one part lysis buffer to four parts substrate reagent according to the manufacturer's protocol.
Instrumentation
The ELX-406 (BioTek, Winooski, VT) or the Multidrop Combi (Thermo Scientific, Waltham, MA) was used for reagent dispensing. Compounds were added by pintool addition (Novartis) or acoustically using Echo 555 (Labcyte, Sunnyvale, CA) (AZ) or using the HP D300 digital dispenser (Tecan, Reading, United Kingdom) (AZ). For pintool compound transfer, slotted pins were used to dispense 50 nL of DMSO solution. The final DMSO concentration was less than 1.5%, which was determined not to affect the assay signal. For Echo 555 or HP D300 dispensing, a total of 2.5 nL of DMSO solution was dispensed and final DMSO concentration was 0.1%. The chemiluminescence signal was measured on a ViewLux (PerkinElmer, Wellesley, MA) with a measurement time of 35 s and 2× binning or alternatively with an Envision plate reader (PerkinElmer, Waltham, MA).
HTS Assay Protocol
The 1536-well assay protocols are described in the Supplementary Data (Supplementary Data are available online at
MEK1 Enzyme Assay
For determining ATP competition with the compounds identified in the Novartis screen against MEK1, ATP variation data were collected at Reaction Biology. The assay used human MEK1 with a kinase inactive version of ERK2 (K52R) as substrate (1 μM), and phosphorylation was monitored using [γ-33P]-ATP. Compounds were tested in the IC50 mode at 10 concentrations with threefold serial dilution starting at 5 or 40 μM. Reactions were carried out at 100, 50, 10, 2.5, and 1 μM ATP.
EAstern Blots
Concentration–response data were determined in either the MEK1 or G9a A549 cellular stability assays. At Novartis, PathHunter® EAstern blots (DiscoveRx 93-0053) were performed using 200,000 cells per well seeded in 12-well plates. Compounds were added from DMSO solutions using the HP Digital HD300 dispenser (final DMSO concentration was 0.29%). Following 6 h of compound incubation, cells were lysed in 75 μL of RIPA+1×HALT protease (Thermo Scientific 8990 and 78440). SDS-PAGE (NOVEX 4%–12% Bis-Tris Gradient) was performed using 10 μL of sample (∼20,000 cells per lane). Before loading, the samples were heated for 10 min at 70°C in a gel loading buffer, sonicated for 10 s, and then centrifuged at 13,000 rpm for 10 min. The abundance of enhanced ePL tagged protein (MEK1 or G9a) on the blots was detected by the addition of the complementary EA enzyme fragment and the chemiluminescent substrate in a supplied buffer (DiscoveRx). Chemiluminescent detection was performed on a BioRad imager using different exposure times (from 14 to 240 s).
Results
The general principle of the intracellular ligand-based stabilization assay is shown in Figure 1. In one view centered on target degradation, shorter half-life proteins (e.g., ≤8 h) are preferred over longer half-life proteins as the compound incubation time can be held to a timescale where modulation of the assay signal by transcriptional/translational mechanisms is minimized. Assuming no change in transcription/translational rates, a ligand that completely prevents degradation of its target protein will show a twofold rise in concentration at the time point corresponding to the half-life of the unbound target protein. More realistically, a ligand will only slow the degradation of a target protein relative to the unbound state, and the assay signal is expected to rise proportionally relative to the half-life of the target protein until a new equilibrium is established that is governed by the rate of synthesis and the ligand-bound degradation rate. 14 Increased target levels in cells could also occur due to ligands that act as molecular chaperones, preventing misfolded aggregates by binding to the native state. Chemical inhibitors have been used to increase protein expression levels in cells. 15
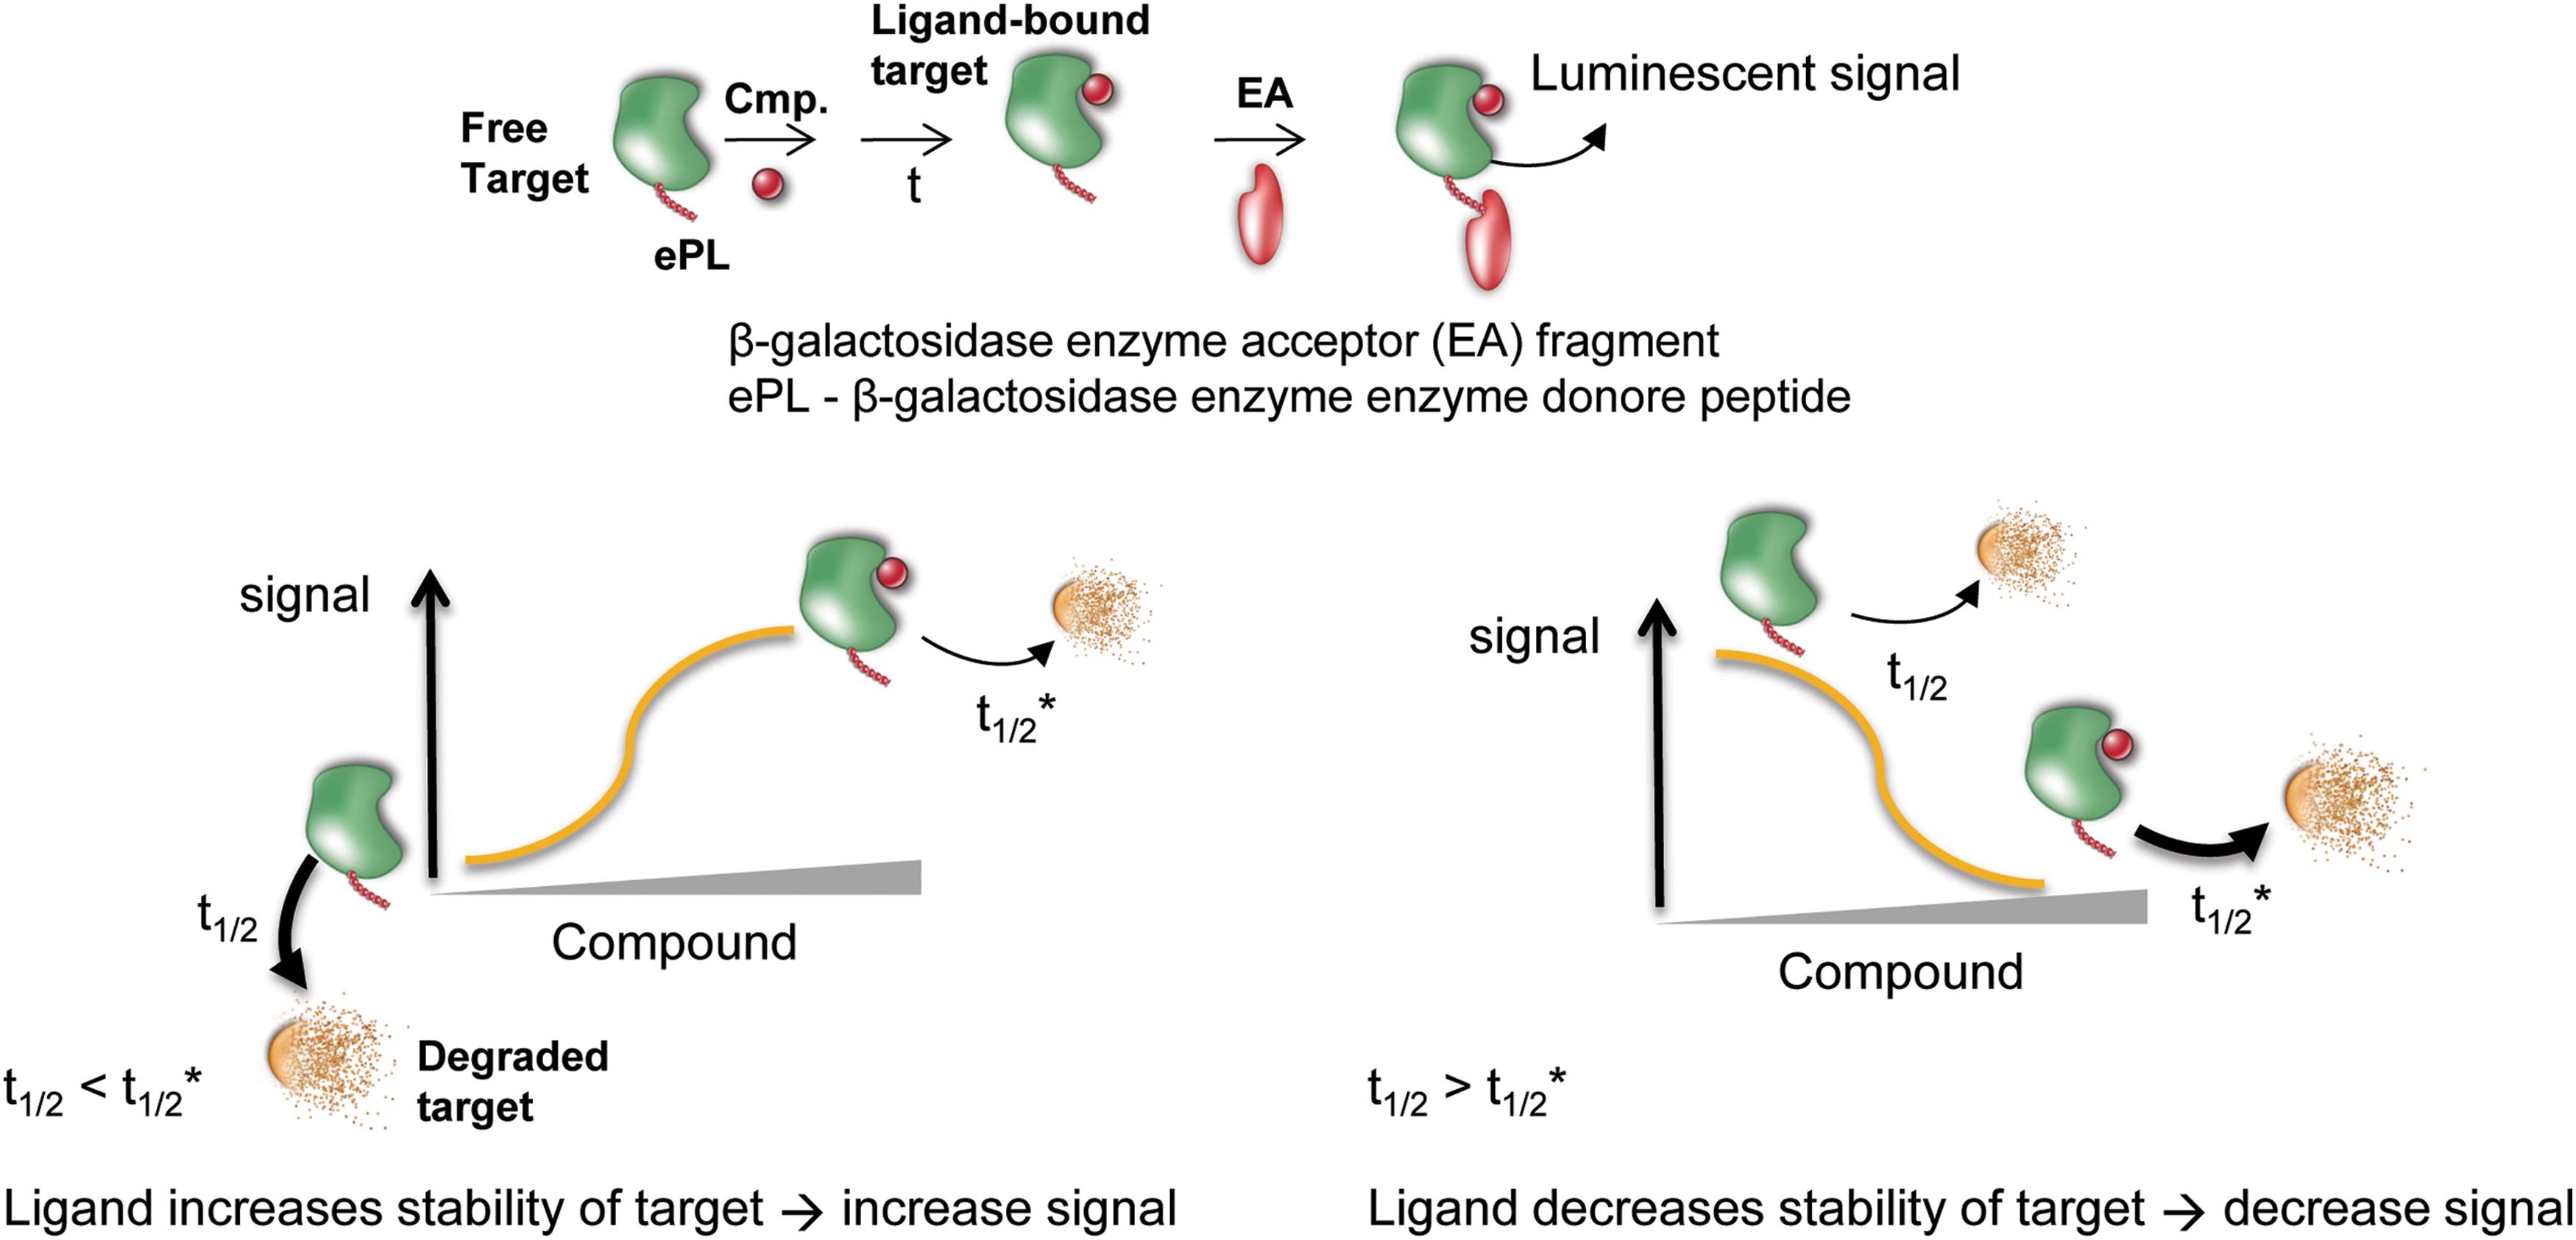
Principle of the cell-based protein stability assay. Top, the protein of interest is tagged with a fragment of β-galactosidase (ePL; 42aa) and expressed in cells. Following incubation with compound, the amount of protein remaining is measured by adding a detection reagent containing the enzyme acceptor (EA) fragment. Bottom, either an increase or decrease in signal can occur depending on the stability of the protein–ligand complex relative to the free enzyme or unfolded states.
Assay Optimization
Both the MEK1-ePL and G9a-ePL assays were already optimized for use in 384-well plates by scientists working at DiscoveRx. At Novartis, the standard 384-well plate volumes were miniaturized to adapt the assay to 1536-well plates (Supplementary Table S1). Titration of the number of cells per well showed that 600 and 1,000 cells per well were optimal for the G9a-ePL and MEK1-ePL 1536-well assays, respectively. The benzhydroxamate PD0325901 is a known noncompetitive inhibitor (with respect to ATP) of MEK1 kinase. X-ray studies have shown that such benzhydroxamates bind as ternary MEK-ATP-inhibitor complexes with the compound binding to a hydrophobic pocket adjacent to the ATP pocket.
16
PD0325901 has an IC50 of 0.33 nM against MEK1 (in the presence of 50 μM ATP; activated MEK1

Control compound profiles.
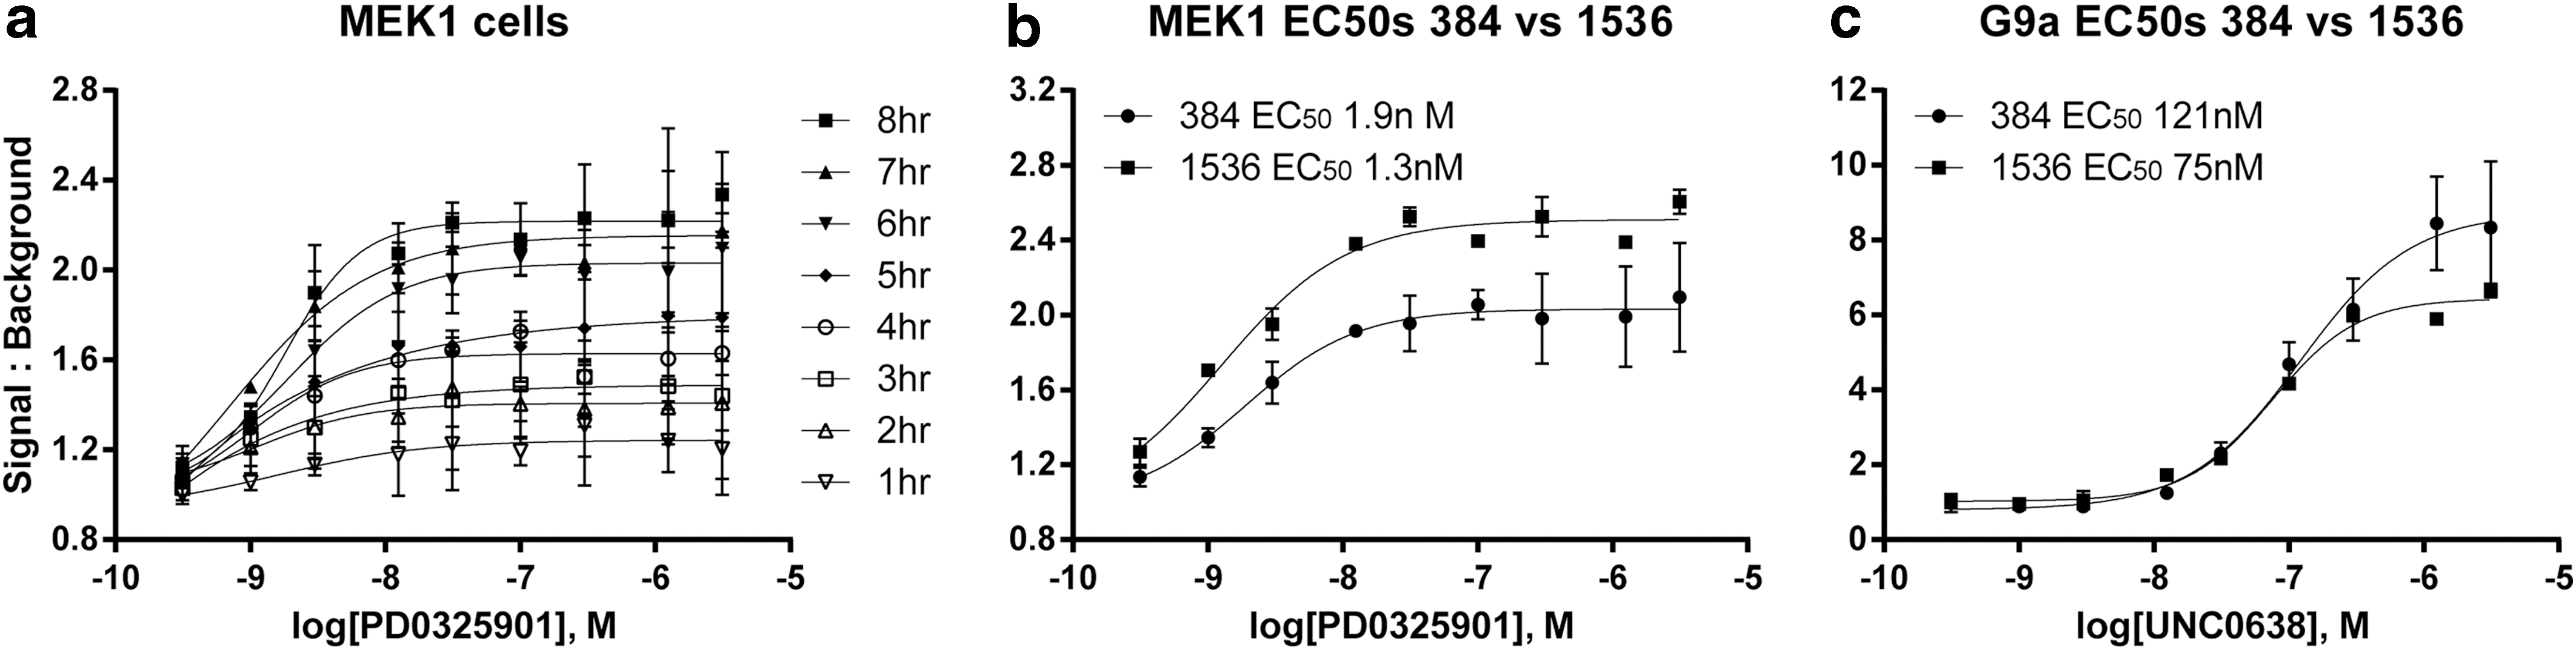
In a similar manner at AZ, the MEK1 control compound PD0325901 was used to optimize the assay. The 384-well assay was optimized for cell culture conditions (including the use of cryopreserved cells), cell seeding density, compound incubation time, and detection reagent addition. This study demonstrated that cryopreserved cells show equivalent performance to cultured cells (data not shown). Detection reagents are different between the G9a-ePL and MEK1-ePL assay and this was examined. Each of the reagents was tested on both cell lines and the highest Z′ and signal:background (signal:background ratios were calculated using maximum signal from control compound-treated wells and minimum signal from wells treated with DMSO alone) were observed with the G9a detection reagent (Supplementary Table S2). The incubation time of PD0325901 was varied and incubation times ≥6 h yielded a signal:background of more than twofold (Fig. 3a). Treatment of either MEK1-epL or G9a-epL A549 cells with 200 μM cycloheximide showed loss of signal consistent with a half-life of ∼8 h for MEK1-epL and ∼1.5 h for G9a-epL (data not shown). We note that the potency of PD0325901 determined at AZ was higher (1 nM, Fig. 3b) than what was determined at Novartis for this compound (30 nM, Fig. 2), with similar signal:background values determined between the two laboratories, while the potency of the UNC0638 in G9a-ePL cells was similar between the two laboratories (∼100 nM), although a lower signal:background for UNC0638 was observed at Novartis compared to AZ (Figs. 2b and 3c). The final 384-well protocol used at AZ is given in Supplementary Table S3 with a compound incubation time of 6 h. The assay was miniaturized to 1536-well plates with equivalent performance of control compounds for both the MEK1 and G9a assays (Fig. 3b, c). Titration of the number of cells per well showed that 250 cells per well were optimal for both MEK1-ePL and G9a-ePL 1536-well assays. The final 1536-well protocol is given in Supplementary Table S4.
For the evaluation at Novartis, the 1536-well assay was used to screen compounds at eight concentrations in triplicate. All these compounds had been previously identified to inhibit MEK1 in a biochemical assay measuring MEK1 phosphorylation of ERK2 in a scintillation proximity assay format. This set of compounds showed a range of potency against MEK1 with 15% showing IC50s<1 μM, 54% with IC50s between 1 and 10 μM, 18% with IC50s between 10 and 20 μM, and 13% with IC50s between 20 and 40 μM. The evaluation covered sixty-six 1536-well plates for each assay. The Z′-factor for the MEK1-ePL assay ranged from 0.3 to 0.6 (maximum signal was control compound-treated wells, and minimum signal was taken as wells treated with DMSO alone) with an average Z′=0.5±0.1 and RZ′=0.65±0.1 (a series of 15 plates showed unacceptable Z-factors and were not taken for analysis). The G9a-ePL assay showed an average Z′=0.3±0.1 and RZ′=0.5±0.1 (a series of ten plates showed unacceptable Z-factors and were not taken for analysis).
A comparison of the activity in the MEK-ePL cellular stability assay is shown in Figure 4. For analysis of the Novartis data, the cell-based activity of 3,330 compounds showing valid curve fits was clustered into categories of activators, strong or moderate inhibitors, inactive, and inconclusive activity, which were generally CRCs showing activity at only the highest tested concentration (Fig. 4). A total of 596 compounds (18%) showed to be selective MEK1 destabilizers, while only eight compounds (0.2%) were found as selective MEK1 activators supporting stabilization of MEK1 in cells. A total of 171 compounds were found to be strong inhibitors in either assay suggesting that these compounds modulate general transcriptional/translational events. Interestingly, 52% of the MEK1 inhibitors were found to be inactive in the MEK1-ePL cell assay. For the G9a-ePL assay, the one selective activator, which was identified, was an analog of the G9a control compound UNC0638, placed among the MEK1 inhibitors as an internal control. The other three G9a activators showed only weak activation (∼30%).

Results of the MEK1-ePL and G9a-ePL cell assays. Three thousand three hundred thirty MEK1 inhibitors showed valid concentration–response curves fits (CRCs; n=3) in both MEK1-ePL and G9a-ePL assays. Top, cross table comparing the activity of these compounds between the two assays (stabilizers showing an increase in signal, and destabilizers showing a decrease in signal). Bottom, example CRCs for each activity category found in the MEK1-ePL cell assay. Data from Novartis.
The CRC data for the MEK1 stabilizers derived from the Novartis MEK1-ePL cell-based assay screen are shown in Figure 5. These stabilizers were found to belong to two different chemotypes. Series 1 (Cmps. 1–5) all contained the same scaffold with systematic modifications (e.g., substitution of halogens, or methyl vs. ethyl substitution) and contained compounds with potent MEK1 enzyme inhibition activity (Fig. 5a). In general, the EC50 in the MEK1-ePL cellular stability assay was near the IC50 determined in the MEK1 biochemical SPA assay and the CRCs in the cell versus the biochemical assay reflected each other except for Cmp. 4, which showed weaker activity in the biochemical MEK1 enzyme assay than in the cell-based assay (Fig 5a). Interestingly, two related analogs in series 1, each with good potency in the biochemical MEK1 assay (IC50s ∼140 nM and 4.2 μM), did not show activation in the MEK1-ePL cell assay and appeared as inactive (data not shown). Both of these compounds contained a charged carboxylate group, which may limit cell penetration of these compounds. Series 2 represented analogs of hypothemycin (Fig. 5b, Cmps.6–8), a known covalent MEK1 inhibitor. 18 None of the MEK1 stabilizers showed activity in the G9a-ePL cell-based assay (Fig. 5). The most potent selective MEK1 destabilizer identified is known to be a potent dual PI3K/PDK1 inhibitor (Cmp. 9). 19
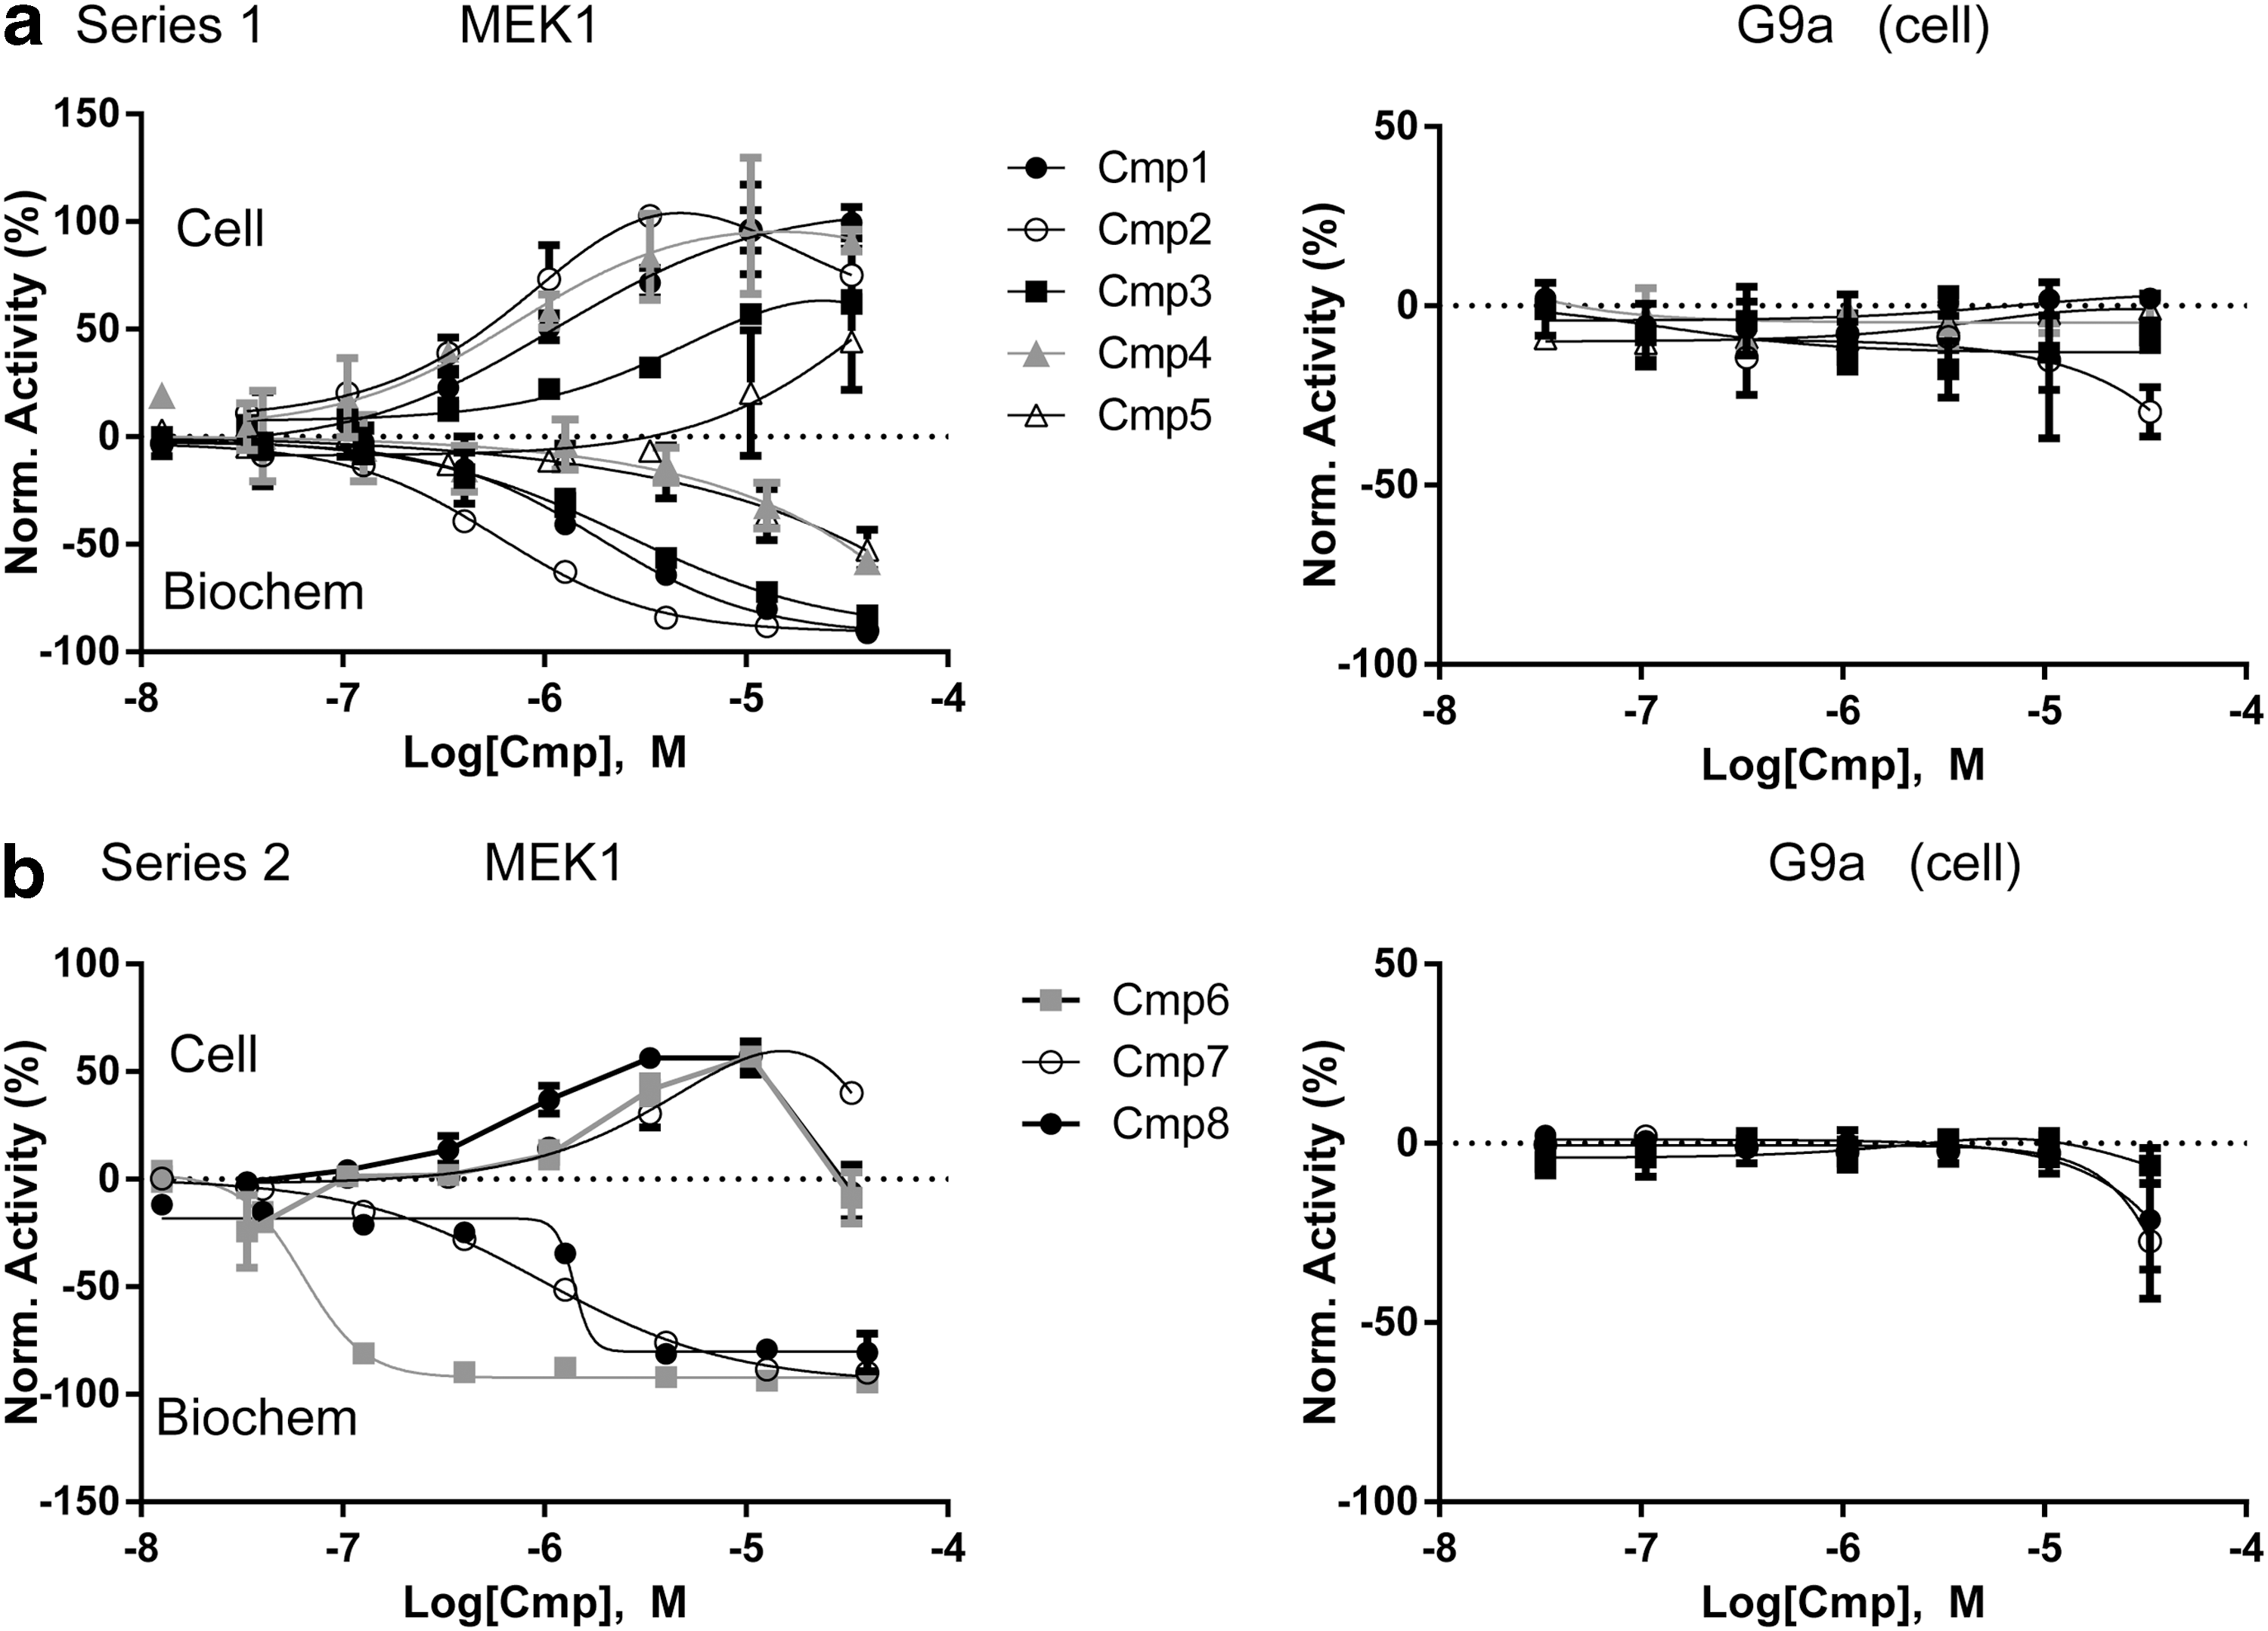
Activity of MEK1 stabilizers in the primary screen. Two chemical series were identified as MEK1 stabilizers.
To further confirm these results, compounds from each activator series were obtained as powder samples at Novartis and then assayed at 6 and 24 h in the cell-based stability assays. In this experiment, two potent known allosteric MEK1 inhibitors, GSK1120212 20 and Refametinib, 10 were also included. No effect was observed at either time point in the G9a-ePL assay, but activation was confirmed in the MEK1-ePL assay (Fig. 6a, b). The level of activation increased at 24 h relative to what was observed at 6 h. The mechanism of inhibition relative to ATP for the series 1 activator was also examined, and refametinib was included for comparison (Fig. 6c, d). For Cmp. 2, the compound was noncompetitive with ATP, and the IC50 in the presence of 100 μM ATP was weaker than the EC50 in the MEK-ePL assay (Fig. 6c). As expected, refametinib behaved as a noncompetitive inhibitor with ATP, and the IC50 in the presence of 100 μM ATP closely matched the EC50 in the MEK cell-based stability assay (Fig. 6d).
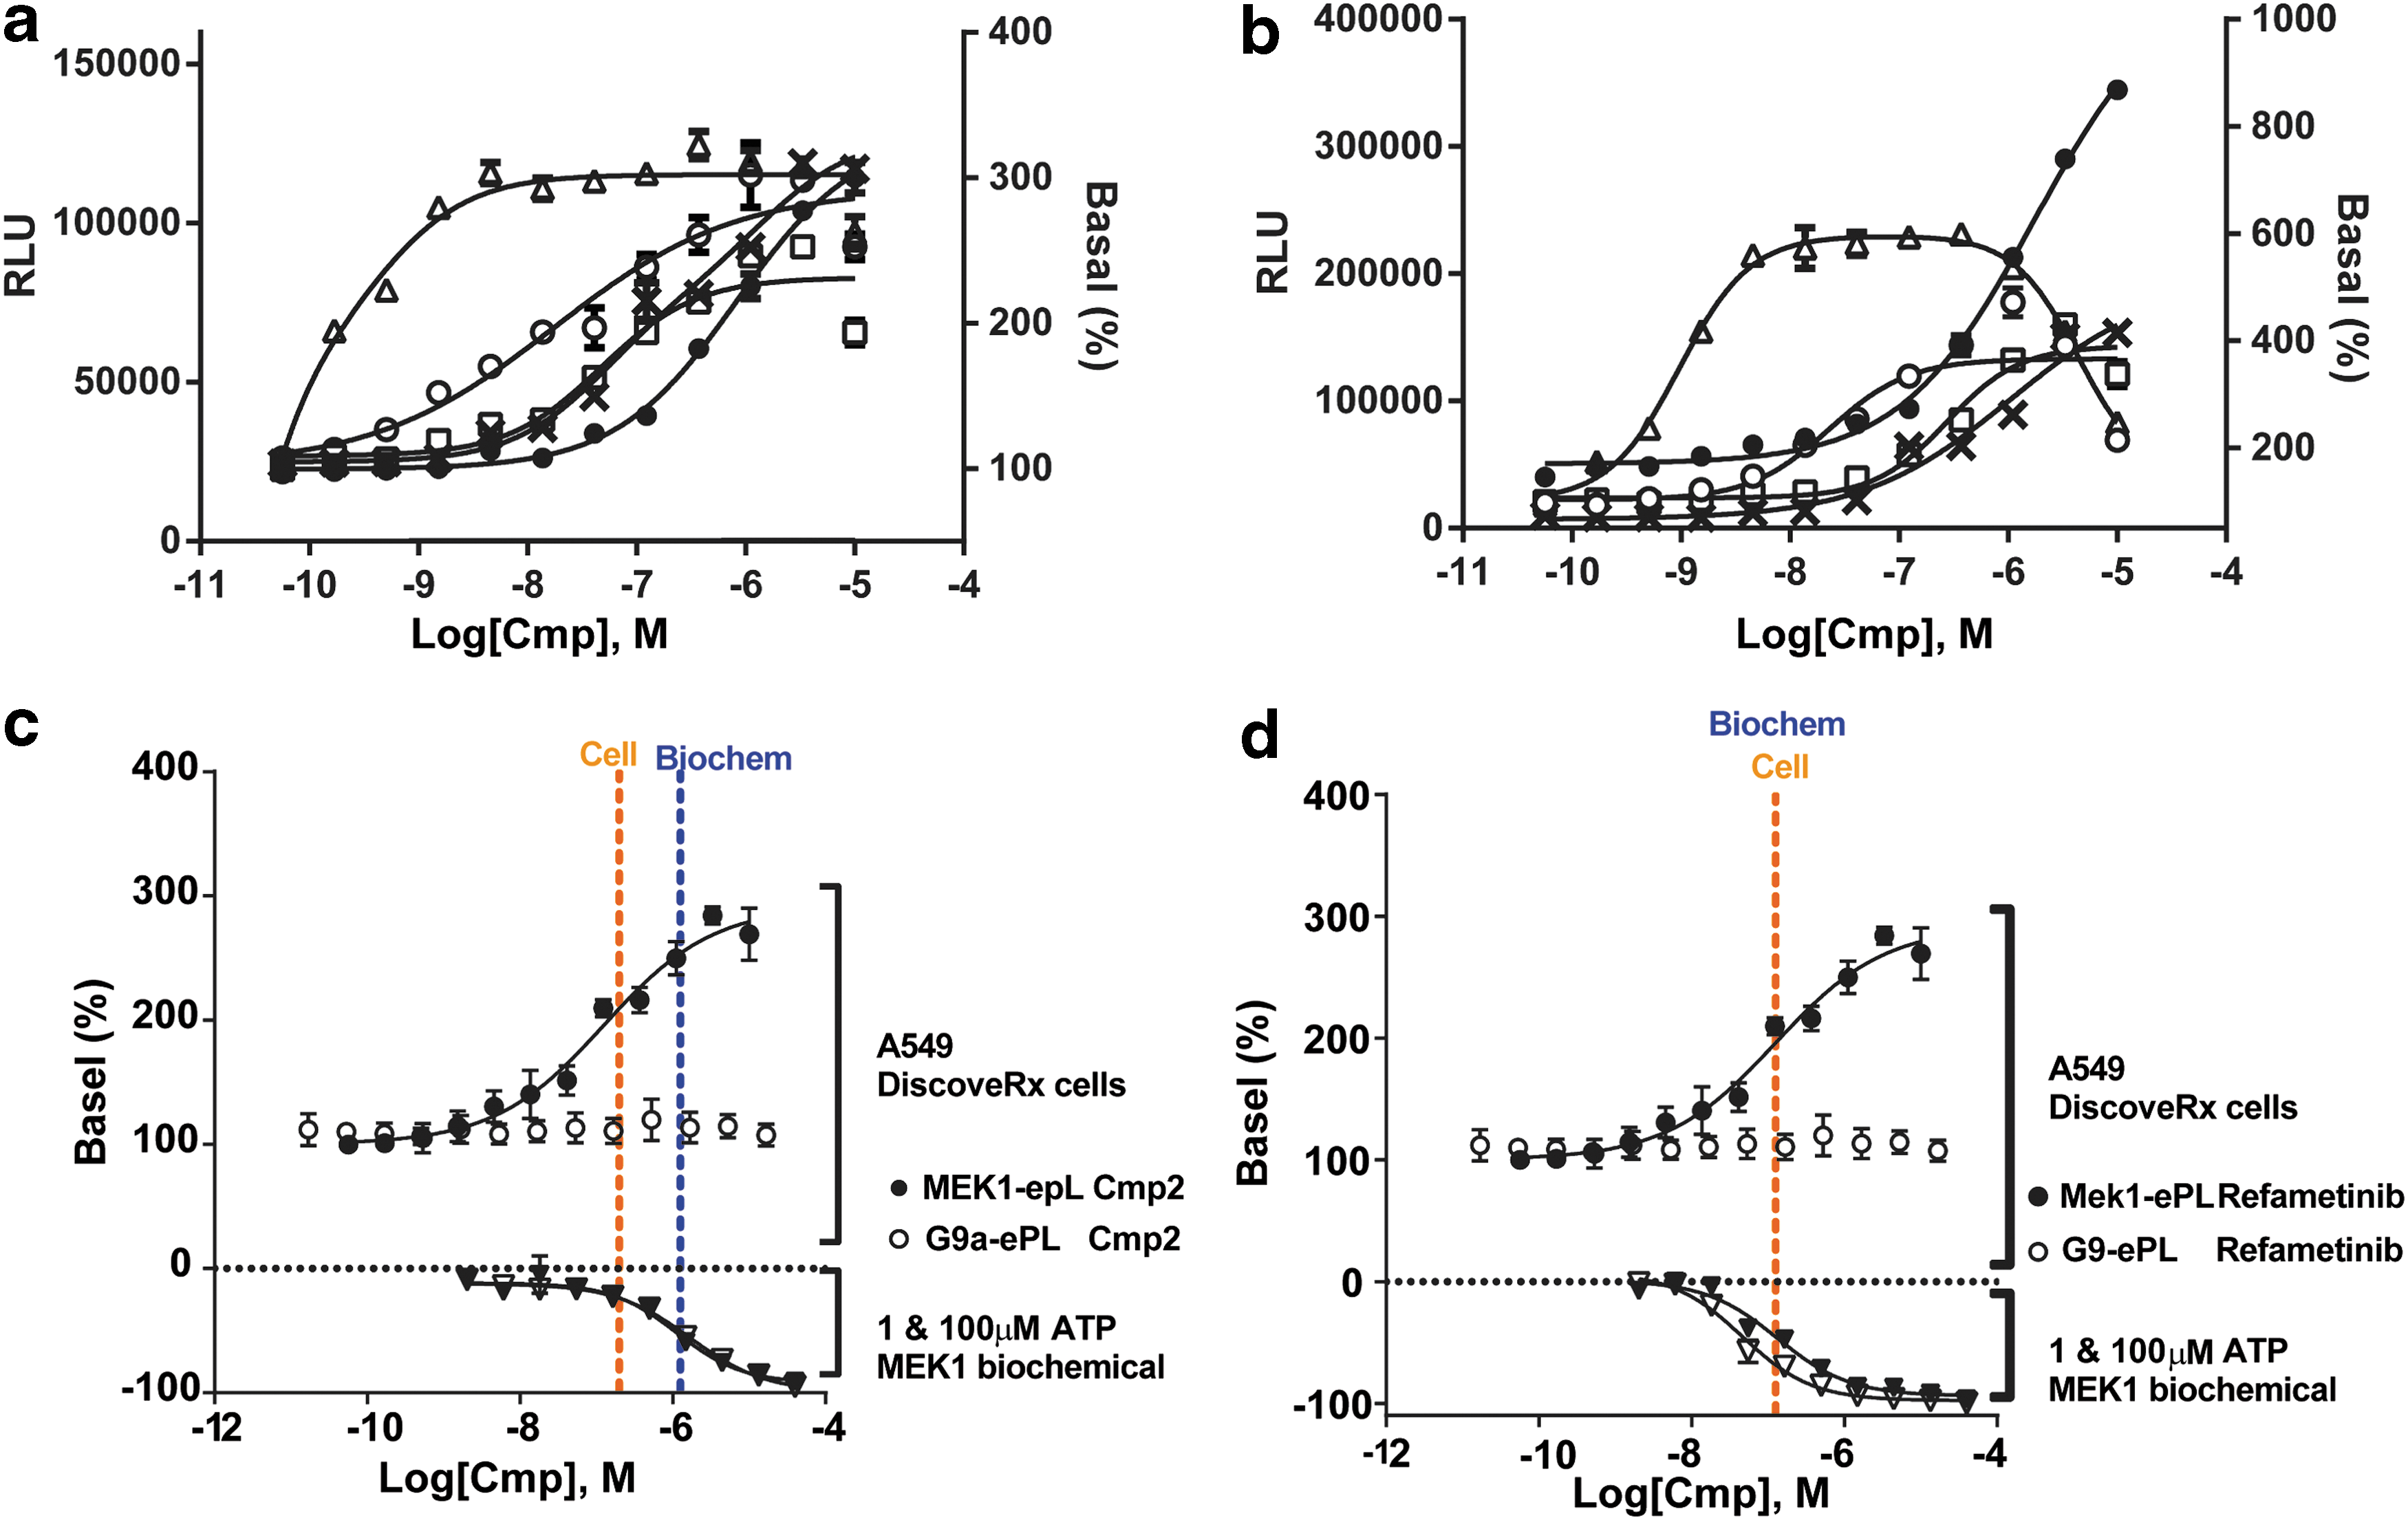
Activity of MEK1 stabilizers and destabilizers. Activity of MEK1 stabilizers and destabilizers with 6
Finally, blots were performed using the EA fragment of β-galactosidase (so-called EAstern blots) to measure protein levels in the A549 cells (Supplementary Fig. S2). No effect on MEK protein levels was found when treating with the G9a inhibitor UNC068 for 6 h. However, treatment of the cells for 6 h with the series 1 stabilizer Cmp. 2 showed increases in MEK1 protein levels with an increasing compound concentration, while the MEK1 destabilizer Cmp. 9 showed decreases in MEK1 protein levels with an increasing compound concentration (Supplementary Fig. S2).
The pilot study at AZ employed 7,500 compounds from a diversity set; 3,177 compounds that were selected based on internal and external biochemical MEK1 inhibition data (MEK1 inhibitors with potencies ranging from nM to μM) and 24 G9a inhibitors. For screening, the libraries were assayed at 10 μM on three separate occasions for the diversity and two separate occasions for the MEK1 and G9a set. The signal:background in the MEK1-ePL assay was 2.7 with an RZ′=0.2, while the G9a-ePL assay showed a signal:background of 3.5 with an RZ′=0.6. However, using a hit threshold of ≥30% activation (equivalent to a z-score of 4, which was representative of the distribution of the data), no hits were identified in either assay from the diversity set. However, within the known MEK1 inhibitors, several compounds were identified. The compounds identified as active in either MEK1-ePL or G9a-ePL assays were tested in 12-point CRCs on three separate occasions.
For further analysis of the AZ data, compounds were classified into three groups (Fig. 7) based on activity in MEK1 biochemical, MEK1 efficacy, MEK1-ePL, and G9a-ePL assays. The MEK1 efficacy data had previously been generated in the A375 human malignant melanoma cellular imaging assay measuring MEK1 phosphorylation of ERK1/2. From a total of 3,177 known biochemically active (IC50<1 μM) MEK1 compounds tested at 10 μM, 116 showed ≥30% MEK1 activation in the MEK1-ePL assay. From the 116 compounds, 10 had previously been tested in MEK1 efficacy and found to be active (EC50<10 μM). In the remaining 3,061 compounds, 505 had been tested in the MEK1 efficacy assay, of which 352 were active, but not active in the MEK1-ePL assay. Another 153 compounds were inactive in MEK1 efficacy and were inactive in the MEK1-ePL assay. For the G9a-ePL assay, none of the MEK1-ePL active compounds was active. In the single-concentration screen, from the 24 known active G9a compounds, including the control compound UNC0638, 6 were identified as G9a-ePL active (≥20% activation) and all were inactive in the MEK-ePL assay.

Concentration–response curves for MEK1 inhibitors in MEK-ePL and G9a-ePL A549 cell assay. Top, summary of the three groups identified at AZ.
To understand potential general mechanisms that may affect the assay signal of the MEK1-ePL and G9a-ePL cell-based stability assays, the activity of a library containing compounds with known mechanism of action (MoA library) was investigated at Novartis. In a primary screen against 1,234 compounds in the MEK1-ePL assay, we noted some inhibitory compounds (hit rate ∼3% at 20 μM screening concentration; >30% inhibition), but no compounds that activated the signal. We examined actives with eight-point CRCs in both the MEK1-ePL and G9a-ePL stability assays along with a few other MEK1 inhibitors and additional compounds, which may have general effects on translation or cell health. MEK1 inhibitors were found to activate the signal in the MEK-ePL assay and these showed no effect in the G9a-ePL assay (Supplementary Fig. S3). Many of the inhibitors were of weak potency (maximum inhibition of ∼40%) in the MEK1-ePL assay and overall showed more activity in the G9a-ePL assay (maximum inhibition observed ∼90%: Supplementary Fig. S3). Only four compounds showed >30% inhibition at the highest tested concentration of 33 μM in the MEK1-ePL assay. All four compounds were also active in the G9a-ePL assay, but two of these compounds were also found as active in other DiscoveRx cell-based assays (∼90% inhibition at 20 μM) constructed to measure GPCR internalization, suggesting either nonspecific cellular effects or interference with the detection system. For the other two compounds, one is a flavanone (PubChem CID:68071; Pinocembrin) with known promiscuous activity and the other was PubChem CID:671 (1,4-dihydroxy-2-naphthalenecarboxylic acid), listed in PubChem as active in several genotoxic assays. The proteasome inhibitor MG132 was tested separately and found to show a maximal activation in the G9a-ePL assay that was ∼37% of the maximum activation observed for UNC0638 (Supplementary Fig. S1b), but an inhibitory response in the MEK-ePL assay (Supplementary Fig. S1c). The decrease in signal in the MEK-epL assay for MG132 was not due to cytotoxicity (Supplementary Fig. S1c). Therefore, decreases in signal may occur in the MEK1-ePL assay through preventing the degradation of a destabilizing pathway/target and, conversely, compounds that inhibit a destabilizing pathway/target could lead to increases in MEK-ePL levels, which would appear selective relative to the G9-ePL assay. However, in our analysis, we did not find any compounds that selectively increased the assay signal other than known inhibitors of the targeted ePL construct. Compounds that nonselectively decreased the signal had weaker potency with promiscuous activity or showed general interference with the ePL detection system.
Discussion
Ligand-based stabilization of proteins can be used to support target ID or target engagement in cells. 7,8 In this study, within libraries containing known MEK1 inhibitors, the majority of the compounds were found as either inactive or showed an inhibitory response in the MEK1-ePL cellular stability assay; however, a few compounds showing an activation response were identified. All of the activators and the majority of the inhibitors were selective versus the G9a counterscreen. The inhibitors generally showed weak (>10 μM) potency in the MEK1-ePL assay, despite 69% of the compounds having in vitro MEK1 enzyme potency values <10 μM. Such poor correlation between in vitro enzyme potency and cell-based activity is often observed for protein kinases. 21 The reasons for this observation are not understood, but may be related to cell penetration, differences in affinity due to the ePL tag, or the mechanism of inhibition, particularly if the protein kinase has a high affinity for ATP. However, from a library of ∼3,300 MEK1 inhibitors, eight compounds showed specific activation consistent with stabilization of MEK1 in the cells. Three of these stabilizing compounds are related to hypothemycin, a known covalent allosteric MEK1 inhibitor, while the remaining stabilizers covered one structural class that showed noncompetitive inhibition with respect to ATP. Interestingly, two related compounds with good potency determined in the biochemical MEK1 assay did not show activity in the cellular MEK1 stability assay. Each of these compounds had a charged carboxylate group, which may limit cell penetration. Similarly, several MEK1 inhibitors with high potency determined at AZ also did not confirm in the cellular MEK1 stability assay or the MEK1 efficacy assay (group 3 compounds). Cell penetration may be the likely reason for the lack of cell activity or lack of assay sensitivity for these types of compounds. The activity of Group 2 compounds identified at AZ, where cell-based activity was found for both the efficacy and biochemical MEK1 assays, but not the cellular stability assay, is likely due to compounds that inhibit MEK1 and penetrate cells, but do not appreciably stabilize MEK1. This illustrates the risk of false negatives in the MEK1 cellular stability assay similar to biochemical assays that measure protein stabilization such as DSF and underscores a reason why the cellular stability assay is better positioned as a secondary assay.
The benefit of a dual study as presented here is the generation and comparison of validated data from two independent laboratories, each employing slightly different approaches, but reaching the same conclusions. Overall, both laboratories found the MEK1-ePL cellular stability assay suitable to determine EC50 values, but the inherently low signal:background in this assay format limits the performance of the assay for a single-concentration-based screening. The Z-factors were often low ranging from 0.2 to 0.6. Control compound potency differences between the two laboratories and vendor reporter values (e.g., reported values of PD0325901 ranging between 1 and 30 nM), as well as differences in signal:background obtained for the G9a inhibitor UNC0638, illustrate the inherent variability that is sometimes observed in cell-based assays. We also noted a difference in the Hill slope for the MEK1-ePL assay using the PD0325901 (Fig. 2a) compared to what is provided on the vendor web page. These are likely due to subtle differences in cell assay handling/conditions, compound addition methodology, and sample storage conditions, which may also contribute. These data also begin to lend insight into how to gauge an assay's replicability and reproducibility. Both laboratories obtained replicable potency results through repeating the same experiment multiple times in their own laboratories; however, these potency results proved to be less reproducible when comparing the data between the two laboratories. Despite these differences, both laboratories were able to identify known MEK1 and G9a inhibitors in screens using these assays. In addition, in each study, the overall result that the control compounds are potent and selective inhibitors capable of stabilizing the cognate target in cells is reproducible.
Random screening with this assay may have marginal success given that compounds must have good cell penetration and intracellular potency to engage with the target in cells, as well as lead to measurable changes in protein stability. In our joint study, we found compounds that likely lacked one or more of these properties and, therefore, were not active in the cellular stability assay. Therefore, as mentioned above, the cellular stability assay is probably more useful for hit assessment downstream of a biochemical kinase assay to prioritize hits. In this mode, EC50s could be determined on compound sets and the data could be useful to rapidly filter kinase inhibitor hit lists and identify compounds that engage the kinase in cells. Compounds only active in the biochemical kinase assay could be considered in light of the structure-activity-relationships observed for the fraction of compounds showing activity in the cellular stability assay with consideration of the mechanism of inhibition.
The higher inhibitory activity observed in the MEK1 inhibitor-focused set (18%) compared to the MoA library (3%) does suggest destabilization of the MEK1-ePL construct is mediated by some MEK1 inhibitors. However, such inhibitory activity will need to be carefully considered and compared to the G9a assay to identify compounds that interfere with the assay system, as we found the most potent compounds from the MoA library in the MEK1-ePL assay were generally active in the G9a-ePL assay and other DiscoveRx cell-based assays. The low activity of the MoA library is surprising, but could be due to the short compound incubation time that will limit effects due to transcription/translation mechanisms, half-life of the ePL constructs, and the fact that the ePL-constructs are expressed from a foreign constitutively active promoter (cytomegalovirus promoter), which is not regulated by endogenous signaling pathways. The inhibitory response of MG132 in the MEK-ePL assay supports the existence of targets, where increased levels lead to destabilization of the MEK-ePL construct in cells. Inhibition of such destabilizing pathways would be expected to lead to an increase in signal in MEK-ePL cells. The lack of a stabilizing effect using the proteasome inhibitor MG132 may also suggest that the stabilization of MEK1-ePL in cells does not occur through prevention of degradation, but instead through a molecular chaperone effect where misfolded aggregates are prevented through stabilization of the native state in the presence of ligand. Our MoA library screen did not identify any mechanisms that showed an increase in signal in the MEK1-ePL cellular stability assay other than inhibitors of MEK1. The MEK1 inhibitors examined here covered several different chemotypes and the potency of compounds leading to signal increases in the MEK1-ePL cellular stability assay that generally tracked with the potency against the MEK1 enzyme. This supports that the stabilization of MEK1 in cells observed here is due to on-target inhibition.
Presently, it is not understood how changes in target stability upon ligand binding may affect compound pharmacology. For example, increases in levels of an inhibitor-bound enzyme complex may modulate auxiliary pathways if the enzyme also acts as a scaffold for proteins, and a large rebound effect may result upon removal of the inhibitor. Comparing compounds that change the stability of the target versus those that do not in relevant in vivo models would be of interest.
Footnotes
Acknowledgments
We thank Dr. David Farley (Novartis) for providing the MEK1 inhibitor list and associated biochemical data. We thank W. Adam Hill for support of this work at Novartis. We thank Tom Wehrman and Jennifer Lin-Jones (DiscoveRx) for advice on the assays and EAstern blot data. We thank Dr. Richard Ward (AZ) for providing the MEK1 and G9a inhibitor list. We thank Danielle Johnson (AZ) for helping to generate cellular data.
Disclosure Statement
No competing financial interests exist.