




Abstract
Leishmania species are sandfly-transmitted protozoan parasites that cause a spectrum of diseases, ranging from localized skin lesions to fatal visceral disease, in more than 12 million people worldwide. These parasites primarily target macrophages in their mammalian hosts and proliferate as non-motile amastigotes in the phagolysosomal compartment of these cells. High-throughput screens for measuring Leishmania growth within this intracellular niche are needed to identify host and parasite factors that are required for virulence and to identify new drug candidates. Here we describe the development of a new high-content imaging method for quantifying the intracellular growth of Leishmania mexicana parasites in THP-1 macrophages. Wild-type parasites were pre-stained with the fluorescent dye CellTracker™ Orange CMRA and used to infect THP-1 macrophages in 384-well plates. Infected and uninfected macrophages were subsequently stained with CellTracker Green CMFDA, allowing accurate quantitation of the number of parasites per macrophage using separate detector channels. We validated this method for use in high-content drug screening by examining the dose dependence of known anti-leishmanial drugs on intracellular growth. Unlike previous protocols, this method does not require the generation of transgenic fluorescent or bioluminescent parasite lines and can be readily adapted for screening different Leishmania species, strains, or mutant lines in a wide range of phagocytic host cell types.
Introduction
Protozoan parasites belonging to the genus Leishmania are the causative agents of a spectrum of human and animal diseases collectively termed leishmaniasis. Depending on the species involved and host responses, Leishmania infection can result in the development of localized cutaneous lesions through to the more serious disseminating mucocutaneous and lethal visceral forms of the disease. Human leishmaniasis represents a major global health problem, with more than 12 million people directly affected and 350 million people at risk of infection worldwide. 1 –4 There is currently no vaccine and the widely utilized chemotherapies are costly, toxic, and/or are being undermined by the emergence of resistance in clinical strains, highlighting the urgent need to identify new drugs.
Leishmania develop as extracellular flagellated promastigote stages in the digestive tract of their sandfly vector. Promastigotes are injected into the skin of the human or animal host during a sandfly bite and engulfed by macrophages and other phagocytic cells. Following their uptake into the phagolysosome of these host cells, promastigotes differentiate to small non-motile amastigotes that are able to proliferate within this hostile intracellular niche and perpetuate long-term infection. While a number of virulence determinants have been identified in the promastigote stages, 5 relatively little is known about the host or parasite factors that regulate intracellular amastigote growth and survival.
High-throughput screening (HTS) is increasingly being used to identify compounds that have antimicrobial activity or to investigate pathogen genes that regulate virulence. For example, a number of high-throughput phenotypic screens of compound libraries have been undertaken on cultured Leishmania promastigote or amastigote stages. 6 –8 However, a number of drugs that are effective at killing cultured parasite stages are much less effective when used to kill intracellular amastigote stages, and vice versa. 9 –11 This may reflect differences in the physiological state of axenic amastigotes versus true intracellular stages, 12 –14 differences in the nutrient and physical environment of in vitro culture versus in vivo, and modulation of drug availability by the host cell (e.g., membrane permeability and prodrug catabolism). Some drugs may also target amastigotes indirectly by inhibiting targets in the macrophage host.
To circumvent these shortcomings, a number of HTS methods have been developed that utilize ex vivo macrophage models. 15 –17 These screens generally employ transgenic Leishmania lines expressing either fluorescent (e.g., GFP) or bioluminescent (e.g., luciferase) reporter proteins and quantify intracellular growth in infected macrophages from total well fluorescence/luminescence, or the shift in host cell fluorescence by flow cytometry. 15,18 –25 However, per-well measurements cannot distinguish between intracellular and extracellular parasites, and in some studies, the reported IC50s for known drugs, using a flow cytometry-based method, are considerably greater than those reported with other assays. 21
More recent studies have used high-content screening (HCS) approaches to monitor the intracellular growth of transgenic parasite lines within individual macrophages, providing greater insights into host–parasite interactions and drug toxicity. 10,15,16,26 However, the creation of suitable transgenic parasites for these HTS and HCS assays can be time-consuming and is often associated with a progressive loss of virulence. 27
As an alternative to using transgenic parasite lines, a number of HTS methods have stained the host or parasite with nuclear stains (e.g., 4′, 6-diamidino-2-phenylindole [DAPI]) or used synthetic nucleosides (combined with fluorophore-conjugated anti-BrdU antibodies). 9,28 These methods, while advantageously employing wild-type parasites, can lead to an underestimate of parasitemia in cases where Leishmania and the host nuclei colocalize (or near colocalize). Furthermore, distinguishing between host nuclei/parasite nuclei and extracellular parasites requires complicated and time-consuming image analysis. Alternate read-outs for infection, such as host vacuole formation, have also been used. 26 Hence, a HCS approach that accurately and specifically quantifies intracellular wild-type Leishmania parasites within viable macrophage host cells (at a per-cell level) is needed.
We report in this study, a new HCS method in which promastigote or amastigote stages are pre-stained with CellTracker™ Orange CMRA and used to infect THP-1 macrophages. When combined with viability staining of the host THP-1 cells, the approach offers a means to measure macrophage survival and accurately delineate the cytoplasm of even irregularly shaped host cells, thereby allowing the reliable exclusion of extracellular parasites. The scaling of this novel approach to a 384-well plate format, in conjunction with automated liquid handling (using Caliper Sciclone ALH3000 and BioTEk EL406 robotics), fully automated integrated microscopy (Cellomics ArrayScan VTI), and image processing with the Cellomics Colocalization V4 BioApplication, makes this approach amenable to screening novel compounds against the intracellular amastigotes. We demonstrate this capability using the known gold standard anti-leishmanicidals—amphotericin B and miltefosine.
Materials and Methods
Cell Culture
Leishmania mexicana wild-type parasites (MNYC/BZ/62/M379) were routinely passaged (twice weekly at 100-fold and 1,000-fold dilution) in RPMI 1640 (pH 7.4, Catalog number: 11875-119, hereafter RPMI; Life Technologies) medium supplemented with 10% heat-inactivated fetal calf serum (iFCS, Catalog Number: SFBS-F; Bovogen Biosciences) at 27°C. Stationary-phase promastigotes were harvested 5 days after passaging (∼2×10⁷ cells/mL). Axenic amastigotes were obtained following the differentiation of stationary-phase promastigotes in a fresh medium (SDM-79, supplemented with 20% iFCS, pH 5.5), for 4 days at 33°C. Parasite aliquots were stored frozen at −80°C and thawed 1 week before use for infection.
THP-1 monocytes were cultured in RPMI supplemented with 10% iFCS at 37°C and 5% CO2 (95% humidity). Cells were maintained in stationary growth phase (2×10⁵–1.2×10⁶ cells/mL) and fresh aliquots were thawed weekly. THP-1 cells were used after three passages. Differentiation to macrophage-like cells was performed by the addition of 50 ng/mL phorbol 12-myristate 13-acetate (PMA, P1585; Sigma-Aldrich).
Leishmania Staining for Non-Automated Microscopy
L. mexicana promastigotes and amastigotes were stained with CellTracker Orange CMRA (C34551; Life Technologies) or 5(6)-CFDA, SE (carboxyfluorescein diacetate, succinimidyl ester, mixed isomers, C1157; Life Technologies) (Table 1). For imaging, stained promastigotes and amastigotes were washed once with phosphate-buffered saline (PBS), immobilized on glass coverslips (Poly-L-lysine solution, 0.01% (w/v) in H2O, P8920, Sigma-Aldrich; coated coverslips were air-dried before use), and imaged (Axioplan 2 fluorescence imaging microscope, fitted with a Zeiss MRm CCD camera using a 63× objective; Carl Zeiss).
Leishmania Staining Protocol for Non-Automated Microscopy
iFCS, heat-inactivated fetal calf serum; PBS, phosphate-buffered saline.
Infection Assay for Non-Automated Microscopy (24-Well)
THP-1 monocytes (5×10⁵ cells/mL) in RPMI supplemented with 10% iFCS and PMA (50 ng/mL) were plated (0.5 mL/well) into a 24-well plate containing round glass coverslips (10 mm) and incubated at 37°C with 5% CO2. After 16 h, cells were infected at 10:1 multiplicity of infection (MOI) with fluorescent parasites (stained as per Table 1) for 24 h. Infected macrophages were washed with PBS (three times, pre-warmed PBS, to remove non-internalized parasites) and suspended in fresh media (10% iFCS RPMI). Infected macrophages were incubated at 33°C (5% CO2, 95% humidity) and fixed at day 1, 4, or 7 post-infection in 4% paraformaldehyde (15 min, room temperature [RT]) and stained with 20 μM Hoechst 33342 (PBS, 10 min, RT, H3570; Life Technologies) before mounting in Mowiol or 1% (w/v) low-melt agarose. Images were captured on a Zeiss Axioplan fluorescence microscope as above.
Infection Assay for High-Content Screening (384-Well)
For HCS, the above plating and staining methodology was adapted for use with 384-well plates and automated image acquisition and analysis. Details of the protocol are given in Table 2. Host cells were stained with CellTracker Green CMFDA (CFMDA, 5-chloromethylfluorescein diacetate, C2925; Life Technologies) and DAPI (10236276001; Roche).
High-Content Imaging for Leishmania-Infected THP-1 Cells
1. Corning COSTAR clear-bottom, black wall 384-well plates (Catalog #3712).
3–21. These steps should be protected from light. We recommend using a biosafety hood without direct light.
21. Cellomics Colocalization V4 BioApplication (Cellomics; Thermo Scientific).
MOI, multiplicity of infection; PMA, phorbol 12-myristate 13-acetate; ROI, region of interest.
Image Acquisition and Processing
Image acquisition and processing were performed using the Cellomics ArrayScan VTI with 20× objective. ROI_A_Target_II (defined region of interest [ROI] A) measures intracellular amastigotes.
Infection Titre Evaluation
THP-1 monocytes were plated as described in the HCS method (Table 2, steps 1–2). After 24 h, the medium was aspirated using a BioTek EL 406 liquid handling robot and replaced with pre-stained amastigotes at an MOI of 1, 3, 5, 10, 30, 50 (well volume made up to 50 μL with RPMI supplemented with 10% iFCS); higher MOIs (30, 50) were dispensed at a five-fold greater cell concentration. Following a 24-h incubation (33°C, 5% CO2, 95% humidity), wells were washed with PBS and fresh medium was supplied (Table 2, steps 5–7). After an additional 3 days, cells were stained, fixed, and imaged as described (Table 2, steps 8–21; Tables 3 –5).
Cellomics Imaging Parameters
Cellomics Colocalization V4 Image Analysis Parameters
Cellomics Colocalization V4 Exported Parameters
Absolute intensity values vary with changes in exposure.
Drug Assays
Master drug plates were created with two-fold serial dilutions over nine dose points with four replicate wells using the Caliper Sciclone ALH 3000 workstation. Initial drug concentrations were as follows: 2 μM amphotericin, 50 μM miltefosine, and 40 μM antimycin A; DMSO control at 0.33%. Drugs were administered twice (24 and 89 h after infection) (Table 6). Plates were stained, fixed, and imaged 6 days post-infection, using the methods described (Table 2, steps 10–21; Tables 3 –5).
High-Content Drug Assay for Leishmania-Infected THP-1 Cells
Results
Stain and Developmental Stage Selection
To develop a HCS protocol that did not require the generation of transgenic Leishmania lines and was suitable for measuring the intracellular growth of the parasite, we stained two L. mexicana developmental stages with a number of different cytoplasmic dyes before infecting macrophages. The selected dyes are commonly used to not only monitor cellular replication rates, based on the halving of average fluorescence with each division, but may also be used to track relatively slow growing cells such as intracellular Leishmania (Fig. 1A). 13 The fluorescent dyes, 5(6)-CFDA, SE and CellTracker Orange CMRA, were both found to give strong cytoplasmic (and flagella) staining of stationary-phase promastigotes and amastigotes.
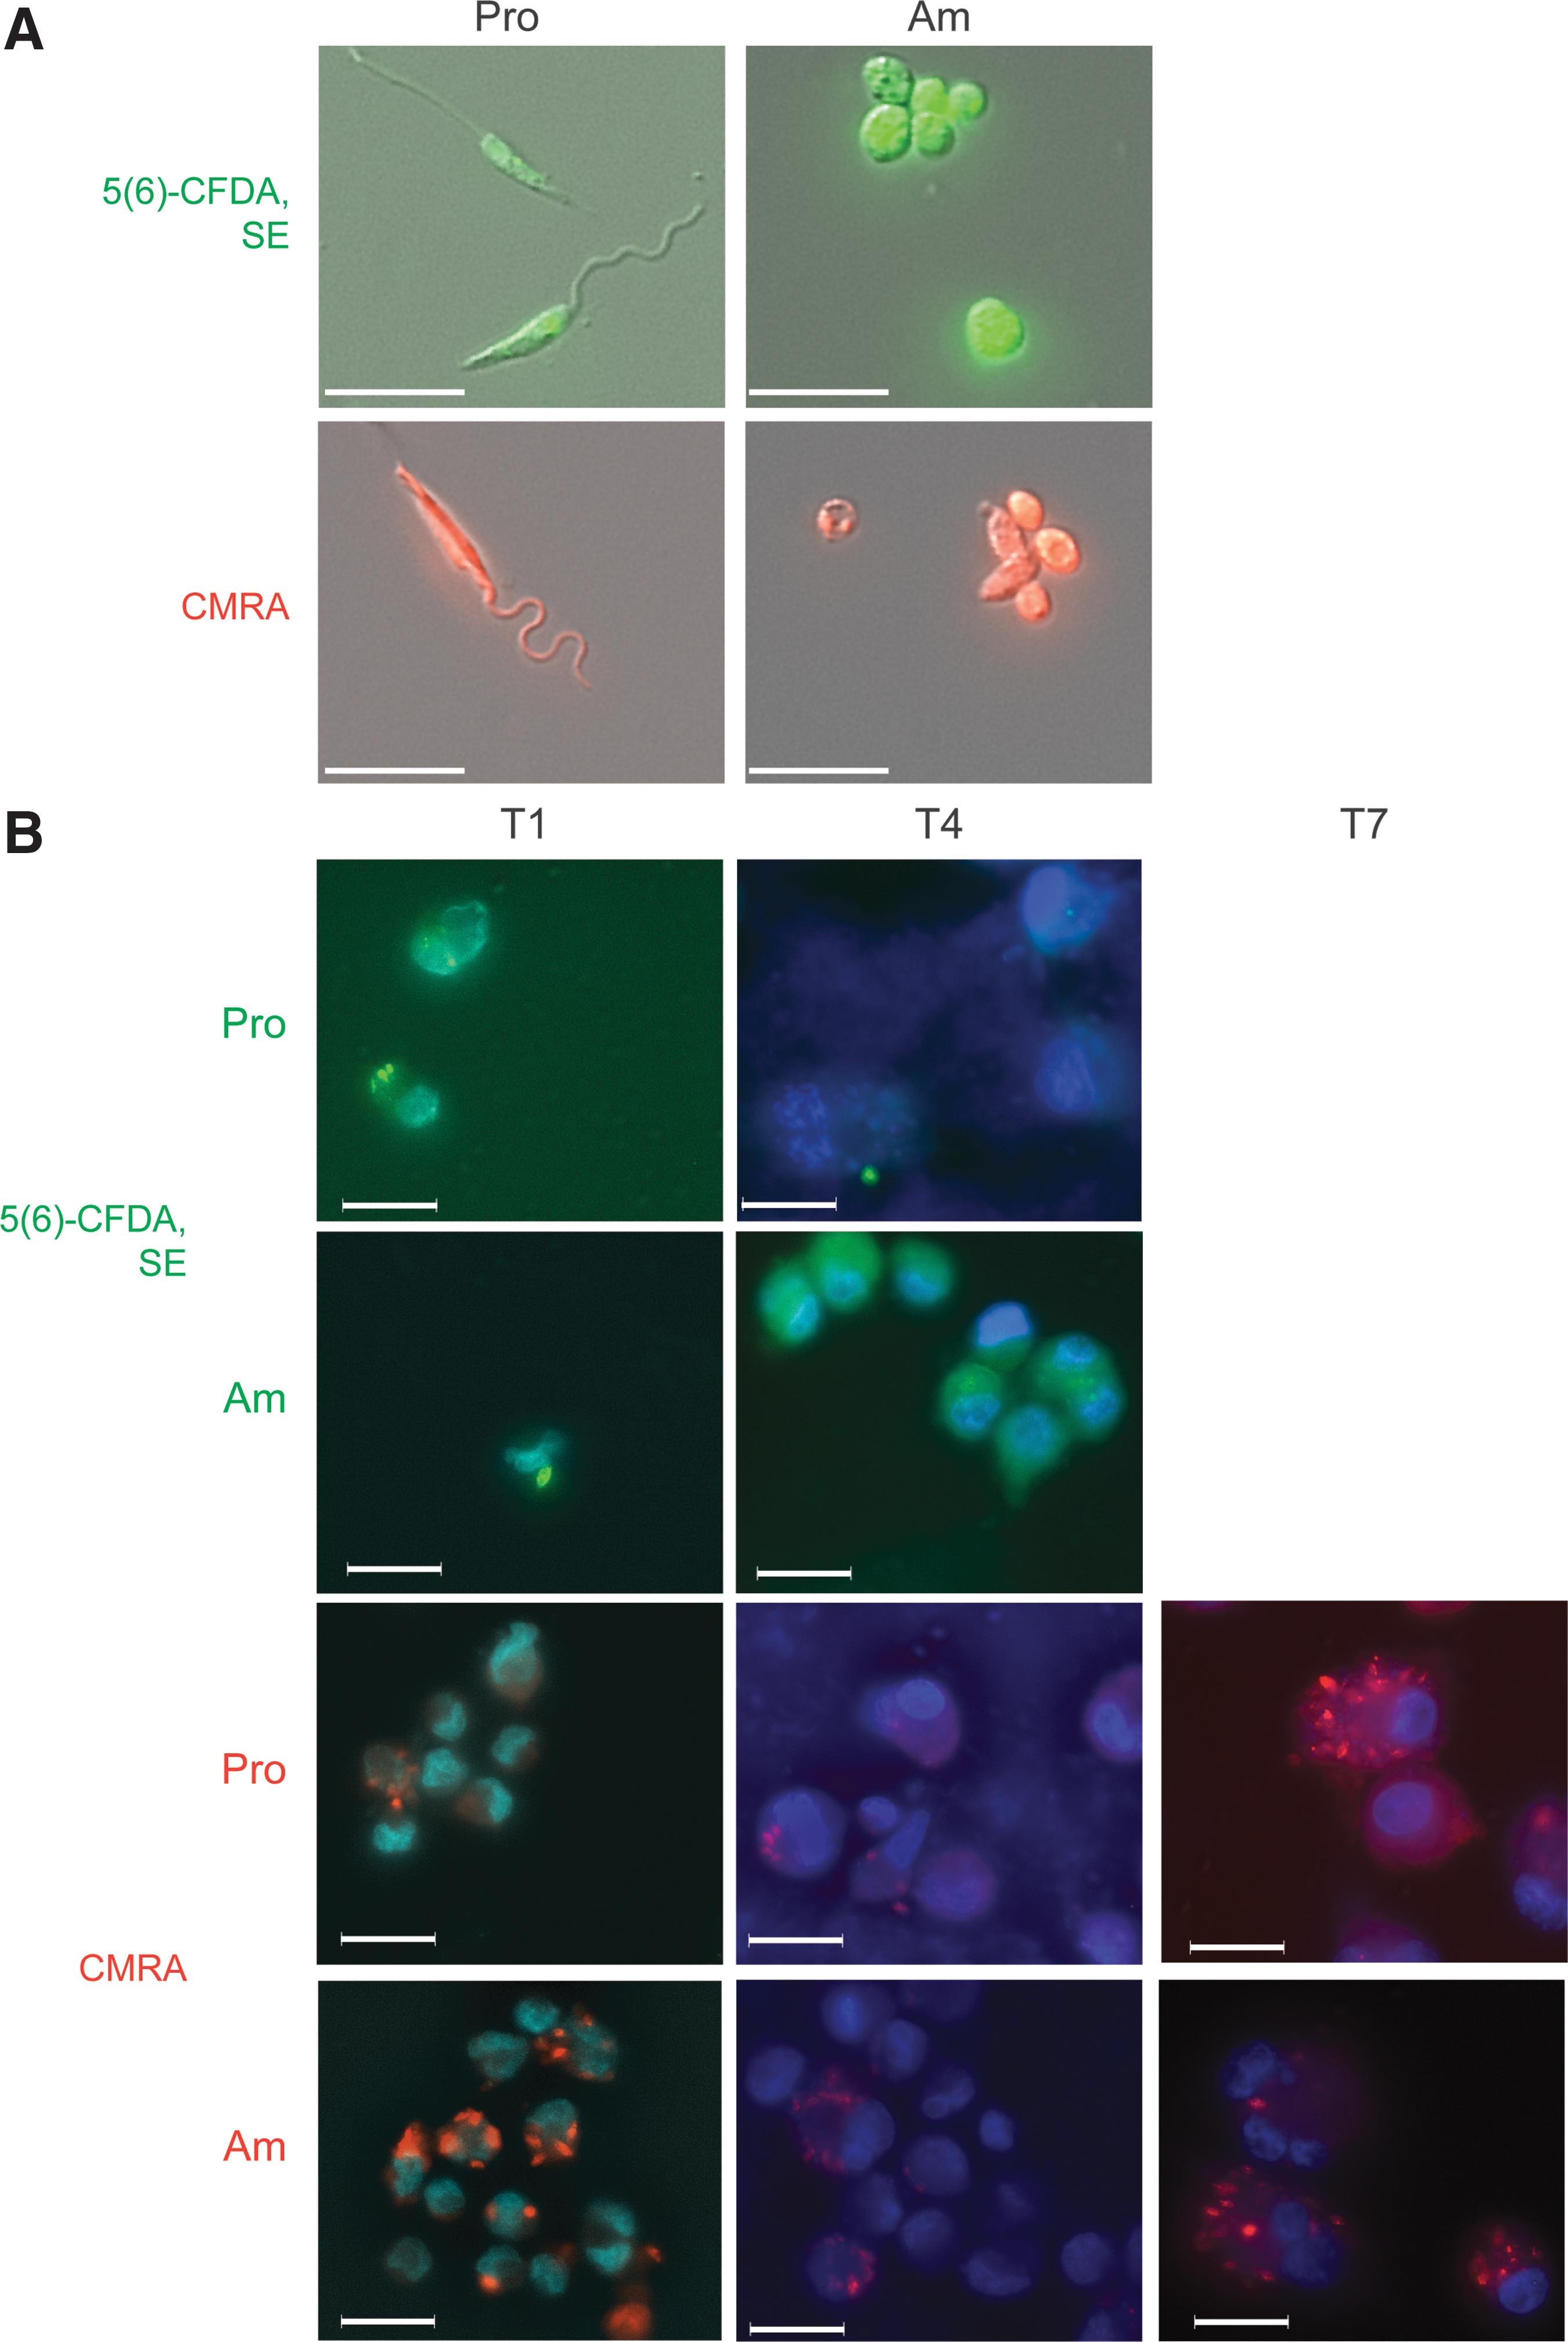
Microscopy of fluorescently stained Leishmania mexicana before and after host cell invasion.
To investigate whether stained parasites could be detected following uptake and replication in macrophages, the human monocyte line, THP-1, was induced to differentiate to macrophage-like cells with PMA for 24 h and then infected with pre-stained L. mexicana promastigotes and amastigotes. Coverslips with the adherent host cells were fixed and imaged to monitor L. mexicana invasion/proliferation and the retention of the fluorescent dyes at indicated time points post-infection (Fig. 1B).
Imaging revealed that 5(6)-CFDA, SE pre-stained promastigotes and amastigotes, although initially highly fluorescent, gave a weak and diffuse fluorescence, which had spread into the host cell cytoplasm by day 4, thereby making the stain a poor choice for tracing infection long term. In contrast, promastigotes and amastigotes stained with CellTracker Orange CMRA were clearly observed in the host macrophage at 7 days post-infection. Intracellular parasites were identified based on their morphology and distribution within large communal vacuoles within the host cell. Co-staining with Hoechst 33342 confirmed that the CMRA-positive bodies contained the distinctive nuclei and juxta-flagellar kinetoplastid DNA staining expected of amastigote stages (data not shown). Higher parasite proliferation rates were observed when infections were initiated with amastigotes, compared to promastigotes, which reflects the absence of the time lag associated with differentiation of internalized promastigotes to amastigotes.
High-Content Image Acquisition and Analysis
The in vitro infection assay established above was subsequently adapted for HCS in a 384-well plate. Automated liquid handling (BioTek EL 406) was used for cell and media dispensing. High-content imaging was performed using the Cellomics ArrayScan VTI platform as outlined in Tables 3 –5.
The high-content imaging protocol, based on the Cellomics Colocalization V4 BioApplication, was developed for two imaging parameters: segmentation of host cells and detection of intracellular amastigotes (Tables 3 and 4). The imaging strategy is depicted in Figure 2A. For each field, the focal plane was determined (Fig. 2A-I) based on DAPI staining of the host cell nuclei (Channel 2). The boundary of viable macrophages (host cell segmentation) (Fig. 2A-II) was defined by the staining of host cells with CellTracker Green CMFDA (Channel 1) before fixation. A valid host cell was defined as an object with a total area greater than 650 pixels (∼209.6 μm2); cells overlapping the edges of imaging fields were excluded.

Imaging protocol for detection of intracellular amastigotes.
A cell density of 6,000 cells per well was selected, giving ∼75% confluence; higher cell densities resulted in near-total confluence and led to difficulty segmenting discrete cells. Detection of intracellular amastigotes was achieved by measuring the MEAN_ROI_A_Target_II_ObjectCount, which identified objects in Channel 3 that corresponded to fluorescence from the CellTracker Orange CMRA. Objects in this channel were restricted to individual host cells by limiting enumeration to an ROI defined by the Channel 1 host cell mask (Fig. 2A-III, IV), thereby preventing the quantitation of extracellular amastigotes.
Amastigote detection was further refined through the application of cutoffs, which restrict Channel 3 valid objects to between 6 and 56 pixels in size (∼1.9–18 μm2) and a length to width ratio of 1:2.2. Imaging was restricted to the central 25 fields of each well. The resulting image processing algorithm robustly segments individual viable host cells and allows the detection and quantification of intracellular parasites. Figure 2B is a representative image field displaying raw images from the three imaging channels, with host and parasite cell masks overlayed, following application of the image processing algorithm. A composite RGB image shows the overlay of all three imaging channels.
To evaluate the ability of the imaging protocol to quantify variations in parasite burden, we selected the “average amastigotes per-cell” parameter (MEAN_ROI_A_Target_II_ObjectCount) as the key per-well measure of infection and compared measurements for different MOIs (ranging from 0 to 50) (Fig. 3A). Uninfected cells showed almost no signal, indicating a very low false-positive rate for amastigotes. Within the range of 1–10 MOI, the average number of amastigotes per cell increased proportionally to the initial dose of amastigotes, while for higher MOIs (>10), the increase became nonlinear, possibly reflecting a fundamental limitation of parasite uptake. Furthermore, irrespective of MOI, the host cell numbers remained similar (Fig. 3B). We selected an MOI of 10 for subsequent experiments as it affords the observation of both positive and negative changes in infection, avoiding the plateauing of parasite counts observed at higher MOIs.
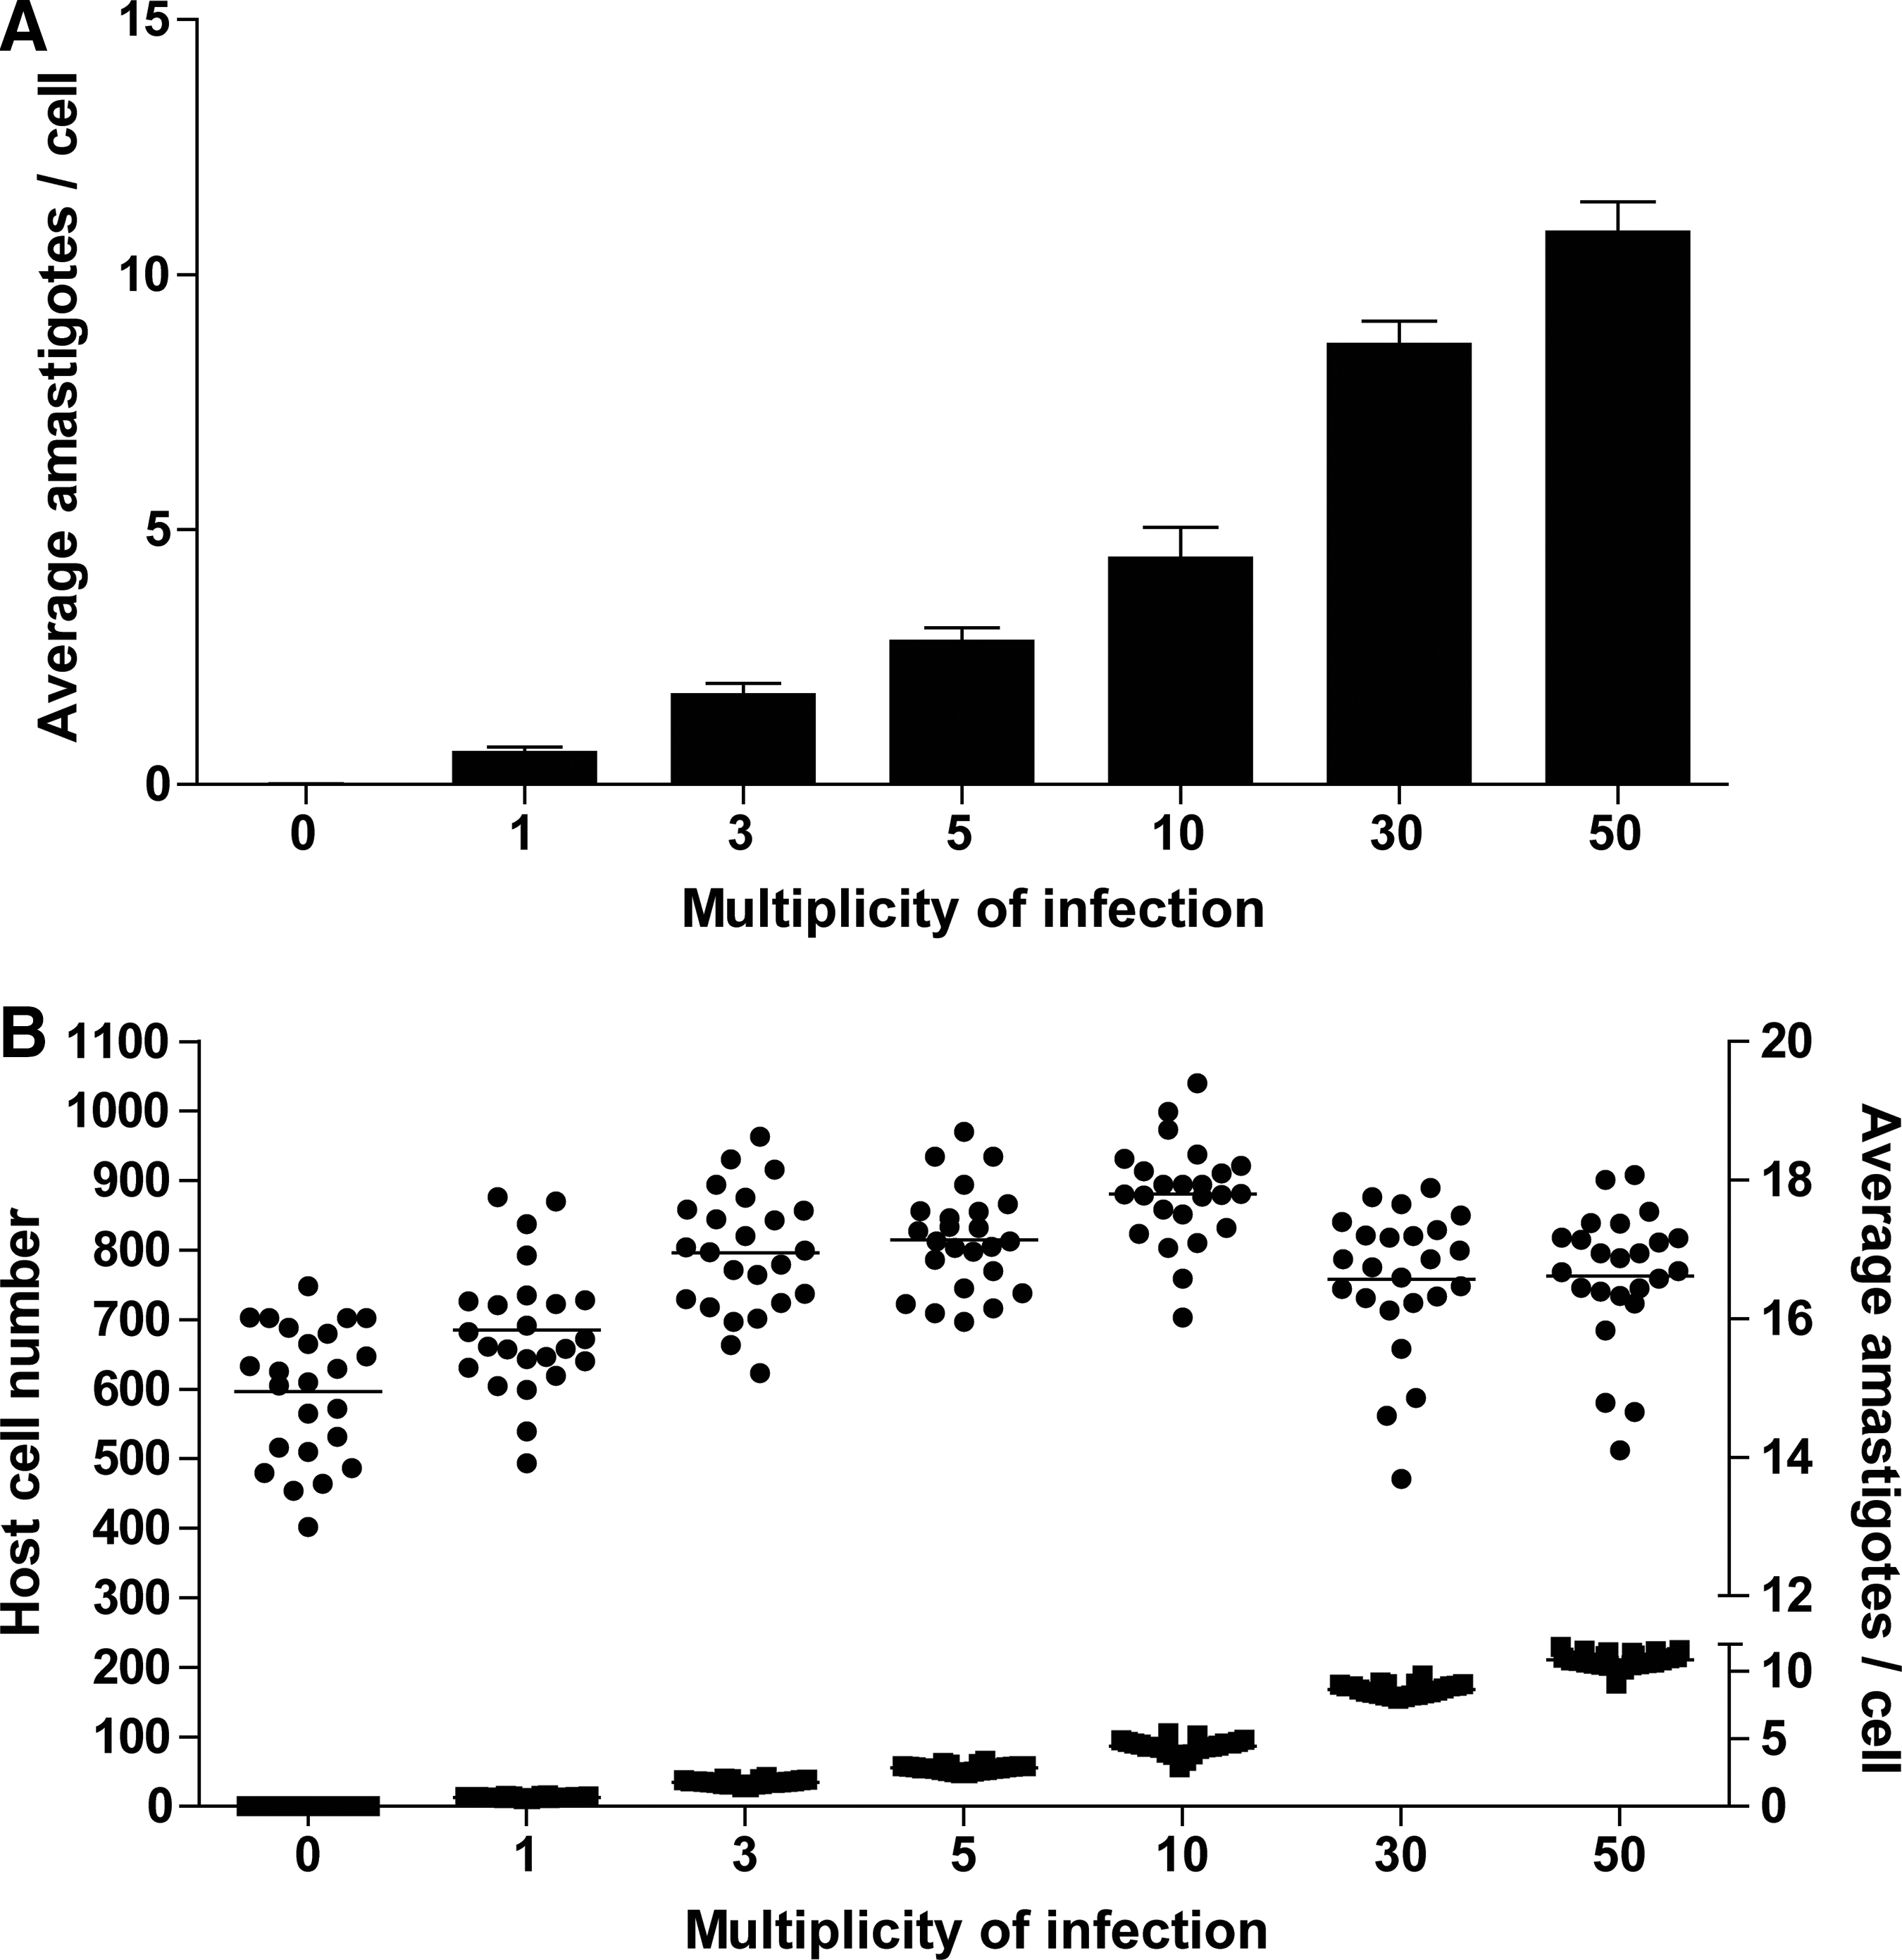
Quantification of L. mexicana infection.
This HCS approach also affords a per-cell measure of parasite burden, such as a frequency distribution analysis of parasite burden. This is demonstrated in the frequency distribution of infection for MOI 0, 1, 10, and 50 (Fig. 4A–D, respectively), calculated from cells in 24 wells per condition. This parameter can be useful when similar average infections mask significant differences in infection frequency and parasitemia.
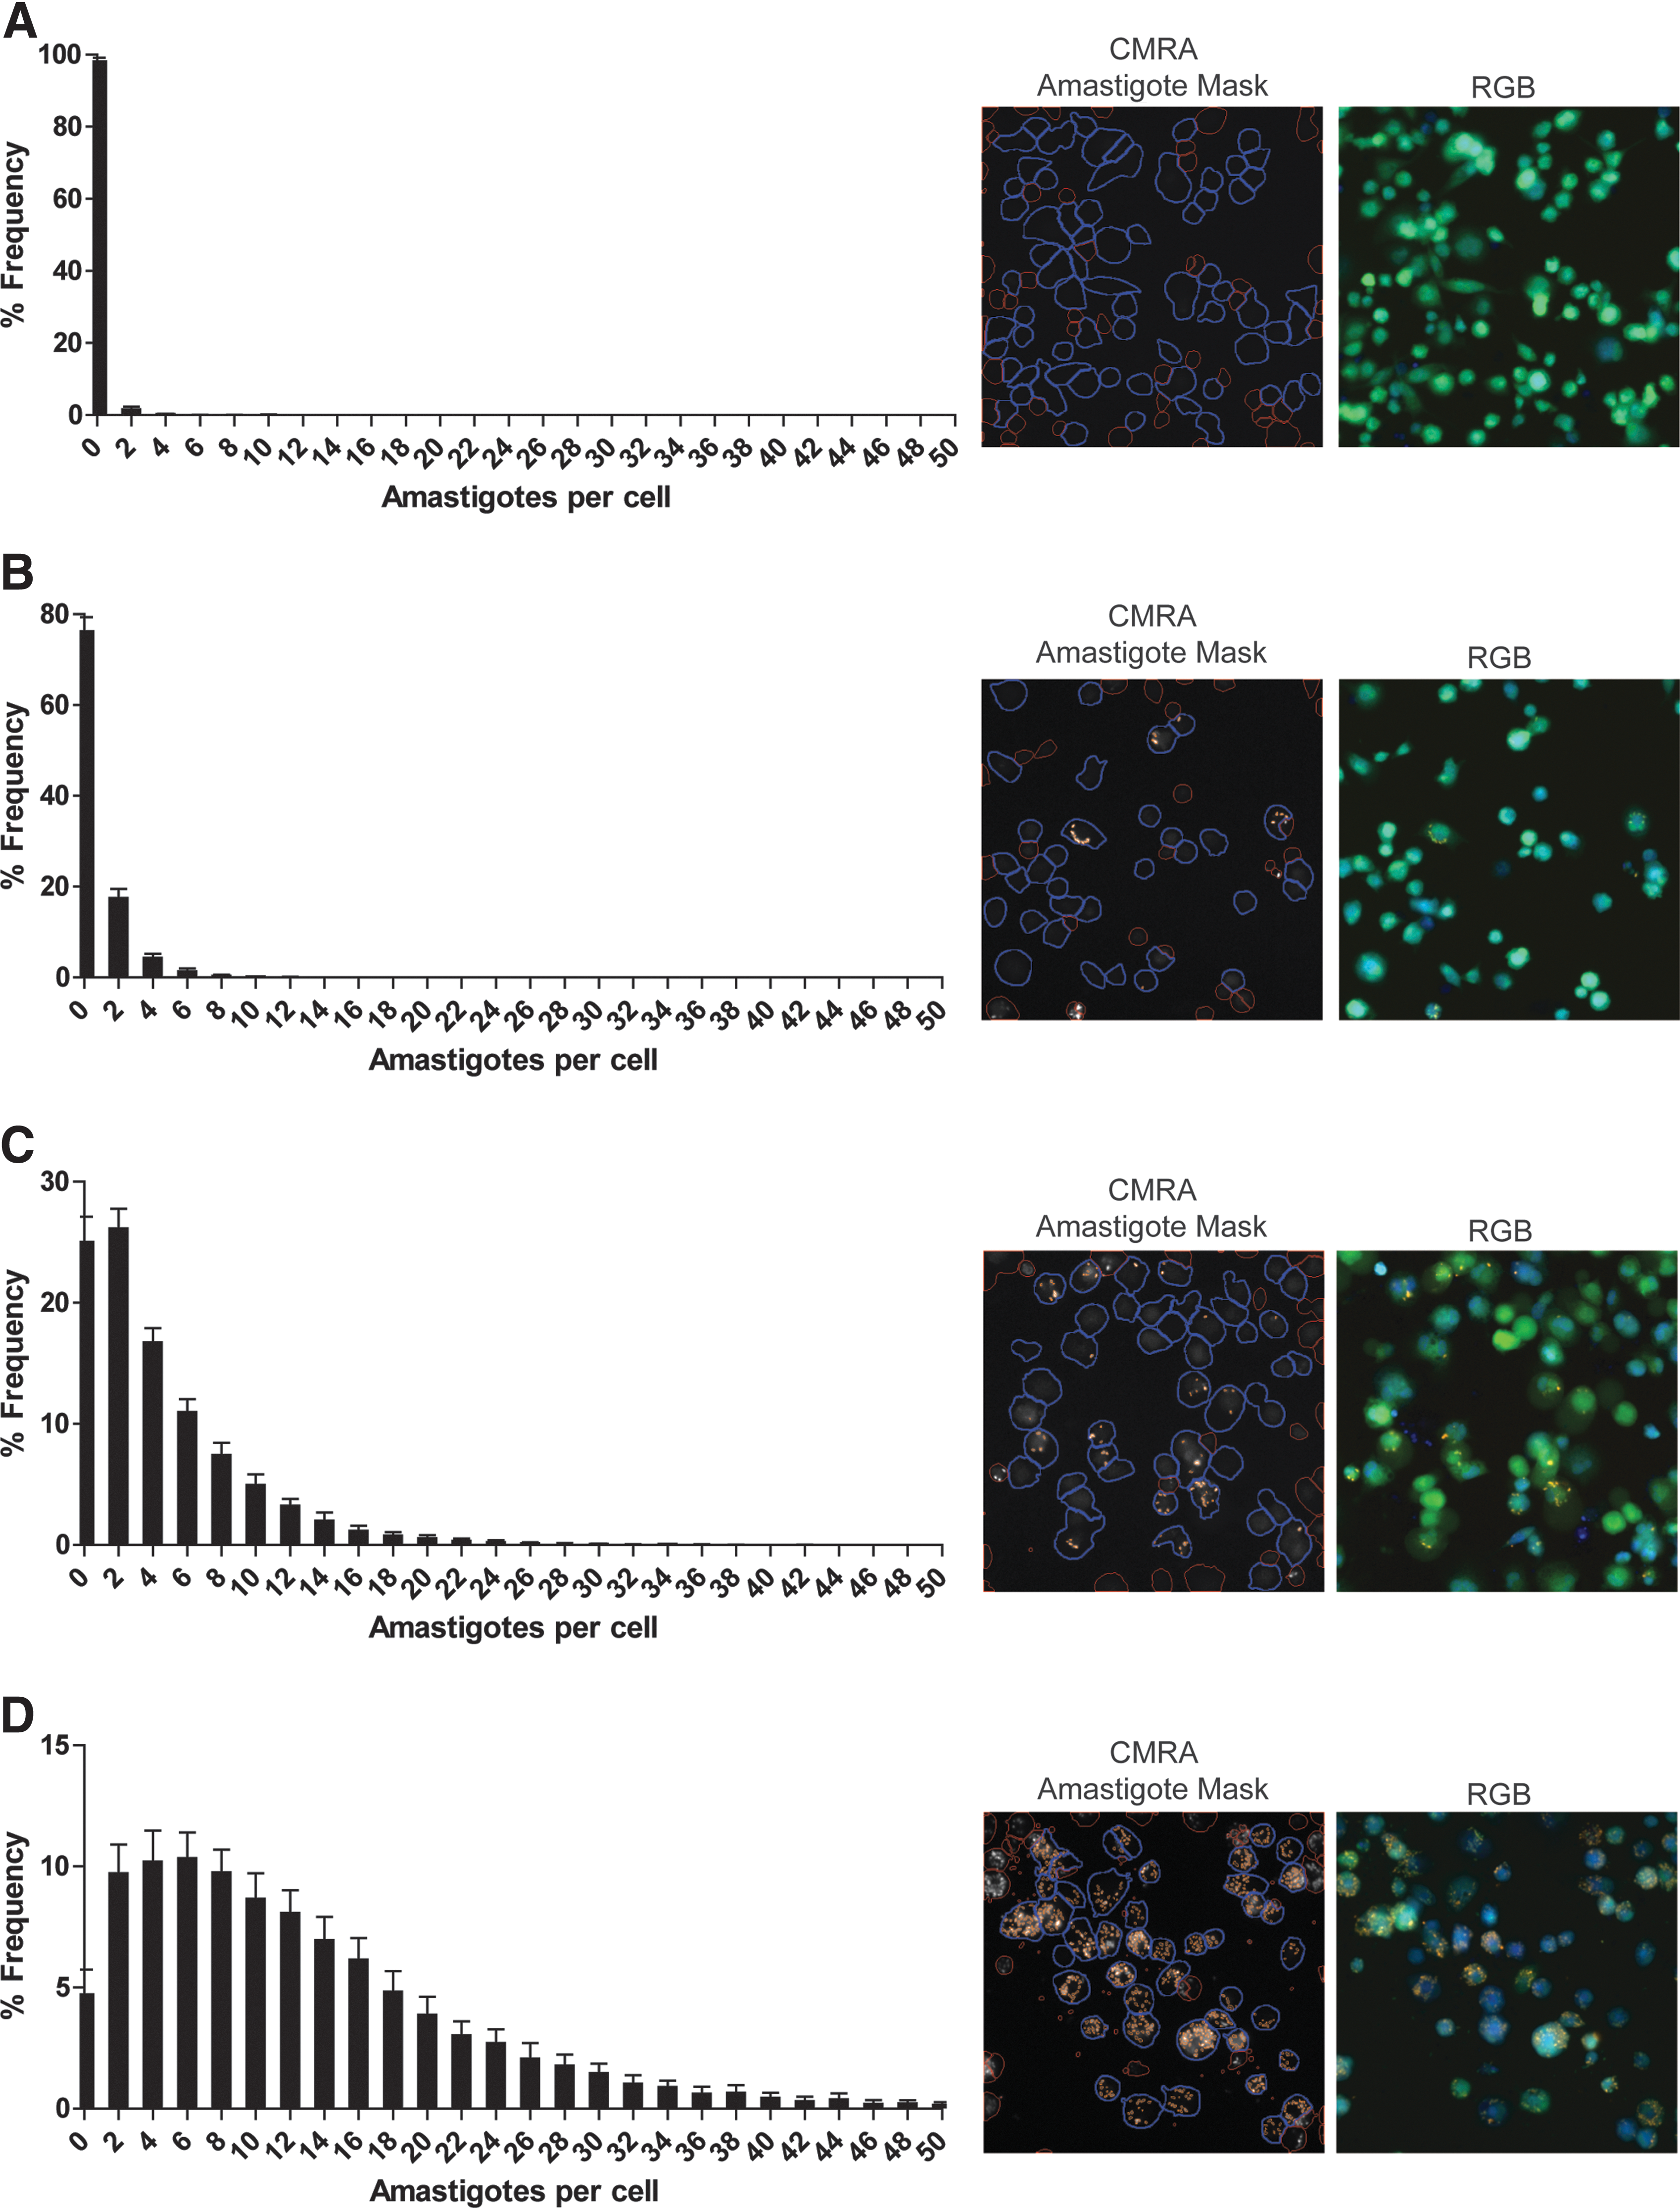
Per-cell quantification of L. mexicana infection. Host cells were infected for 24 h with CellTracker Orange CMRA-stained amastigotes at selected MOI: 0
Furthermore, we evaluated the retention and stability of the fluorescent stains following fixation (Fig. 5). Host cells stained with CellTracker Green CMFDA show a small decrease (15%) in average stain intensity in the first 12 h, after which the signal remains stable (Fig. 5A). The total cell number was not affected even over long periods (42 h), but the minor decline observed for the total cell area after 24 h suggests that extended delays between staining and imaging may impact on host cell identification. After a small initial drop in average parasite signal intensity with the first 12 h, the average intensity of parasite staining was stable beyond 12 h, with no change in average parasite count observed between 12 and 42 h (Fig. 5B).
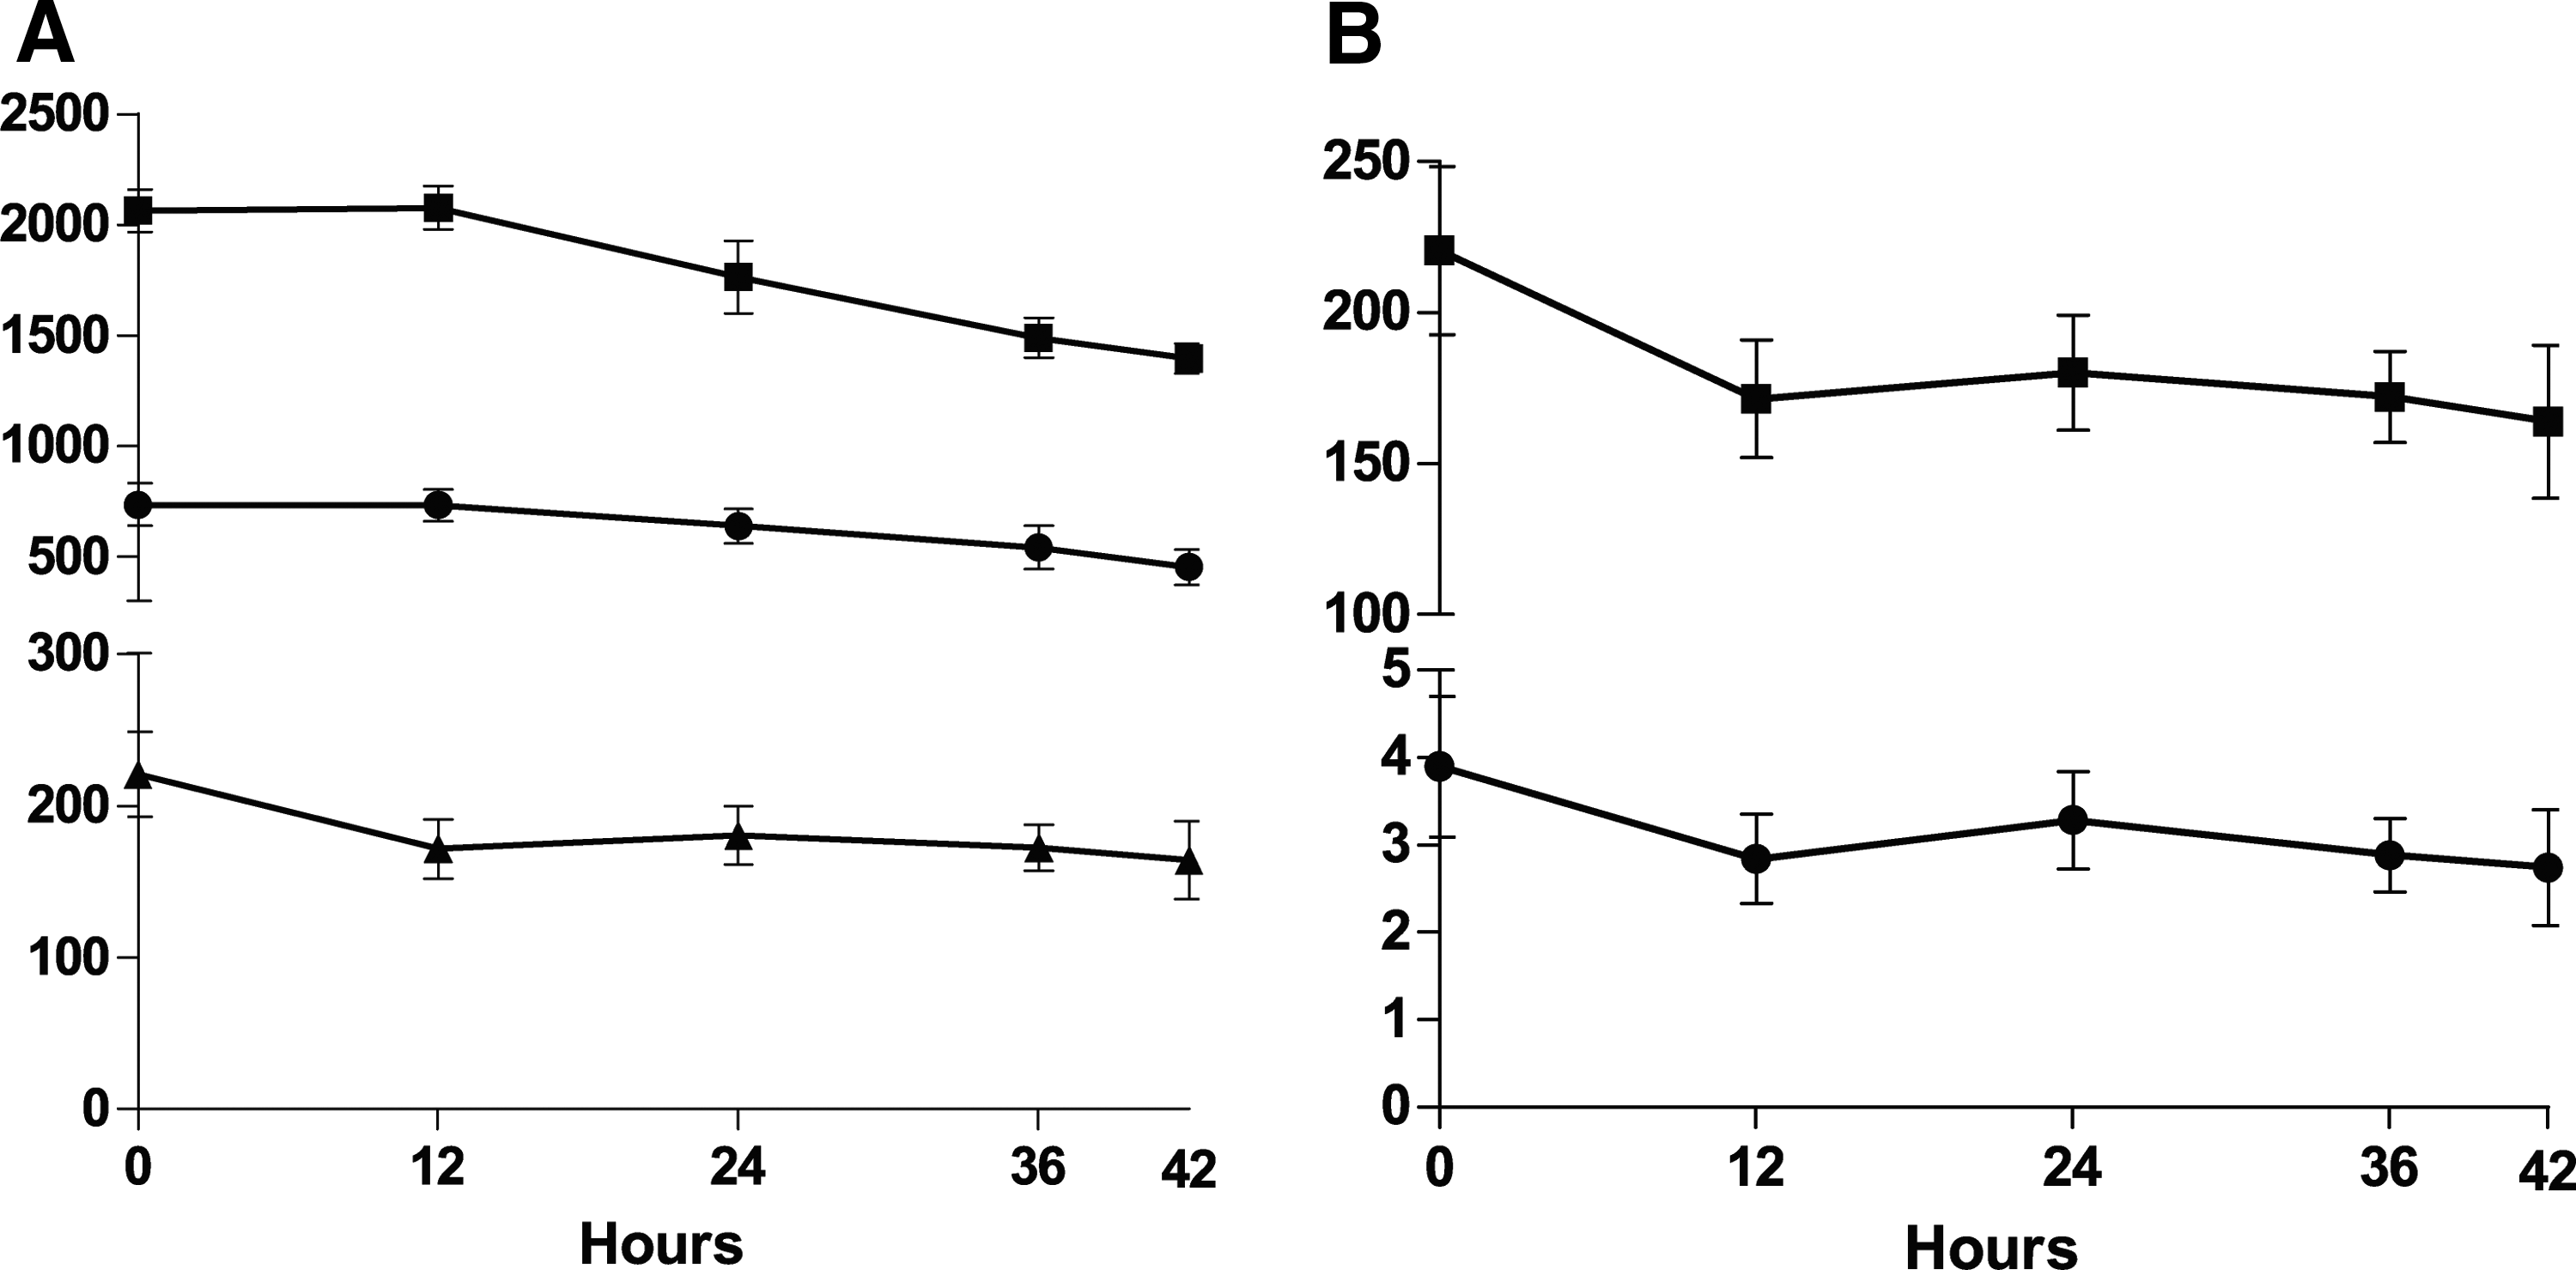
CellTracker Orange CMRA and CellTracker Green CMFDA staining is stable for over 42 h postfixation. Host cells were infected for 24 h with CellTracker Orange CMRA-stained amastigotes at an MOI of 10. After washing, host cells were maintained for 4 days before staining. Multiple plates were imaged (one per time point) up to 42 h after fixation. Data are presented as the average of 28 wells (technical replicates) per time point from a representative experiment; error bars±SD
HCS Following Drug Administration
Using the HCS method, we measured the dose effect of a panel of drugs on the average amastigotes per cell. Infected THP-1 cells were treated with drug on day 1 and 4 post-infection and imaged on day 6 (Table 6). For three selected drugs, amphotericin B, miltefosine and antimycin A, a dose-dependent decrease in average amastigotes per cell was observed (Fig. 6A). Calculated EC50 for amphotericin B (0.5066 μM) and miltefosine (2.679 μM) was similar to results published for other Leishmania species. 10,29 An EC50 of 1.019 μM was observed for antimycin A; this is comparable to the GI50 (50% growth inhibition) concentration for antimycin A treatment previously reported for intracellular L. donovani in THP-1 cells. 9
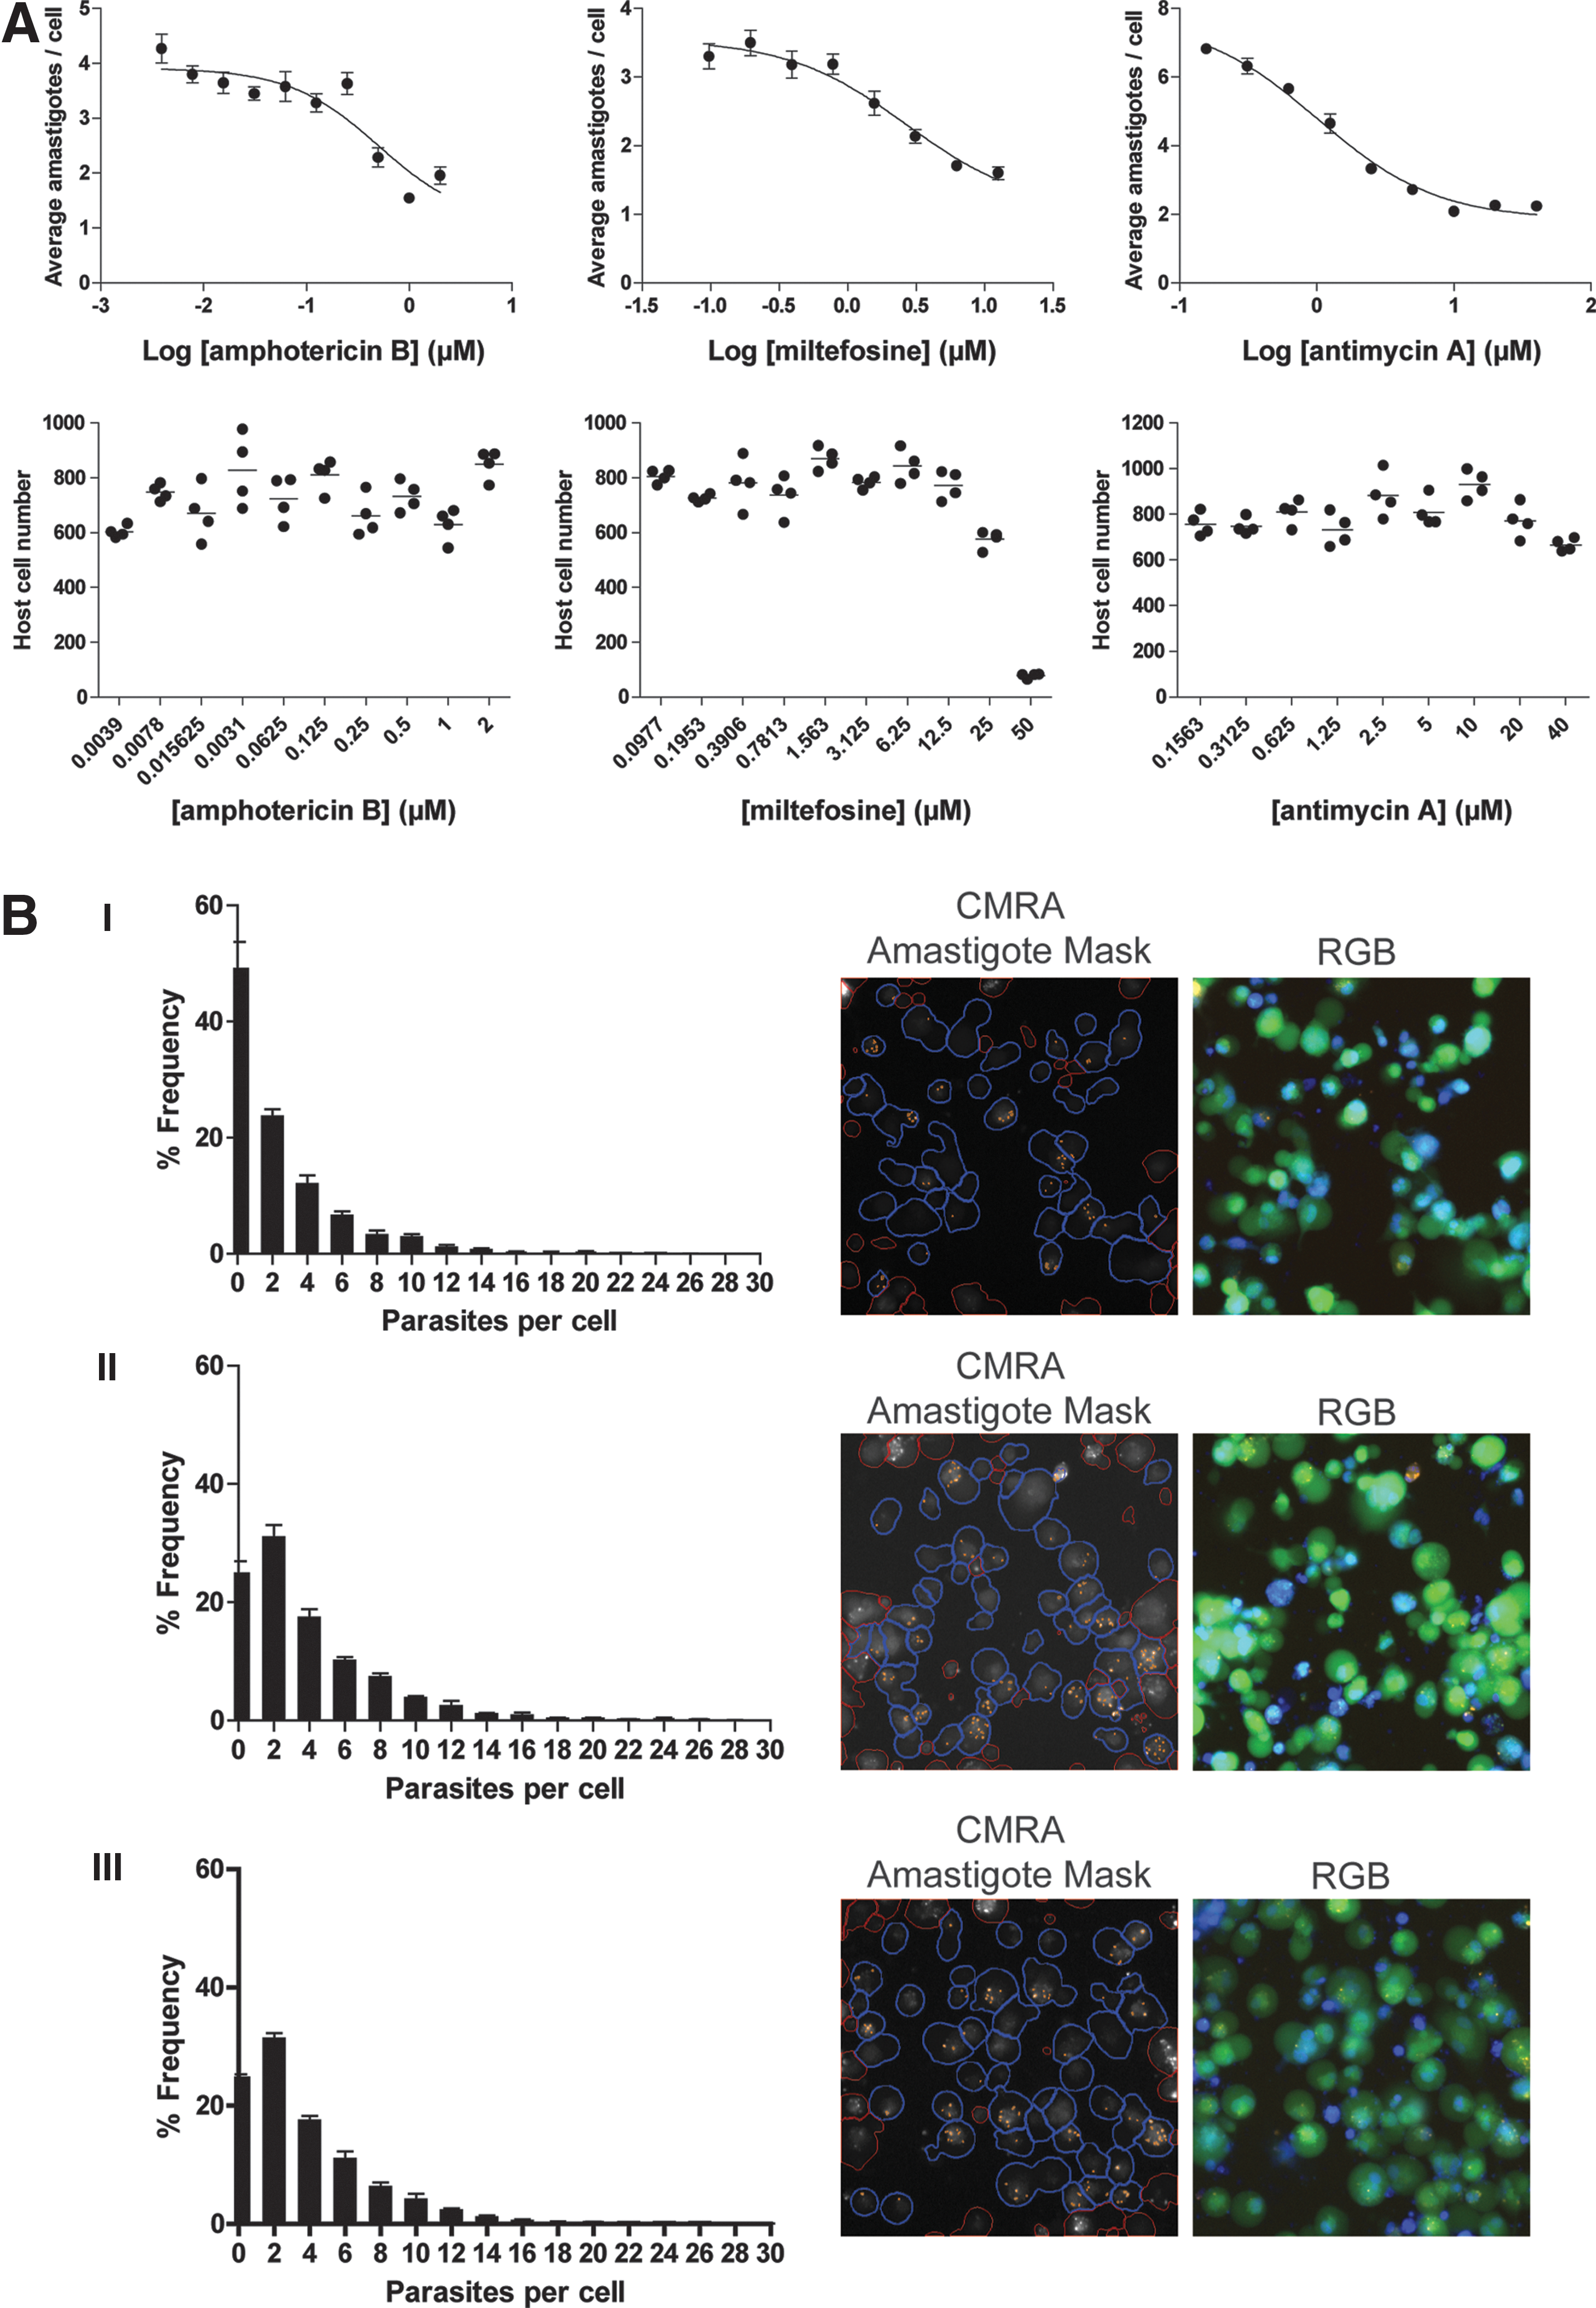
L. mexicana infection following drug treatment.
THP-1 cell numbers were slightly positively impacted by amphotericin B addition (∼1.16-fold, comparing highest and lowest concentrations), 9 and a mild negative impact was observed with antimycin A (∼0.88-fold, comparing highest and lowest concentrations). 10 Miltefosine has previously been shown to cause death to THP-1 cells at higher concentrations, and this was also observed (>90% cell death at 50 μM) (Fig. 6A). 10 It was also apparent that the host cell area appears to be reduced following drug treatment (data not shown).
A difference in the frequency distribution of parasite burden was apparent between the high and low concentrations of amphotericin B (2 and 0.125 μM) (Fig. 6B-I, II) and no difference was observed in the parasite distribution between the DMSO control and the low amphotericin B treatment (Fig. 6B-III). At the highest concentration of drug, a greater proportion of cells remained free of parasites, and a reduced number of high-parasitemia cells were observed (Fig. 6B-I); this is reflected in the representative image, which shows a decreased detection of CMRA-positive parasites by the imaging processing algorithm.
Discussion
The development of new HCS methods for measuring intracellular Leishmania growth and survival will greatly facilitate efforts to identify new compounds with anti-leishmanial activity in large phenotypic screens. High-throughput assays are also increasingly being used to undertake genome-wide siRNA screens to identify host genes that impact on the virulence of intracellular pathogens. 30 –34 In this study, we have established a novel vital staining protocol for tracking the proliferation of live amastigotes in THP-1 macrophages.
This protocol exploits the fact that Leishmania amastigotes undergo relatively few divisions during the course of a 4–10-day infection experiment (thereby minimizing dilution of the stain). Pre-staining of parasites offers several advantages over the use of transgenic lines expressing fluorescent proteins. All parasites are stained to similar intensity and parasites freshly isolated from animal models can be used without the loss of virulence that can result from protracted in vitro culturing during the generation of transgenic lines. 27
We found that CellTracker Orange CMRA was the most suitable stain for both promastigotes and amastigotes. CMRA is well retained by intracellular amastigotes 7 days after infection and is stable for 2 days following cell fixation. In comparison, the 5,6-CFDA, SE is poorly retained and is unsuitable for use in long-term tracing of intracellular amastigote proliferation. As expected, intracellular amastigotes give a slightly weaker signal when stained as promastigotes than when stained as amastigotes. However, in both cases, the signal intensity allows for high-content imaging.
To verify the validity of the pre-staining approach, we compared the parasite burden under different MOIs and obtained a proportional increase in intracellular parasites relative to MOIs 1–10, plateauing at the highest MOI (>10). The average number of amastigotes per cell provides a general readout of infection and is adequate for assessing the overall parasite burden. However, the per-cell data available from this high-content approach reveal that on average approximately one-fifth of cells remain uninfected at an MOI of 10. The resulting distribution of parasites per cell is broad and skewed heavily toward low infections (<6 parasites per cell), but with a long tail that shows some highly infected cells. Unlike approaches using DAPI alone to identify parasites within host cells, 9 this method is able to detect parasites that are located close to host cell nuclei.
As proof-of-principle, we subjected infected host cells to multiple concentrations of known anti-leishmanial drugs. We observed a clear dose response for these drugs, with measured EC50 values comparable to previously published reports for L. donovani amastigotes. 9,10,29 In addition, we observed the previously reported toxicity of miltefosine to host cells at high concentration, and the proliferative effect of amphotericin B on THP-1 host cells at higher concentrations. 9,10 We show that both per-well (average amastigotes per host cell) and per-cell data (frequency distribution of parasites) can be combined to provide a detailed insight into the effect of drug treatment and to distinguish between differences in the frequency and magnitude of host cell infection.
This method provides a robust means to quantify wild-type Leishmania parasite burden within host cells and is not dependent upon the use of specific host or parasite cell lines. This provides scope for use in drug screens with any of the ∼20 species of infective Leishmania as well as additional host cells such as primary macrophages or transgenic cell lines (i.e., gene knockouts). This methodology provides great opportunities for the future screening of large compound libraries against these parasites. 35 Furthermore, a range of other intracellular pathogens that reside within intracellular vacuoles of macrophages (i.e., Mycobacteria tuberculosis, Salmonella typhimurium) may also be amenable to drug screening using this method.
Footnotes
Acknowledgments
This work was supported by the NHMRC Research Project APP1059545. M.J.M. is an NHMRC Principal Research Fellow. The Victorian Centre for Functional Genomics (K.J.S.) is funded by the Australian Cancer Research Foundation (ACRF), the Victorian Department of Industry, Innovation and Regional Development (DIIRD), the Australian Phenomics Network (APN) and supported by funding from the Australian Government's Education Investment Fund through the Super Science Initiative, the Australasian Genomics Technologies Association (AMATA), the Brockhoff Foundation, and the Peter MacCallum Cancer Centre Foundation. The authors thank Daniel Thomas and Jennii Luu from the Victorian Centre for Functional Genomics for expert technical assistance.
Disclosure Statement
No competing financial interests exist.