
Abstract
We previously reported clinical performance of a novel noninvasive and quantitative PCR (qPCR)-based molecular diagnostic assay (the pigmented lesion assay; PLA) that differentiates primary cutaneous melanoma from benign pigmented skin lesions through two target gene signatures, LINC00518 (LINC) and preferentially expressed antigen in melanoma (PRAME). This study focuses on analytical characterization of this PLA, including qPCR specificity and sensitivity, optimization of RNA input in qPCR to achieve a desired diagnostic sensitivity and specificity, and analytical performance (repeatability and reproducibility) of this two-gene PLA. All target qPCRs demonstrated a good specificity (100%) and sensitivity (with a limit of detection of 1–2 copies), which allows reliable detection of gene expression changes of LINC and PRAME between melanomas and nonmelanomas. Through normalizing RNA input in qPCR, we converted the traditional gene expression analyses to a binomial detection of gene transcripts (i.e., detected or not detected). By combining the binomial qPCR results of the two genes, an improved diagnostic sensitivity (raised from 52%– 65% to 71% at 1 pg of total RNA input, and to 91% at 3 pg of total RNA input) was achieved. This two-gene PLA demonstrates a high repeatability and reproducibility (coefficient of variation <3%) and all required analytical performance characteristics for the commercial processing of clinical samples.
Introduction
Early diagnosis of melanoma, the most deadly form of skin cancer, remains the main determining factor of patient outcome. 1 According to estimates by the Skin Cancer Foundation, about 76,380 new cases of invasive melanoma will be diagnosed in 2016 and 10,130 melanoma patients are expected to die from this disease. 2 Currently, invasive surgical biopsies, based on pattern and image recognition and histopathologic examination, are the standard of care for evaluating clinically suspicious pigmented skin lesions. Such biopsies represent a significant healthcare burden in terms of direct care costs, patient wound management, discomfort, disfigurement, and quality-of-life implications. 3 Most importantly, they appear linked to an underestimated level of subjectivity 4,5 and often fail to deliver the desired or perceived certainty. 6 –8 Sensitivity of melanoma diagnosis through histopathologic assessments remains an ongoing challenge even for expert pathologists. Discordance between pathologists examining pigmented lesions is common and a recent survey from a group of eight experts demonstrated diagnostic discordance between two or more dermatopathologists in up to 38%. 8 With these discrepancies, new technologies capable of shifting a diagnostic paradigm away from the pattern recognition-based traditional strategies are highly desirable. 9
Genomic information may provide objective data that when utilized with the traditional methods could offer a more objective assessment of the disease. Progresses on developing molecular tools to aid in the diagnosis of melanomas have been made and most of the previous efforts have been focused on detecting mutations in melanoma-related genes such as BRAF and NRAS (both involved in the mitogen-activated protein kinase pathway) or KIT (involved in tyrosine kinase activation). 10 –12 Instead of detecting gene mutations, we recently developed a molecular diagnostic assay (the pigmented lesion assay; PLA) that detects the presence or absence of melanoma-associated gene expression in pigmented skin lesions. 9,13,14 The assay uses skin samples collected through an adhesive patch-based Class I biopsy device and detects RNA transcripts of two genes, LINC and preferentially expressed antigen in melanoma (PRAME), which we had previously identified as potential melanoma classifiers through comparing microarray data from both melanoma and nonmelanoma skin samples. 13 This two-gene PLA was shown to enable classifying pigmented lesions clinically suspicious of melanoma with a sensitivity of 91% and specificity of 69%. 9 This sensitivity compares favorably to the 85%–87% level from histopathologic assessments after surgical biopsies. 6,7 In addition, it was also shown in a utility and decision impact study using a web-based reader format that this two-gene PLA could improve the clinical diagnostic performance of dermatologists assessing pigmented skin lesions. 2
As this novel two-gene PLA appears to ease the challenges dermatologists face when diagnosing primary melanomas, this study was set to better understand the analytical performance of this assay, beyond the recently reported clinical validation and clinical utility studies. 9 It focuses on characterizing the analytic sensitivity, specificity, test optimization, and repeatability as well as reproducibility of the assay.
Materials and Methods
Specimens
Specimens for this study came from four sources: noninvasive adhesive patch biopsies of (1) clinically suspicious pigmented lesions or (2) normal skin as approved by both local and centralized Institutional Review Boards (WIRB Copernicus Group), (3) plasmid DNAs with target gene inserts, and (4) commercially available RNA or cell line materials. This study was conducted in DermTech's CLIA licensed clinical laboratory (CLIA No. 05D2073519; DermTech, La Jolla, CA) following established standard operating procedures. The analytical assay characterization was performed with the same quantitative PCR (qPCR) primers and probes used in DermTech's two-gene PLA currently commercially available in 49 of 50 U.S. States. 9
Analytical Sensitivity and Specificity
Analytical specificity and sensitivity refer to the detection specificity and sensitivity of primer probes for their targets in qPCR and are calculated as the percentage of correct detection of total specific targets (sensitivity) and the percentage of correct detection of total nonspecific targets (specificity), respectively. In this two-gene PLA, we used three well-characterized commercial TaqMan gene expression primer probe kits, two for the target genes LINC and PRAME (Hs00332749_m1 and Hs01022301_m1) and one for a control gene β-actin (ACTB, Hs01060665_g1), purchased from Life Technologies (Foster City, CA). Each TaqMan gene expression primer probe kit contains a pair of primers that span two adjacent exons and a TaqMan probe that spans the junction of the two exons. This primer probe design ensures a superior specificity of target amplification and detection, that is, only the gene transcripts (RNA) of the specific target, not the genomic DNA of this target nor the gene transcripts of other unrelated genes, were amplified and detected. 15 To further corroborate these characteristics, the specificities of these three TaqMan product kits (primer sets) used in our two-gene PLA were evaluated at DermTech using plasmid DNA containing specific target gene inserts.
Three plasmids, each containing a gene insert from one of the three genes (ACTB, LINC, and PRAME), were obtained from commercial sources in transformed bacterial stabs (Table 1). Plasmid DNAs were isolated from bacterial cultures by a standard boil-prep procedure (Genewiz, La Jolla, CA) and used to test the specificity of the three TaqMan primer sets in a 3 × 3 × 5 (3 target plasmids × 3 primer sets × 5 replicates) cross reaction qPCR experiment. Nine microliters of diluted plasmid DNA (containing about 200 copies of corresponding target molecules) was added to each reaction well on a 384-well qPCR plate with 10 μL of TaqMan 2 × Universal Master Mix and 1 μL of the primer-probe mix from Life Technologies (see product Cat no. already shown). The qPCRs were completed on an ABI 7900 PCR system following the manufacturer's instructions (Life Technologies). The analytical specificity and sensitivity of each primer set were calculated from the number of reactions where the qPCR yielded an amplification curve (and a measurable Ct value) from the correct target or yielded no amplification curve (and an “undetermined” Ct) from nonspecific targets.
Sources of the Plasmid DNA Used for Primer Specificity Testing
Limit of Detection
Tests were extended to evaluate the limit of detection (LOD) of these three qPCRs using the same plasmid DNA or commercially available RNA, including the Universal Human Reference RNA (UHR, a pooled total RNA from 10 human cell lines; Catalog no. 740000; Agilent Technologies, San Diego, CA) and total RNA isolated from a human cutaneous melanoma cell line HTB-72 (also named SK-Mel-28, from ATCC, Manassas, VA). All targets were serially diluted and used for qPCR or reverse transcription quantitative PCR (RT-qPCR). In RT-qPCR, RNA was first reverse transcribed to complementary DNA (cDNA) using SuperScript® VILO™ cDNA Synthesis Kit following the manufacturer's instruction (16 μL of diluted RNA +4 μL of the SuperScript VILO master mix, incubated at 42°C for 60 min; Life Technologies). The cDNA was then used in qPCR following the same procedures already described. Each reaction was run in duplicate.
Assay Sensitivity and Specificity
Assay sensitivity and specificity refer to the percentage of correct detection in real clinical samples. In this study, assay sensitivity and specificity were investigated using total RNA isolated from samples collected through DermTech's Adhesive Skin Biopsy Kits following the procedure described previously. 9 All lesions samples were histopathologically confirmed as primary melanomas or primary nonmelanoma pigmented lesions (nevi). RNA was extracted from adhesive patches using a modified PicoPure™ procedure (Life Technologies) and reverse transcribed to cDNA for qPCR to detect gene transcripts of ACTB, LINC, and PRAME as already described. Serial dilutions of these clinical sample RNAs were tested by RT-qPCR and assay specificity and sensitivity were evaluated in samples with different input levels of RNA.
Assay Repeatability and Reproducibility
Repeatability and reproducibility refer to the consistency of test performance within and between repeat runs. For the two-gene PLA, these were evaluated through Ct changes of the three genes tested in a 2 × 3 × 3 × 2 × 15 factorial experiment (2 samples × 3 genes × 3 repeat runs × 2 operators × 15 repeat reactions). In brief, RNA isolated from two clinical skin samples (one melanoma and one nonmelanoma) were reverse transcribed to cDNA, which were then used in qPCR on all three target genes, with 15 replicates on each gene. This run was independently repeated three times (from the same RNA samples) by two operators. The Ct values of all reactions from this 2 × 3 × 3 × 2 × 15 experiment were compared to assess the repeatability (within-run) and reproducibility (between-run) of the assay performance.
Statistical Analysis
All statistical analyses were performed using the R statistics package or Microsoft Excel. 16 All “undetermined” Ct values from qPCR were assigned a value of 40 (the maximal thermal cycling number in a given qPCR).
Results
Table 2 shows the results from the 3 × 3 × 5 cross-reaction test of qPCR for ACTB, LINC, and PRAME. A positive target detection (yielding an amplification curve and a measureable Ct value) was shown as “+” and a negative target detection (yielding no amplification curve and an “undetermined” Ct value) was shown as “−.” All three qPCR primer sets have successfully amplified their corresponding targets (5 of 5 reactions) without cross-reacting with any nonspecific targets (10 of 10 reactions), yielding a 100% specificity and sensitivity for all three genes. Figure 1 shows the averaged Ct values (N = 5) of each qPCR on the three different targets from this 3 × 3 × 5 cross-reaction test. All three qPCR primer sets appear to perform similarly and consistently on their targets, shown by similar Ct values and the small standard deviations of the Ct values. At such a high number of target input (∼200 molecular copies), none of these three qPCR primer sets had amplified any other nonspecific targets, suggesting a high specificity of target amplification and detection by each of these three primer sets.
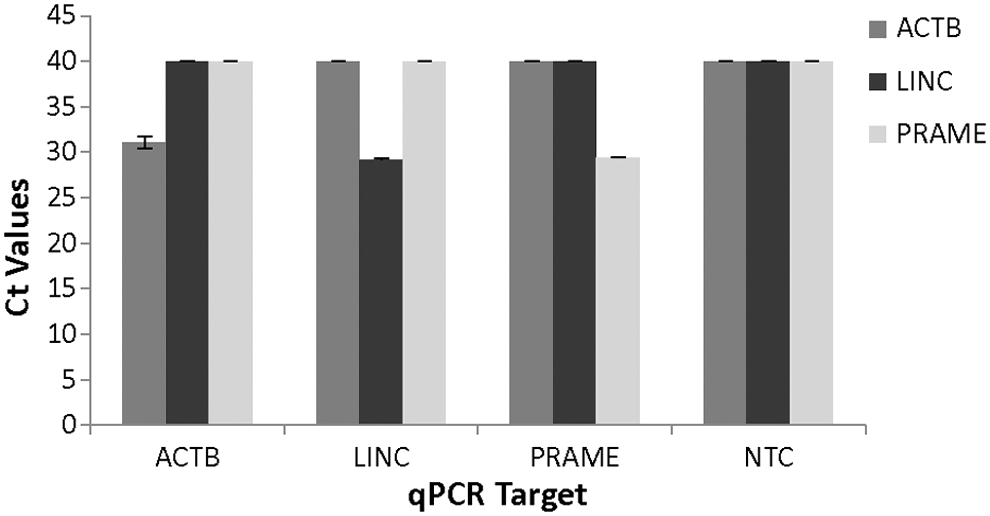
Ct measurement (mean ± SD, N = 5) from the qPCR cross-reaction test. (All undetermined Ct values were computed to 40). NTC, no template control; qPCR, quantitative PCR; SD, standard deviation.
Cross-Reactivity Test of the Three Gene Primer Sets Used in the Two-Gene PLA
“+” = target detected in qPCR.
“−” = target not detected in qPCR. The count of “+” or “−” in table indicates the number of “+” or “−” reactions detected, and the numbers in parentheses are the total number of qPCRs.
NTC, no template control; PLA, pigmented lesion assay; qPCR, quantitative PCR.
Figure 2 shows the results of target dilution tests from these three qPCRs with the given plasmids in a range from 0.1 to 400 copies per reaction. Ct values from all three qPCRs increased linearly with the increase of target dilutions (or decrease of target copy number). Target detection remained consistently positive (yielding a Ct value) for all three qPCRs with a calculated input of ≥1.6 copies per reaction but became sporadic below this target input level (data not shown). This finding indicates a similar LOD of ∼1–2 copies for all three qPCRs tested.
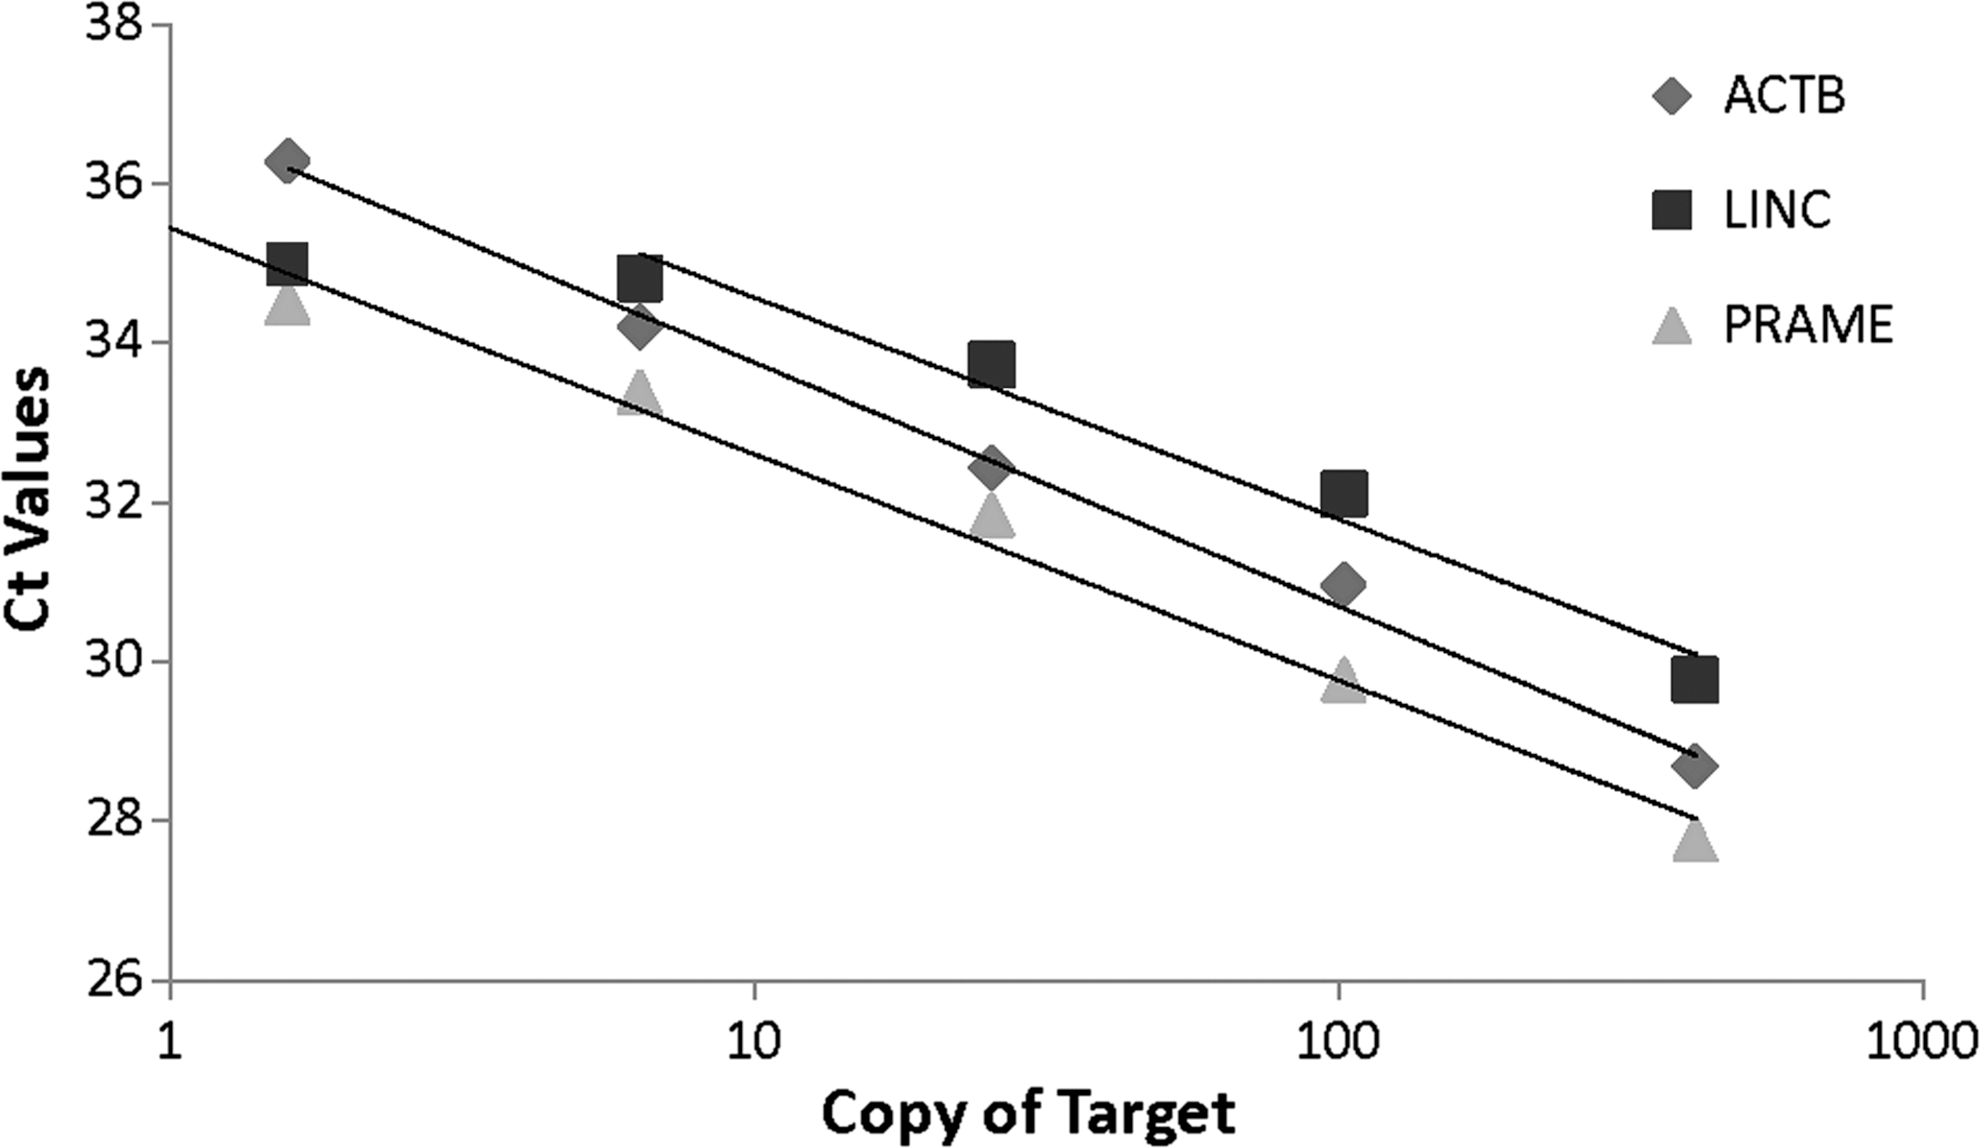
Analytical sensitivity of qPCR on a single population of target in reaction, determined from serial dilutions of plasmid with specific gene insert. Lines represent linear regression analysis of Ct values against copy numbers of target in qPCR (ACTB: Y = −1.384ln(x) + 37.304, R2 = 0.989; LINC: Y = −1.208ln(x) + 37.359, R2 = 0.973; PRAME: Y = −1.233ln(x) + 35.473, R2 = 0.983).
Figure 3 shows the results of these three qPCRs on cDNAs from serial dilutions of UHR. All three qPCRs demonstrated a linear change of Ct values to the dilutions of UHR, similar to that seen from the plasmid DNA tests. However, different expression levels of the three genes were observed (ACTB > PRAME > LINC; from high to low) based on the Ct values at each dilution and the LOD for each gene (Fig. 3A). Dilution curves from all three genes appear parallel and Ct values correlate well between any two genes with RNA dilutions forming linear regression lines with slope values close to 1.0 (Fig. 3B). The parallel nature of these dilution curves indicates that each target gene product was amplified independently from other nonspecific targets that were also present in the same reactions. The smallest amount of UHR to yield a positive detection of LINC gene transcript was ∼15 pg of total RNA.
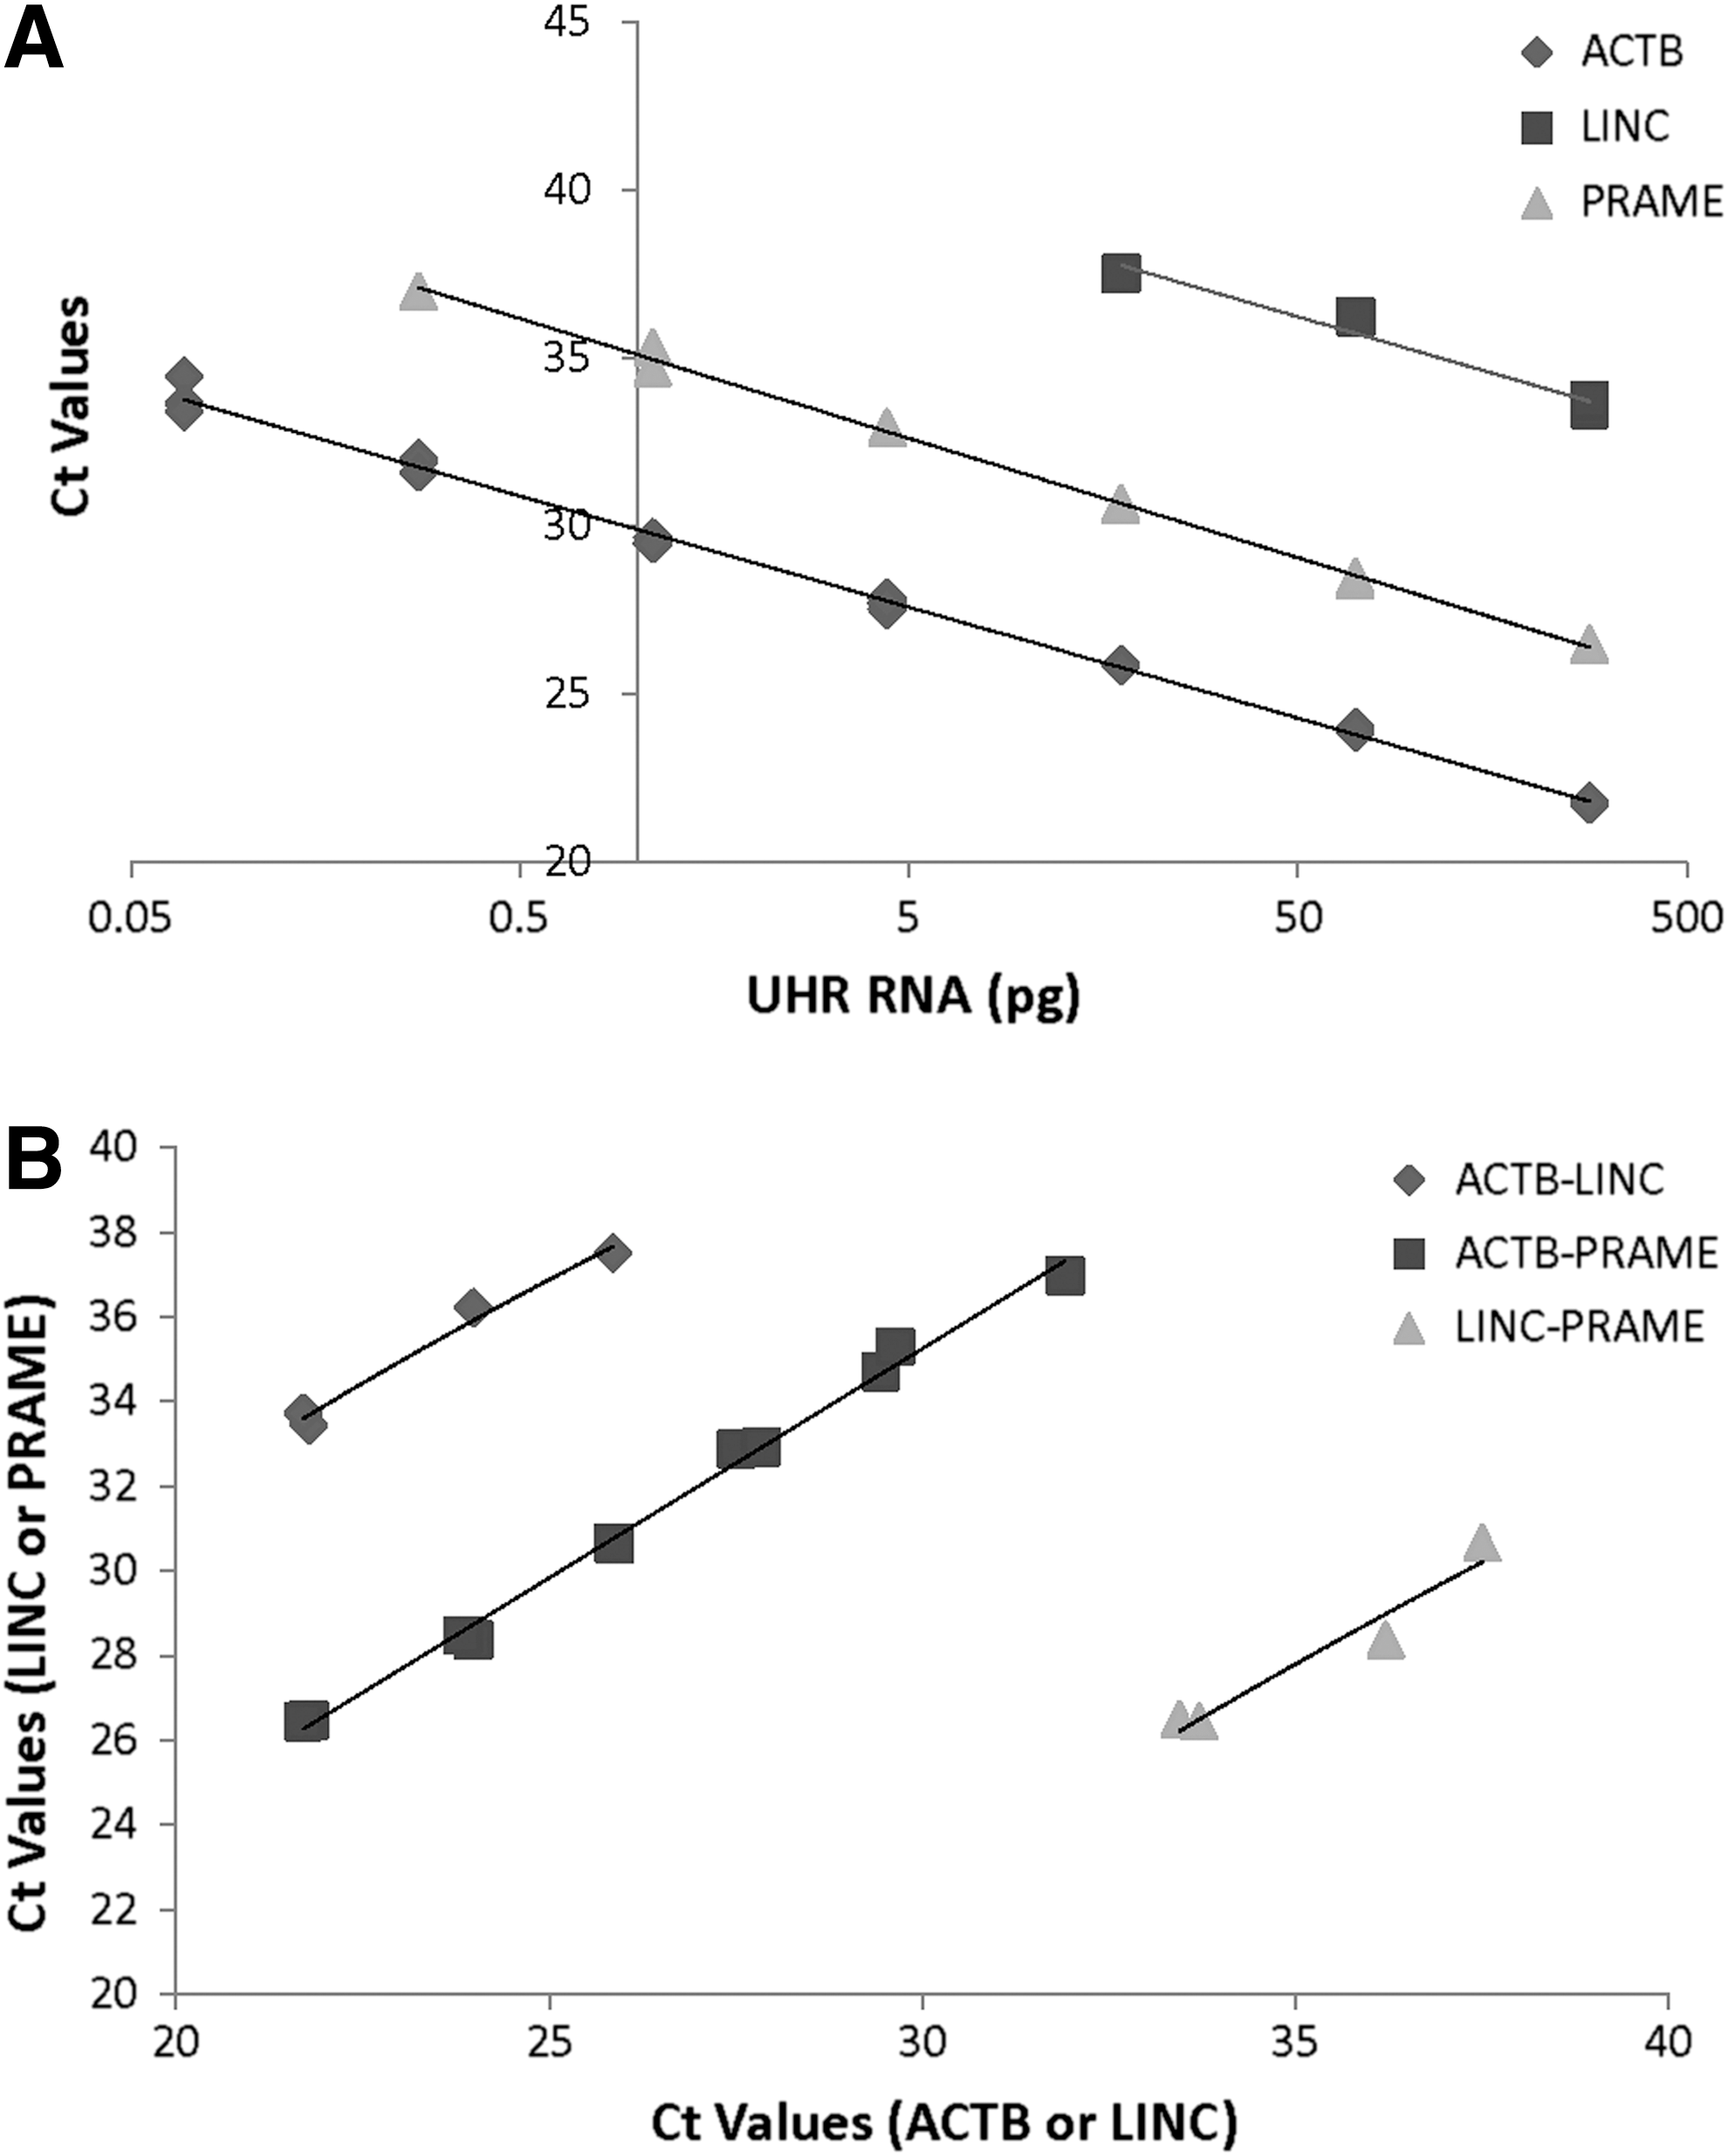
Analytical sensitivity of qPCR on mixed populations of RNAs, determined from serial dilutions of UHR (a pooled total RNA from 10 nonmelanoma human cell lines).
Figure 4 shows the results of these three qPCRs on cDNA from serial dilutions of total RNA from HTB-72. The linear responses of Ct to the dilutions of RNA from HTB-72 cells are very similar to that from UHR, with a nearly identical slope and intercept value of linear regression lines on RNA dilutions between the two types of samples. However, the two target genes, especially LINC, demonstrated a clearly higher expression level in HTB-72 (a human skin melanoma cell line) than in UHR (a pooled total RNA from 10 nonmelanoma human cell lines), shown by a positive LINC gene transcript detection from a much lower input level of total RNA from HTB-72 cells (as little as 0.07 pg for LINC detection) and a lower intercept value of the linear regression lines on RNA dilutions (37.52 vs. 41.92 on LINC and 32.85 vs. 35.09 on PRAME, Figs. 3 and 4). ACTB gene expression levels were high and consistent in both UHR and HTB-72 (same LOD and same intercept values of 29.897 vs. 29.486, Figs. 3 and 4) supporting the use of this gene as an internal control to normalize the RNA for this two-gene assay.

Analytical sensitivity of qPCR on mixed populations of RNAs, determined from serial dilutions of total RNA from HTB-72 (a human melanoma cell line). Lines represent linear regression analysis of Ct values against dilutions of total RNA (ACTB: Y = −1.483ln(x) + 29.486, R2 = 0.997, LINC: Y = −1.444ln(x) + 37.52, R2 = 0.9870 and PRAME: Y = −1.484ln(x) + 32.854, R2 = 0.990).
The elevated expression of LINC and PRAME genes in HTB-72 melanoma cells compared with UHR appears to further corroborate an association of these two genes with melanoma 13,14 and supports using these two gene transcripts as molecular biomarkers for assessing pigmented skin lesions. The use of these 2 genes for pigmented lesion assessment was first tested in 52 clinical skin samples (20 melanoma samples and 32 nonmelanoma samples) collected through adhesive patch biopsy, where we compared the LINC gene expression changes at 3 input levels of total RNA (12, 3, and 1 pg). Figure 5 shows the averaged Ct values of ACTB and LINC from these samples, where ACTB served as control to normalize the RNA input from each sample for the test. As expected, difference in ACTB Ct values between melanoma and nonmelanoma samples was negligible at all three RNA input levels (Fig. 5A), indicating that the total RNA input from the two types of samples was well normalized for the assay. However, with this normalized (and equal amount of) total RNA in reactions, the LINC Ct values were clearly lower in melanoma samples than in nonmelanoma samples at every RNA input level tested (Fig. 5B), which confirms an elevated expression of LINC gene expression in melanoma samples.
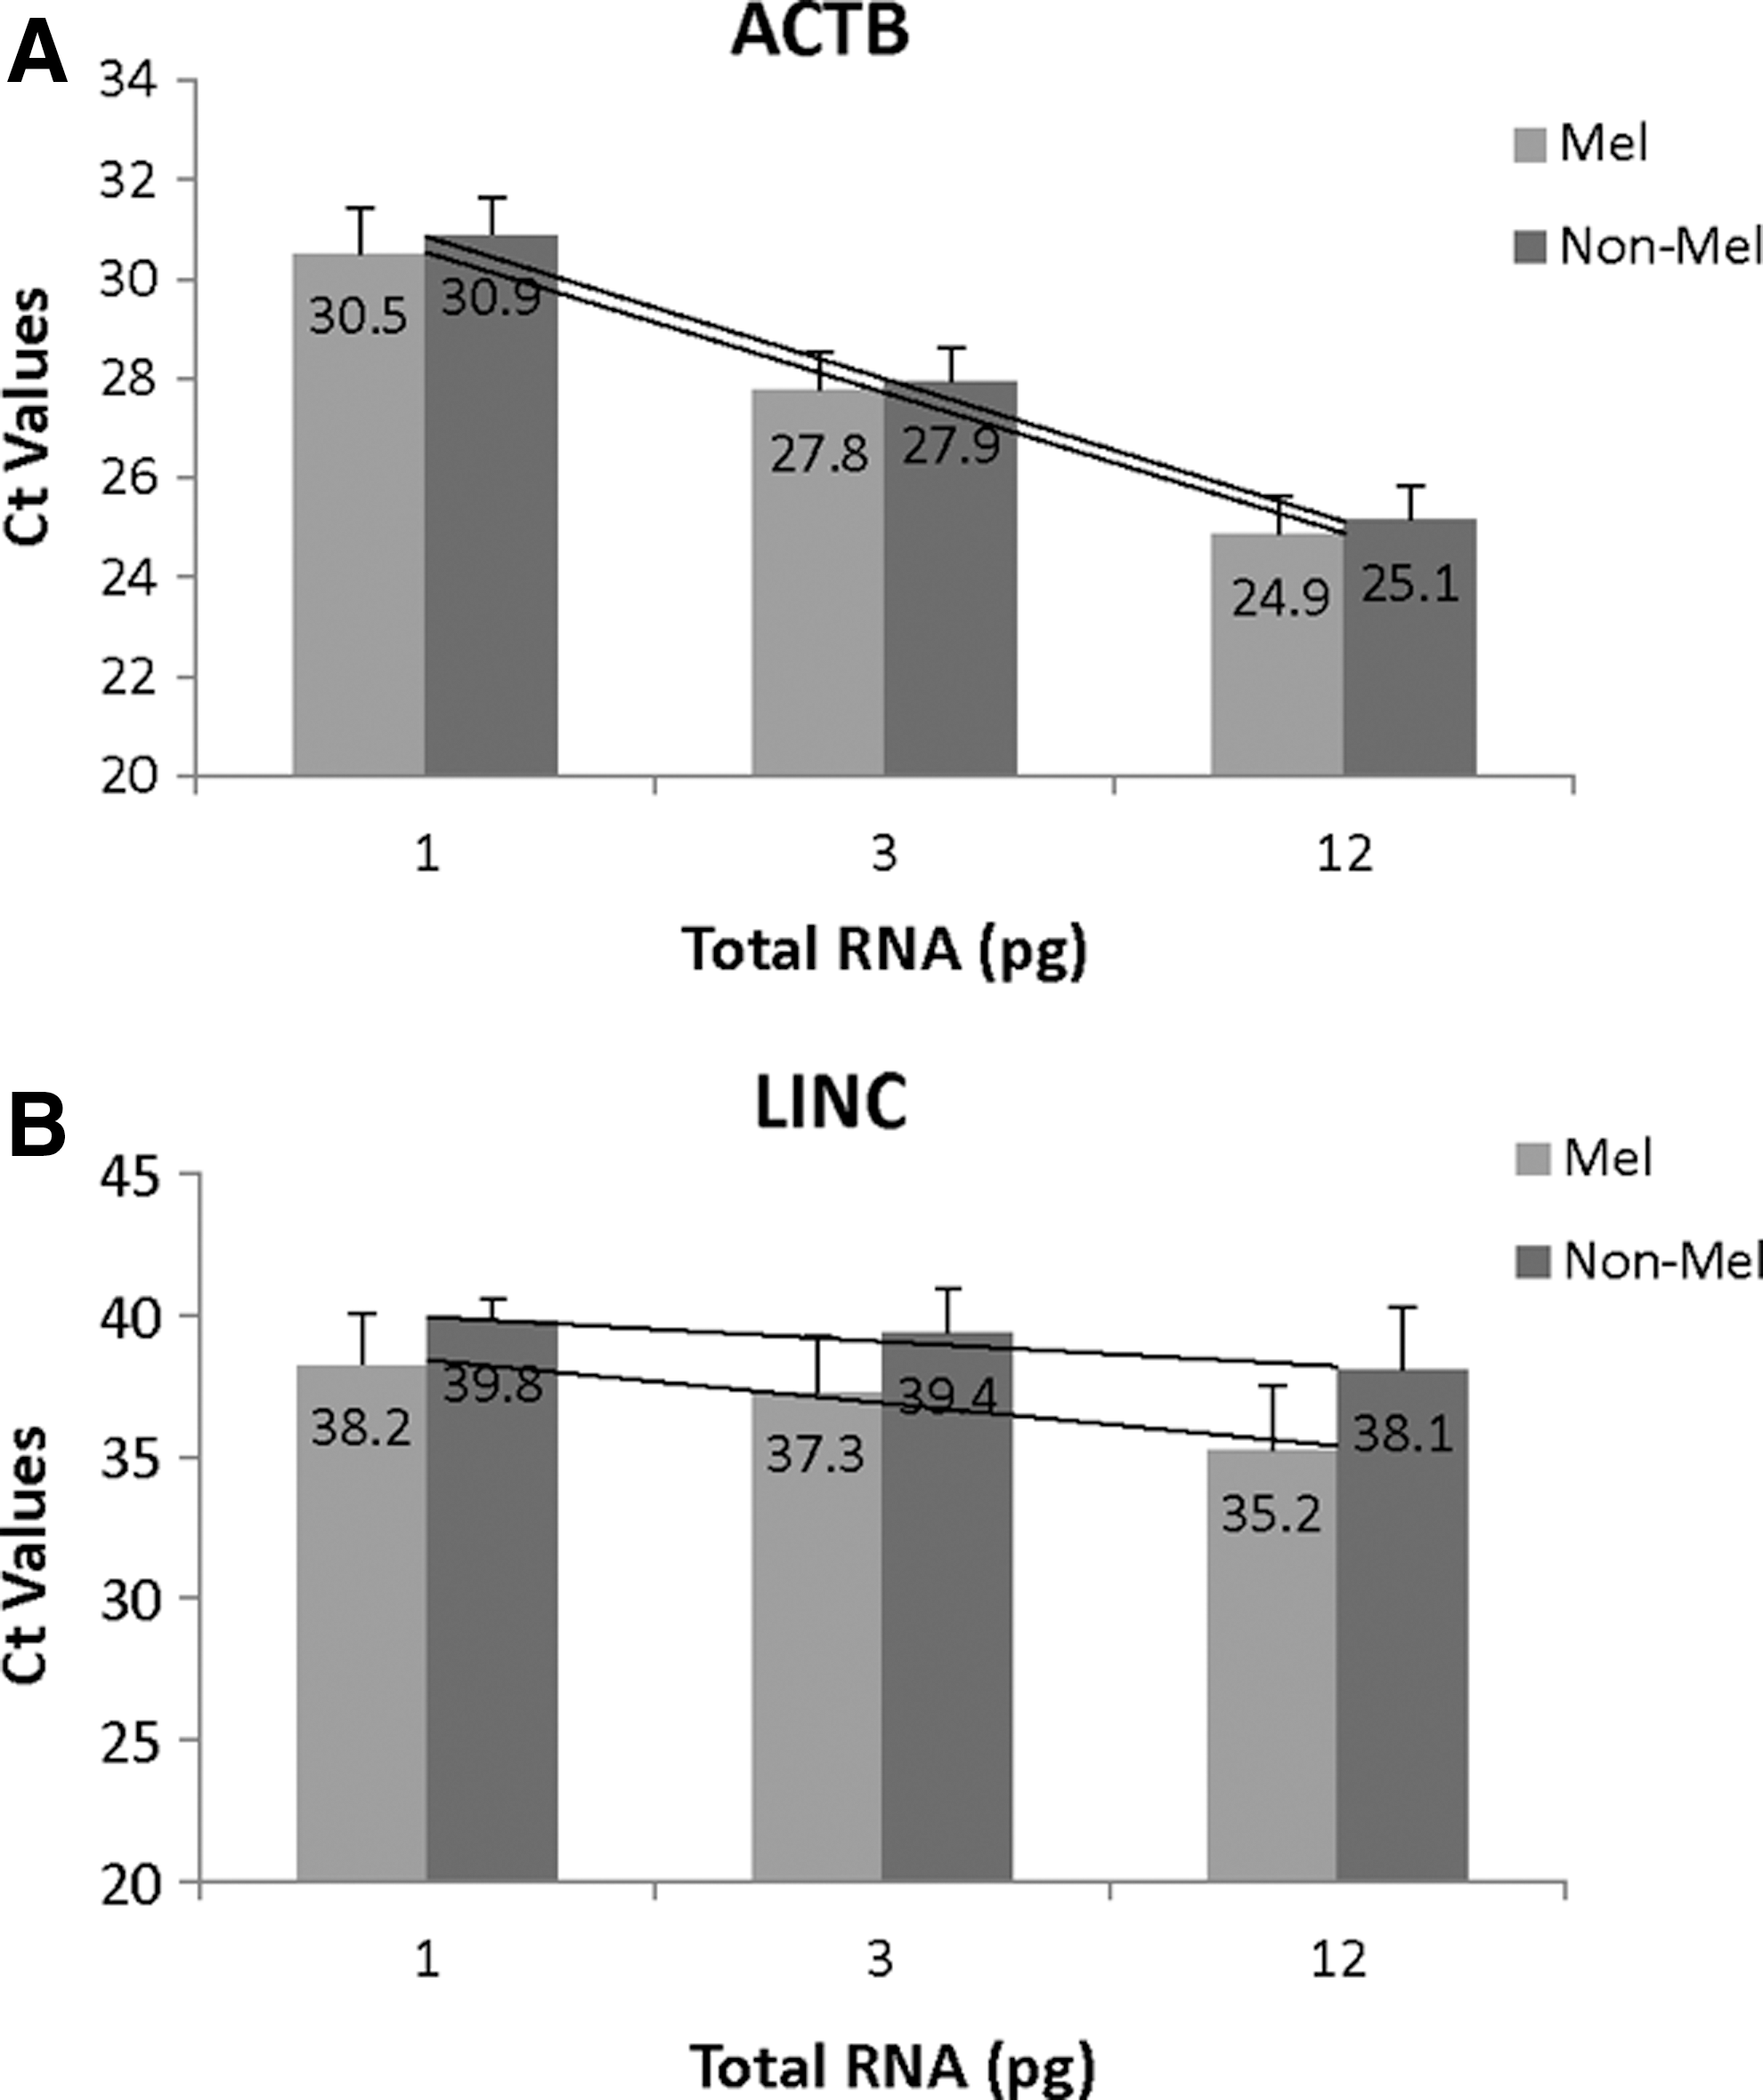
Ct measurements (mean ± SD, N = 20 or 32) of ACTB and LINC from 52 clinical samples (20 melanoma samples and 32 nonmelanoma samples) at three levels of total RNA. Values in bars are averaged Ct values and lines represent linear regression analysis of averaged Ct values against total RNA. Lines in
This differential gene expression of LINC in these two types of samples could also be displayed through the count of samples that showed LINC gene expression detected (when Ct was measured) or not detected (when Ct was “undetermined”). At 12 pg of total RNA input, 17 of the 20 (85%) melanoma samples had the LINC gene transcript detected, whereas only 15 of the 32 (47%) nonmelanoma samples had positive LINC transcript detection (Table 3). At 3 pg of total RNA input, 14 of the 20 (70%) melanoma specimens remained LINC detected, whereas LINC positive nonmelanoma samples had dropped to 5 of 32 (15.6%). At 1 pg of total RNA input, LINC was detected in 10 of the 20 (50%) melanoma samples and in only 2 of the 32 (6.3%) nonmelanoma samples. The percentages of LINC positive detection are clearly higher in melanoma samples than in nonmelanoma samples at every RNA input level.
Detection Counts of LINC Gene Expression in Mel and Nonmel Samples at Three Input Levels of Total RNA (Per Reaction), Normalized with ACTB RT-qPCR
Mel, melanoma; nonmel, nonmelanoma.
Figure 6 shows the sensitivity and specificity for melanoma detection calculated from the LINC transcript detection counts shown in Table 3, and dynamic changes of the detection sensitivity and specificity with the changing inputs of RNA. Sensitivity is high at high input levels of RNA (e.g., 85% at 12 pg) and decreased with the reduction of RNA input. Specificity goes in the opposite direction, low in high RNA input and rising with the reduction of RNA input, reaching the highest level of 94% at 1 pg of RNA. Sensitivity and specificity appear better balanced at the 3 pg of RNA input. These results appear to suggest that by setting an optimal input of RNA in qPCR, we may separate melanomas from nonmelanomas based on the differential expression of target genes in patient samples and through a much simplified binomial measurement (“detected” or “not detected”) of the target gene transcript in qPCR.

Dynamic change of melanoma detection sensitivity and specificity, calculated from the gene detection counts in Table 3 (based on LINC only). For sensitivity and specificity calculation, see Materials and Methods Section. Lines represent linear regression analysis of sensitivity (Y = 0.027x + 0.538, R2 = 0.823) and specificity (Y = −0.036x + 0.964, R2 = 0.997) calculated from the three RNA input levels.
Table 4 shows another test on a separate set of 73 clinical samples (31 melanoma samples and 42 nonmelanoma samples), where both LINC and PRAME gene expressions were analyzed (at 1 pg of total RNA input, normalized with ACTB). Detection sensitivity for melanoma with LINC or PRAME alone was similar (52% and 65%, respectively, with also a similar specificity of 88% and 93%), calculated from the binomial target transcript detection of each gene. By combining the transcript detection counts of the two genes, we were able to increase the melanoma detection sensitivity to 71% (calculated from the total counts of LINC and/or PRAME transcript detected melanoma samples divided by the total number of melanoma samples analyzed) without losing much of the detection specificity (still at 88%, calculated from the total counts of both gene transcripts not detected nonmelanoma samples divided by the total number of nonmelanoma samples analyzed).
Detection Counts of LINC and PRAME Gene Expression in Mel and Nonmel Samples, and Sensitivity and Specificity of Melanoma Detection Calculated from One or Both LINC and PRAME Counts
At 1 pg of total RNA input.
See Materials and Methods Section for calculations of detection sensitivity and specificity.
Table 5 shows the results of ANOVA on Ct measurements from the repeatability and reproducibility test. The ANOVA test clearly shows absence of statistical difference among the three repeat runs (P > 0.1), even with a small different performance between the two operators (ΔCt = 0.24, P < 0.001). With a normalized and equal input of total RNA from the two samples, ACTB displayed no difference between the two samples (P > 0.1), but both LINC and PRAME genes had displayed significantly different expressions (P < 0.001), with a ΔCt of 5.87 and 7.71 for LINC and PRAME, respectively, between melanoma and nonmelanoma samples. Coefficient of variation (CV) of Ct values of all three genes from the three runs was less than 3% for both within (repeatability) and between runs (reproducibility), with an exception on LINC gene from sample no. 3939 in run no. 3 by operator 2 (which gave a CV of 9.46%).
ANOVA of Ct Measurements of the Three Genes from a Repeatability and Reproducibility Test (a 2 × 3 × 3 × 2 × 15 Factorial Designed Experiment) of the Two-Gene PLA
P < 0.001.
SE, standard error.
Discussion
This study describes the analytical characteristics of a noninvasive two-gene molecular assay (the PLA) that differentiates melanoma from nonmelanoma pigmented skin lesions based on LINC and PRAME gene expression. 9 It covers the evaluation of both analytical and assay specificity and sensitivity, optimization, and performance assessment (repeatability and reproducibility) of this two-gene PLA.
Analytical specificity determines which target an assay analyzes and how valid the analysis is. It is one of the most important criteria in diagnostic assay development. In PCR-based diagnostics, analytical specificity is determined by the specificity of primers that amplify a specific target. In this study, we used the commercially available primer probe sets that were designed specifically for gene expression analysis in human tissues. Although specificity of these primer probe sets had been thoroughly checked by vendors, 15 we still performed a carefully planned in-house test to verify their specificity under our test conditions, which we thought was critical for ensuring the quality of our assay. This test was conducted through a cross-reaction study using plasmid DNAs each containing a specific gene insert. We chose plasmid DNA instead of total RNA from human tissues for this test, as only the plasmid with a single gene insert would allow accurate quantifications of both sensitivity and specificity of these primers, whereas total RNA from tissues could not serve the same purpose due to the presence of mixed and unknown products. With the plasmid DNA experiments, we confirmed the vendor-claimed specificity for all three primer sets used in this two-gene PLA.
Besides specificity, LOD is another key criterion in PCR-based diagnostics. In plasmid dilution tests, all three primer sets have demonstrated an LOD of 1–2 copies of target in qPCR. Primers with this level of LOD are well suited for use in detecting gene expression changes in biological samples, which was confirmed by the dilution tests of UHR and total RNA from HTB-72 melanoma cells.
The initial purpose of UHR and HTB-72 RNA dilution tests was to show a similar target detection performance of these three primer probe sets in qPCR with mixed target gene products (e.g., in UHR and HTB-72 RNA) to that with a single target population (i.e., plasmid DNA alone) and to confirm specificity of target amplification and detection in these complex target environments. The tests did confirm that each of the three target detections was completely independent of other gene products also present in the same reactions, shown by the parallel RNA dilution curves on all three genes from both UHR and HTB-72 RNA, the parallel regression lines, and a slope value close to 1.0 of these regression lines between any two of the three genes from the same RNA. This independent and reliable target detection in complex biological samples allows the use of these primer sets in clinical assay applications.
The dilution tests of UHR and HTB-72 RNA have also allowed comparison of target gene expression between the two types of samples. The positive gene transcript detections in more diluted RNA and the lower intercept values of RNA dilution curves have both indicated an elevated gene expression of LINC and PRAME in HTB-72 melanoma cells compared with UHR (pooled total RNA from nine nonmelanoma and one melanoma cell lines). In fact, these elevated LINC and PRAME gene expression patterns were also clearly confirmed in this study from primary pigmented lesion samples collected from patient skin through noninvasive adhesive patch biopsy. These results are in full agreement with the previous findings in cutaneous melanoma samples. 2,9
Because of the elevated LINC and PRAME gene expression in melanoma samples and qPCR of high detection sensitivity (with an LOD of 1–2 copies), we were able to convert the traditional gene expression analysis (based on Ct values) to a binomial detection of target gene expression (based on “yes” or “no” of detection) with careful optimization of RNA input. When RNA input was well optimized, most melanoma samples would show a positive gene transcript detection on one or both of LINC and PRAME due to an elevated gene expression, whereas most nonmelanoma samples would show a negative gene transcript detection due to a lack of elevated gene expression in samples. This new binomial detection appears to have enabled a quicker and easier separation of melanoma from nonmelanoma samples at an optimized input of RNA, and also simplified the data analyses and interpretation, allowing an easy calculation of assay sensitivity and specificity without relying on a complex data analysis algorithm that is required by many molecular cancer diagnostic strategies and being perceived as a black box by many clinicians. 4,5,9,13,14 Prerequisites for binomial gene expression detection are that the qPCR has a sufficient sensitivity, enabling detection of very low copy number of target and that the RNA input to qPCRs must be well normalized and optimized. All three qPCRs used in the two-gene PLA have clearly met this requirement.
Transcripts of the house-keeping gene ACTB have been used as an internal control in this assay to quantify and normalize the total RNA from samples. As shown in this study, ACTB displayed a consistent and strong expression in all samples and remained detectable in as little as 0.05 pg of total RNA. This makes it an appropriate internal control for the two-gene PLA. We had previously also included other genes such as β-2-microglobulin and peptidylprolyl isomerase A or cyclophilin A as additional controls for the test, but our extensive statistical analysis demonstrated little contribution of these genes to the assay or as additional controls. The quantification of RNA by ACTB qPCR is generally very accurate when there is enough target RNA in samples, but may become biased when the RNA concentration in sample is too low (which would cause a swing of Ct values in qPCR, due to the inherent nature of the qPCR technique). This factor should also be considered for total RNA quantification.
The use of this binomial detection approach to differentiate primary cutaneous melanoma from benign pigmented lesions was supported by the two gene expression tests consisting of a total of 125 clinical samples (52 + 73) conducted in this study and validated in a separate study of more than 500 clinical samples. 9 Detection sensitivity and specificity calculated from the binomial gene expression detection move in opposite directions in a well-known trade-off with the changing input of RNA. It is understandably difficult to gain both high sensitivity and high specificity of disease diagnosis with a single target gene (LINC or PRAME). However, combining the binomial test results of these two target genes appears to have allowed us to improve the detection sensitivity without losing much of the also critically important detection specificity.
RNA input is another important factor that affects both the detection sensitivity and specificity that has been discussed previously. By combining the two-gene approach and the binomial gene expression detection with a further optimized RNA input at 3 pg (equivalent to samples with ACTB Ct at around 28.5 ± 2 in qPCR) we have achieved a diagnostic sensitivity of 91% at a specificity of 69% in a large study of 398 validation samples. 9 These results compare favorably to that (<90%) from the current gold standard of histopathologic analyses on surgically obtained pigmented lesion samples, 6 –8 whereas this two-gene PLA offers additional advantages of being noninvasive (i.e., the two-gene PLA does not require surgical biopsies or excisions of the lesion tissues). This led to the development of a novel and noninvasive two-gene PLA for the clinical assessment of pigmented lesions.
Consistency of performance is vitally important for an assay to deliver reliable clinical utility. Our assessment of the assay performance, through a factorial experiment, has shown a very good repeatability and reproducibility of this assay. This notion was corroborated by a lack of statistically significant differences (P > 0.1) of ACTB Ct measurements from the three repeat runs by different operators, and the small CV values from all three genes among the repeat runs (indicating a very consistent run-to-run test). Although a small difference in Ct measurement was observed in one instance between the two operators (ΔCt = 0.24, P < 0.001), this ΔCt value was so small that it accounted for only 3%–4% of the ΔCt values of either LINC or PRAME between the melanoma and nonmelanoma samples thus did not impact this two-gene assay to correctly differentiate melanoma from nonmelanoma through the two gene signatures. Human inconsistencies are common causes for assay variation and can be minimized through additional training and stringent quality control.
Sample collection and RNA extraction are other key elements determining success of a diagnostic assay. Our two-gene PLA used total RNA isolated from skin biopsies collected through a noninvasive patch sampling procedure (a Class I sampling device). A thorough understanding of the sampling process and the sample stability on adhesive patches is another key aspect of a clinically reliable and robust assay. Such studies are ongoing and will complement the analytical characteristics of the assay described here.
Footnotes
Acknowledgments
This work was supported by DermTech, Inc. We gratefully acknowledge the contributions of Michael Walker and Bob Schmidt (Stanford University and Walker Bioscience) on the statistical analysis of the data, and help provided by Kamaryn Peters (DermTech) to coordinate the study and administrative support.
Disclosure Statement
No competing financial interests exist.