
Abstract
High-content screening (HCS) can generate large multidimensional datasets and when aligned with the appropriate data mining tools, it can yield valuable insights into the mechanism of action of bioactive molecules. However, easy-to-use data mining tools are not widely available, with the result that these datasets are frequently underutilized. Here, we present HC StratoMineR, a web-based tool for high-content data analysis. It is a decision-supportive platform that guides even non-expert users through a high-content data analysis workflow. HC StratoMineR is built by using My Structured Query Language for storage and querying, PHP: Hypertext Preprocessor as the main programming language, and jQuery for additional user interface functionality. R is used for statistical calculations, logic and data visualizations. Furthermore, C++ and graphical processor unit power is diffusely embedded in R by using the rcpp and rpud libraries for operations that are computationally highly intensive. We show that we can use HC StratoMineR for the analysis of multivariate data from a high-content siRNA knock-down screen and a small-molecule screen. It can be used to rapidly filter out undesirable data; to select relevant data; and to perform quality control, data reduction, data exploration, morphological hit picking, and data clustering. Our results demonstrate that HC StratoMineR can be used to functionally categorize HCS hits and, thus, provide valuable information for hit prioritization.
Introduction
Life science researchers are increasingly drowning in their own data. 1 Formerly, only specialized groups were in a position to generate large complex datasets, but in today's highly collaborative and distributed research environment, far larger numbers of researchers can gain access to technologies that generate large volumes of data. 2,3 A major challenge for scientists is the handling and analysis of large datasets such that the data can be efficiently used to generate new knowledge. Almost invariably, the development of analysis tools lags behind the technology that is generating the data. The result is that the biologist needs to collaborate with a specialist to analyze their data.
The problem is frequently compounded by the fact that analysis methods are often not addressed until after the dataset has been generated. The lack of advanced data mining methods means that the amount of new knowledge generated is limited. In large-scale screening experiments, this is often reflected in scientists only identifying previously known hits, the so called “low-hanging fruit.”
High-content screening (HCS), an innovative technology that combines the use of automated liquid handling, automated fluorescence microscopy, and automated image analysis, is a good example of a field that suffers from these problems. Multiple numerical descriptors of cellular morphology (parameters or variables) are extracted during image analysis. The resultant multivariate numerical datasets can be mined to generate phenotypic profiles or fingerprints for each tested reagent.
It has recently been reported that 60%–80% of high-content screens use only one or two extracted parameters, in spite of the wealth of publications that have demonstrated the power of more advanced multiparameter approaches. 1 This suggests that although many groups are carrying out image-based screens, relatively few are doing real high-content analysis and so are not taking advantage of the power of HCS.
There are a number of tools available to assist with HC data mining. HC Profiler, which is marketed by Perkin Elmer, is an adapter that allows for the porting of HC data to Tibco Spotfire, a well-established data visualization tool. Tableau is a commercial business intelligence software package that allows interactive plotting and on-the-fly calculations in a drag-and-drop fashion on various datasets. Dotmatics is an enterprise-scale business intelligence tool that is used for the analysis and visualization for life sciences research data and has a module designed to assist with HC data. Cell Profiler Analyst is an open-source software package. It is an extension of the Cell Profiler open-source image analysis platform and offers multiparameter data visualization.
At the Cell Screening Core, we needed a tool that biologists could use to mine their own high-content datasets. We deemed the tools that were then available unsuitable due to cost, the requirement for a local installation (not useful for off-site clients), or the fact that they required extensive training to be used independently. For this reason, we have developed HC StratoMineR, the package described here. Like the widely used Web CellHTS2 platform, 4 it gives users access to a web-based easy-to-use tool for data analysis. Our workflow is partly based on a previously published method for high-content data analysis. 5,6
Materials and Methods
High-Content Chemical Screen to Measure the Disruption of Lysosomal Function
MCF7 cells were cultured in RPMI (GIBCO), which was supplemented with 5% fetal calf serum, 100 U/ml penicillin, and 100 μg/mL streptomycin. Six thousand cells per well were plated in 96-well plates. Four hours after compound addition, Hoechst, LysoTracker-Red DND-99 (Molecular Probes Invitrogen Corporation), and 6 μM Calcein-AM were added. Cells were incubated for 30 min and then imaged on a Thermo ArrayScan VTi. Image analysis was carried out by using the Cellomics Morphology Explorer Bioapplication (Thermo Scientific).
High-Content siRNA Knock-Down Screen to Identify Novel Regulators of Mitosis
HeLa cells were cultured in Dulbecco's Modified Eagle Medium (GIBCO), which was supplemented with 6% fetal calf serum, 100 U/mL penicillin, and 100 μg/mL streptomycin. siRNAs were transfected by using RNAiMax (Invitrogen) according to the manufacturer's guidelines. The human ON-TARGETplus siRNA SMARTpool library (Dharmacon) was used for the genome-wide siRNA screen, which was performed in duplicate.
siRNA libraries were aliquoted in 384-well plates. One thousand five hundred cells were added to the wells after incubation of the transfection reagents. After 48 h of culturing, the cells were fixed by using formaldehyde. After staining of the wells with primary and secondary antibodies, the mitotic index of the wells was analyzed by using a Cellomics Arrayscan VTi (Thermo Scientific). Image analysis was performed by using Cellomics Morphology Explorer Bioapplication (Thermo Scientific). Data were exported by using HCS Explorer (Thermo Scientific). Data at cellular level for all available channels were exported in flat text files, one file per assay plate.
Implementation and Architecture
HC StratoMineR is a web-based platform that guides the user through an HC data analysis workflow. It is built by using My Structured Query Language (MySQL) for data storage and querying, PHP: Hypertext Preprocessor for the front and back end, and BOOTSTRAP with extra jQuery libraries for additional user interface functionality. Statistical calculations, the logic and data visualizations are managed by R. Specific computationally intensive steps are calculated with the use of the rcpp, rpud, and compiler libraries, so that C++ code, graphical processor unit power, or compiled code can be used to accelerate these processes.
7
Multiple instances can be run in tandem. The implementation is designed to handle processes in parallel by using the snow package. Using the Linux bash scripting language, HC StratoMineR was designed for the submission of very large high-content datasets to a high-performance computing (HPC) cluster running the open grid engine (OGE) so that data can be more efficiently processed. The OGE works the most efficiently when each iteration is submitted as an independent job. A list of jobs is distributed by a queuing server (member of the HPC) that distributes the jobs to available threads (server cores). In each thread, a specific part of the data is queried by using MySQL and independently processed in R. The web application waits until the last thread has finished and then refreshes the page to present the results. A technical visualization of the architecture is shown (Fig. 1) as well as detailed step-by-step visualization of the workflow (Supplementary Fig. S1; Supplementary Data are available online at
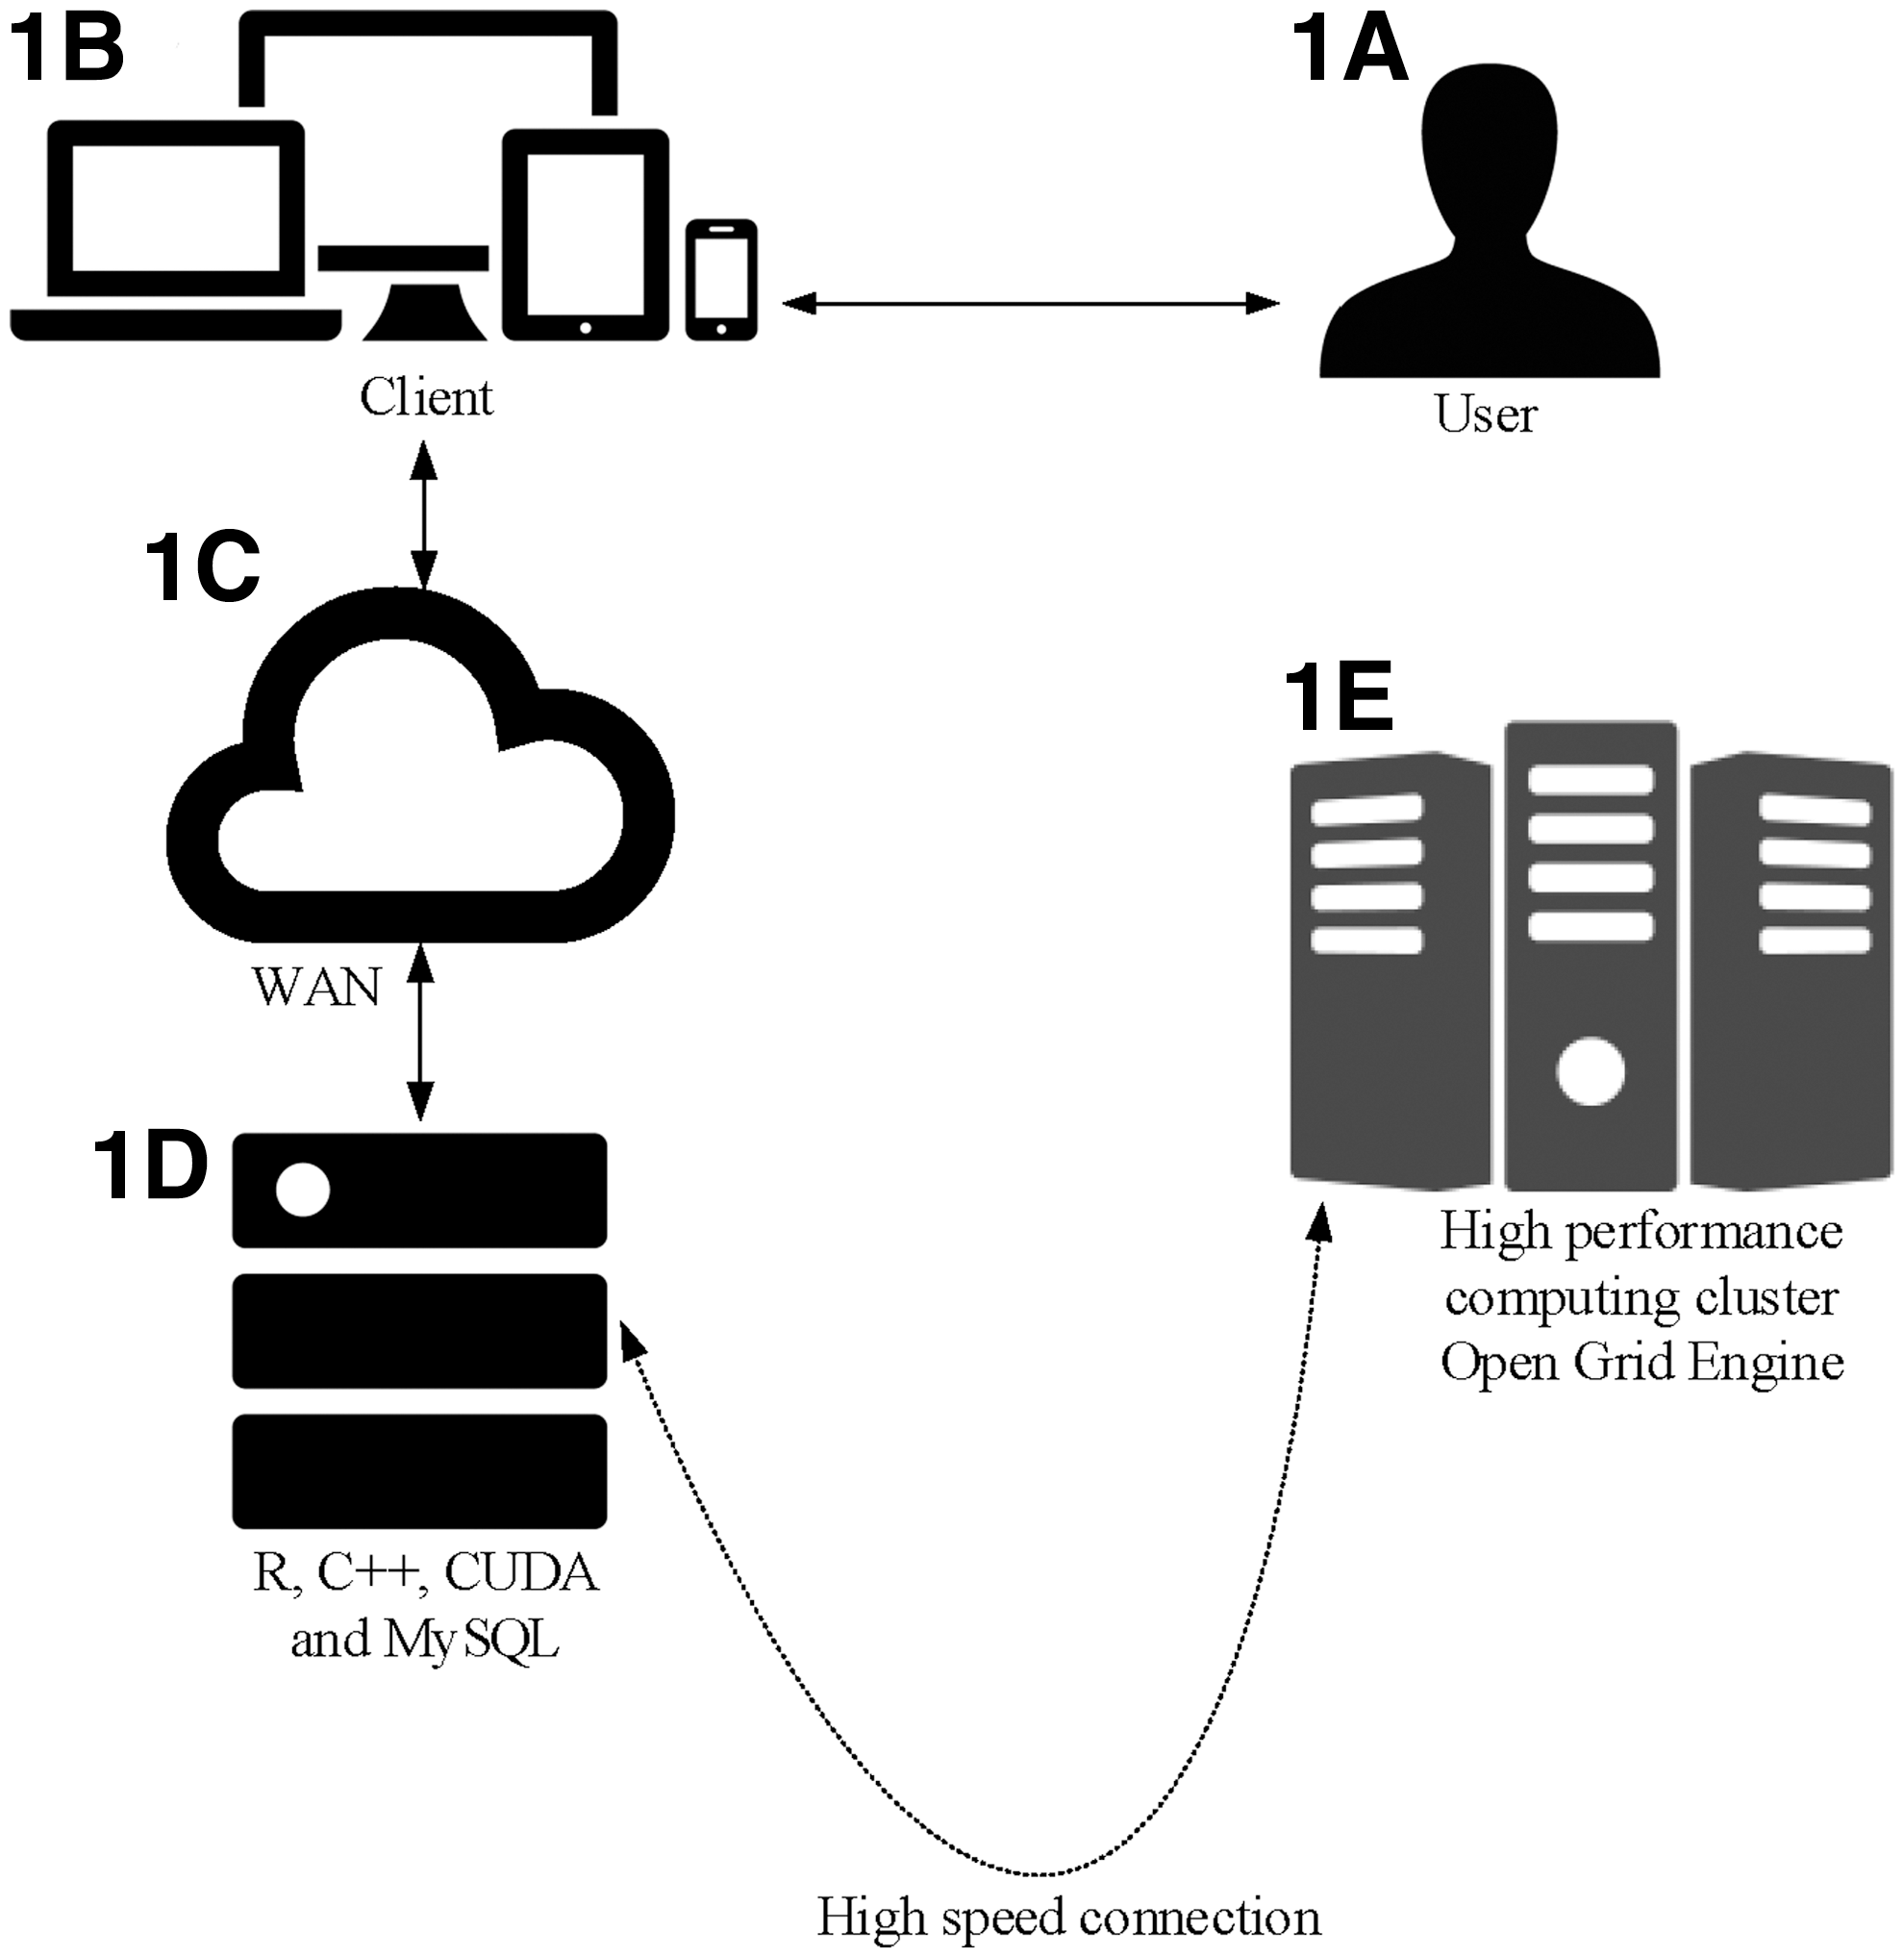
The architecture of HC StratoMineR.
Data Upload
The user logs into an Secure Sockets Layer secured website
Meta Data
Parameters/columns that contain meta data such as well location and barcodes are identified. Parameters that contain a unique numeric plate identifier and a human readable identifier are chosen. Additional information is also required, that is, plate format, default parameter, and data resolution. The default parameter will be visualized first by default in subsequent steps.
Data Preprocessing
HC StratoMineR automatically highlights parameters that should be omitted. Also, the data category, for example, binary, discrete, and continuous is inspected. If a parameter is binary/discrete, has a standard deviation of zero, or contains ≥95% empty values (NULL), it is marked for removal. Each individual parameter is now set to the right data type (e.g., DOUBLE, INT, and TEXT), and the data are indexed for faster access. The data are checked for the correct number of replicates that was given during data upload. Then, the data are checked for empty fields and inconsistencies across replicates (Fig. 2A).
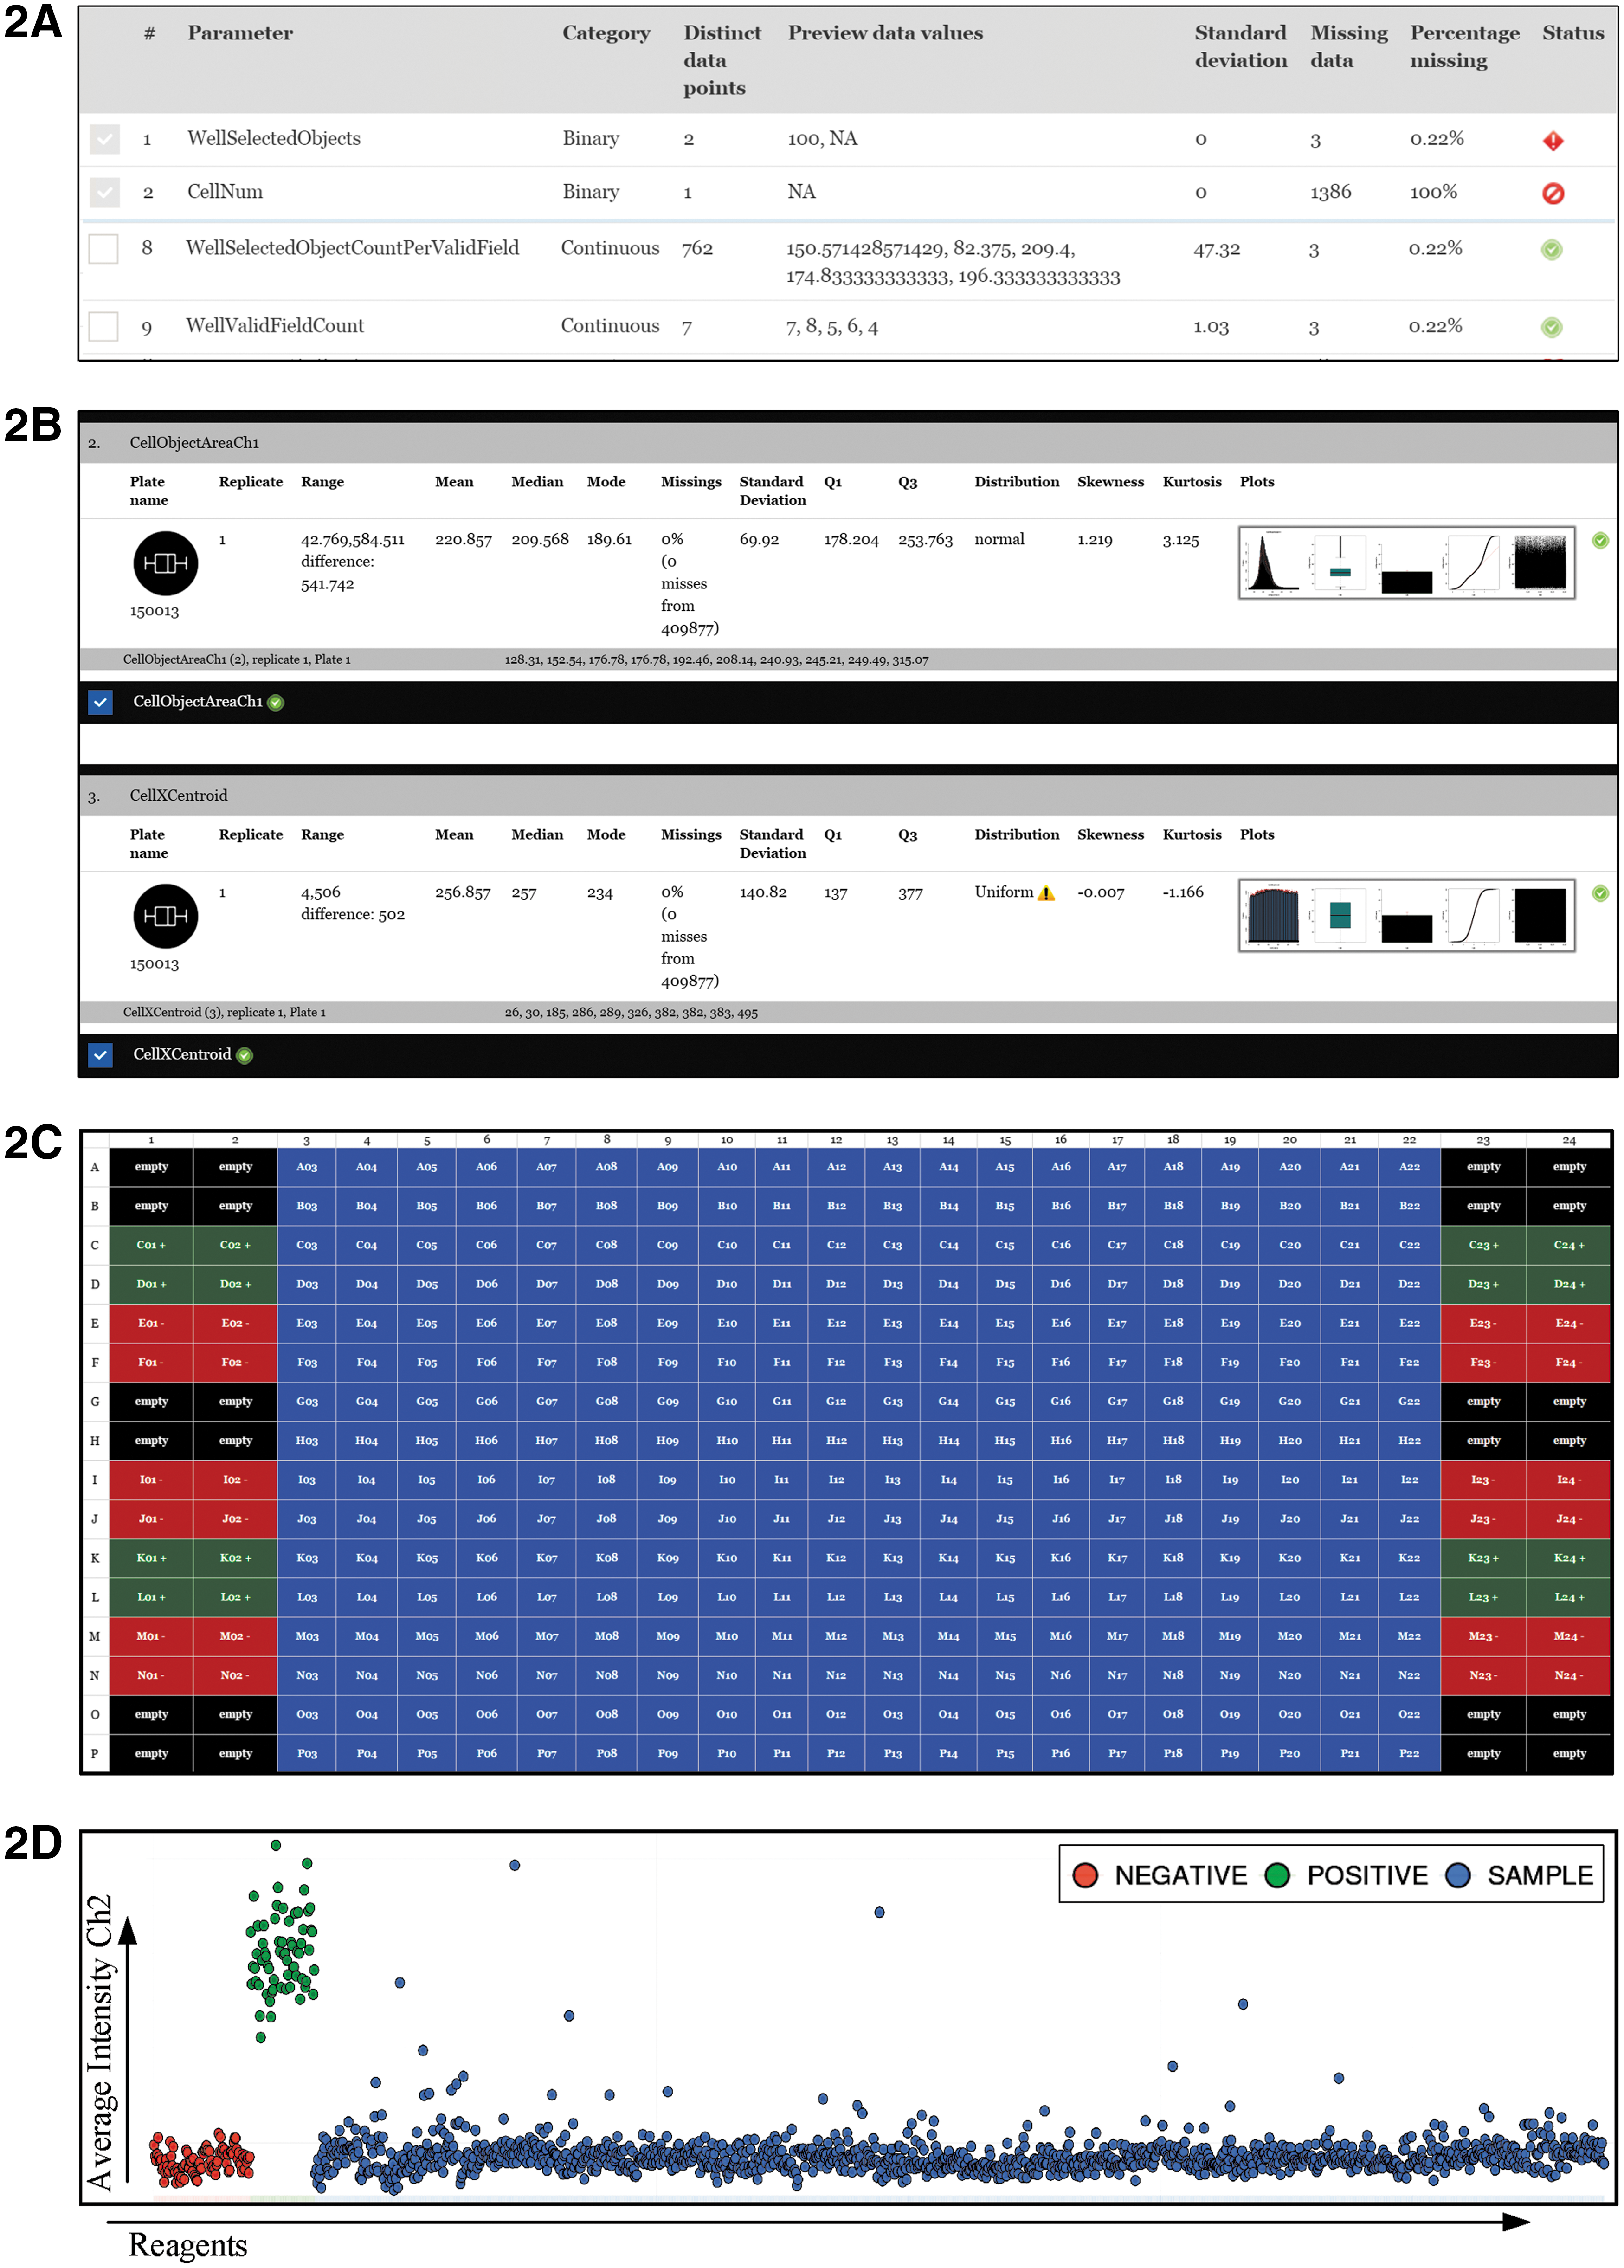
Parameter selection and quality control.
Parameter Selection
Basic metrics such as the range, median, mean, and standard deviation are calculated for each parameter across every replicate and plate. A visualization provides a scatterplot, an error bar, a QQ-plot, a boxplot, and a histogram of each parameter (Fig. 2B). HC StratoMineR calculates several parameter scores (estimators) for each well, based on the cells in a well, for example, inter quartile range (IQR), mean, trimmed mean, modus, median, and median absolute deviation (MAD).
Plate Configuration and Quality Control
In this step, the user can carry out quality control (QC) based on the performance of the screened reagents and controls. The user defines the plate map for the experiment. Each well is defined as a positive, negative, empty, or sample well or can be given a specific name (Fig. 2C). The user can choose various plots for each parameter across the whole dataset (Fig. 2D) and on a plate-to-plate basis to have more insight into data quality. Controls and samples are plotted separately. Also, plate wise strictly standardized mean difference, and Z′ are calculated. 8
Plate Normalization
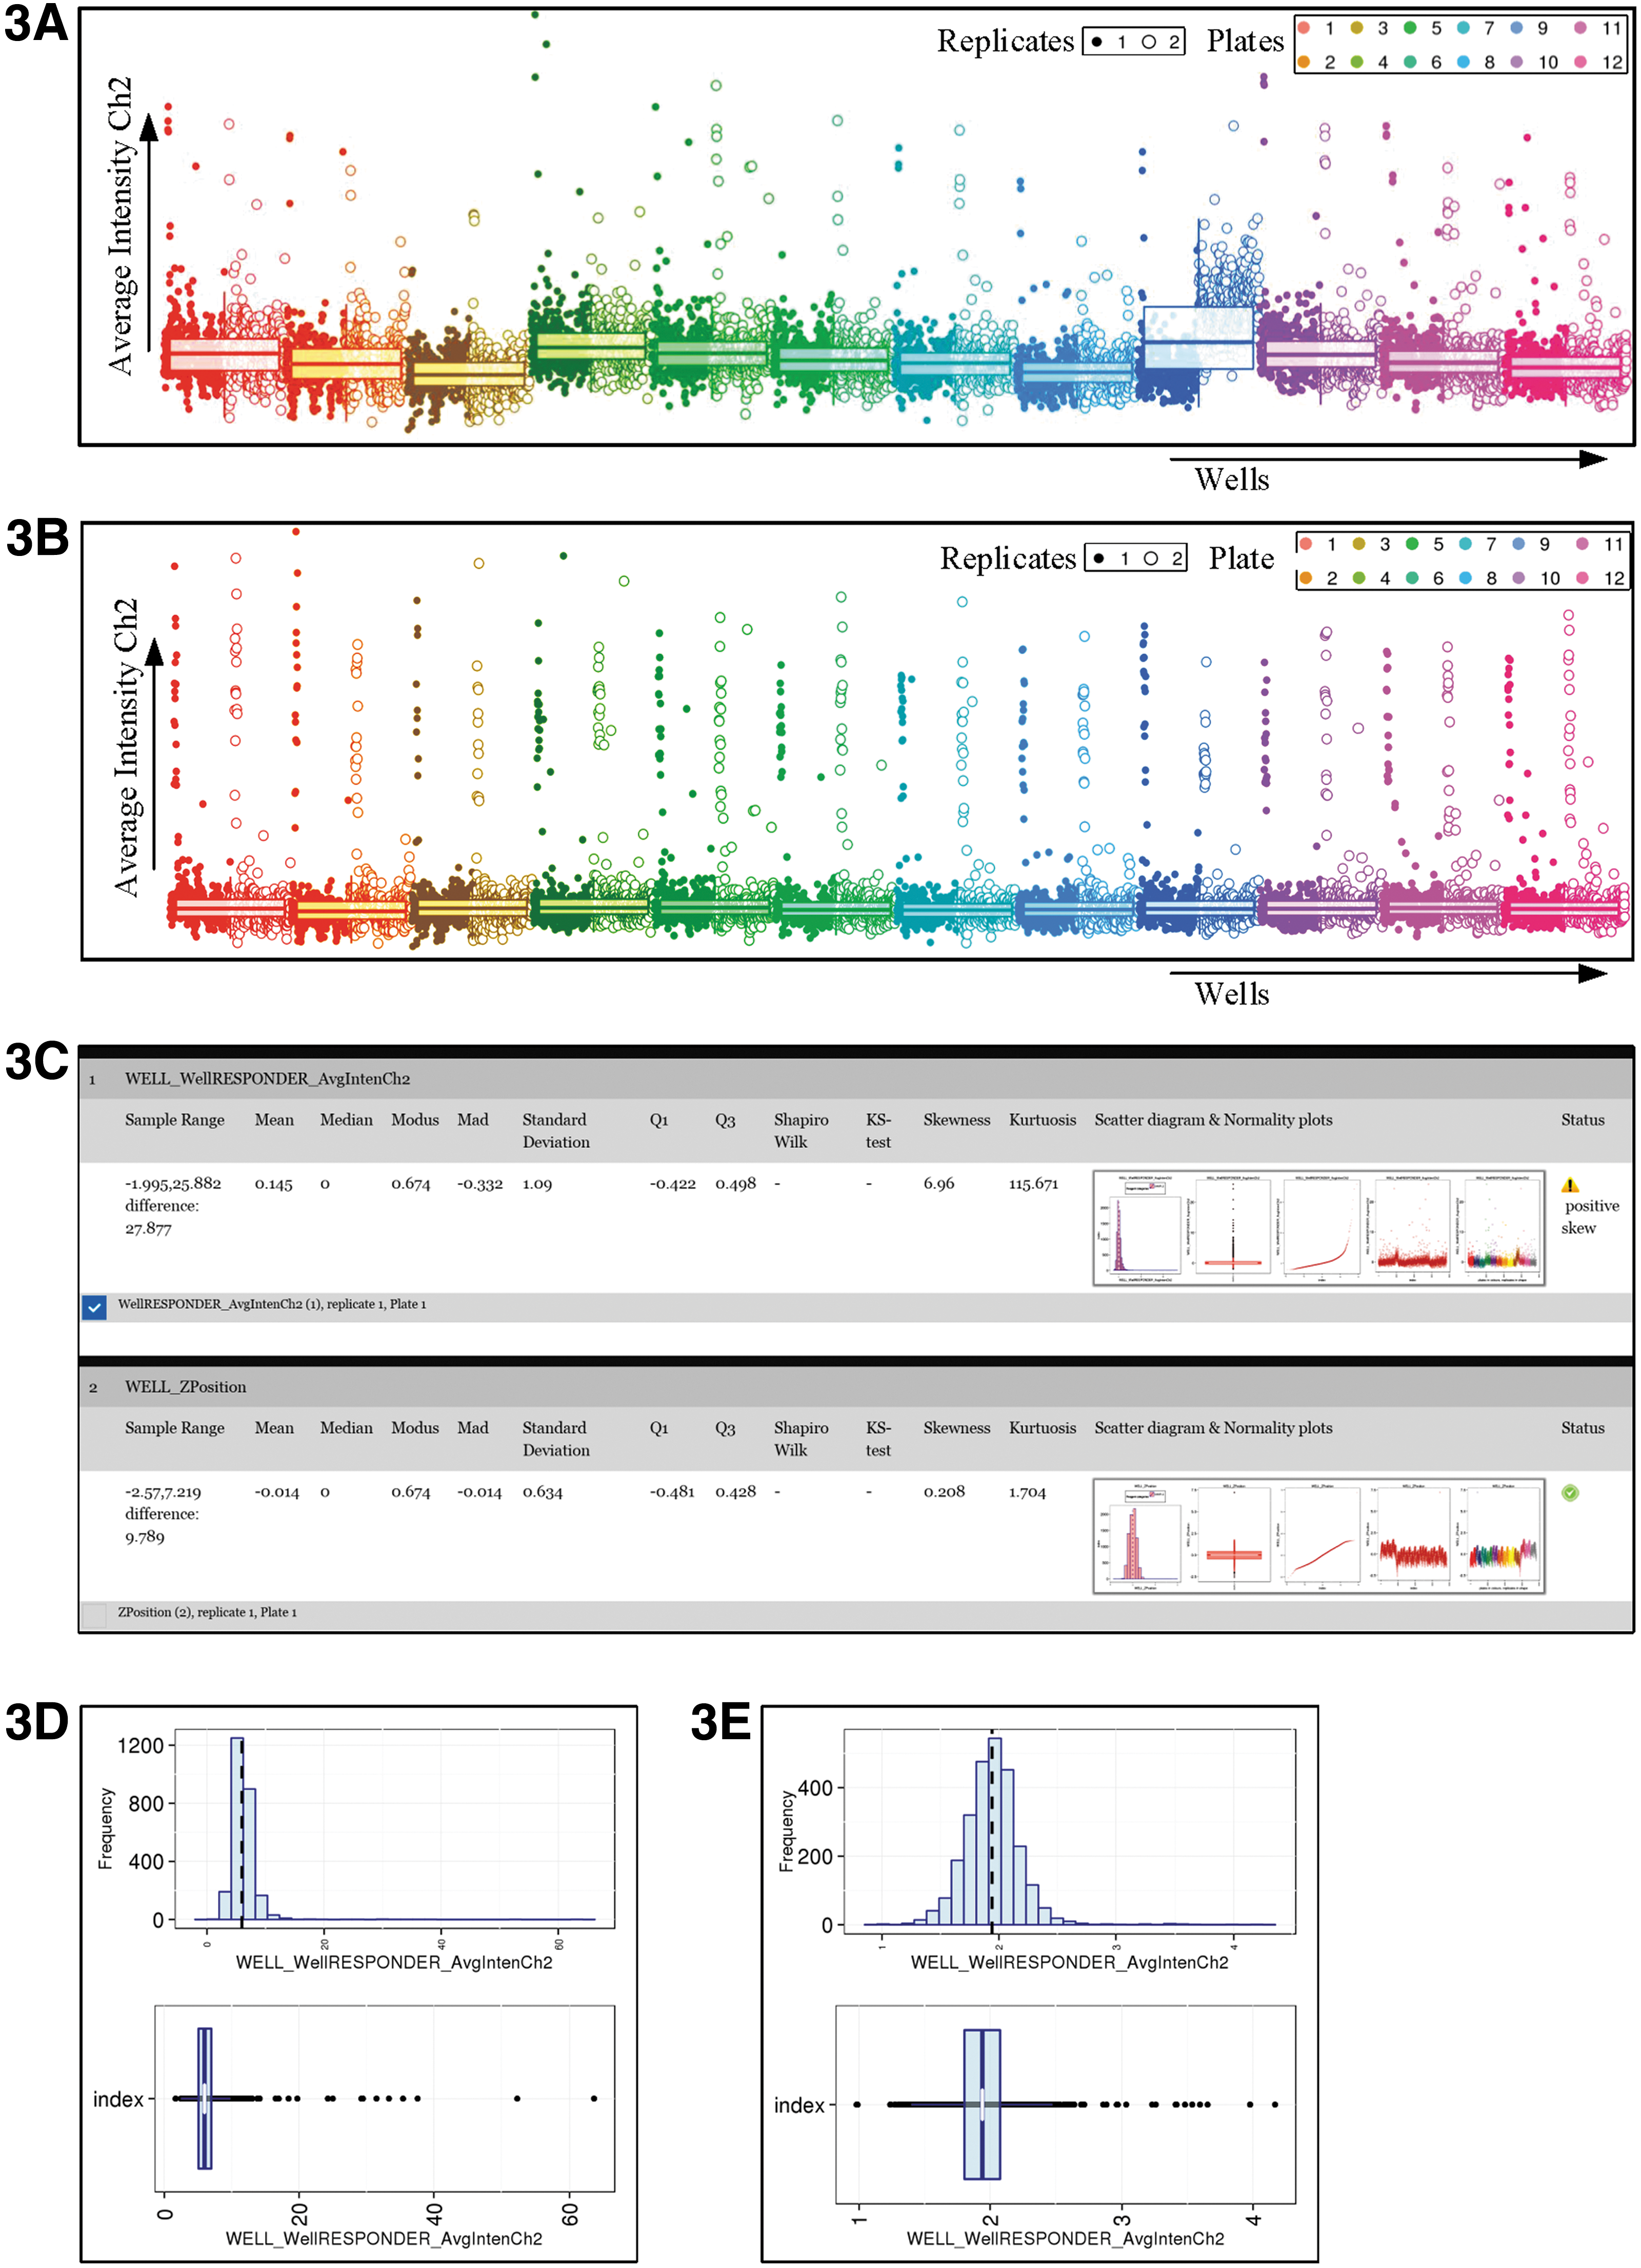
Next, the dataset can be normalized against its mean/median of the samples or against its negative or positive controls to account for plate-to-plate variation in assay performance (Fig. 3A, B). Plate effects can be addressed by using the B-score normalization method. A consistent normalization will be applied to all the parameters in the dataset in each plate. The user can preview the before and after effect before deciding to apply a particular normalization method (Fig. 3A, B).
Data normalization and data transformation.
Data Transformation
For the best results in subsequent analysis steps such as multiple imputation, common factor analysis (CFA), k-means, and cluster analysis, data should approximate a normal distribution. 9 For this reason, the parameters are checked for the requirement for transformation (Fig. 3C). This is done by measuring a significant skewness (P < 0.0001). Also, Shapiro–Wilk and Kolmogorov–Smirnov test results are provided. 10 –12 Information regarding each parameter is given, and HC StratoMineR provides suggestions as to whether and what transformation a parameter requires (Fig. 3D, E).
Multiple Imputation
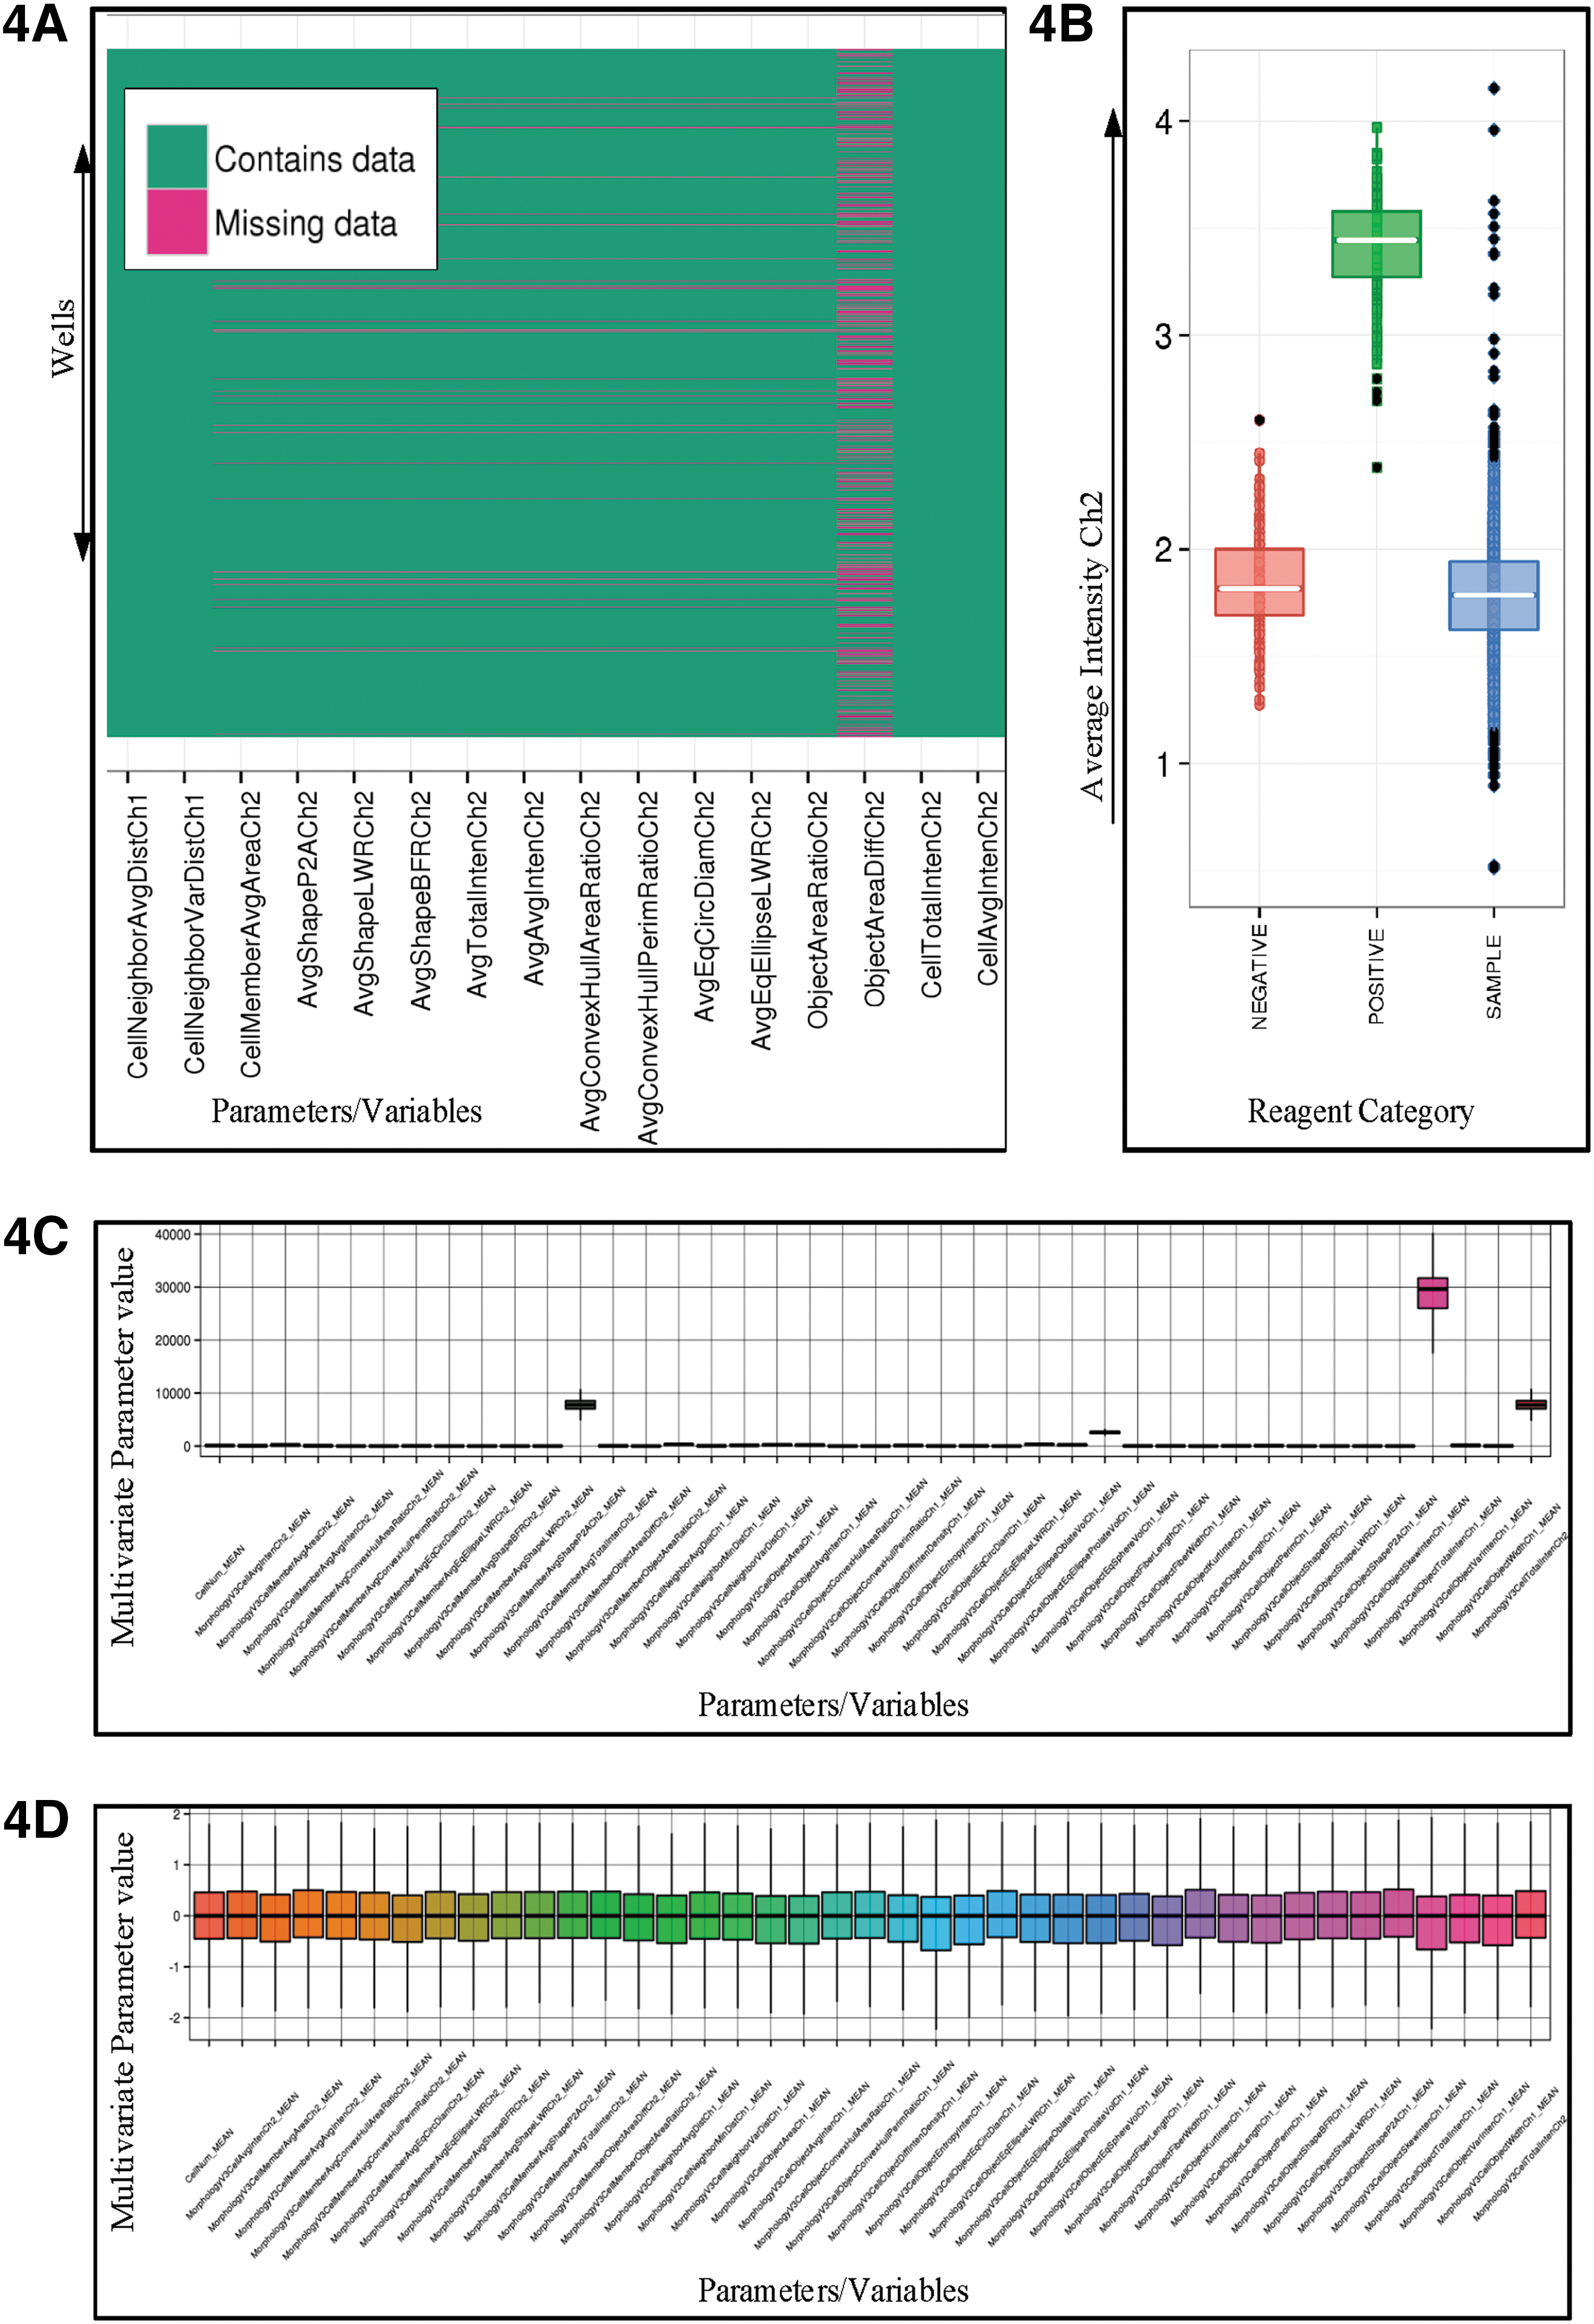
Missing data constitute a major complication in data mining, as many methods such as regression, factor analysis, k-means, and hierarchical cluster analysis cannot handle datasets containing missing data. In HCS, image analysis software may fail to generate measurements, leaving a missing (NULL/not available [NA]) value in the dataset. Also, in some rare cases, normalization or transformation methods can generate NA, not a number, −infinitive number (INF) or INF values (Fig. 4A). HC StratoMineR highlights parameters that contain a significant number of missing data points compared with the default parameter. Parameters containing missing data can be excluded from further steps. This does not involve omitting any reagents in the dataset. Row-wise deletion is not implemented, because this could involve excluding the majority of reagents from the dataset. Also, the user is able to leave out parameters based on the percentage of missing data or the fact that parameters do not show a difference between controls (Fig. 4B).
Missing data and data standardization.
There is a built-in order of functions that are run by HC StratoMineR to account for missing data. First, the median of the data from the other replicates for that same plate and location is used for imputation. If there are no data available from other replicates for the same parameter within the same reagent, there is no value to be imputed. In this case, Amelia II, 13 a package that can provide a solution for up to 50 parameters, is used. An expectation-maximization (EM) method in combination with bootstrapping and Bayesian hierarchical classification is applied. The method is an iteration and can be run in parallel. The method starts if the data matrix contains missing data. The data are bootstrapped; then, the EM model is built and used to impute the missing data. Finally, an analysis is done on the created imputed datasets in which they are merged into one solution, which is the final imputed data matrix. 13
If Amelia II fails (or the number of parameters exceeds the capacity of Amelia II), Mice, a multiple imputation technique based on regression, is applied to the data. 14 A column-wise median is imputed on any remaining parameters that contain missing data, which results in a matrix without any missing data.
Data Standardization
Data standardization, or feature scaling, prevents a bias toward a parameter that has a larger range. Many scaling methods have been proposed, including min-max, z-score, and robust z-score. 12 Depending on the nature of the screen, there could be a bias in variance and mean per plate or per replicate. That is why the user can choose to preview and apply a standardization method at plate level, replicate level, or if there is no bias, screen level (Fig. 4C, D).
Data Reduction
In HC StratoMineR, data reduction can be achieved by performing CFA or principal component analysis (PCA) based on a correlation matrix (Fig. 5A). The user can choose an orthogonal rotation where the resulting factors are independent, or an oblique rotation where the resulting factors can have an overlap. A major difference between PCA and CFA is that PCA is computationally less intensive, its goal is just to reduce the dimensionality in the data, and it does not require such strict assumptions. 9 Each factor or component is visualized in a separate polar plot, indicating the loadings for each parameter in that factor (Fig. 5B). At the end of the data reduction phase, the loadings are used to calculate the factor scores for every sample and control well. The effect of data reduction is shown in comparison to the original parameters (Fig. 5C, D).
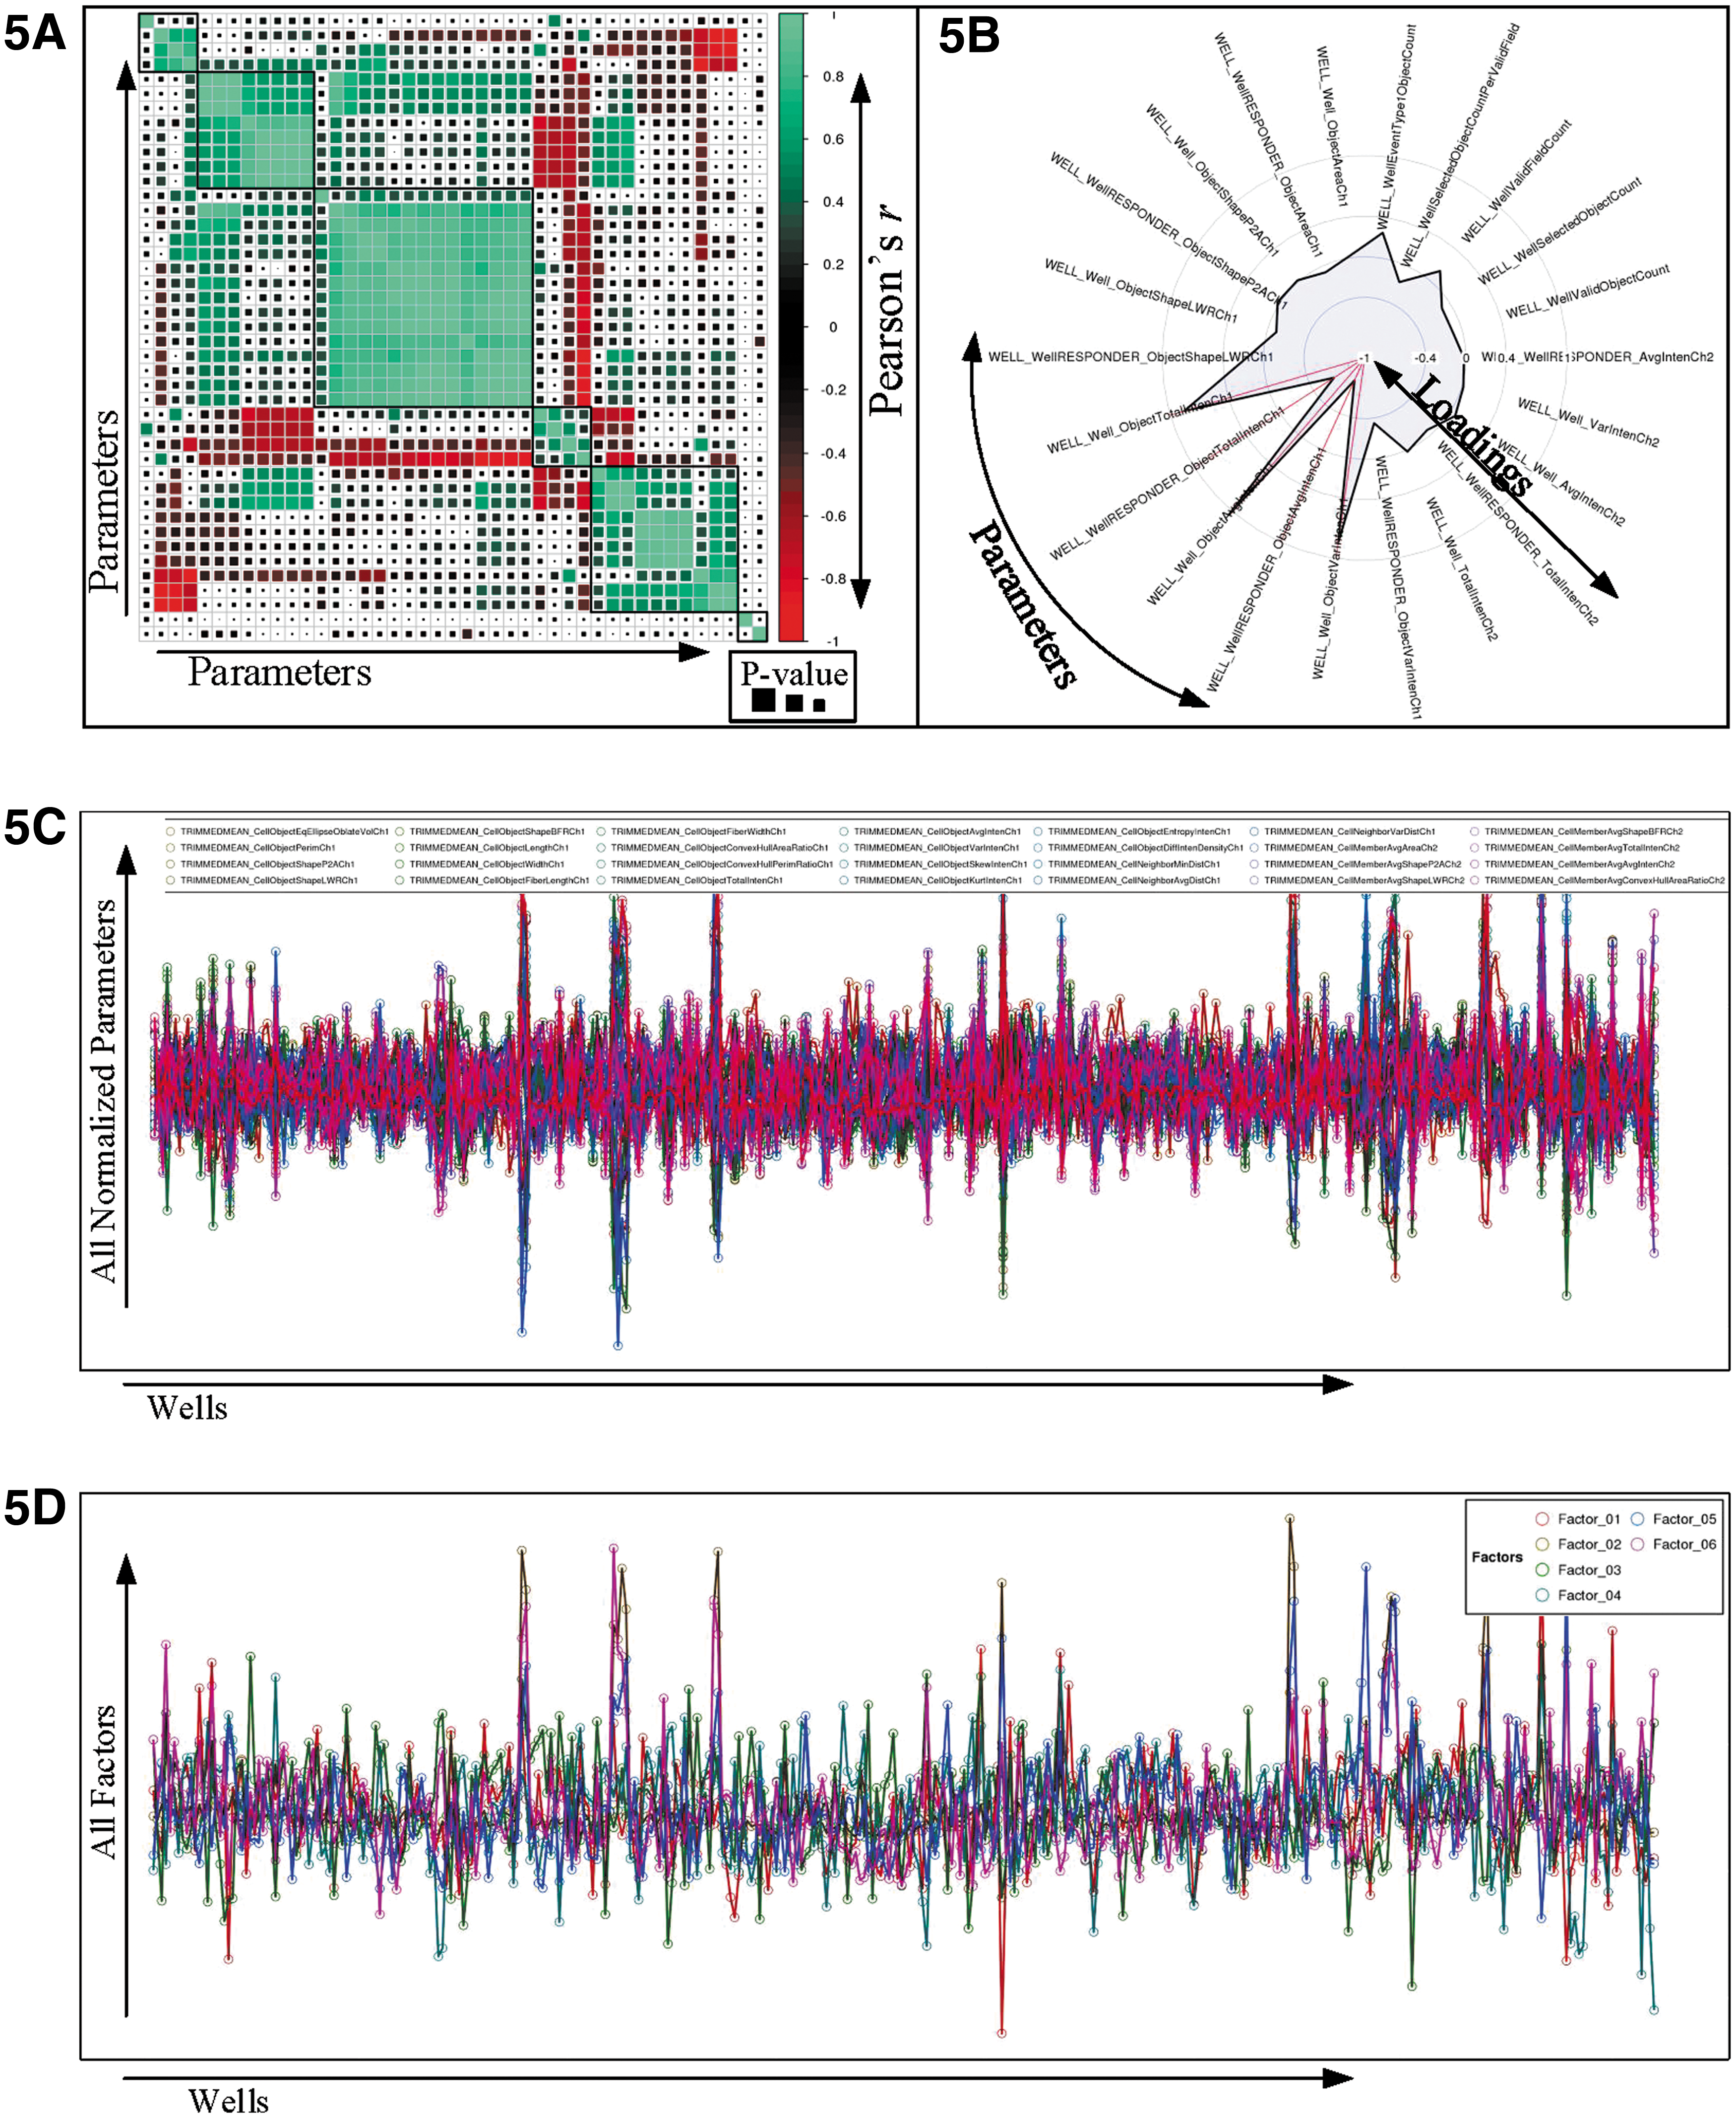
Data reduction.
Hit Picking
Hit selection uses a subset of the individual parameters or calculated factor scores generated in the data reduction step to identify significant outlier samples, which are different from one of the selected controls. The Manhattan distance (another preferred distance metric) of all the vectors to the controls is calculated on a plate-to-plate basis for each replicate (Fig. 6A). This reduces the data for each record to just one distance score, regardless of the number of dimensions. This distance is a measure of the phenotypic effect of the sample on the cells in that well. 5 The Manhattan distances are then transformed to P values by using a Poisson probability distribution with the Lambda of the sample distribution. Statistically significant hits can then be identified for each replicate based on the desired P value (e.g., ≤0.05). Hit selection is carried out for each plate separately due to plate-to-plate variation. Optionally, the mean/median of the Manhattan distances for each well based on its replicates is calculated. The result of the chosen strategy is visualized in a scatter plot, which indicates the selection of hits (Fig. 6A).
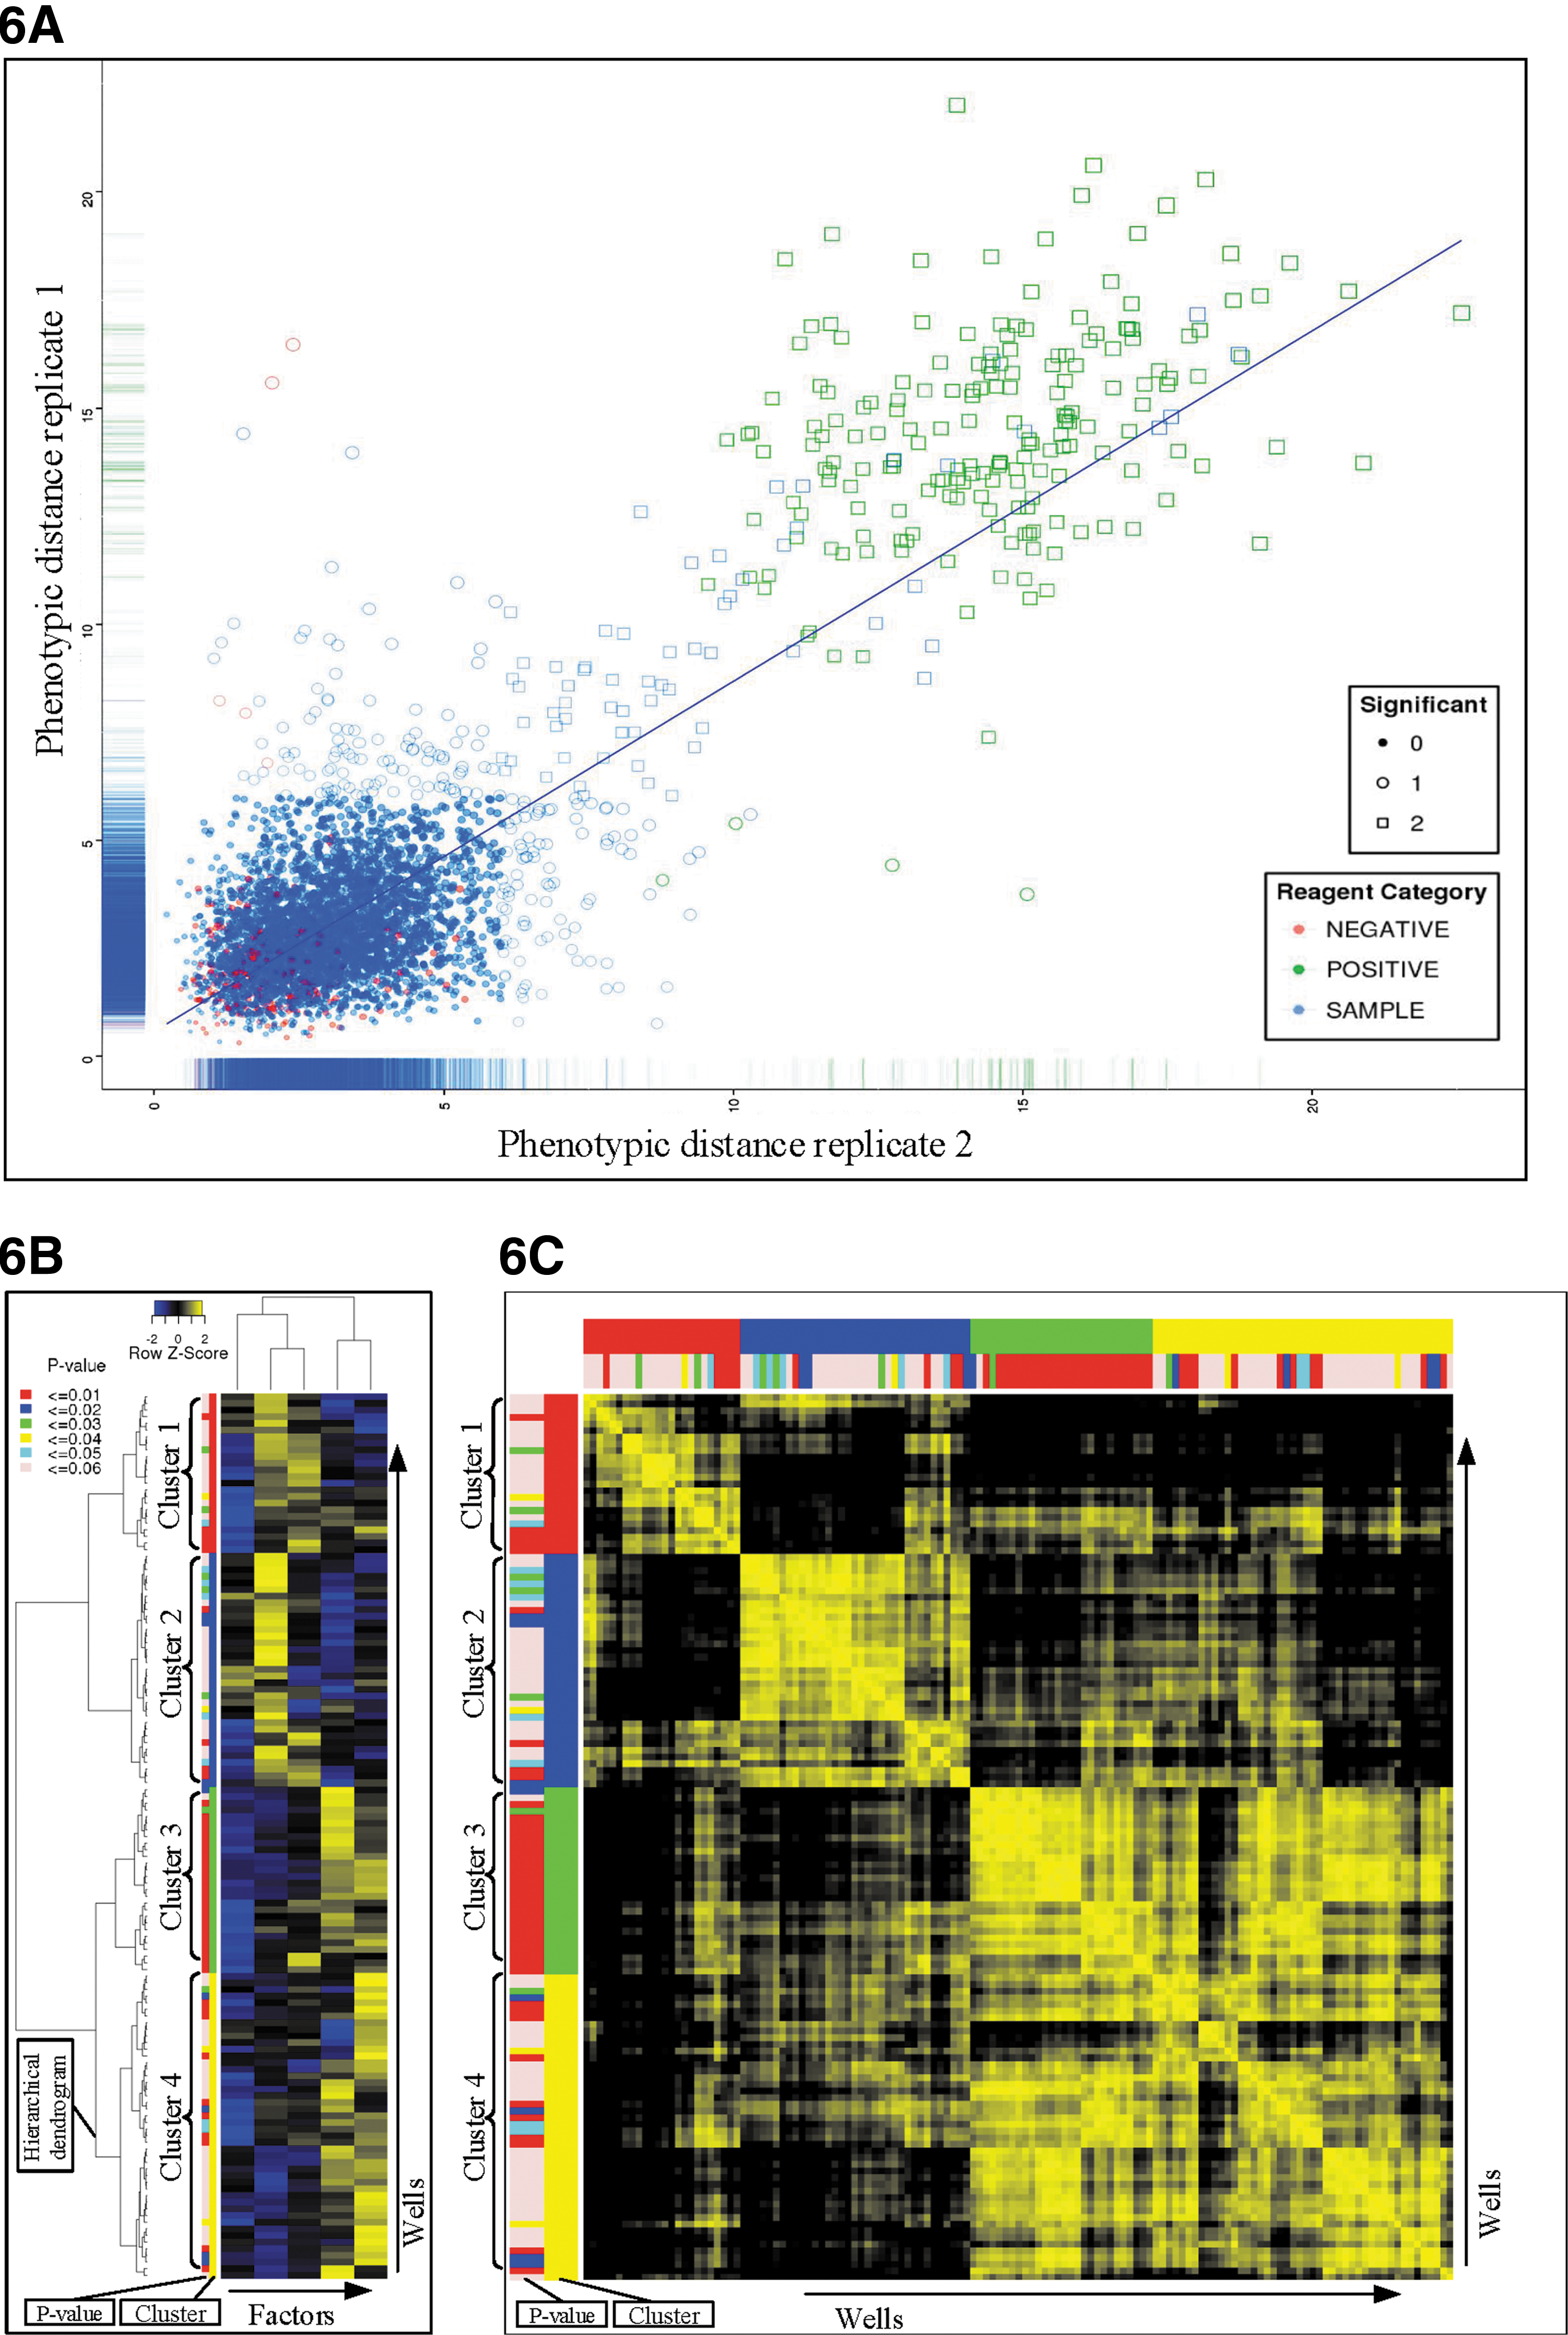
Hit selection and cluster analysis.
Clustering
Hierarchical cluster analysis can then be performed on the statistically significant hits based on the selected parameters or factors created in the data reduction phase 5 (Fig. 6B). The clustering method can be chosen and is set on Ward's linkage criteria by default, as this creates compact clusters that share their similarities with their neighbors. 15 The final visualization of the data is a similarity matrix (Fig. 6C). For each combination of phenotypic vectors, a cosine vector score is calculated. This is a measure of the angle between the vectors, which may be seen as the similarity of the effect of samples. A generated matrix contains the scores for the possible combinations of samples. These are again clustered according to the same order as the hierarchical cluster analysis. These clustering results are visualized in heat maps with dendrograms for the records (reagents) and a K-means visualization stitched to the heat map to identify clusters or groups of similar reagents and controls (Fig. 6B, C). The number of clusters can be automatically detected by partitioning around medoids using the fpc package or can be set manually. 16 A less complex visualization, a multidimensional scaling (MDS) plot is also provided, which shows the first and second dimensions of MDS in a scatterplot.
Results
HC StratoMineR uses numeric parameters that are extracted from the images of individual cells to first identify outliers and then cluster the outliers according to the similarity of the resulting profiles. It does this in an unbiased fashion, and the result should be that cells from wells that cluster apart in the data mining step display different morphologies. It should also allow the user to functionally categorize hits. We validated these in two high-content screens: a chemical screen and a genome-wide siRNA knock-down screen, respectively.
The chemical screen was used to characterize 51 compounds that had previously been identified in a screen for small molecules that have the ability to kill cells that are highly resistant to apoptotic stimuli. 17 Our assay included three fluorescent labels: Hoechst dye for staining DNA; Lysotracker Red that accumulates and is fluorescent in acidic organelles (in mammalian cells, these are predominantly lysosomes); and Calcein-AM, a marker for cell viability and overall cell morphology. The multiparameter data from the screen were processed with HC StratoMineR generating four factors. All 51 compounds were clustered (Fig. 7A), and we identified four strong clusters. Clusters 1 and 4 included Fenretinide and Siramesine, respectively, compounds that had been included as controls, since they had been previously described to accumulate in lysosomes and induce cell death. Pimozide and Clomiphene were found in Cluster 4 with Siramesine (Fig. 7A) and, indeed, showed greatly decreased Lysotracker staining (Fig. 7D), which was consistent with a phenotype of lysosomal accumulation. Astemizole was in Cluster 1 with Fenretinide (Fig. 7D), showing a similar lysosomal phenotype. The similarity in the profiles of Siramesine and Fenretinide suggests that these compounds may kill cancer cells via a mechanism of action that involves lysosomal dysfunction, which is consistent with previous studies on Siramesine. 18 Auranofin clustered with Staurosporine in Cluster 3 and did not show loss of Lysotracker staining (Fig. 7D). Therefore, it is probable that compounds in Cluster 3 can kill cancer cells by a different mechanism of action that does not involve the lysosome. Cluster 2 consisted of just one compound Mitoxantrone, which gave a very strong distinct phenotype (Fig. 7D), with greatly decreased Calcein-AM staining.

High-content chemical screen.
Investigation of the phenotypic similarity matrix (Fig. 7B) highlighted the individual clusters and also showed similarity between Clusters 1 and 3 and between Clusters 1 and 4. Cluster 4, however, is clearly morphologically very distinct from Cluster 3. One possibility is that compounds in Cluster 4 (such as Siramesine) may trigger a mechanism of action that depends solely on lysosomal accumulation; whereas those in Cluster 1 (like Astemizole) may also have contributions from other biological phenomena to its final cytotoxic mechanism of action. More characterization and possibly the combination of different high-content assays would be necessary to confirm and define the biological phenomena involved.
A compound similarity matrix was also generated based on the clustering data from HC StratoMineR. This highlights a large number of similar structures in Clusters 1 and 4 (Fig. 7C, E). These compounds are cationic amphiphilic drugs (CADs), and intriguingly, this class of compounds has previously been shown to accumulate in the lysosomes where they get trapped after protonation in the acidic lysosomal lumen. Because of these physicochemical characteristics, cationic amphiphilic compounds would be expected to interfere with the lysosomal pH gradient, altering the lysosomal enzymes' activity. 19
The results from this experiment clearly validate the ability of HC StratoMineR to successfully categorize the phenotypic responses of cells to small molecules. The results also highlight the power of this form of high-content analysis in that one can see structure–activity relationships in the mined data.
To demonstrate the utility of HC StratoMineR for the analysis of larger datasets, we used it to process data from a high-content, genome-wide siRNA knock-down screen. The goal of the screen was to identify genes involved in the regulation of mitosis. 20 After siRNA knock-down, cells were labeled with 4′,6-diamidino-2-phenylindole (DAPI) to identify the nucleus and an antibody against phosphorylated histone H3 to identify cells in mitosis. The screen was carried out in duplicate in one hundred twenty-four 384-well assay plates. Numeric data were generated at the cellular level, resulting in a dataset of 45,586,699 data records (∼3.3 billion data points and ∼12.1 GB) across 74 parameters, of which 57 were analytical. Of these, 41 were found to be useful for factor analysis. See “Analysis Steps” in Supplementary Data for more details on the actions taken in each step.
We initially used this dataset to compare various analysis strategies within HC StratoMineR. Biologists who do not have access to bioinformatics services or advanced data-handling tools are often limited to simple analyses, for example, only using one parameter from a high-content dataset. To demonstrate how HC StratoMineR could be used to get more value from a particular dataset, we analyzed our genome-wide dataset with increasing levels of analytical rigor. The output was evaluated by looking at the number of the statistically significant hits (Table 1).
Comparison of Data Analysis Methods
IQR, interquartile range; MAD, median absolute deviation.
Our most simple analysis strategy (see Strategy 1 in Table 1) was similar to what is frequently used by screeners who do not have access to advanced bioinformatics tools. This is a single-parameter well-level analysis based on the percentage of cells positive for anti-phosphohistone H3 staining. This was determined based on a cut-off defined by the screener and gave 213 statistically significant hits.
The use of one common factor (see Strategy 2 in Table 1) that contained multiple parameters linked to anti-phosphohistone H3 staining gave 247 statistically significant hits. Switching to cell-level data, however, gave us the opportunity to use robust identifiers such as the MAD, IQR, or trimmed mean. The use of MAD gave an increase of 338 hits. This along with the use of multiple factors allowed us to increase the number of statistically significant hits almost three-fold (Strategy 4–7) to a maximum of 634. The increased number of statistically significant hits detected does lead to a decrease in the percentage of mitotic hits, 19.24% (41) in Strategy 1 versus 10.72% (68) (see Strategy 7, Table 1). This is due to the fact that by including all of our factors, we are asking a broader question of our data and so we are picking up more phenotypic hits that are not necessarily directly related to mitotic arrest. The increase of statistically significant hits is not, by itself, necessarily desirable as it, no doubt, introduces larger numbers of false positives or hits that are not relevant to the goal of the screen.
Indeed, it is known that functional genomic screens using readouts that are related to the cell cycle or viability frequently produce hits from the proteasome, various protein synthesis-related complexes such as the ribosome, and RNA splicing machinery. 21 To determine whether we could separate the various biological processes represented in the statistically significant hits, we performed cluster analysis that generated seven clusters by using four factors with high factor loadings based on anti-phospho histone H3 parameters (Fig. 8A). We took the lists of hits from each cluster and based on network analysis in STRING DB, 22 and literature search, we assigned them to the following categories: splicing, mitosis, ribosome, and proteasome. It was immediately clear that there was functional separation in the clusters (Fig. 8B). Clusters 4 and 5 were the most highly enriched for mitotic genes, whereas ribosome and proteasome genes were enriched in Clusters 1, 2, and 3 (Fig. 8B). The splicing genes, however, did not, in this analysis, separate from the mitotic genes. This would suggest that the phenotypes are very similar in this assay. Clusters 6 and 7 did not contain significantly enriched genes from the four assigned categories.
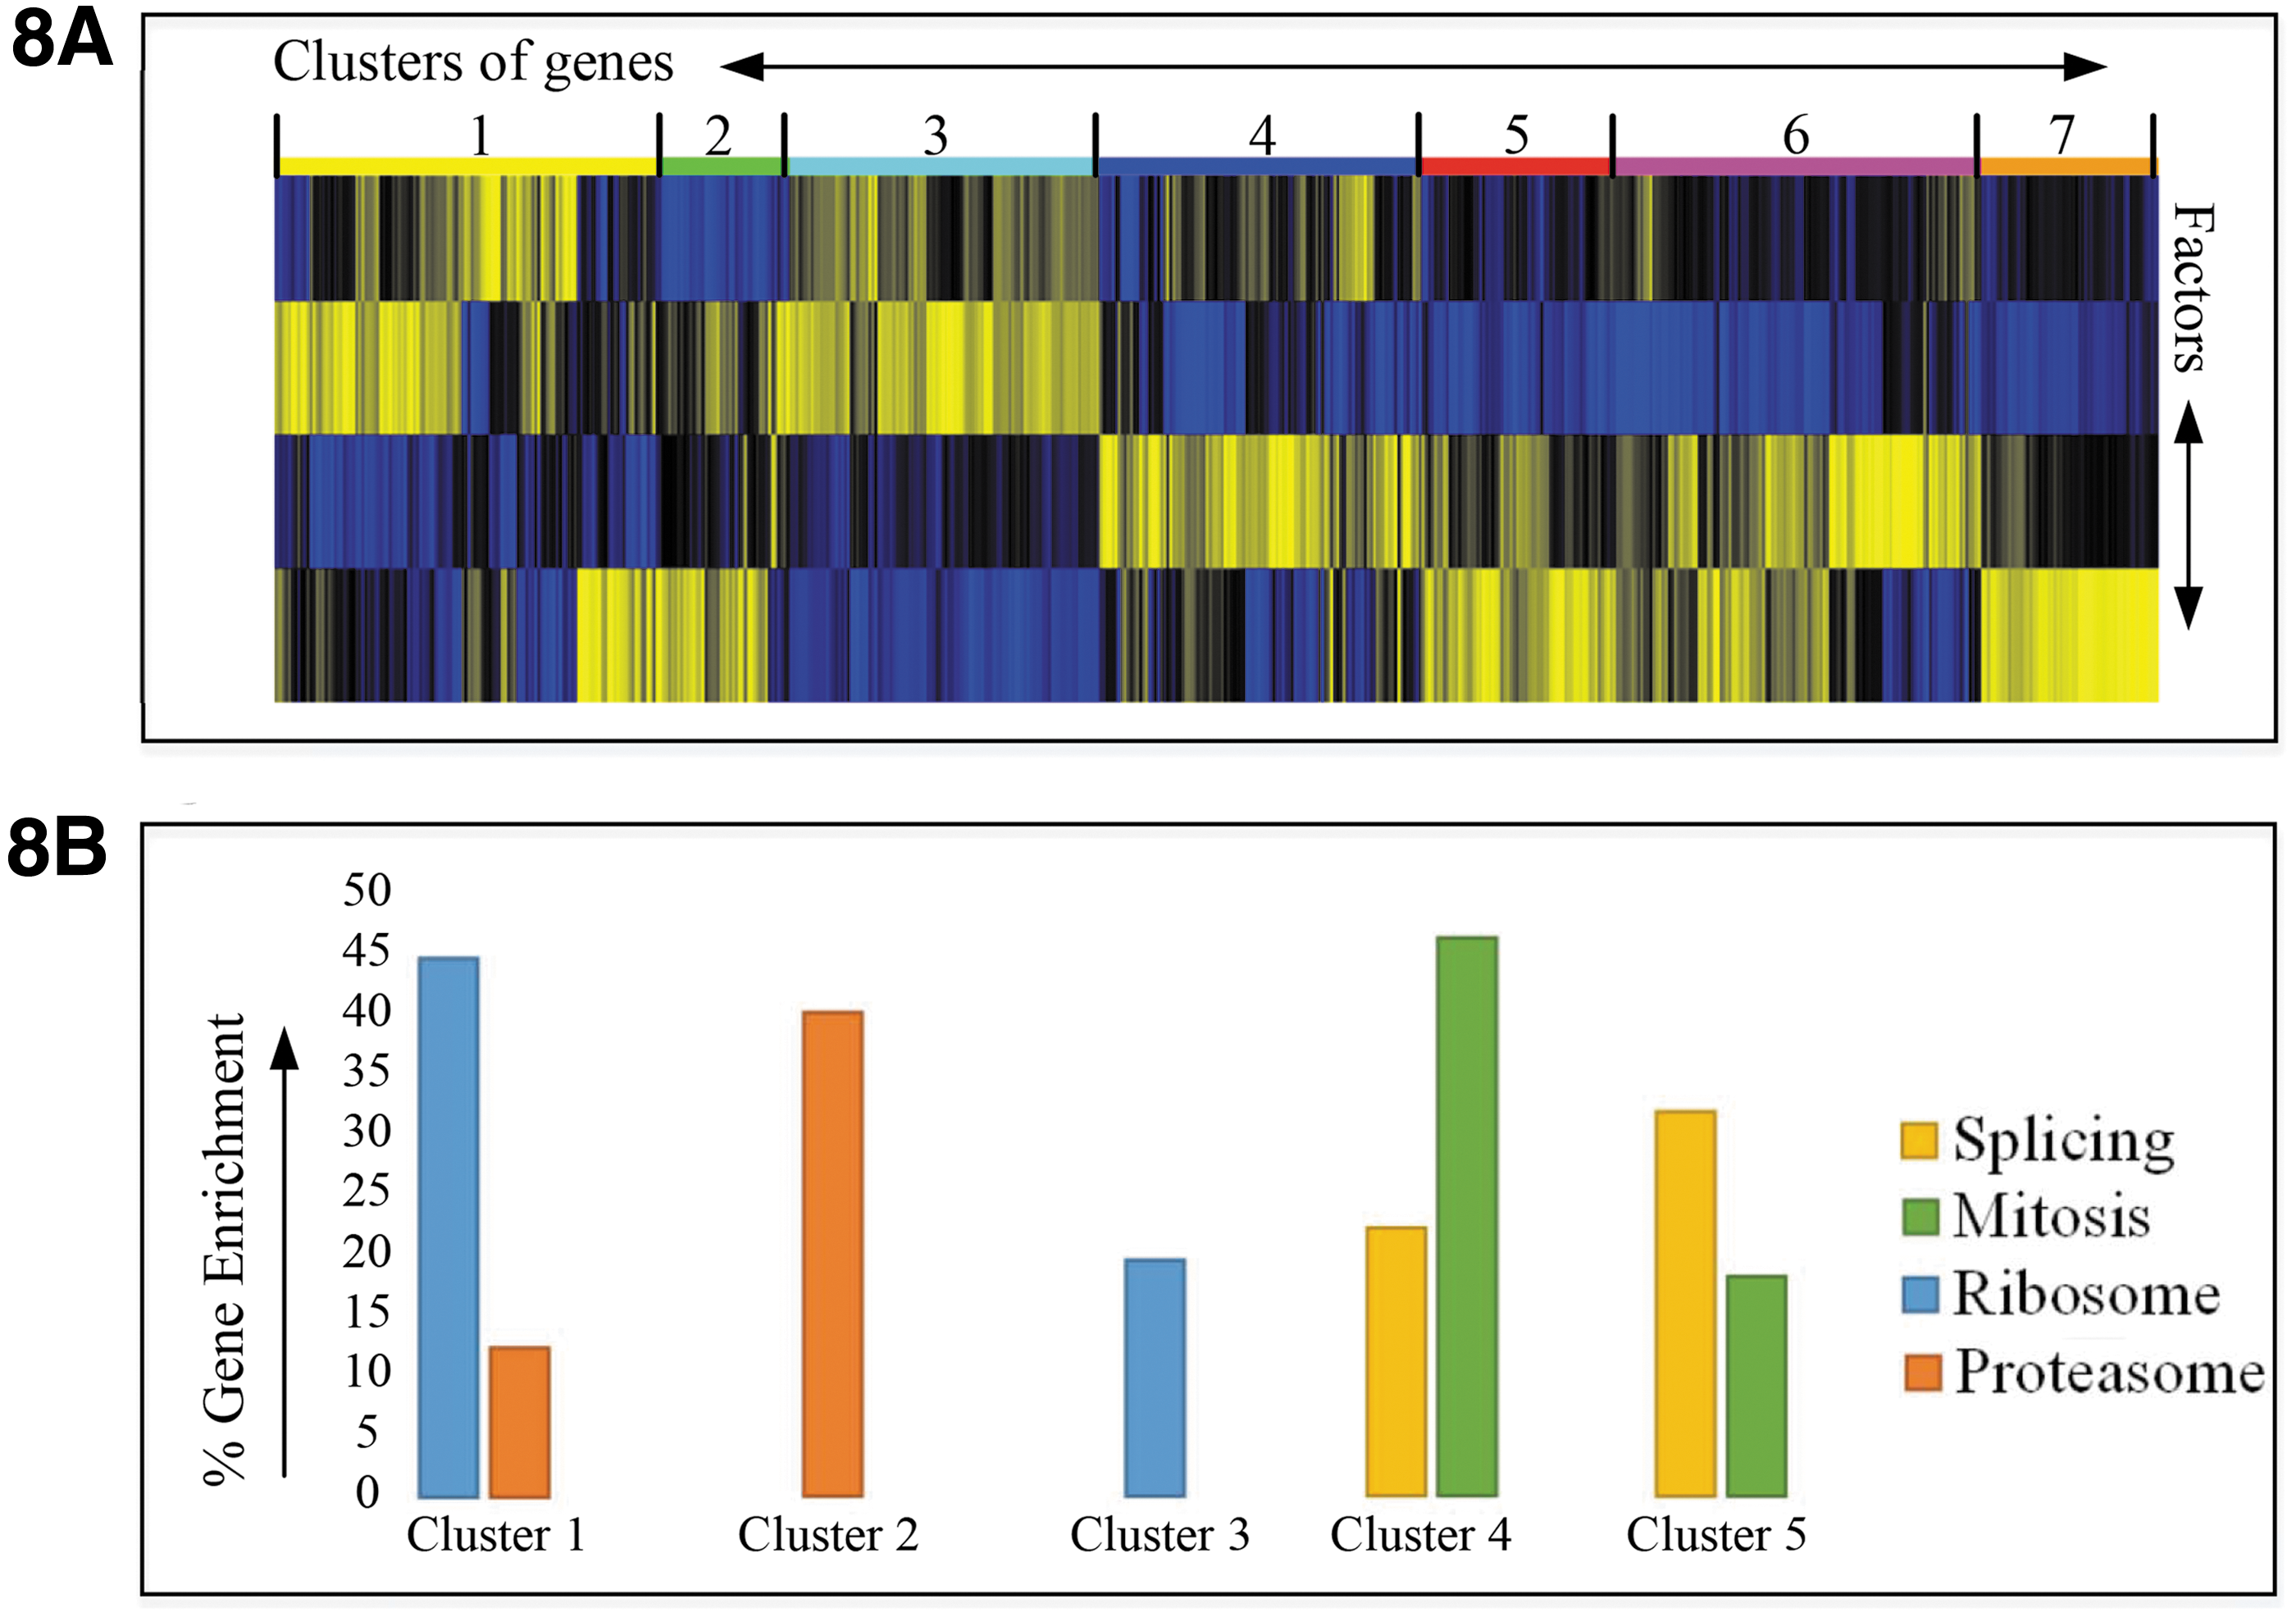
High-content analysis of a genome-wide siRNA knock-down screen.
These results suggest that HC StratoMineR can not only help researchers identify more hits but also help them identify sections of the dataset that are highly enriched for the hits that are relevant to their biology of interest. Our analysis would suggest that novel genes involved in mitosis are more likely to be found in Clusters 4 or 5 than in Clusters 1, 2, or 3. The use of the more advanced method in HC StratoMineR, thus, increased the percentage of relevant mitotic genes by 66% compared with the simplest analysis (see Strategy 1, Table 1).
One important goal in the development of HC StratoMineR was to have a tool that could rapidly analyze large datasets. In our workflow, the computations involved in the Parameter Selection step are rate limiting when it comes to completing a particular analysis. To benchmark the performance of HC StratoMineR, we carried out analyses of varying complexities and with different hardware. With the use of HPC and multithreading, we could complete the rate-limiting step for our genome-wide screen in 7 min (Table 2).
Analysis Time
HPC, high-performance computing.
Discussion
HCS technology was first developed in the 1990s; however, although the use of HCS instrumentation has become widespread, it is clear that many users are not making full use of the power of multiparameter data analysis at cellular resolution. Our experience at the Cell Screening Core leads us to believe that this is due to a lack of access to the appropriate bioinformatics and biostatistics skills, tools, and hardware required to mine complex datasets. Indeed, this is a problem throughout the wider area of life sciences, as it becomes increasingly easy for biologists to generate larger and more complex datasets by using various omics technologies. Our goal in the development of HC StratoMineR was to develop a tool that would allow biologists to independently mine high-content datasets. The need for such tools is also being driven by the resurgence of interest in phenotypic screens for drug discovery. There is an emerging strategy in the pharmaceuticals industry based on the idea that phenotypic screens are more promising for first-in-class molecules. The molecules from such screens can be used to help identify the (often multiple) useful drug targets for a disease. These can then be addressed by using more targeted approaches. 23
Our validation of the tool has already highlighted many useful features of the software. The QC functionality makes it very easy to get a good overview of the quality of the data at an early stage while the screen is in progress. The CFA functionality has proved to be invaluable. Even though the factors are generated in an unbiased fashion, users can see the underlying biology being represented in the factors that are generated. If a DNA label such as Hoechst or DAPI is included in the assay, we almost invariably see a factor appearing that is related to cellular toxicity. Users can then choose the factors that are related to their question of interest or if they are interested in a broader question, they can include all factors.
One of the most valuable features of HC StratoMineR has proved to be the speed with which large datasets can be analyzed. If a researcher has to work with a bioinformatician to develop scripts for the analysis of data, there are invariably delays, as the biologist needs to educate the bioinformatician about the biological problem. This slows the iterations of data analysis, and the result is that fewer strategies for data analysis are tested. In the case of the genome-wide dataset, we presented HC StratoMineR and reduced the analysis time from months to hours. Also, the data analysis method is frequently not addressed until after the data acquisition has finished. HC StratoMineR can be used at all stages of the project, and this gives the user the ability to develop the analysis method at the piloting stage. This can inform the way the screen is run.
Our high-content chemical screen demonstrated the value of HC StratoMineR for phenotypic drug discovery. We were able to correctly identify the CADs as disrupters of lysosomal function and the phenotypical separation of these from apoptosis-inducing compounds such as Staurosporine and Auranofin.
The data from our siRNA knock-down screen demonstrated how HC StratoMineR can be used to improve the mining of phenotypic functional genomics datasets. The ability to identify more phenotypic hits and then use the clustering functionality to identify clusters that are enriched for hits of interest will potentially allow screeners to get past the “low hanging fruit” problem and identify weaker hits that are functionally relevant. Critically, HC StratoMineR allows analyses to be done more quickly, thus relieving an analysis bottleneck in HCS.
Footnotes
Acknowledgments
The authors would like to thank the DBG IT Department and especially Patrick Kemmeren and Bertjan Goorkate for assisting them and providing access to the local high-performance computing cluster at the University Medical Center Utrecht.
Disclosure Statement
W.A.O. and D.A.E. are in the process of establishing a company to market a commercial version of HC StratoMineR.