
Abstract
Cell viability and proliferation assays are a fundamental tool in the drug discovery process and are used to evaluate both the antiproliferative potency and toxicity of compounds. Some lead discovery groups generate cell viability data for up to two million compounds per screen, so any method used to assess these parameters needs to deliver not only on data quality but also on throughput and assay cost per well. Most methods used to determine cell viability cannot deliver on all three of these requirements, so compromises have to be made. Here we show the development and implementation of a cost-effective, no-wash phenotypic assay to simultaneously report the number of cells, percentage of live cells, and cell cycle phase distribution as markers of proliferation and viability. We demonstrate that this assay can be applied to high-density plate formats and be imaged and analyzed in 8 min per plate on a laser scanning imaging cytometer. By comparing the drug–responses of several well-characterized anticancer drugs on HeLa cells, we highlight the key differences between the phenotypic assay and a commercial ATP luminescence detection system.
Introduction
Cell viability and proliferation assays are a fundamental tool in the drug discovery process and are used to evaluate both the antiproliferative potency and toxicity of compounds. 1 Some lead discovery groups generate cell viability data for up to two million compounds per screen, 2 so any method used to assess these parameters needs to deliver not only on data quality but also on throughput and assay cost per well. Most methods used to determine cell viability cannot deliver on all three of these requirements, so compromises have to be made.
Phenotypic assays can be used for direct cell enumeration by counting the number of cells or nuclei per well. In addition, by multiplexing different fluorescent readouts in the same well, more complex drug–response profiles can be obtained, for example, the number of live or dead cells per well, changes in DNA content, or cell morphology. 3 It is the multiparametric nature that underpins the true power of this approach, which allows ready distinction between cytostatic and cytotoxic mechanisms of action, 4 and further pathway subclassification into cell cycle arrest. 5 Understanding mechanisms of action is critical for optimizing drug candidates, since off-target cytotoxicity is a frequent problem with many compounds. 6 Despite their recognized utility, phenotypic assays have not been widely adopted in high-throughput screening (HTS), as they were traditionally complex to set up, required highly specialized instrumentation and operators, and were ultimately too slow to run in high-throughput environments. 7
By contrast, many biochemical viability assays involve a simple homogeneous assay setup that lends itself to miniaturization and automation, thus enabling very high throughputs. However, such assays only give indirect measurements of number of cells and viability by determining the metabolic activity of all cells in the well with ATP luminescence systems, 8 or with MTS reagents that measure dehydrogenase activity. 9 A linear relationship between the assay signal, the number of cells, and their viability is assumed, but it has been shown that this assumption is not always justified 10 : Many well-known cancer drugs lead to cell cycle arrest long before cytotoxic effects become apparent and ATP luminescence measurements cannot distinguish between increases in average cell size and genuine cell proliferation. 1 The limitation of using ATP luminescence measurements as a surrogate marker for cell viability and cell count is, therefore, not the robustness of the assay readout itself, but rather lies in misinterpretation of the data, which runs the risk of underestimating drug potency and overestimating toxicity. Although this approach has value in that it offers a simple and robust HTS approach for ATP content determination, there is no doubt that phenotypic approaches can provide much more detailed information, such as mode of action.
Practical high-content screening with phenotypic readouts has been used for many years, but the simplicity of the instruments, speed of image capture, image processing, and the resulting data file sizes are not yet comparable with biochemical assays. Phenotypic screening with the acumen Cellista imaging cytometer aims to bridge this gap. By using laser scanning cytometry, whole well images of 96- to 1536-well plates can be captured, analyzed, and exported in as little as 5 min per plate, 3 with whole plate cytometric files sizes being in the range of 10–100 s of megabytes, rather than several gigabytes that can be generated by traditional image-based analysis.
Here we show the development and implementation of a cost-effective, no-wash phenotypic assay to simultaneously report the number of cells, percentage of live cells, and cell cycle phase distribution as markers of proliferation and viability. We demonstrate that this assay can be applied to high-density plate formats, and be imaged and analyzed in 8 min per plate using the acumen Cellista laser scanning imaging cytometer from TTP Labtech. By comparing the drug–responses of several well-characterized anticancer drugs on HeLa cells, we highlight the key differences between the phenotypic assay and a commercial ATP luminescence detection system.
Materials and Methods
Cell Culture and Drug Addition
All plates were prepared in duplicate, one for phenotypic analysis and the other for ATP luminescence determination.
For the validation experiments of number of cells (Table 1), HeLa cells were grown in T75 flasks to ∼80% confluency, lifted off the plate using trypsin, and the cell suspension was diluted with complete cell culture medium. A total of 0, 125, 250, 500, or 1000 cells were seeded into the wells of a 384-well plate (#3712, n = 9 replicate wells; Corning) in 50 μL of medium and analyzed by phenotypic assay or ATP luminescence determination immediately.
Determination of Number of Healthy Cells by Either ATP Luminescence or a Phenotypic Assay
1. 384-well plate (#3712; Corning). The ATP luminescence assay and the acumen Cellista phenotypic assay are both compatible with adherent and suspension cells. Cells may be analyzed immediately or after overnight adhesion to the assay plate.
2a. The volume of CellTiter-Glo reagent added is less than the 1:1 ratio recommended by the vendor. This is because the wells of the 384-well plate can only accommodate maximum 90 μL.
4a. The luminescence signal may be read after 10 min of incubation; however, a longer incubation period is also possible. The luminescence signal half-life is >5 h, additionally all readings are normalized to the no treatment control in Step 10 to eliminate variations in signal magnitude between experiments.
For the drug–response experiments (Table 2), a suspension of HeLa cells (500 cells in 25 μL in complete cell culture medium) was added to the wells of a 384-well plate (#3712; Corning) and cultured at 37°C/5% CO2 in a humidified incubator overnight to allow the cells to adhere. All compounds (doxorubicin, etoposide, cycloheximide, and staurosporine) were prepared as twofold serial dilutions in complete cell culture medium (2 × concentrated). Twenty-four hours after seeding, 25 μL of compound was added to each well and the plate was cultured for a further 48 h.
Analysis of Compound-Treated Cells by ATP Luminescence Determination or by Phenotypic Assay
1. 384-well plate (#3712; Corning). The ATP luminescence assay and the acumen Cellista phenotypic assay are both compatible with adherent and suspensions cells.
3–4. A total well volume of 50 μL is required to minimize evaporation effects over the incubation period. Final drug concentration range: 100 pM to 100 μM.
6a. The volume of CellTiter-Glo reagent added is less than the 1:1 ratio recommended by the vendor. This is because the wells of the 384-well plate can only accommodate maximum 90 μL.
8a. The luminescence signal may be read after 10 min of incubation, however, a longer incubation period is also possible. The luminescence signal half-life is >5 h, additionally all readings are normalized to the no treatment control in step 10 to eliminate variations in signal magnitude between experiments.
8b. Complete scan and analysis templates for the acumen Cellista are available from the authors on request.
Phenotypic Analysis on the acumen Cellista Laser Scanning Imaging Cytometer
Five microliters of a staining “master mix” (10 × ) containing 100 μM Hoechst 33342 (#H3570; Thermo Fisher Scientific), 10 μM calcein-AM (#C3099; Thermo Fisher Scientific), and 15 μM propidium iodide (#P3566; Thermo Fisher Scientific) in phosphate-buffered saline was added to each well of the assay plate and incubated for 90 min at room temperature. The plate was then transferred to the acumen Cellista laser-scanning imaging cytometer for imaging and analysis, which took ∼8 min/384-well plate.
For the cell cycle analysis, single nuclei were identified based on their size and roundness (Gaussian fit). The cell cycle phase was then determined from the total DNA content, which is proportional to total FL-1 (blue fluorescence intensity). The Cellista software reports the total number of cells, as well as the percentage of cells in each phase of the cell cycle for each well.
For cell viability determination, single red or green fluorescent cells were identified based on their size. For each cell, the ratio of the calcein-AM (FL-2-green) to propidium iodide (FL-3-red) total intensity was taken and used to classify the cell as either live or dead. From this classification, the percentage of live cells was determined.
Metabolic Activity Determination Using an ATP Luminescence Kit
Metabolic activity of the cells was determined using the CellTiter-Glo® kit (CTG, #G7570; Promega), which quantifies the amount of ATP produced by cells using a luminescence readout. The CTG reagent was reconstituted in the supplied reagent buffer according to the manufacturer's instructions. Promega recommend adding 25 μL of the CTG reagent to 25 μL of cells in cell culture medium: however, such a low volume of medium would have been incompatible with a 72-h cell incubation period. To avoid removing dead/dying cells from the well by buffer exchange, the cells remained in 50 μL of culture medium and the amount of CTG reagent was increased to 40 μL per well (the maximum well volume was 90 μL). After addition of the CTG reagent, the plate was gently rocked for 10 min to mix the reagents and to allow cell lysis to proceed. The luminescence signal was measured after 1 h on a Tecan plate reader, using auto exposure and gain settings.
Data Analysis
For each assay parameter (percentage live cells, cell count, and luminescence intensity), the well reading was normalized to the medium control wells. All data were plotted in GraphPad Prism 3.0 and fitted to sigmoidal concentration–response curves, from which EC50 values were derived.
Results
Assay Validation
Cell count and ATP content determination
To establish whether a linear relationship exists between the number of healthy cells dispensed per well, the number of nuclei counted on acumen, and the ATP luminescence signal, HeLa cells were seeded into the wells of a 384-well plate at densities between 0 and 1000 cells per well and stained/analyzed with either Hoechst 33342 or by ATP luminescence immediately. Figure 1 shows that there is an excellent correlation between the acumen cell count, the magnitude of the ATP luminescence signal, and the number of cells seeded. These data demonstrate that the two methods generate equivalent assay readouts for healthy HeLa cells.
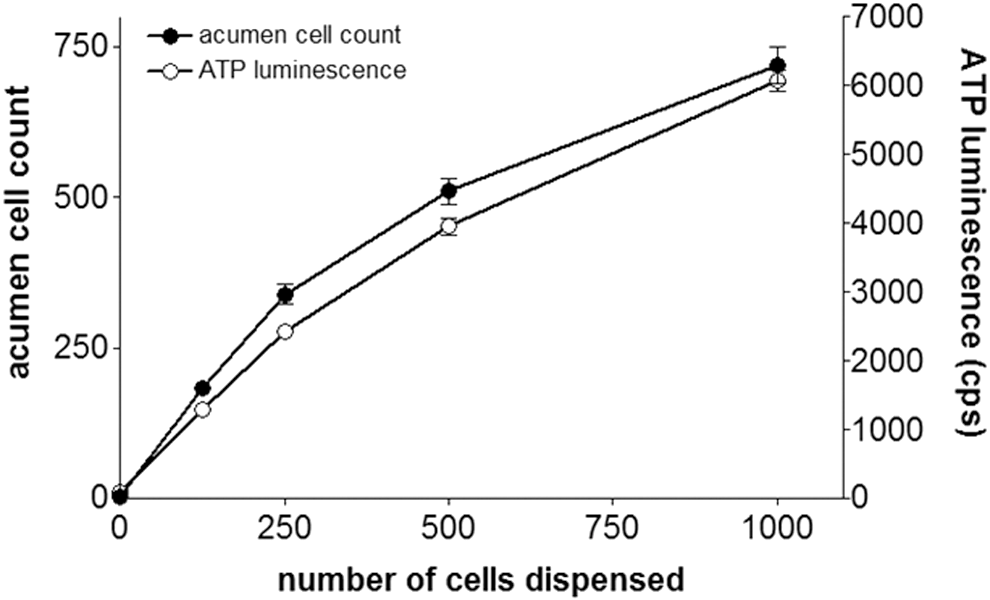
The relationship between the number of cells seeded per well, the acumen cell count, and the ATP luminescence signal. ●, acumen cell count, ◯, ATP luminescence measurement. Values plotted represent the mean ± SD (n = 9 wells).
acumen Cellista percentage live readout
The cells for this assay were treated either with 1 μM doxorubicin (a drug targeting topoisomerase II and causing cytotoxicity primarily through DNA damage and the formation of reactive oxygen species 11 ) or with cell culture medium (control) for 48 h, and then stained with two complementary dyes: calcein-AM as a metabolic viability stain and propidium iodide as a dead cell stain. Figure 2 shows the “intensity ratio” histograms of doxorubicin-treated cells and control cells, which display two distinct populations from which the live/dead gates were set. The number of cells in each population was counted and from this the percentage of live cells was calculated. Cells treated with 1 μM doxorubicin were classified as only 0.6% live (compared with 96.7% of the medium control), which reflects the reported 1 cytotoxic nature of this compound.

acumen Cellista histograms of cells stained with calcein-AM and propidium iodide. The cells are classified as either live or dead, based on the ratio of the calcein-AM (FL-2-green) to propidium iodide (FL-3-red) fluorescence, with blue and yellow arrows marking the gate boundaries.
acumen Cellista cell cycle phase determination
The DNA content of cells stained with Hoechst 33342 is proportional to their total FL1 fluorescence intensity. Figure 3 shows histogram plots of total FL1 fluorescence intensity versus number of untreated cells, and cells treated with 3 μM etoposide for 48 h. Etoposide is a well-known anticancer drug that causes cell cycle arrest in the G2/M phase, 12 whereas untreated cells are expected to be found mostly in the G1 phase. Figure 3 shows the cell cycle classification gates derived from these histograms, which match the expected distribution of phases.
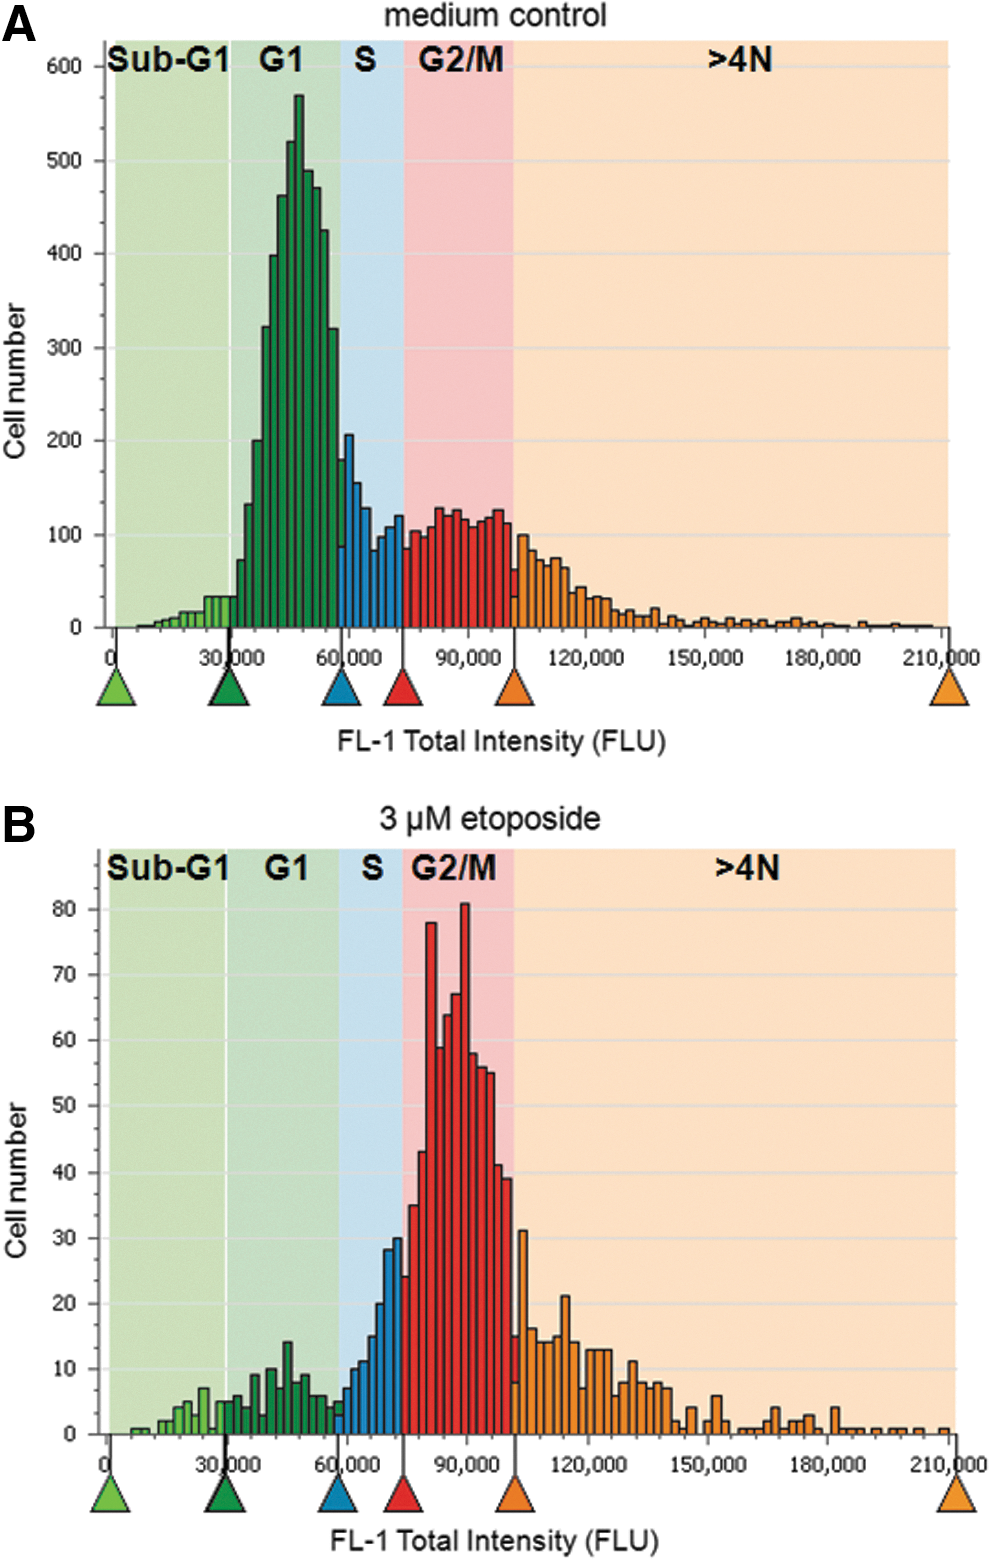
acumen Cellista total fluorescence (FL-1-blue) histograms of cells stained with Hoechst 33342. The colored arrows mark the cell cycle classification gates, which were set according to the expected distribution of phases of cells treated with either etoposide (3 μM) or medium controls.
Comparison of drug–responses across different assay formats
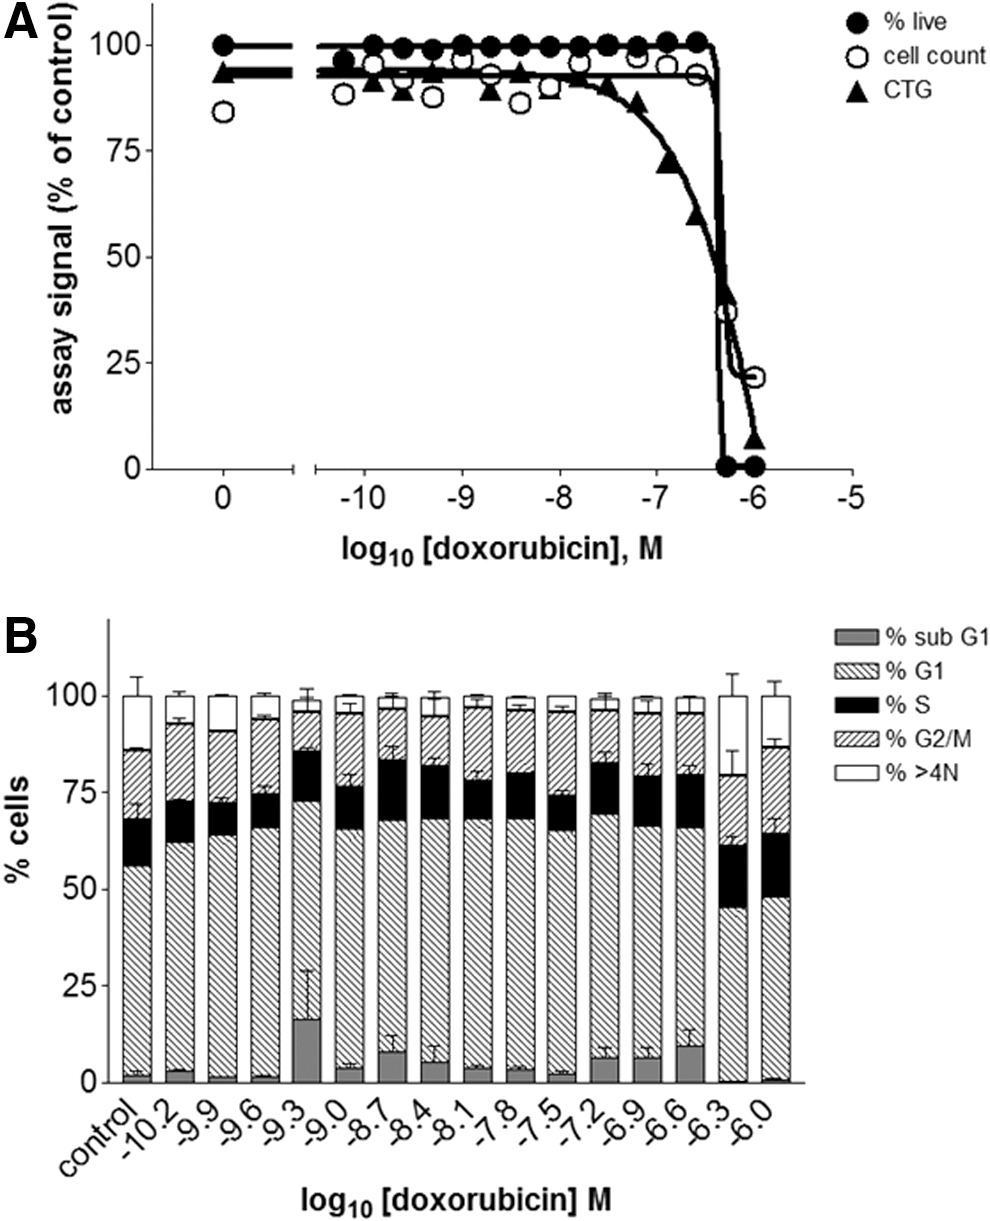
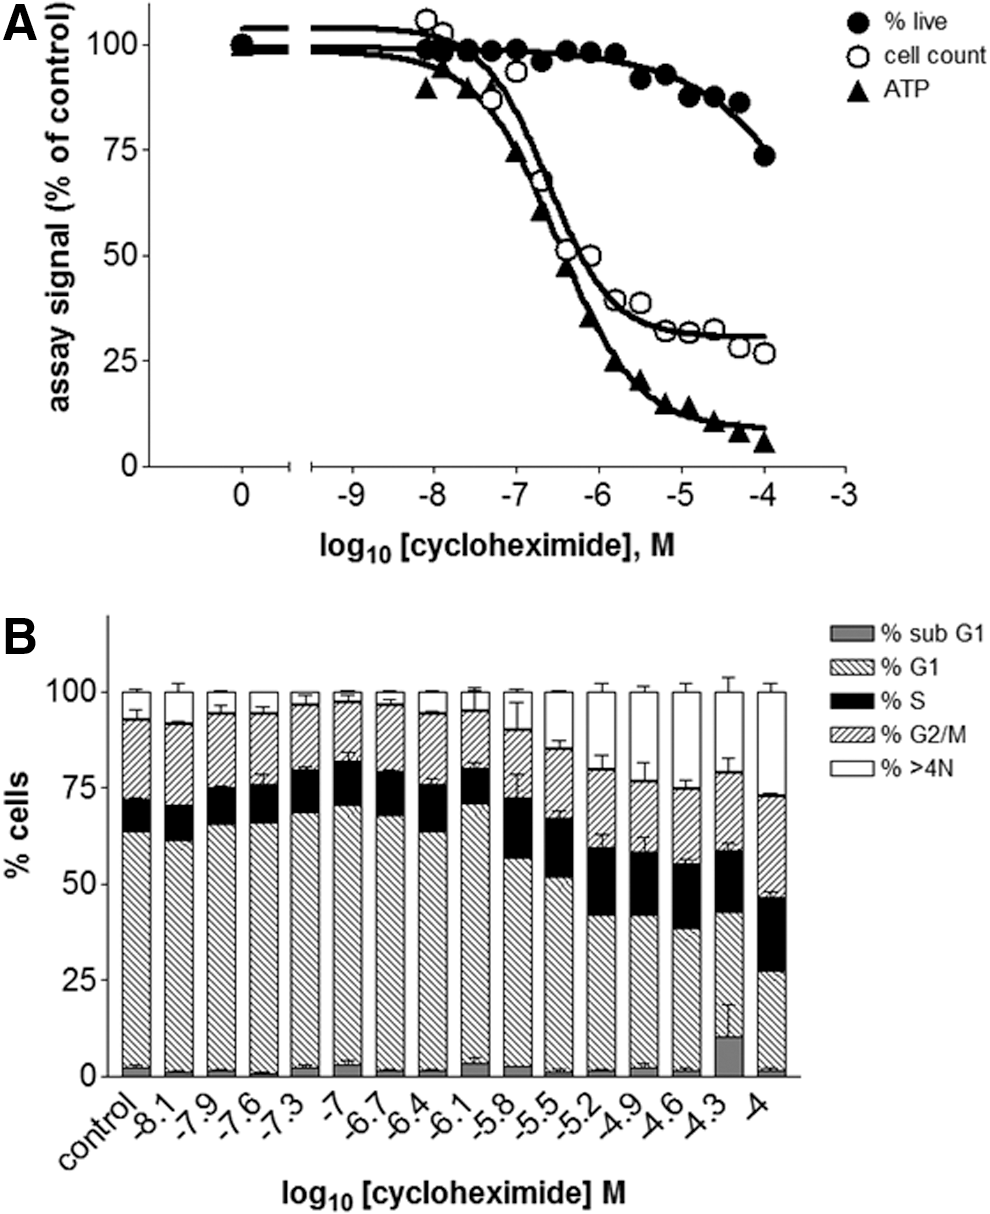
Replicate assay plates were treated with serial dilutions of different drugs for 48 h and analyzed either by phenotypic analysis on the acumen Cellista or by ATP luminescence determination. The results were averaged and normalized to the control wells to facilitate comparison across the different assay formats. Concentration–response curves of the normalized values were plotted and fitted to sigmoidal curves (Figs. 4–7, A), from which EC50 values (Table 3) were derived. In addition, the cell cycle phase distribution for each drug concentration was determined (Figs. 4–7, B), and representative Tiff images of the well (Fig. 8) were obtained to highlight any morphological changes. Together, these data show that differences between the acumen Cellista and ATP luminescence readings are due to compound mechanism of action, as discussed hereunder.
Comparison of assay formats for HeLa cells treated with doxorubicin:
Comparison of assay formats for HeLa cells treated with cycloheximide:
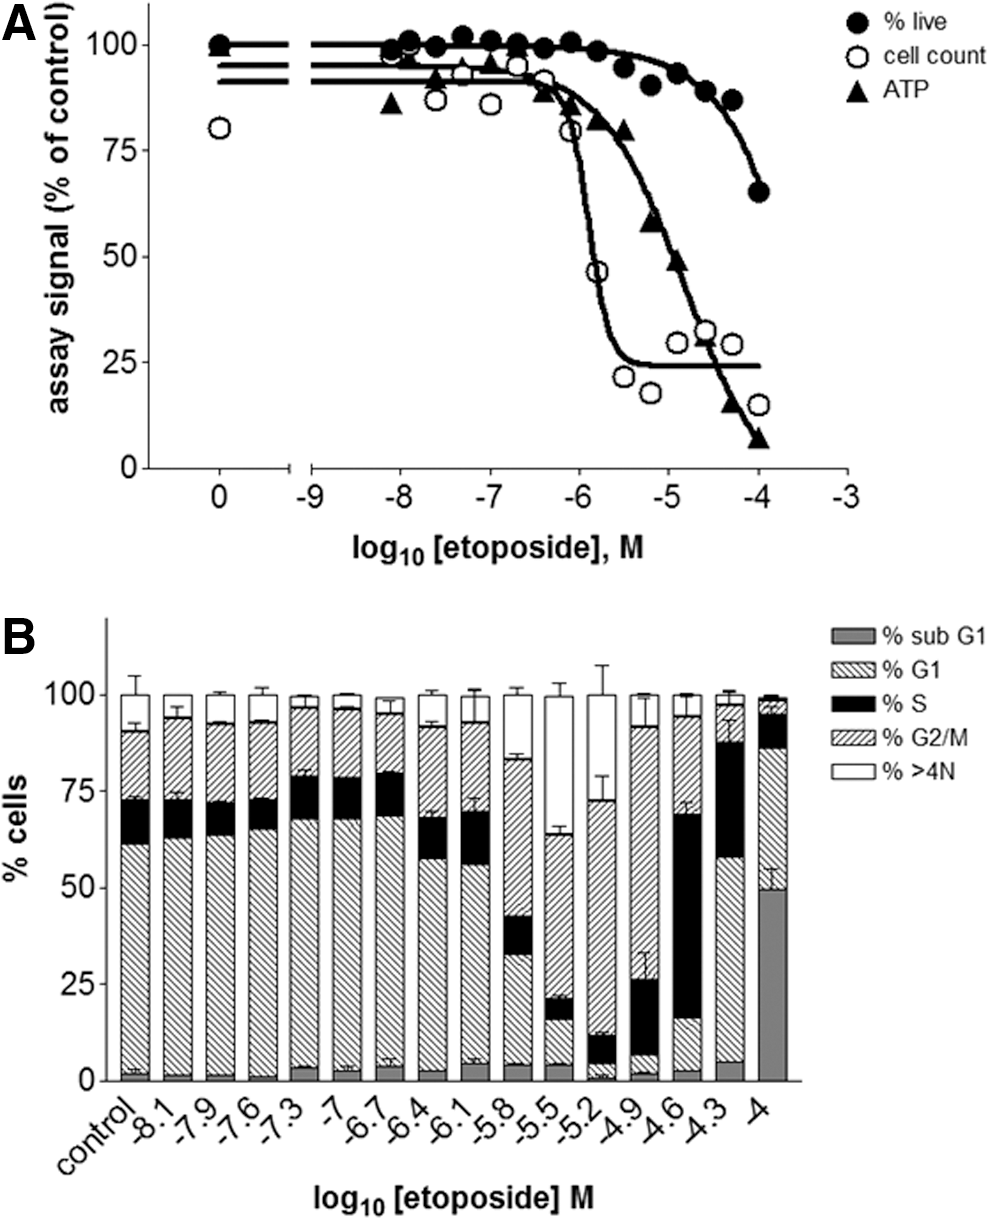
Comparison of assay formats for HeLa cells treated with etoposide:

Comparison of assay formats for HeLa cells treated with staurosporine:

Representative Tiff images of drug-treated HeLa cells stained with Hoechst 33342 (FL-1-blue), calcein-AM (FL-2-green), and propidium iodide (FL-3-red, data not shown):
bi, biphasic data fit; CTG, CellTiter-Glo (ATP luminescence); mono, monotonic data fit; N.D. = not determined.
With doxorubicin (Fig. 4), a classic cytotoxic agent that causes cell death, 11 the concentration–response curves show a steep decline for all three readouts in the high nanomolar concentration range. The nuclei of cells treated with 500 nM doxorubicin appear significantly smaller than the medium control (Fig. 8), most likely due to chromatin condensation. The lack of calcein-AM staining confirms that these cells are no longer viable. These results demonstrate that for this particular drug, the acumen phenotypic assay and the ATP luminescence assay are equally suitable methods for cell health determination.
With cycloheximide and etoposide, both cytostatic agents but with different mechanisms of action, there is less agreement between the three measurements (Figs. 5 and 6):
The ATP luminescence measurements for cycloheximide (a protein synthesis inhibitor, 13 Fig. 5) would suggest a compound that is toxic to cells in the micromolar concentration range; however, the acumen readouts give a more complete representation. The cell count shows that cycloheximide stops cell proliferation in the micromolar concentration range, but the percentage of live cells is only affected in the millimolar range. The Tiff images (Fig. 8) corroborate this result: Wells treated with 200 nM of cycloheximide have fewer cells than the control, but the calcein-AM staining confirms that these cells are viable. The morphology of both the nucleus and the cytoplasm of cycloheximide-treated cells is similar to the medium control wells, suggesting that these cells are healthy. The acumen Cellista DNA content measurements show some subtle changes in the distribution of the cell cycle phases, but only at higher concentrations of the drug. These results make sense considering the mechanism of action of this compound: Protein synthesis consumes enormous energy and resources in cells, especially in fast growing cancer cells. Therefore, inhibition of protein synthesis by cycloheximide, even in a relatively mild situation, can constitute a major blockade to the cellular functions such as cell proliferation. 14 Inhibition of protein synthesis will eventually affect the cell cycle, as progression between the different phases is controlled by the expression levels of cell cycle regulators (e.g., cyclins 15 ). This is, however, an indirect effect, and classical cell cycle inhibitors such as etoposide are much more potent.
Etoposide is a topoisomerase inhibitor that causes DNA strand breaks, which prevents normal progression of the cell cycle 12 and ultimately leads to cell death by apoptosis. 16 The ATP luminescence EC50 value for etoposide differs from both acumen readouts by more than 1 log unit (Fig. 6 and Table 3), highlighting the fact that ATP luminescence measurements give unreliable results for cytostatic drugs. The acumen Cellista cell count and percentage live cell readouts clearly show that this drug has potent antiproliferative properties in the micromolar range without concomitant toxicity, and furthermore that etoposide causes cell cycle arrest in the G2/M phase. Interestingly, the decline in cell health at the very highest drug concentration is accompanied by an increase in the number of cells found in the sub G1 phase of the cell cycle, suggesting that these cells could have undergone apoptosis. 17 Finally, the acumen Cellista Tiff images (Fig. 8) show an unusual enlarged nuclear and cytoplasmic phenotype for the cells treated with 1 μM etoposide, which could explain the higher-than-expected ATP measurements. 18
Staurosporine (Fig. 7) is a protein kinase inhibitor and a potent inducer of apoptosis, although its precise mechanism of action is still not fully understood. 19 It has been reported to induce apoptosis through both caspase-dependent and caspase-independent pathways. 20 In addition, staurosporine causes cell cycle arrest in the G2/M phase. 21 Given the number of possible mechanisms of action of this drug (which are likely to depend on both the drug concentration and incubation time), it is not surprising that the ATP luminescence measurements show a bi-phasic drug response. When nonmonotonic curves are fitted to sigmoidal models without appreciation of the underlying mechanisms of action, not only is the quality of EC50 data compromised (Table 3), but also valuable mechanism-of-action information discarded. By contrast, the phenotypic readouts show clear monotonic drug–response curves, with the cell count suggesting a cytostatic mechanism of action at lower drug concentrations. Interestingly, this is not accompanied by any changes in the cell cycle profiles, although cell cycle arrest in the G2/M phase and cytotoxicity are seen at higher concentrations of the drug. Cells treated with 30 nM staurosporine show signs of nuclear condensation, as well as an overall shrunken phenotype and reduced calcein-AM stain characteristic of dying cells (Fig. 8). Compounds such as staurosporine illustrate the advantages of a phenotypic approach to screening and characterization over ATP luminescence measurements, especially if the compound mechanisms of action and effects on cell cycle, metabolic activity, and survival are not well understood.
Discussion
We set out to develop a cell viability assay that would combine the multiparametric readouts of a high-content screening approach with the simplicity, throughput, and file sizes of a traditional plate reader approach used in HTS. Our data show that acumen Cellista is suitable to report several high-content markers of viability and toxicity, including cell count, the percentage of live cells, and cell cycle phase distribution. These features allow ready distinction between cytostatic and cytotoxic mechanisms of action, whereas the Tiff export function highlights morphological changes of the cells. The ability to distinguish between different mechanisms of action is particularly relevant for drugs affecting the cell cycle, which frequently prevent cell proliferation without causing toxicity. Our results highlight that ATP luminescence measurements for such compounds require further investigation, as they significantly overestimate the toxicity of such compounds, yet fail to recognize their antiproliferative properties.
Historically, the large amount of time required to prepare and analyze a single phenotypic assay plate is used to limit the applicability of these assays in terms of throughput. Most phenotypic screens to date are still carried out on limited library subsets selected on target-based data, rather than the full deck screens commonly used with biochemical assays. 22 To bridge the gap between the two screening approaches, we have developed an automation-friendly homogeneous assay, which is compatible with high-density plate formats suitable for HTS campaigns. In addition, the read and analysis times of this phenotypic assay are close to that of traditional bulk fluorescence readers.
Taken together, these features make this assay format run an acumen Cellista ideally placed for practical high-throughput, full-deck toxicity screens. By assessing multiple viability markers simultaneously, the risk of generating false positive toxicity hits is minimized and confidence in the quality of data is increased. The importance of accurate toxicity assessments should not be underestimated: Far too many drugs in recent years have failed in clinical trials due to safety/efficacy concerns, incurring vast financial losses.
Footnotes
Acknowledgments
The authors would like to thank Sarah L. Payne and David J. Onley for proofreading the article.
Disclosure Statement
A.F.H. and P.G.W. are employees of TTP Labtech Ltd., the company manufactures and markets the acumen laser scanning cytometer. A.F.H. and P.G.W. are shareholders of TTP Group, of which TTP Labtech Ltd. is an affiliate.