
Abstract
Hyperactivation of the PI3K/AKT/mTORC1 signaling pathway is a hallmark of the majority of sporadic human cancers. Paradoxically, chronic activation of this pathway in nontransformed cells promotes senescence, which acts as a significant barrier to malignant progression. Understanding how this oncogene-induced senescence is maintained in nontransformed cells and conversely how it is subverted in cancer cells will provide insight into cancer development and potentially identify novel therapeutic targets. High-throughput screening provides a powerful platform for target discovery. Here, we describe an approach to use RNAi transfection of a pre-established AKT-induced senescent cell population and subsequent high-content imaging to screen for senescence regulators. We have incorporated multiparametric readouts, including cell number, proliferation, and senescence-associated beta-galactosidase (SA-βGal) staining. Using machine learning and automated image analysis, we also describe methods to classify distinct phenotypes of cells with SA-βGal staining. These methods can be readily adaptable to high-throughput functional screens interrogating the mechanisms that maintain and prevent senescence in various contexts.
Introduction
Potentially oncogenic alterations in the genome are constantly occurring, however, these are obstructed by complex tumor suppressor networks that allow detection and repair of damaged DNA and/or the elimination of potentially transformed cells by apoptosis 1 or autophagy. 2 An alternative tumor-suppressive response is to induce a specialized type of cell cycle arrest, known as oncogene-induced senescence (OIS). 3 The power of this tumor-suppressive mechanism is most evident when subpopulations of cells with oncogenic lesions remain dormant for several decades, as in the cases of melanocytic nevi 4 and neurofibromas. 5 How the senescence brake is maintained in nontransformed cells and importantly how it can be re-engaged in cancer are fundamental questions in cancer biology. 6
The observation that the introduction of an oncogenic HRASG12V allele in primary human diploid fibroblasts triggers senescence in a manner similar to that observed for replicative senescence provided the first demonstration of OIS. 3 Initially, replicative stress and/or DNA damage are followed by proliferative arrest and, subsequently, are accompanied by striking phenotypic changes. 7 Cells become large, flat, and stain positive for senescence-associated beta-galactosidase (SA-βGal). 8 Furthermore, DNA damage accumulates and chromatin alterations occur resulting in upregulation of key cell cycle checkpoint regulators such as p16, Rb, p53, and p21. 9 Senescent cells also secrete several types of cytokines and growth factors thought to play a role in noncell autonomous cell clearing by immune cells, termed the senescence-associated secretory phenotype (SASP). 10
Nontransformed cells responding to different oncogenic stimuli share many of these features of senescence. For instance, we and others have demonstrated that hyperactivation of the PI3K/AKT/mTORC1 pathway mediates a senescence-like phenotype. 11,12 However, in contrast to senescence triggered by oncogenic RAS, AKT-induced senescence occurs very rapidly without a hyperproliferative phase and without DNA damage. Understanding both the general and oncogene-specific mechanisms underlying the induction of OIS is critical to gain insight into the behavior of oncogene-addicted tumors. 13
To facilitate this analysis, it is necessary to develop methods to define the key regulators of OIS. High-throughput, high-content imaging screens provide an attractive approach to uncover novel regulators of cellular response. Several functional genetic senescence bypass screens have relied on overexpressing cDNA ORF libraries. 14 Other screens have utilized pooled shRNA libraries, which, by their nature, have not enabled detailed phenotypic imaging. 15 –17 These bypass screens have identified genes required for the induction of senescence. To assay for genes required for the maintenance of senescence (senescence escape), we established a robust model of AKT-induced senescence by introducing constitutively active myristoylated (myr) AKT1 into a human BJ fibroblast cell line immortalized with telomerase reverse transcriptase (TERT). 12 We then used reverse transfection of the senescent cells in a 384-well plate format and high-content imaging to quantify cell number, nuclear area, and proliferation. Furthermore, we developed a method to classify phenotypes based on SA-βGal activity by machine learning and automated image analysis. Using these multiparametric readouts, we provide methods that can be rapidly translated to analyze much larger data sets such as high-throughput siRNA or chemical screens for modulators of senescence.
Materials and Methods
Cell Culture
Human BJ-TERT immortalized fibroblasts 18 (a gift from Robert Weinberg, Massachusetts Institute of Technology) were cultured in HEPES-buffered Dulbecco's modified Eagle's medium (DMEM), pH 7.4:Medium 199 (4:1), 15% fetal bovine serum, and 2 mM GlutaMAX™ (Thermo Fisher Scientific) and maintained at 37°C 5% CO2. Frozen stocks (passage 33, 1.6 × 10⁶ cells/vial) were generated in 10% DMSO/20% FBS/DMEM and stored in liquid nitrogen.
Retroviral Transduction
For amphotropic retrovirus production, HEK293T (passage 9) cells were cotransfected with pBabe-puro-myr-AKT1, 12 the MoMLV gag-pol expression plasmid PEQ-PAM3, and the RD114 envelope plasmid with polyethylenimine in T175 flasks. Viral supernatant was harvested at 48 and 72 h post-transfection and filtered through Minisart® 0.45-μm sterile syringe filters (Sartorius). Virus was concentrated by ultracentrifugation using a Type 70Ti rotor in a Beckman Coulter Optima L-100 XP UltraCentrifuge at 25,000 g for 2 h at 4°C. Concentrated virus was pooled, aliquoted, and stored at −80°C. Infections were performed in the presence of 4 μg/mL polybrene. Seventy-two hours post-transduction, cells were selected for a further 72 h using 1 μg/mL puromycin before reverse transfection with siRNA.
Senescence Escape Assay
Cells were revived from the cell bank (one vial per T175 flask) in culture medium 24 h before retroviral transduction for the generation of a senescent cell population. The protocol is summarized in Table 1. A BioTek EL406 was used to dispense cells, perform media changes, and fix and stain cells. The z-height was set to 36 for all aspiration steps leaving ∼8 μL residual volume. A Caliper Sciclone ALH3000 liquid handling robot was used to dispense siRNA.
Senescence Escape Assay Protocol
7. The assay was performed in using 384-well black-walled clear bottom plates (Corning 3712). The lipid/OptiMEM mixture was dispensed using the BioTek EL406 in a tissue culture hood. siRNA addition was performed using the Caliper Sciclone ALH3000 liquid handling robot. Controls were in the following positions: mock in wells B02, C02, O02, K23, L23, N23; siOTP-NT: A02, F02, G02, H02, L02, M02, P02, A23, C23, E23, F23, H23, J23, P23; siTP53: E02, J02, K02, B23, I23, O23; siKIF11: D02, I02, N02, D23, G23, M23; mock in Columns 1 and 24 but not analyzed.
9. BJ-TERT myr-AKT1 cells were reverse transfected on day 6 post-transduction.
10. Cells were incubated in an automated rotating incubator (Liconics STX220) to maintain an even cell distribution in the wells throughout the duration of the assay.
21. Cells were stained using SA-βGal staining solution: 0.1% (w/v) X-gal in DMF, 5 mM potassium ferrocyanide, 5 mM potassium ferricyanide, 150 mM sodium chloride, and 2 mM magnesium chloride in 40 mM citric acid/sodium phosphate buffer, pH 6.0.
22. Plates were sealed with Parafilm during the SA-βGal staining incubation.
27. Click reaction was performed with 500 nM Alexa Fluor® 488 azide, 1 mM CuSO4, 100 mM ascorbic acid in 100 mM Tris, pH 8.5 and was used for EdU visualization.
DAPI, 4′,6-diamidino-2-phenylindole; DMF, dimethyl formamide; EdU, 5-ethynyl-2′-deoxyuridine; PBS, phosphate-buffered saline; SA-βGal, senescence-associated beta-galactosidase; TERT, telomerase reverse transcriptase.
Black-walled, clear-bottom plates (384 wells) (Corning 3712) were used throughout the assay. DharmaFECT 1 (GE Healthcare Dharmacon) was used for all siRNA transfections at 0.02 μL per well in a final volume of 11 μL OptiMEM™ (Thermo Fisher Scientific) before addition of 25 μL of cells in media for reverse transfection. All siRNAs were hydrated in 1× siRNA buffer (GE Healthcare Dharmacon) and transfected in duplicate plates. ON-TARGETplus nontargeting siRNA pool (siOTP-NT; catalog No. D-001810-10-50, 14 wells; GE Healthcare Dharmacon) and mock transfection (lipid only, 6 wells) were used as negative controls. siTP53 (M-003329-03, 6 wells) and siKIF11 (M-003317-01, 6 wells) were used as positive controls for senescence escape and induction of mitotic arrest, respectively. All sample data were normalized to the average siOTP-NT values (14 wells) on each individual plate using a robust Z-score approach. 19 A subset of sample library plates (internal reference Nos. 12009 and 12013) used to test the methods was taken from the Dharmacon SMARTpool protein-coding genome (18,120 targets, RefSeq57, catalog Nos. G-003505, G-003605, G-003705, G-003805, G-004655, G-005005, G-005105, G-005615, G-005625, and G-005635) collection.
DharmaFECT 1 in OptiMEM® (Thermo Fisher Scientific) was complexed with siRNA for 20 min before addition of 800 cells/well (BJ-TERT myr-AKT1 cells, 6 days post-transduction) in media. The media were changed 24 h post-transfection. At 4 days post-transfection, the media were changed to a 20 μL final volume. At 5 days post-transfection, an equal volume of 20 μM alkyne-conjugated 5-ethynyl-2′-deoxyuridine (EdU) (Thermo Fisher Scientific) in media was added for a final concentration of 10 μM and incubated at 37°C 5% CO2 for 24 h. At 6 days post-transfection, the following multiple consecutive staining steps were implemented:
Stain 1
Ten microliters of 5 μM CellTracker Red CMPTX dye (Thermo Fisher Scientific) in media was added for a final concentration of 1 μM and incubated at 37°C 5% CO2 for 30 min. Cells were then washed twice in phosphate-buffered saline (PBS) to remove unbound dye and fixed in 25 μL of 2% paraformaldehyde (ProSciTech) and 0.2% glutaraldehyde (Sigma-Aldrich) for 10 min. All steps were performed using the BioTek 406 liquid handling automation. All staining solutions were prepared using 0.22-μm sterile filters.
Stain 2
Cells were washed with PBS and stained for SA-βGal activity according to methods described previously, 8 using 25 μL SA-βGal staining solution: 0.1% (w/v) 5-bromo-4-chloro-3-indolyl-β-D-galactopyranoside (X-Gal) in dimethyl formamide (DMF; Sigma-Aldrich), 5 mM potassium ferrocyanide, 5 mM potassium ferricyanide, 150 mM sodium chloride, and 2 mM magnesium chloride in 40 mM citric acid/sodium phosphate buffer, pH 6.0. Plates were sealed with Parafilm M® (Bemis) and incubated at 37°C for 24 h.
Stain 3
Cells were washed twice with PBS and then permeabilized in 0.5% Triton X-100 in PBS for 10 min at room temperature. After washing with PBS, a Click-IT reaction was performed with 500 nM Alexa Fluor® 488 azide (Thermo Fisher Scientific), 1 mM CuSO4, 100 mM ascorbic acid in 100 mM Tris, pH 8.5, using similar methods to those described previously 20 and incubated for 30 min in the dark.
Stain 4
Cells were washed with PBS and stained with 0.5 μg/mL 4′,6-diamidino-2-phenylindole (DAPI) for 10 min. After two washes with PBS, a final 50 μL PBS was dispensed before sealing. The plate was sealed manually with an adhesive microplate transparent polyester seal.
Image Acquisition and Analysis
An automated Cellomics® ArrayScan® VTi high-throughput microscope equipped with a Brightfield Module, Bioapplication Software (Thermo Fisher Scientific) and a 20 × objective was used to image cells capturing 25 fields per well. Images were acquired in four channels. Channel 1 for nuclear DAPI (385/23), 19.7 ms exposure. Channel 2 for the proliferation marker EdU (485/20), 6.9 ms exposure. Channel 3 for cytoplasmic CMPTX (549/15), 174.1 ms exposure. Channel 4 for brightfield SA-βGal, 2.3 ms exposure. The Compartmental Analysis V3 Bioapplication was used for analysis. Cell segmentation occurred in the DAPI channel to identify nuclei and quantitate average nuclear area. This was followed by quantitation of the average EdU fluorescence intensity. The cytoplasmic stain was used as a visual readout and to determine the perinuclear region for SA-βGal staining. To quantify SA-βGal staining, we used machine learning and automated image analysis, according to the methods described below.
Image Processing for SA-βGal Analysis
Segmentation of single cells and extraction of their features for supervised machine learning of SA-βGal staining was performed using CellProfiler software (
The cells in each well were classified into four classes (Strong, Medium, Low, and None) based on SA-βGal staining with supervised machine learning using Advanced Cell Classifier software (
Results and Discussion
Assay for Senescence Escape
We previously demonstrated that stable depletion of p53 prevents senescence induced by hyperactivation of AKT in a robust human BJ-TERT fibroblast model. 12 Consequently, we hypothesized that this could be an ideal model in which we could use a transient RNAi transfection protocol to screen for novel regulators of AKT-driven senescence (Table 1). To test this hypothesis, we established a senescent cell population by introduction of myristoylated AKT1 and then performed reverse transfection with several control siRNAs in a 384-well format. For negative controls, we used mock transfection and nontargeting ONTARGET-PLUS™ siRNA (siOTP-NT). As a positive control, we used siRNA for kinesin family member 11 (siKIF11), which induces mitotic arrest and senescence. 25,26 RNA-Seq in primary human fibroblasts has also demonstrated conserved downregulation of KIF11 on cellular senescence. 27 In addition, we included siRNA against tumor protein p53 (siTP53), which we anticipated would allow cells with constitutively active AKT to escape senescence, based on our previous study. 12 After 6 days post-transfection, cells were fixed and subjected to consecutive staining steps before high-content imaging and analysis of various readouts. The readouts for the assay were nuclear DAPI (Channel 1), cell number, and average nuclear area; nuclear EdU as a marker of DNA synthesis, average fluorescence intensity (Channel 2); cytoplasmic CMPTX (Channel 3); and SA-βGal staining (Channel 4) (Fig. 1).
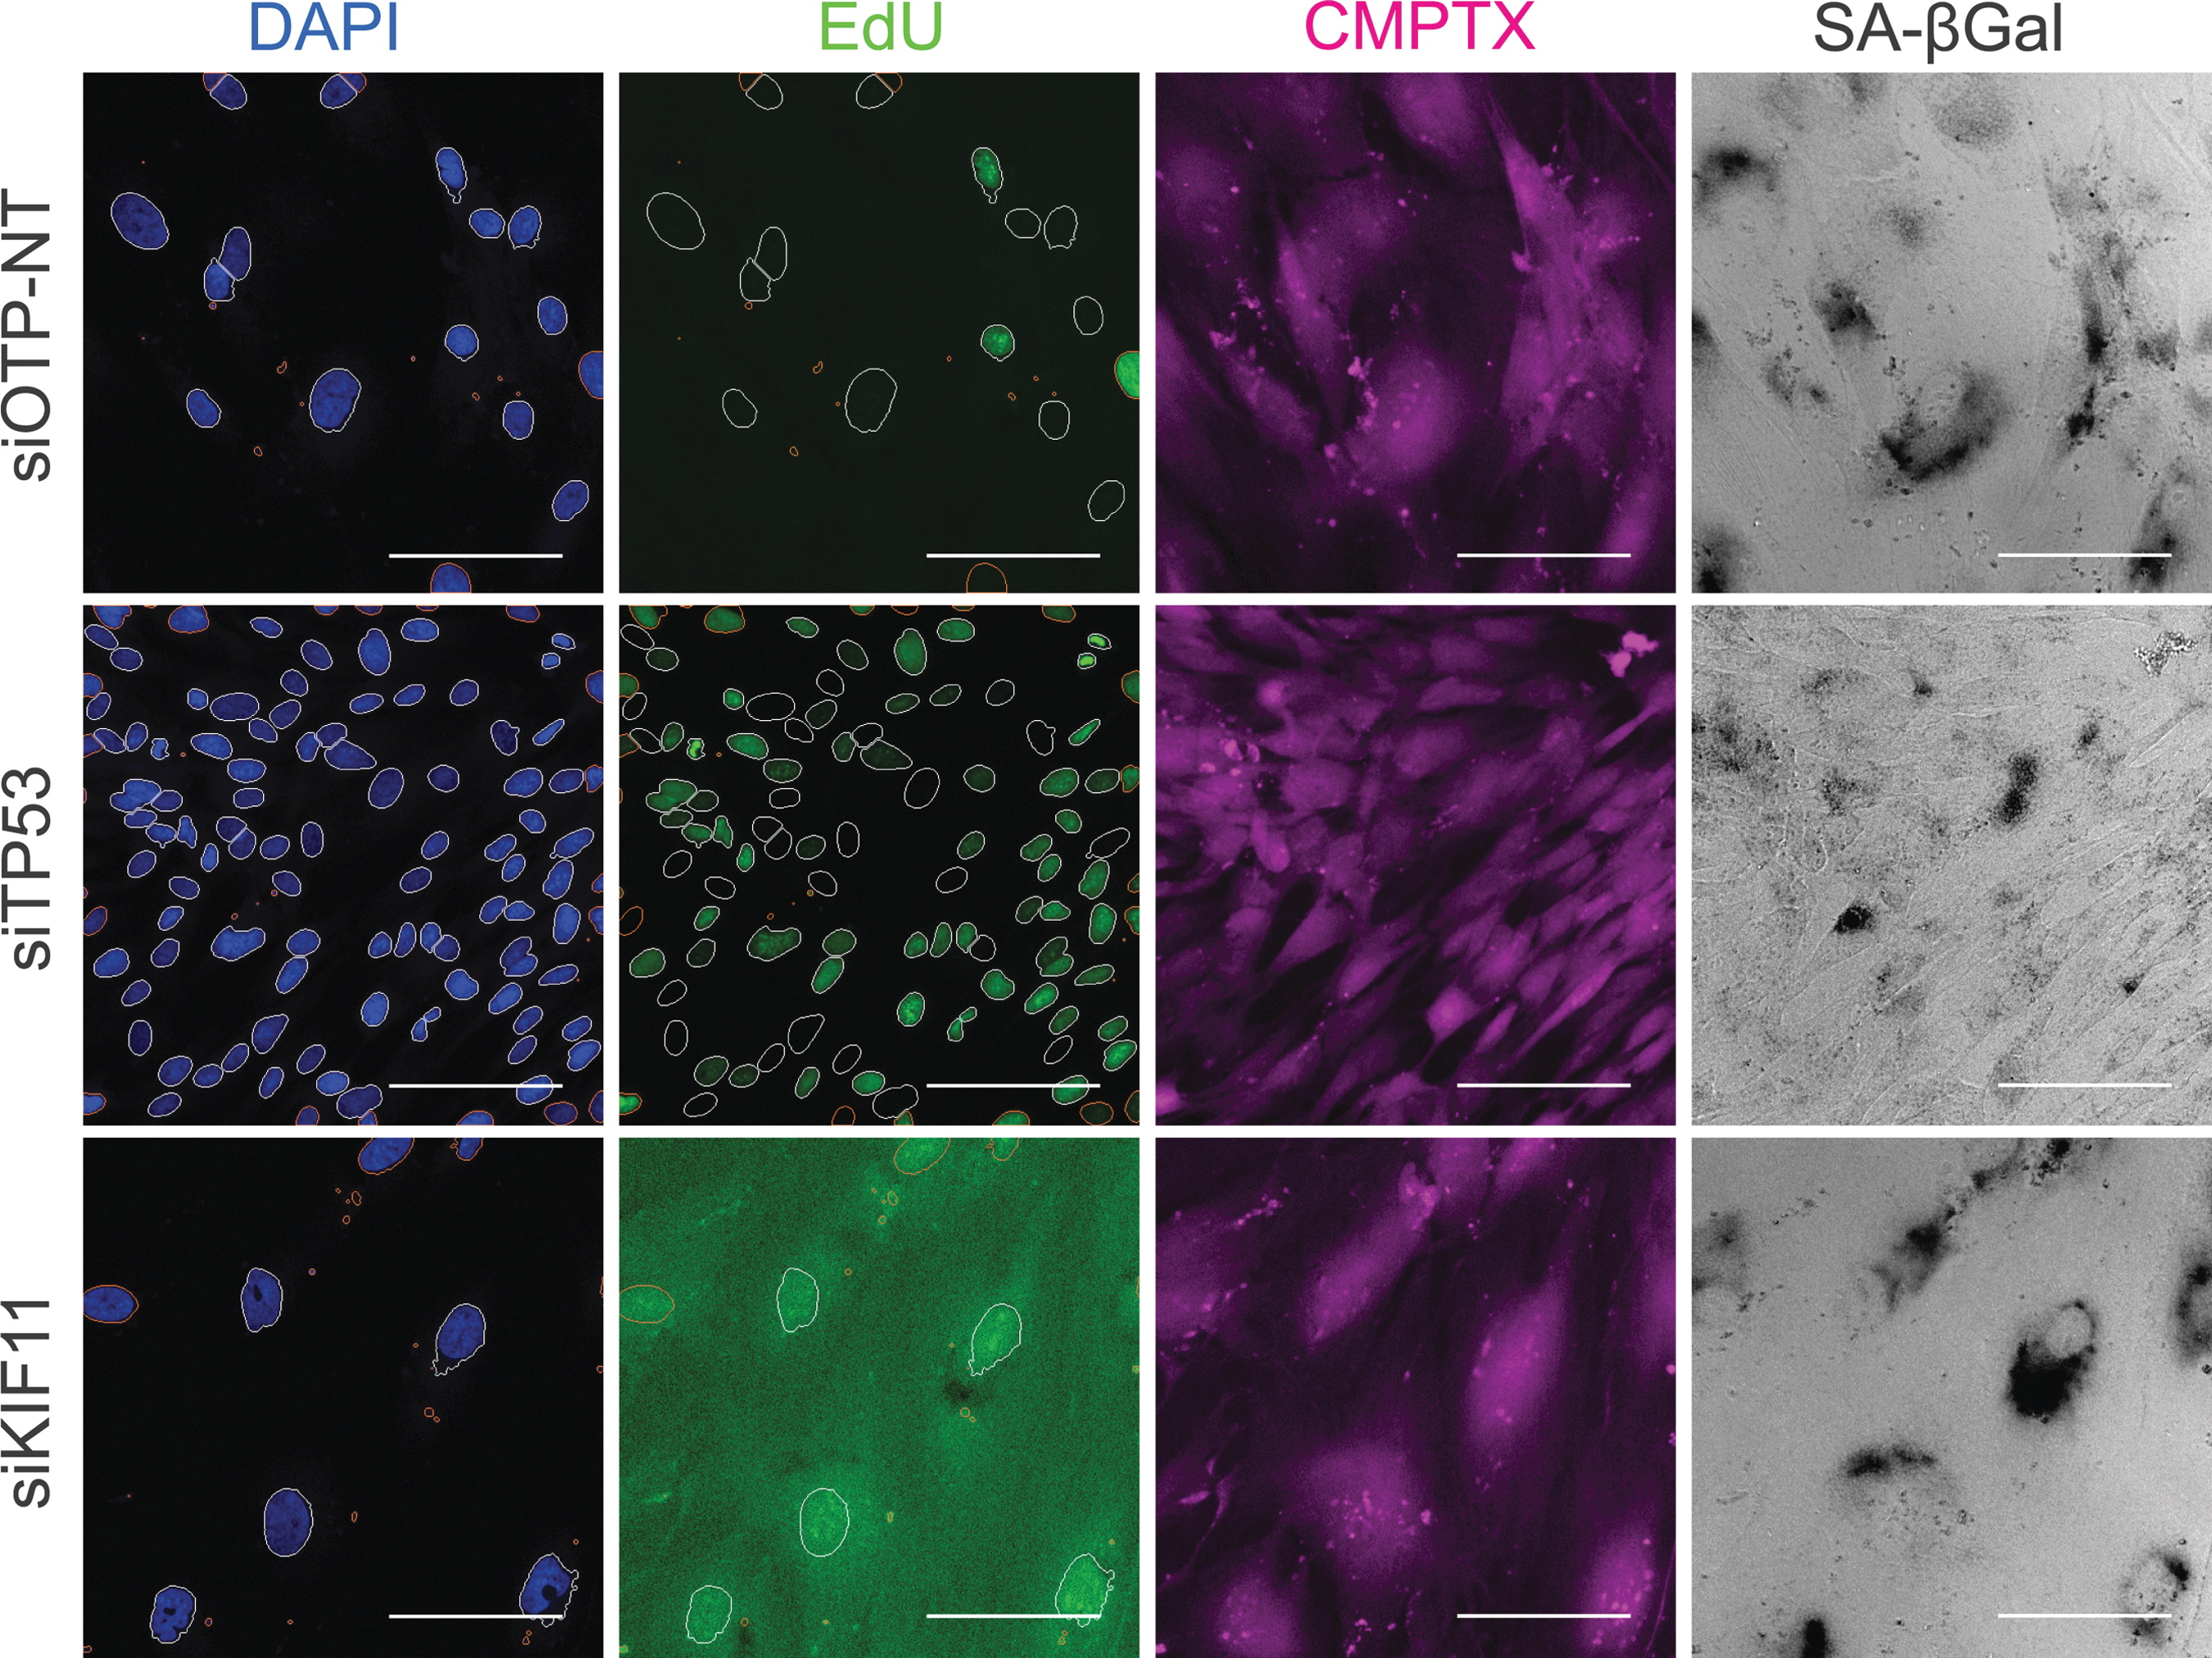
Controls for senescence escape assay. Nuclei are segmented using DAPI staining (Ch1) and the Cellomics Compartmental Analysis Bioapplication was used to quantify cell number and average nuclear area. Following nuclear segmentation, average EdU intensity is measured (Ch2). A whole-cell stain CMPTX is visualized in Ch3. SA-βGal staining is imaged in the brightfield channel (Ch 4). siOTP-NT is a nontargeting negative control. Positive controls are siTP53 for senescence escape and siKIF11, which induce mitotic arrest. Scale bar = 100 μm. DAPI, 4′,6-diamidino-2-phenylindole; SA-βGal, senescence-associated beta-galactosidase.
To determine the reproducibility of the assay, we measured the coefficient of variation (%CV) with multiple control wells (Table 2). Mock-transfected cells displayed a slightly higher %CV than siOTP-NT due to fewer replicates (6 wells vs. 14 wells) and were still included in our optimization but not used for normalization of the data. Rather, we normalized our data to siOTP-NT, which is a more robust control due to its activation of the RNAi machinery through the RNA-induced silencing complex. In general, the average %CV between replicates was low (≤24%) for all parameters, indicating reproducibility of the assay. KIF11 knockdown resulted in high %CV for average EdU intensity, likely due to low signal, just above background.
Quality Control Metrics for Control siRNAs
All parameters were normalized to the average data of all 14 siOTP-NT wells in each plate.
Data are shown as mean ± SD for each parameter (mock, 6 wells; OTP-NT, 14 wells; TP53, 6 wells; KIF11, 6 wells).
CV, coefficient of variation; SD, standard deviation.
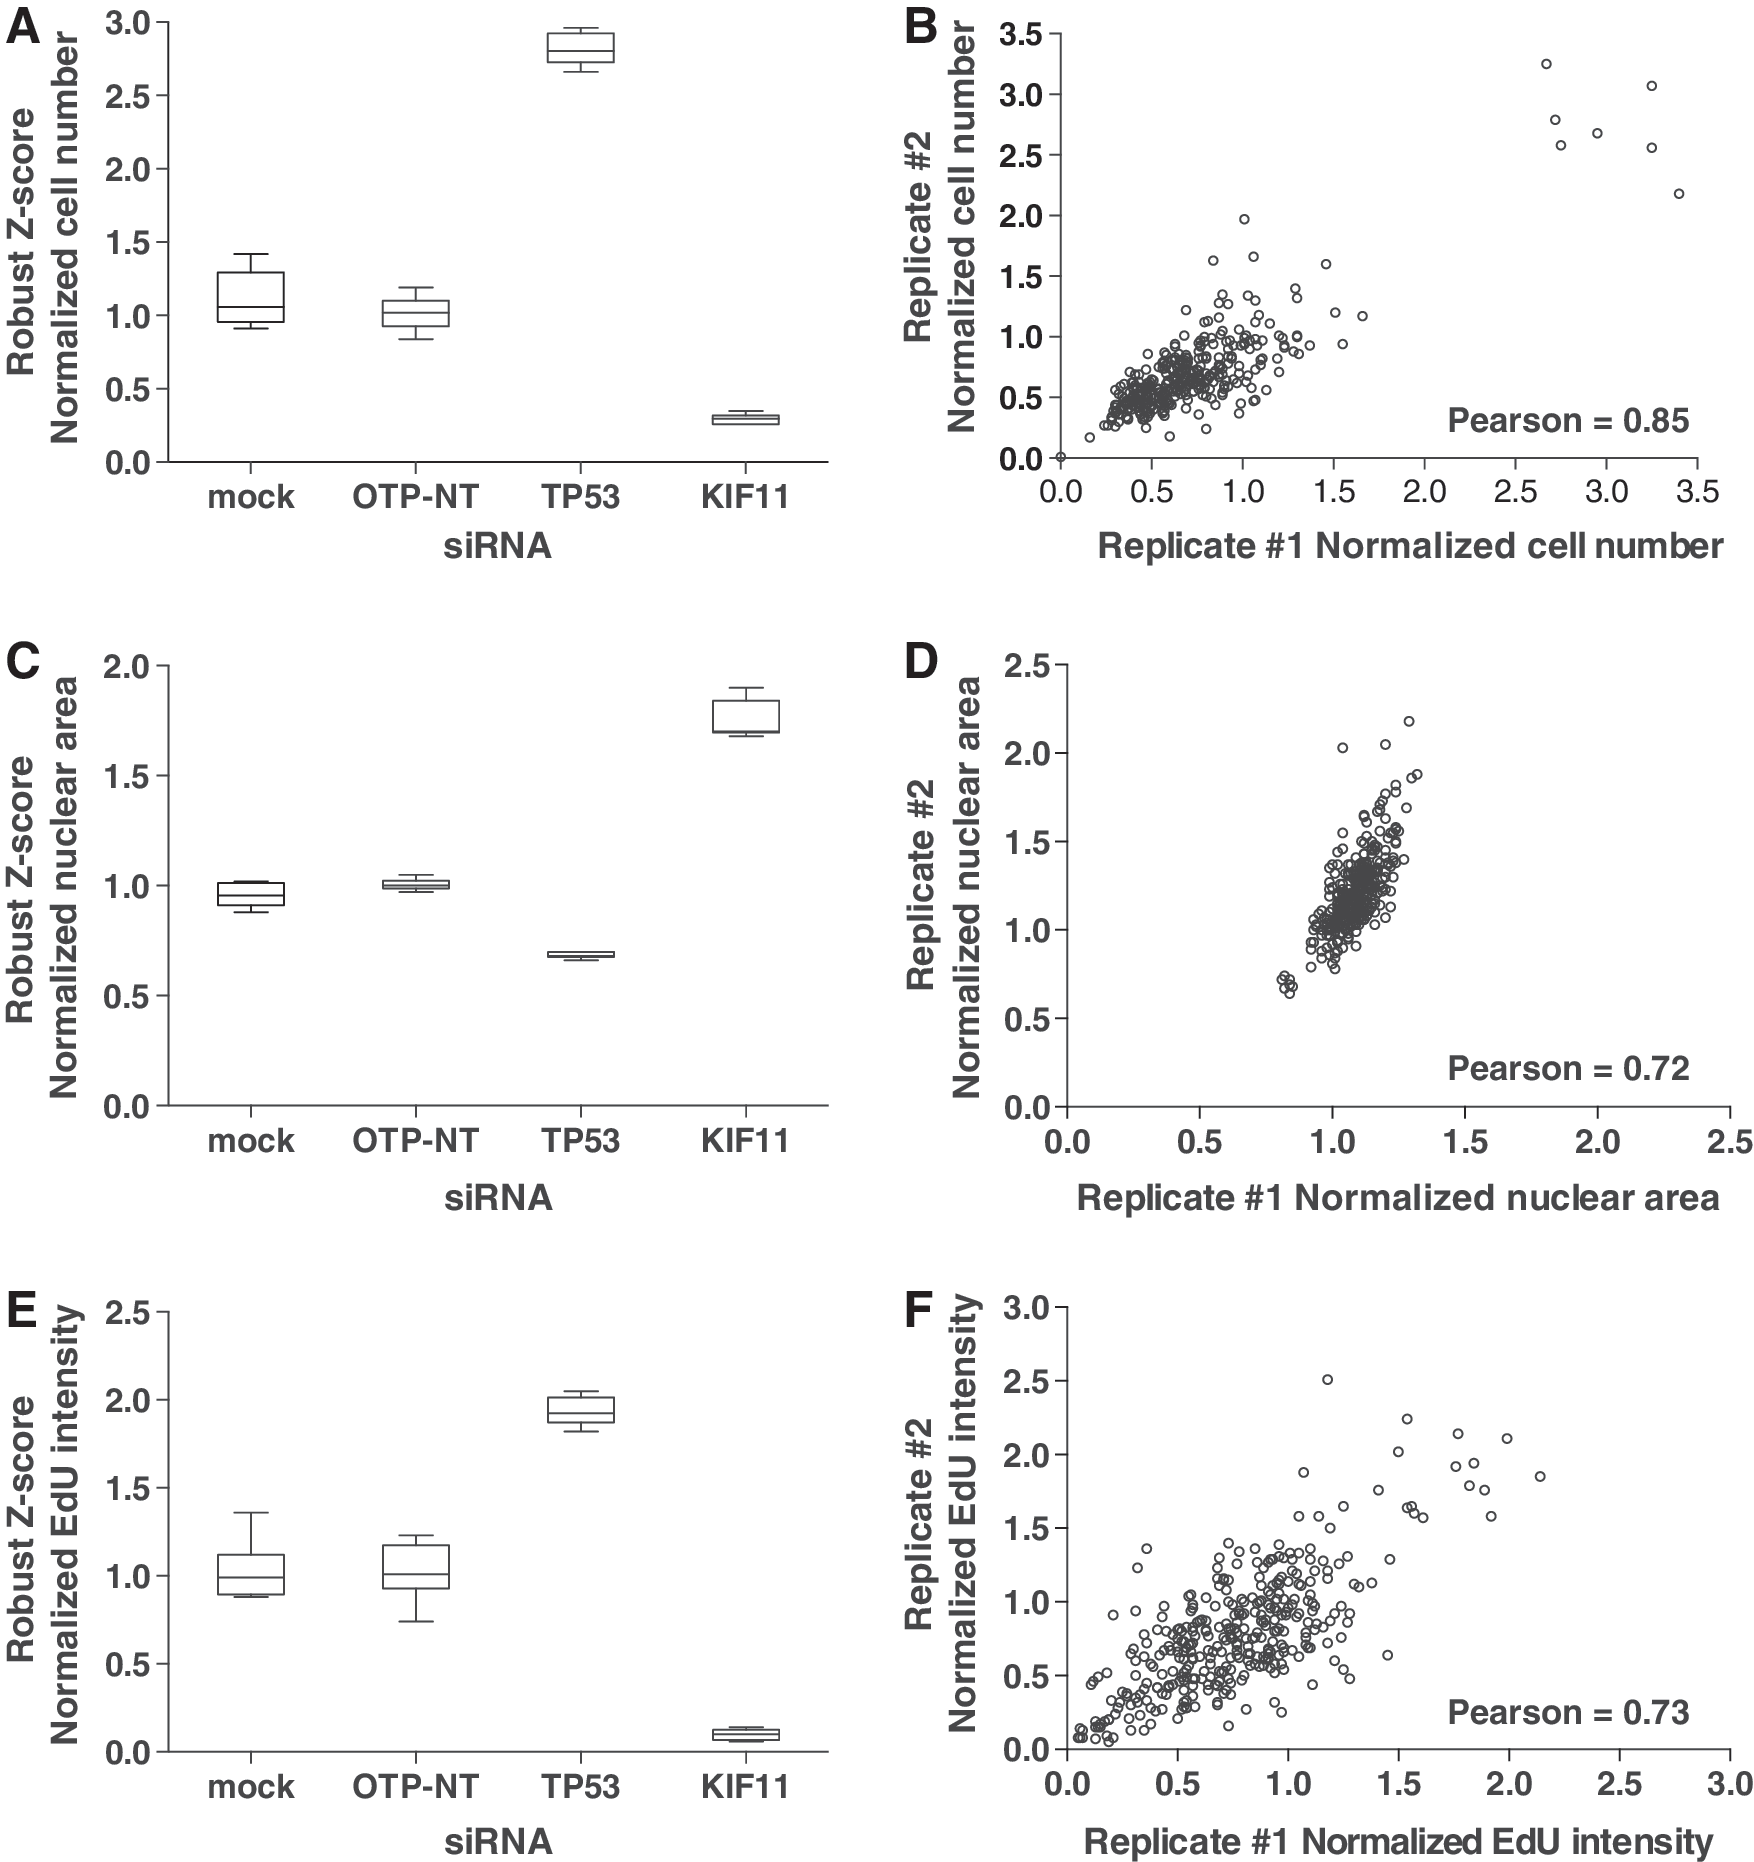
As a further metric to determine the strength of the assay, we calculated the Z′ factor between positive and negative controls pairs, which is typically between 0 and 0.5 in siRNA screens, 19 for relative cell number, average nuclear area, and average EdU intensity (Table 3). The most robust parameter was cell number, as demonstrated by Z′ factors within this range for OTP-NT/TP53 and OTP-NT/KIF11 siRNA control pairs. The Z′ factors for nuclear area were also within an acceptable range. The Z′ factor for EdU intensity in the OTP-NT/TP53 control pair was slightly less than 0 due to a moderate, more variable fold change in this parameter compared with cell number or nuclear area (Table 2). Nevertheless, we consistently observed an approximately threefold increase in cell number, a 30% decrease in nuclear area, and twofold increase in EdU intensity for siTP53 compared with siOTP-NT, indicating escape from senescence (Table 2 and Fig. 2A, C, E). As an indication of reproducibility, individual replicate wells demonstrated significant correlation (Fig. 2B, D, F). Together, these data highlight the advantage of using multiparametric readouts to assess senescence escape.
Quality control metrics for positive and negative controls in the senescence escape assay.
Z′ Factor for siRNA Control Pairs
Z′ factor was calculated from means and SDs of each parameter for positive and negative control siRNAs on each plate (mock, 6 wells; OTP-NT, 14 wells; TP53, 6 wells; KIF11, 6 wells).
Phenotypic Classification of SA-βGal Staining
In addition to analysis of cell number, nuclear area, and proliferation in the assay, we included SA-βGal staining as an additional readout. Staining for SA-βGal activity is the most widely used marker of senescence due to its ease of detection in cells and tissues. 28 However, analysis of SA-βGal staining has been limited to binary classifications as positive or negative, which may not sufficiently reflect the varying degrees of staining observed within a cell population. An alternative to this approach has been the use of a fluorescent probe 5-dodecanoyl aminofluorescein di-β-D-galactopyranoside (C12FDG) to detect SA-βGal activity, 29 but this probe has also been reported to display high background fluorescence. 30 Furthermore, high-throughput quantitation of cytochemical SA-βGal positivity and staining intensity has not been performed. To test the possibility of phenotypically classifying cells with SA-βGal staining in conjunction with the parameters previously discussed to identify candidate regulators of senescence, we used a machine learning approach. 23 For optimization of this approach, we performed image analysis of 10 individual library plates from the siGENOME RNAi library. Cells were first segmented with the nuclear DAPI stain. In the cytoplasmic CMPTX channel, a threshold was used to generate a mask of the whole cell for perinuclear segmentation (see Materials and Methods section). The perinuclear region was defined by outward propagation of a contour from the edge of the nucleus for a maximum of 16 pixels. Within the perinuclear region, CellProfiler extracted 154 features to teach a Random Forests classifier. We selected ∼1,000 cells from different wells and different plates to teach a model to classify cells according to their SA-βGal staining based on visual inspection of the images as follows. Strong, Medium, Weak, None (Fig. 3).
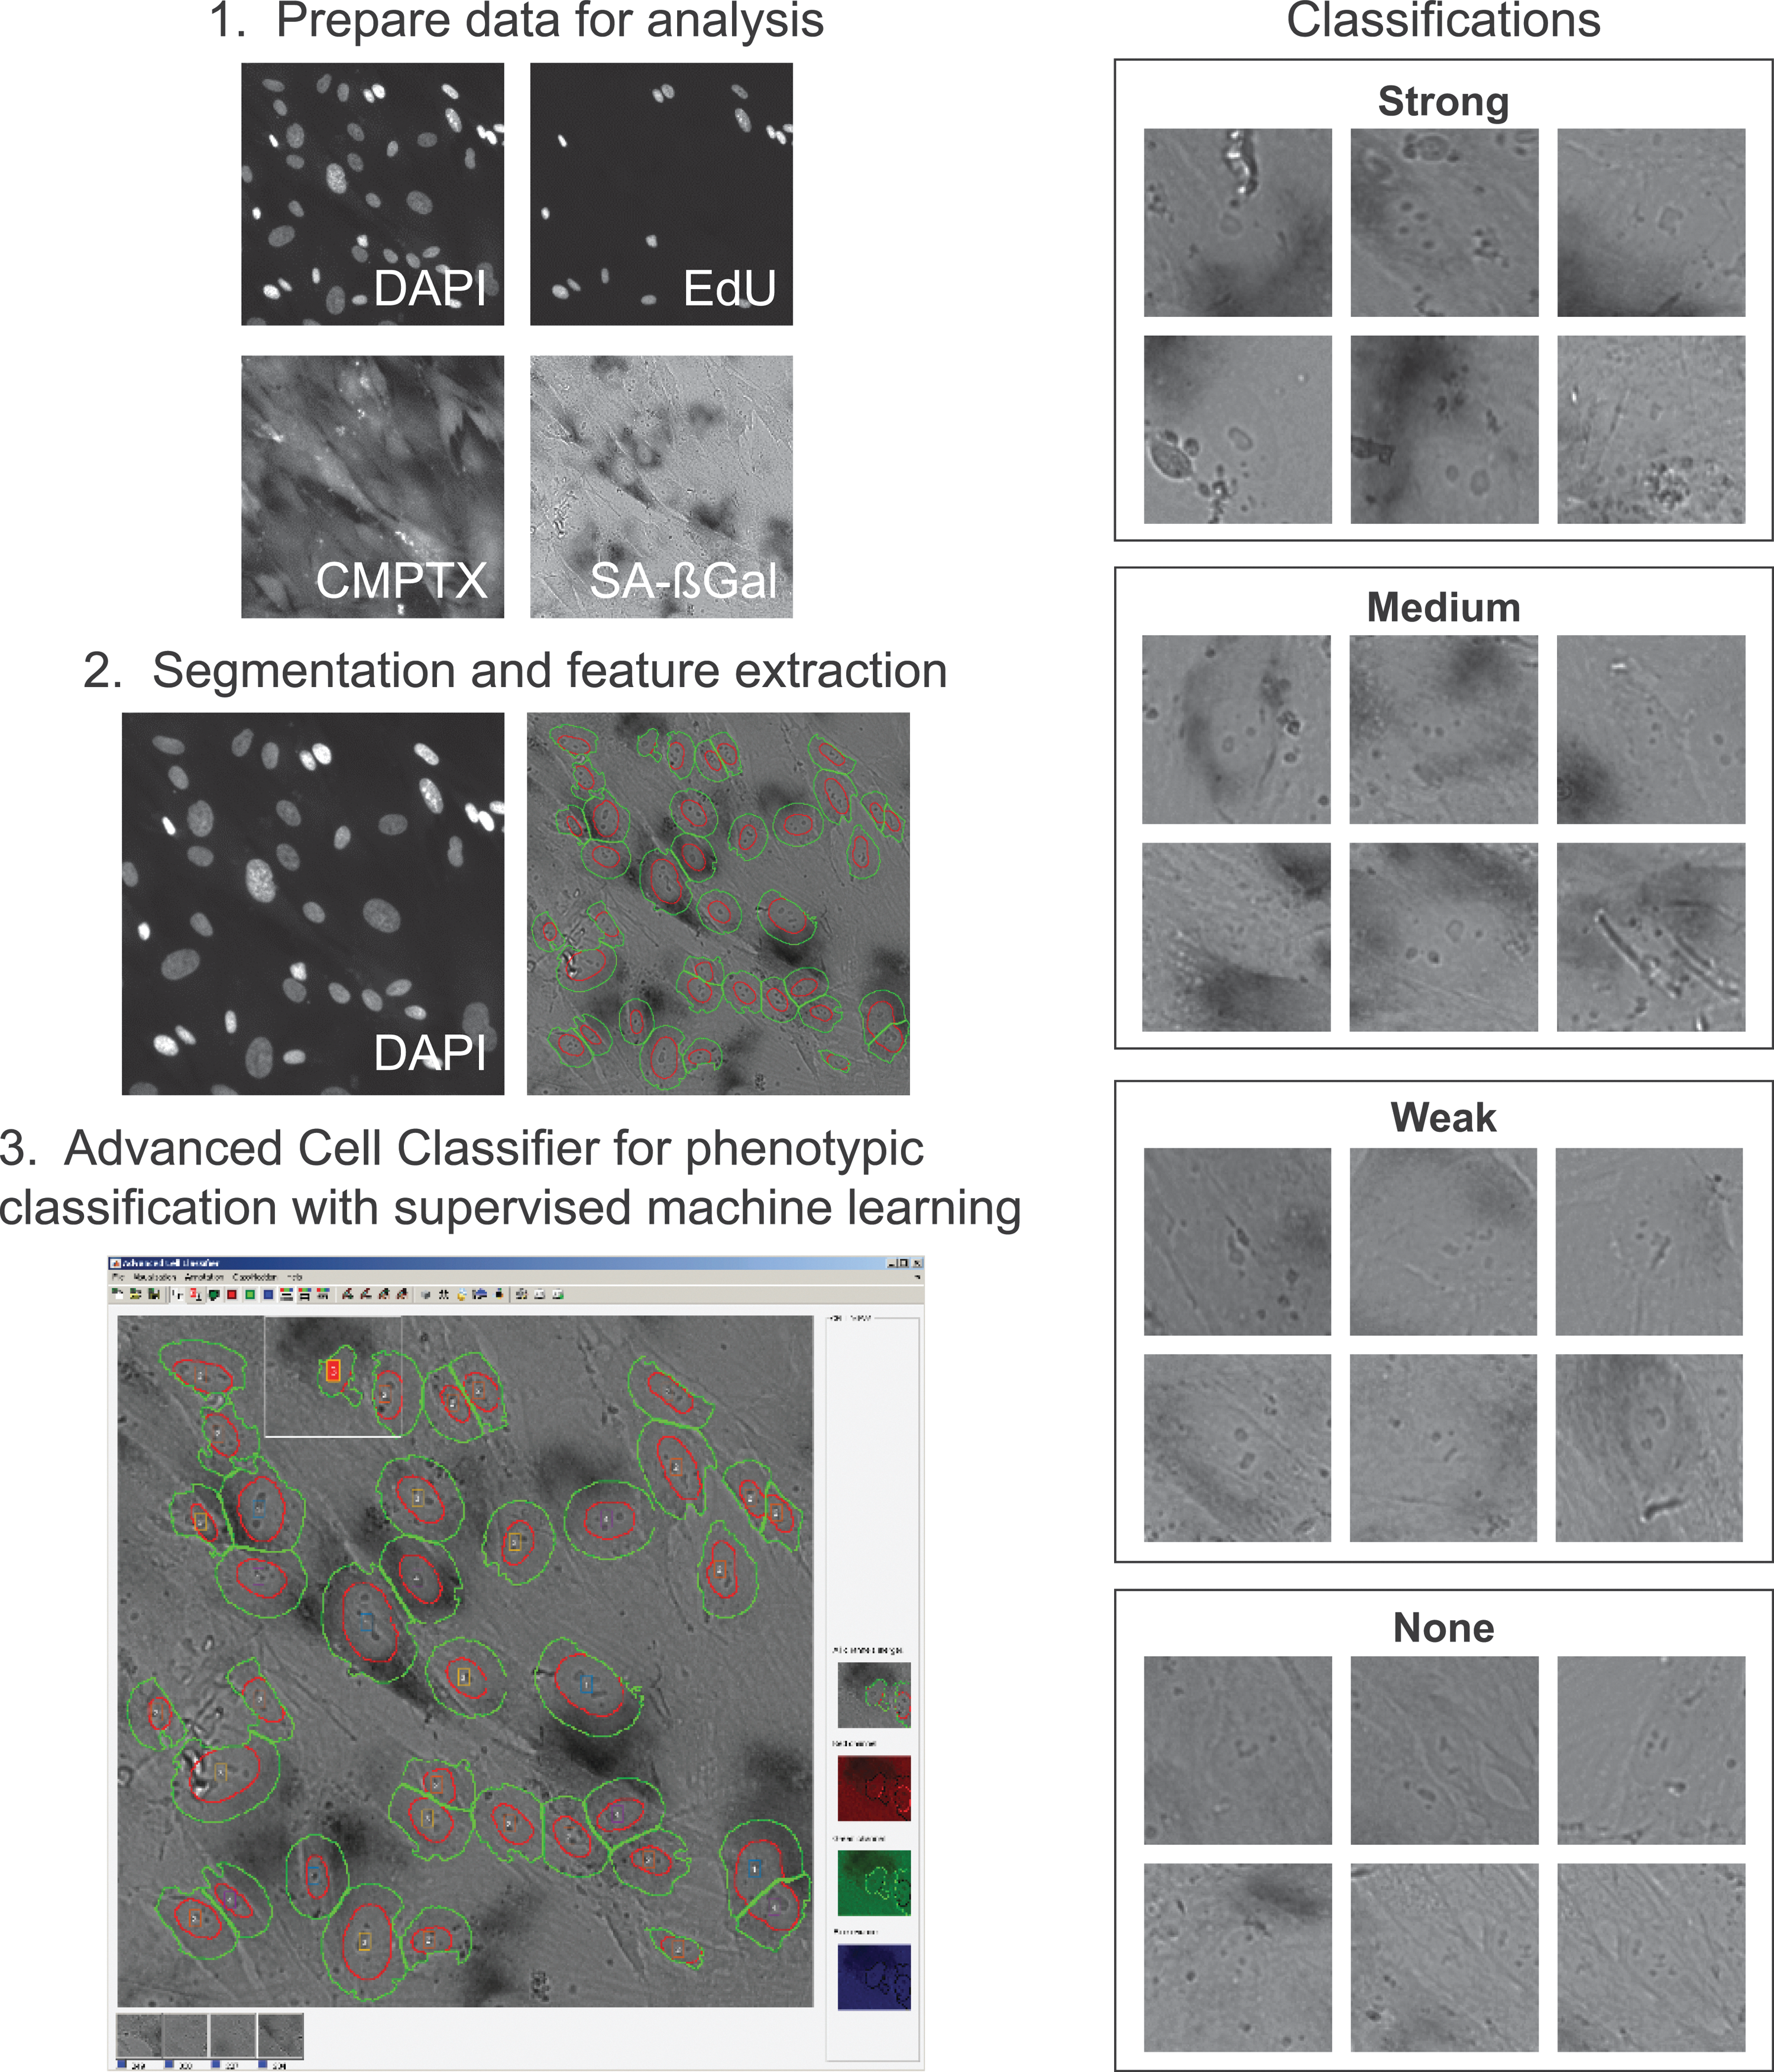
SA-βGal phenotypic classification method overview. Images are acquired from the siRNA screen. (1) Images are prepared for data analysis. (2) Cells are segmented based on their DAPI-stained nuclei. A perinuclear region from the CMPTX channel at a fixed distance from the nucleus is highlighted to obtain 154 features (see Materials and Methods section). (3) A supervised machine learning model is taught to classify cells based on SA-βGal staining into four categories: Strong, Medium, Weak, None.
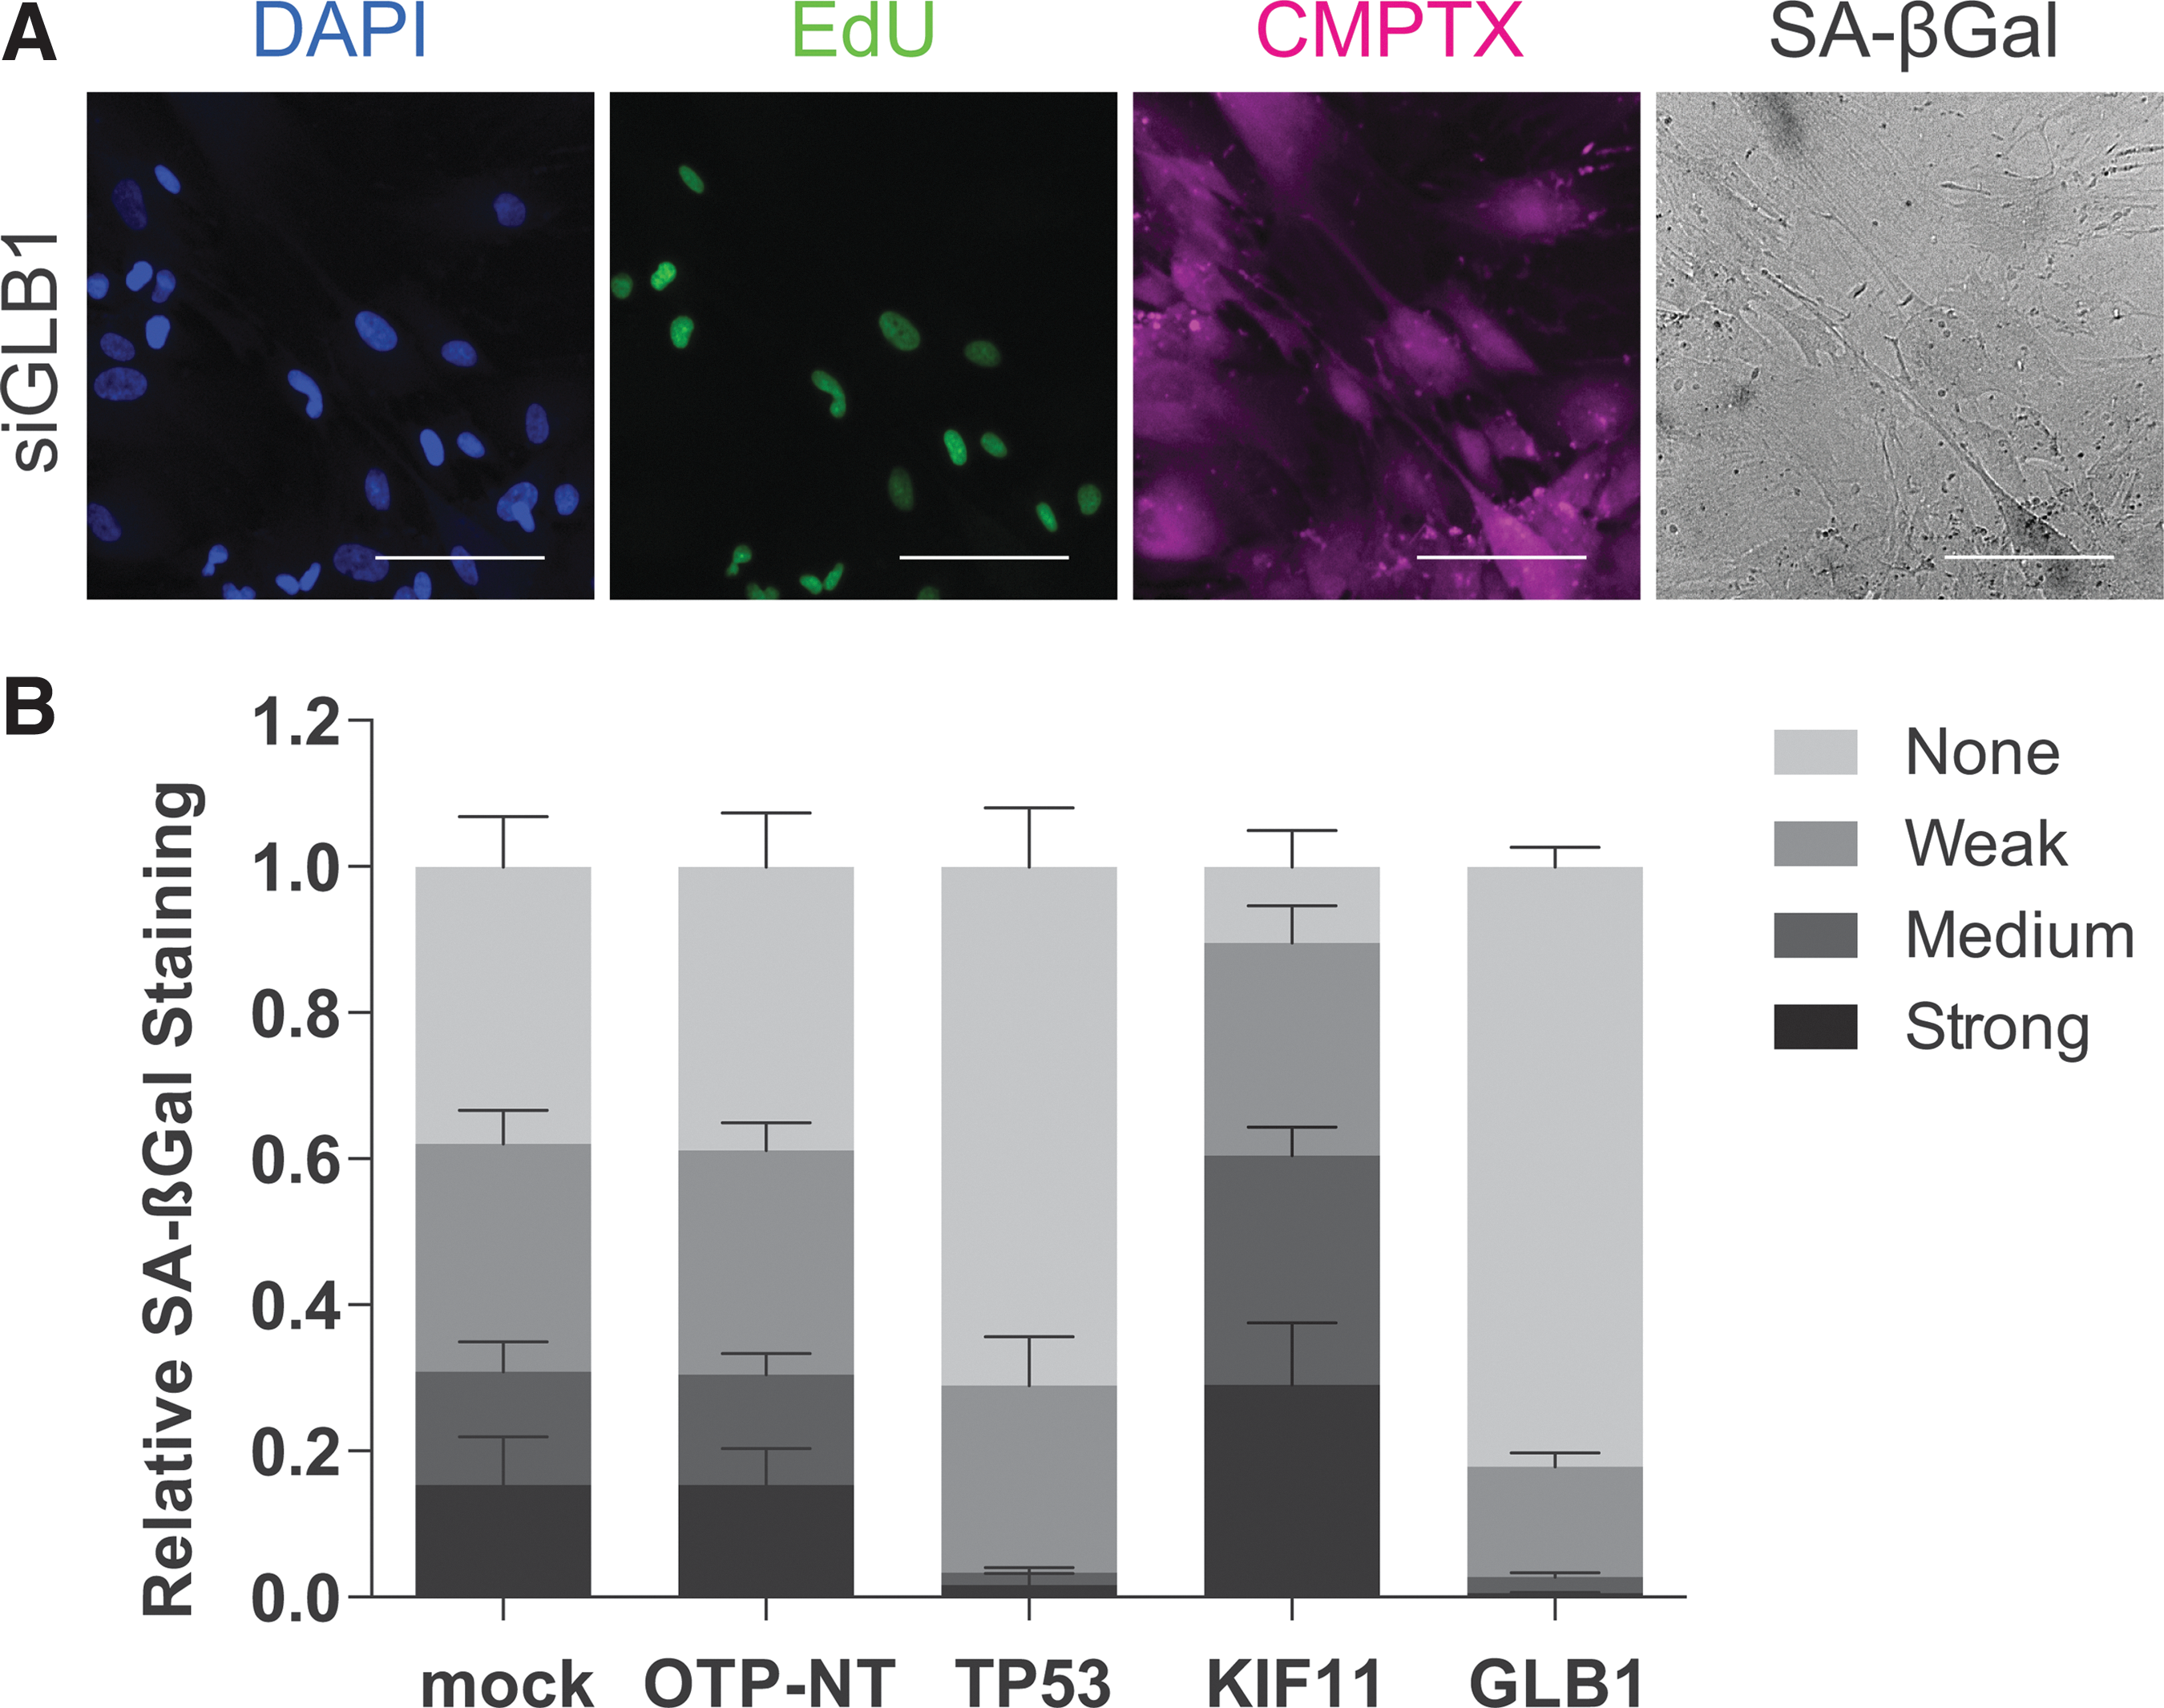
To test the reliability of the model, we first examined the phenotype of knocking down GLB1, the gene encoding beta-galactosidase 31 (Fig. 4A). As expected, visual inspection of the images showed loss of SA-βGal staining. We then performed phenotypic classification analysis of the control siRNAs as well as siGLB1 on the plate (Fig. 4B). We analyzed relative SA-βGal staining (fraction of total number of cells) in comparison with siOTP-NT by one-way ANOVA with a multiple comparisons test (Table 4). Mock-transfected cells showed no significant difference in SA-βGal staining for all categories (Strong, Medium, Weak, None). TP53 knockdown significantly decreased SA-βGal staining in the Strong, Medium, and Weak categories, and increased the proportion of cells in the None category. Furthermore, siTP53 had a robust Z-score = 10.99 with a 2.7-fold change in normalized cell number, suggesting escape from senescence. Interestingly, KIF11 knockdown increased relative SA-βGal staining in the Strong and Medium classifications and decreased the number of cells in the None classification, which suggests that the reduced cell number observed on knockdown of KIF11 may be associated with enhanced senescence. 26 In accordance with the requirement of GLB1 for SA-βGal staining, knockdown of GLB1 significantly decreased the number of cells with Strong and Medium SA-βGal staining and increased the fraction of cells with Weak and None classifications. siGLB1 had a robust Z-score = 1.91 (1.08-fold change in normalized cell number) and would not be considered a hit according to the statistical cutoff of robust Z-score ≥2, which corresponds to a 1.1-fold change. siTP53 displayed a similar SA-βGal staining profile to siGLB1. Thus, combining the fold change in cell number with the phenotypic classification of SA-βGal corroborates our previous observations that p53 is a critical mechanism by which AKT-induced senescence can be reversed. 12 These data also indicate that our methods for phenotypic classification of SA-βGal staining may be applied on a genome-wide scale.
Control for SA-βGal phenotypic classification analysis.
Phenotypic Classification Analysis of SA-βGal Staining for Control siRNAs and GLB1
95% CI shown are average of data from replicate plates (mock, 6 wells; OTP-NT, 14 wells; TP53, 6 wells; KIF11, 6 wells; GLB1, 1 well).
P < 0.05; ** P < 0.01; **** P < 0.0001.
CI, confidence interval; NS, not significant.
To determine if SA-βGal staining was consistent between individual wells, we performed correlation analysis on a set of replicate plates (No. 12009A, B) (Fig. 5). In general, correlation between SA-βGal staining was consistent between replicate plates. Phenotypic classification was most robust with the Strong category (Pearson correlation coefficient = 0.85). The Medium, Weak, and None categories showed a moderate degree of correlation (Pearson correlation coefficients = 0.63, 0.71, and 0.71, respectively).
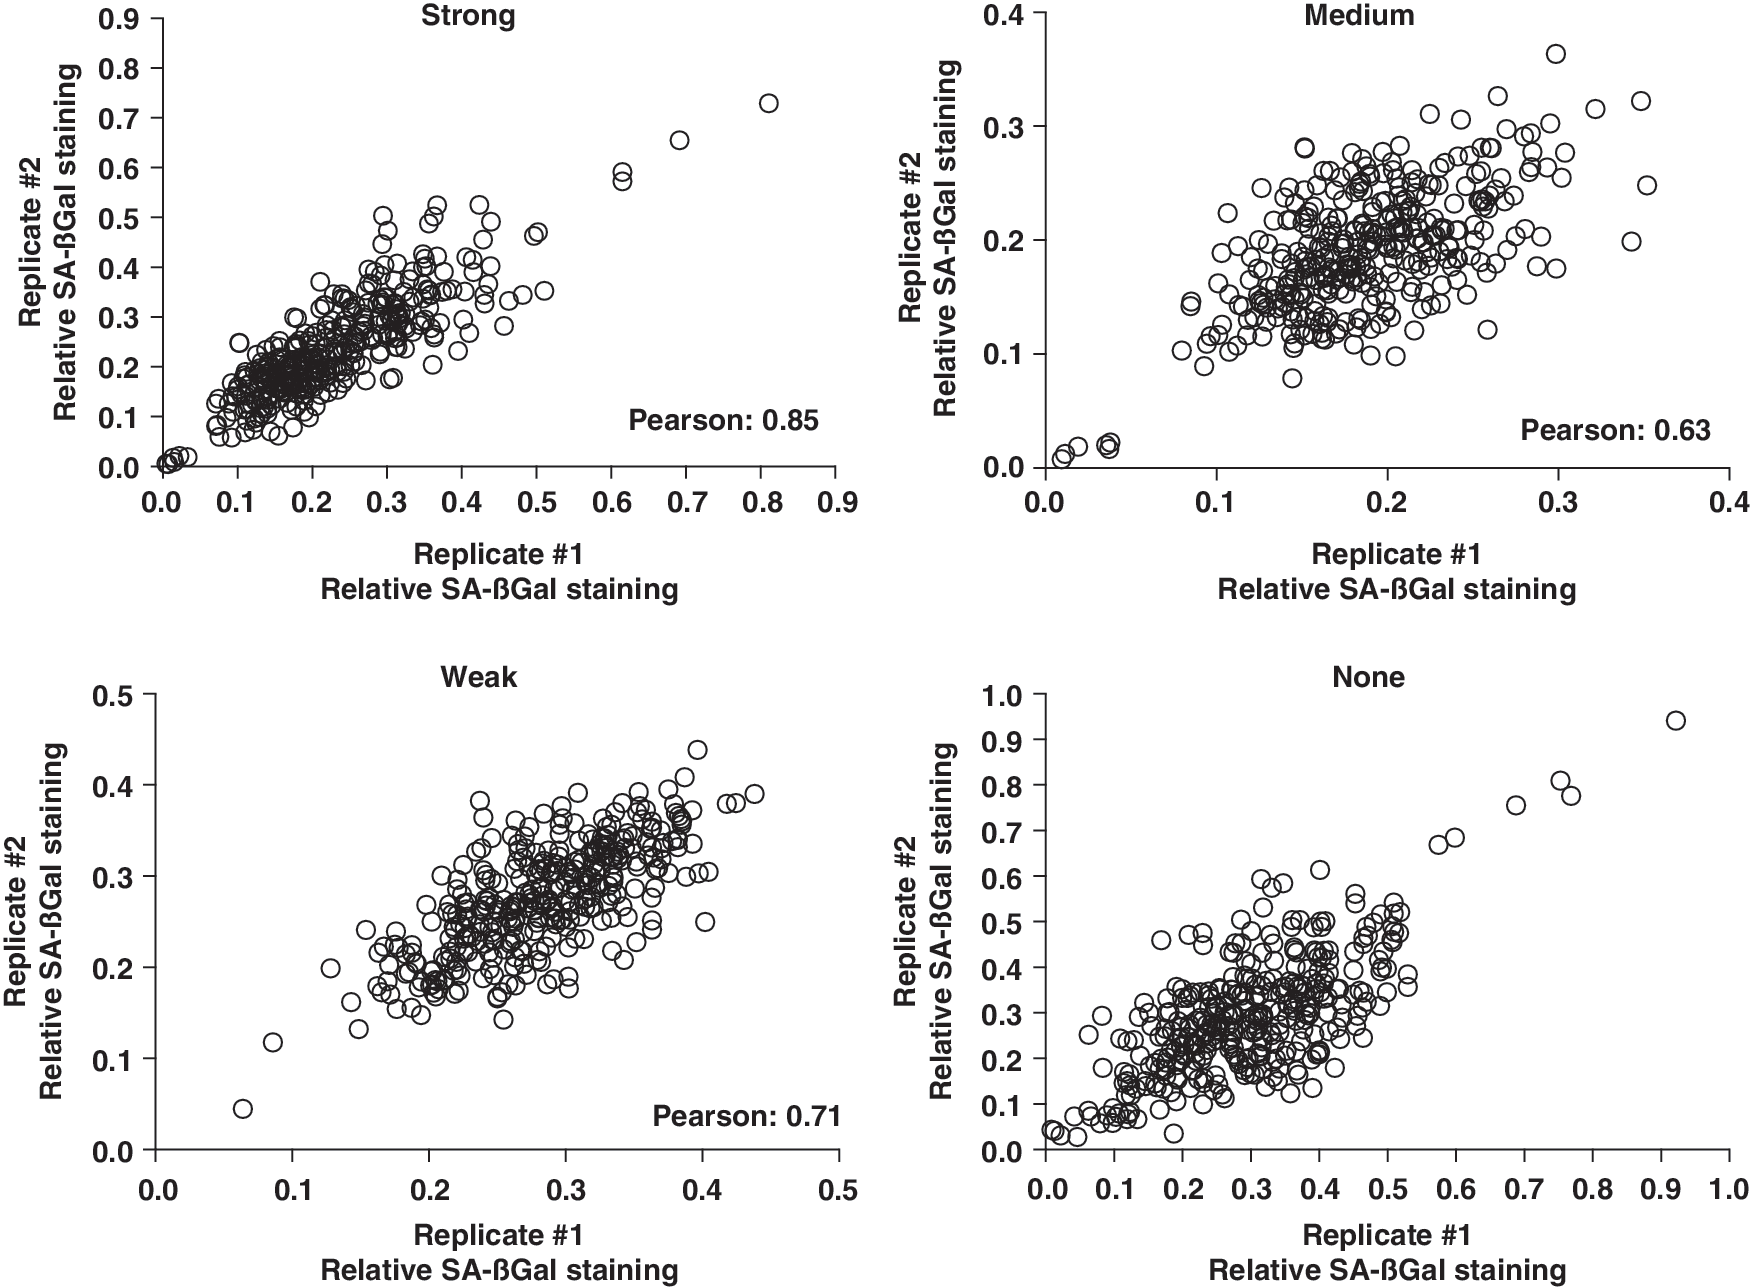
SA-βGal phenotypic classification reproducibility. Correlation plots of relative SA-βGal staining (fraction of total number of cells) for a set of replicate plates (No. 12009A, B) between the four phenotypic classifications: Strong, Medium, Weak, None.
To test if phenotypic classification of SA-βGal staining can be applied to other siRNAs, using the senescence escape assay, we tested the analysis on randomly picked gene targets (in replicate wells) from a library plate in the collection (No. 12009A, B). Based on a robust Z-score statistical cutoff ≥2 for relative cell number normalized to OTP-NT, we determined that adenylate cyclase 3 (ADCY3), carbonic anhydrase 11 (CA11), opioid binding protein/cell adhesion molecule-like (OPCML), and TAR (HIV-1) RNA binding protein 1 (TARBP1) would be considered hits (Fig. 6 and Table 5). The statistical analyses for phenotypic classification are summarized in Table 6. For these specific gene targets, relative cell number did not correlate with SA-βGal staining, indicating that no new senescence escape genes have been identified as of yet. These findings reinforce the importance of coupling SA-βGal staining with measurements of proliferation to best analyze the mechanisms underlying the induction and maintenance of senescence in general, including senescence induced by individual oncogenes as well as by replicative senescence.
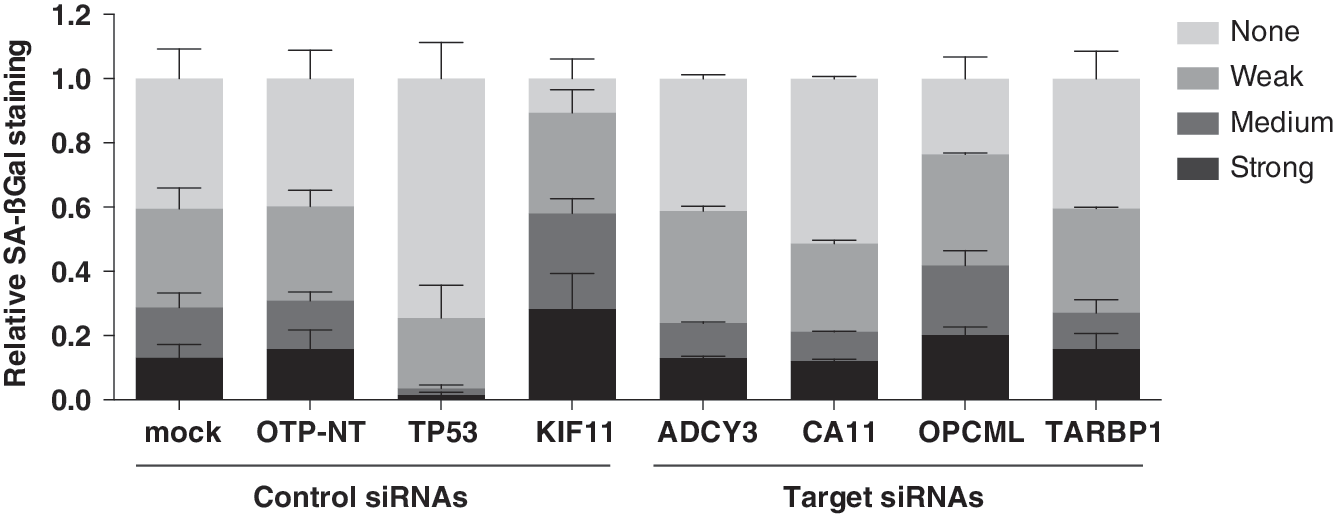
Target genes evaluated using SA-βGal phenotypic classification analysis. Phenotypic classification analysis of relative SA-βGal staining (fraction of total number of cells) for mock (12 wells), siOTP-NT (28 wells), siTP53 (12 wells), siKIF11 (12 wells) control siRNAs, and target siRNAs (2 wells each) in the same set of replicate plates (No. 12009A, B). Target siRNAs were for adenylate cyclase 3 (ADCY3), carbonic anhydrase 11 (CA11), opioid binding protein/cell adhesion molecule-like (OPCML), and TAR (HIV-1) RNA binding protein 1 (TARBP1).
Gene Targets Used for Phenotypic Classification of SA-βGal Staining
All parameters were normalized to the average data of all 14 siOTP-NT wells in each plate.
Robust Z-score shown is averaged from replicate wells.
Fold change shown is averaged from replicate wells.
Phenotypic Classification Analysis of SA-βGal Staining of Selected Gene Targets
95% CI shown are average of data from replicate plates (mock, 6 wells; OTP-NT, 14 wells; TP53, 6 wells; KIF11, 6 wells; ADCY3, 1 well; CA11, 1 well; OPCML, 1 well; TARBP1, 1 well).
P < 0.05; **** P < 0.0001.
Together, we present methods to test for senescence regulators using transient RNAi and multiparametric readouts, and we establish a high-throughput machine learning approach for the phenotypic categorization of SA-βGal staining. These methods utilize CellProfiler and Advanced Cell Classifier software, which are open-source and readily available to the senescence research community. While the machine learning model does need to be retrained for different experimental conditions, this allows flexibility in the approach and should be rapid, only requiring ∼1,000 cells. Our development of these methods allows for a future in-depth analysis of the relationship between SA-βGal and proliferation, which can be readily adaptable to other models of senescence and can be translated to high-throughput siRNA or chemical screens. In particular, our methods can facilitate the study of the senescence-like phenotype that occurs in several malignant cancer cell types in response to drug therapy. 32,33 Therapy-induced senescence can promote the engagement of the immune system to clear aberrant cells. 34 Alternatively, a subpopulation of resistant senescent cells can promote disease recurrence, perhaps by acquiring specific genetic alterations that can escape senescence post-treatment. 35,36 High-content screening using the methods described here can provide critical insight into mechanisms of resistance and identify potential targets for rational combination therapies.
Footnotes
Acknowledgments
This work was supported by a National Health and Medical Research Council (NHMRC) of Australia program grant (1053792) and a Cancer Council Victoria Grant-in-Aid (1065118). The Victorian Centre for Functional Genomics (VCFG) is funded by the Australian Cancer Research Foundation (ACRF); the Victorian Department of Industry, Innovation and Region Development (DIIRD); the Australian Phenomics Network (APN) and supported by funding from the Australian Government Education Investment Fund through the Super Science Initiative; the Australasian Genomics Technologies Association (AGTA); the Brockhoff Foundation; and the Peter MacCallum Cancer Centre Foundation. L.P. and P.H. are supported by a TEKES FiDiPro Fellow Grant 40294/13. R.D.H and R.B.P are funded by NHMRC Fellowships. P.H. acknowledges the Hungarian National Brain Research Program (MTA-SE-NAP B-BIOMAG). The authors thank Daniel Thomas and Jennii Luu (VCFG) for their expert technical assistance.
Disclosure Statement
The authors do not have any institutional or commercial affiliation that poses a real or perceived conflict of interest with respect to the study. K.J.S. and P.H. are on the Society of Biomolecular Imaging and Informatics (SBI2) Board of Directors.