
Abstract
The continued activation of androgen receptor (AR) transcription and elevated expression of AR and transcriptional intermediary factor 2 (TIF2) coactivator observed in prostate cancer (CaP) recurrence and the development of castration-resistant CaP (CRPC) support a screening strategy for small-molecule inhibitors of AR-TIF2 protein–protein interactions (PPIs) to find new drug candidates. Small molecules can elicit tissue selective effects, because the cells of distinct tissues express different levels and cohorts of coregulatory proteins. We reconfigured the AR-TIF2 PPI biosensor (PPIB) assay in the PC-3 CaP cell line to determine whether AR modulators and hits from an AR-TIF2 PPIB screen conducted in U-2 OS cells would behave differently in the CaP cell background. Although we did not observe any significant differences in the compound responses between the assay performed in osteosarcoma and CaP cells, the U-2 OS AR-TIF2 PPIB assay would be more amenable to screening, because both the virus and cell culture demands are lower. We implemented a testing paradigm of counter-screens and secondary hit characterization assays that allowed us to identify and deprioritize hits that inhibited/disrupted AR-TIF2 PPIs and AR transcriptional activation (AR-TA) through antagonism of AR ligand binding or by non-specifically blocking nuclear receptor trafficking. Since AR-TIF2 PPI inhibitor/disruptor molecules act distally to AR ligand binding, they have the potential to modulate AR-TA in a cell-specific manner that is distinct from existing anti-androgen drugs, and to overcome the development of resistance to AR antagonism. We anticipate that the application of this testing paradigm to characterize the hits from an AR-TIF2 PPI high-content screening campaign will enable us to prioritize the AR-TIF2 PPI inhibitor/disruptor leads that have potential to be developed into novel therapeutics for CaP and CRPC.
Introduction
Approximately 1 in 7 men in western countries will be diagnosed with prostate cancer (CaP) during their lifetimes, making it the most common solid tumor and second leading cause of cancer death among men. 1 –5 Twenty percent of patients will develop castration-resistant CaP (CRPC), resulting in ∼30,000 deaths annually in the United States. 1 –5 In 2006, the total estimated expenditure on CaP in the United States was $9.86 billion, with 75% of patient costs occurring in the last year of life. 6 Androgen ablation therapy (AAT), the standard treatment for CaP, targets the production or action of the testicular androgens that provide critical growth and survival signals to prostate cells. 1 –5 AAT reduces testosterone production to castration levels and/or directly antagonizes ligand binding to the androgen receptor (AR). The limiting toxicities of AAT include muscle atrophy, anemia, cognitive dysfunction, and treatment-induced bone loss. 7 –11 Despite positive initial patient responses to AAT, the disease transforms and progresses to the CRPC state and resistance to anti-androgens develops. 7,9,11 Drug resistance mechanisms include over-expression of AR and/or its co-activators, alterations in the balance of coactivators to corepressors, AR mutations, expression of constitutively active AR splice variants, intracrine androgen synthesis, alternative methods of AR activation, or activation of different signaling pathways that “by-pass” AR. 7 –15
Since 2010, the FDA has approved six drugs for metastatic CRPC. 16 –18 The new drugs largely represent extensions of traditional approaches: chemotherapy (cabazitaxel), AR antagonism (enzalutamide), or androgen synthesis inhibition (abiraterone) and share the same toxicology liabilities. 8,10,16 –19 Unfortunately, these new drugs only extend overall survival by 3–5 months, because CaP cells inevitably develop resistance and patients die from metastatic CRPC, for which there is no cure. 16 –18 The majority of prostate tumors that relapse after enzalutamide or abiraterone treatment express the AR-target gene prostate-specific antigen (PSA), indicating that AR becomes reactivated in relapsed tumors. The AR is a nuclear receptor (NR) that regulates the transcription of target genes that are mediated by the ligand-induced interactions of AR with DNA and the assembly of a large complex of proteins, including coactivator proteins, DNA or histone-modifying enzymes, scaffolding proteins, and the core transcriptional machinery. 1,2,12,13 Therapies that target AR transcriptional activity (AR-TA) might, therefore, reduce the potential for development of CRPC and resistance to existing therapies, and our approach has been to develop high-content screening (HCS) assays to find small molecules that inhibit the formation of or disrupt the protein–protein interactions (PPIs) involved in assembly of the AR transcriptional complex. 20
Elevated expression levels of several AR coregulators, including transcriptional intermediary factor 2 (TIF2/SRC-2), which is a member of the steroid receptor coactivator SRC/p160 family, have been associated with relapsed CaP. 3 –5,12,13,21 –24 Cumulative evidence suggests that elevated TIF2 expression might be especially relevant to CRPC; TIF2 stabilizes AR-ligand binding, enhances receptor stability, facilitates AR N/C interactions, and promotes both the recruitment of chromatin remodeling coactivators and assembly of the transcriptional machinery on the promoters of AR target genes. 1,2,25 –27 There is a significant correlation between tumor TIF2 expression and CaP aggressiveness. 5,21,28,29 In comparison to benign prostatic hyperplasia tissue or androgen-dependent CaP, TIF2 levels are significantly elevated in relapsed CaP after AAT; TIF2 mRNA levels become elevated during early CaP recurrence; and patients who have relapsed after AAT exhibit the highest TIF2 expression levels. 5,21 Over-expression of TIF2 enhanced AR responses to androgens and non-AR ligands, whereas TIF2 knockdown reduced AR target gene expression and inhibited the growth of androgen-dependent and -independent CaP cells. 5,21 TIF2 over-expression compensates for reduced androgen levels, and elevated TIF2 expression correlates with increased CaP cell proliferation. Serum interleukin 6 (IL-6) concentrations are higher in patients with metastatic CaP and correlate with increased tumor burden, serum PSA levels, metastases, and CRPC. 28 LnCaP cells treated with exogenous IL-6 express more TIF2 and develop resistance to bicalutamide. 28 Over-expression of TIF2 increases resistance to bicalutamide, whereas shRNAi knockdown of TIF2 restores bicalutamide sensitivity. 28 Increased AR-TA in the C4-2 and 22-Rv1 CRPC cell lines is associated with elevated TIF2 recruitment combined with decreased corepressor expression levels and recruitment. 29 Prolonged AR localization on the promoters of AR target genes combined with elevated TIF2 recruitment has been implicated in the development of CRPC, and it was suggested that small-molecule inhibitors of AR interactions with SRC coactivators might have therapeutic value. 5,12,13,21,22,24,30 –32
Differences in AR coregulator expression levels between CaP cell lines and normal tissues contribute to the observed variations in their androgen responsiveness. 33,34 For example, LnCaP cells express low levels of several AR corepressors with higher levels of coactivators such as TIF2, SRC-1, and FKBP4. 33 NRs selectively recruit coactivator complexes, and distinct ligands elicit preferential recruitment of different coregulator cohorts. 25,26,35 Some NR ligands only activate a subset of target genes, and it is believed that such gene selectivity is cell or tissue specific and reflects the ratio of coactivators to corepressors, which determines whether an on or off signal is processed. 35 Coregulators may also exhibit different functions depending on the specific promoter context. 25,26,35 NR coactivator recruitment profiles, therefore, influence the tissue-specific spatiotemporal gene expression responses to NR ligands. 26,35,36 Indeed, selective estrogen receptor modulators (SERMs) and selective androgen receptor modulators (SARMs) take advantage of the different repertoires and concentrations of coregulatory proteins in various cells to exert their tissue-selective behaviors. 7,14,32,35,37 SERMs and SARMS have convincingly demonstrated that small molecules can elicit tissue- or gene-selective effects, and recently, several groups have developed inhibitors that disrupt interactions between NRs and coactivator proteins. 7,14,31,32,35,37,38 For example, the bone-specific actions of the SARM S-101479 are the result of its failure to recruit TIF2, SRC-1, and NCoA3. 38
We have previously described an AR-TIF2 PPI biosensor (PPIB) HCS assay that can be used to screen for compounds that can induce, inhibit the formation of, or disrupt pre-existing PPIs between AR and TIF2. 20 However, the previous AR-TIF2 PPIB studies were conducted in the U-2 OS osteosarcoma cell line, and we wanted to determine whether the assay might perform differently when performed in a CaP cell background and whether AR-TIF2 PPI inhibitor or disruptor hits would behave differently. 20 In addition, we describe the development and implementation of counter-screens and hit characterization secondary assays that are designed to validate and prioritize AR-TIF2 PPI inhibitors and/or disruptors identified by the assay.
Materials and Methods
Reagents
Formaldehyde, dihydrotestosterone (DHT), flutamide, bicalutamide, mifepristone, budesonide, estrone, N-p-tosyl-L-phenylalanine chloromethyl ketone (TPCK), Bay 11-7085, nilutamide, N-carbobenzyloxy-L-phenylalanyl-chloromethyl ketone (ZPCK), (Z)-guggulsterone, parthenolide, 17-alpha-hydroxyprogesterone (17-α-H-PG), 2-methoxyestradiol (2-MOED), 4-phenyl-3-furoxancarbonitrile (4-P-3-FOCN), spironolactone, cortexolone, cyproterone acetate, Tris(2-carboxyethyl)phosphine hydrochloride (TCEP), and protease inhibitors were purchased from Sigma-Aldrich. OneShot BL21 (DE3) competent Escherichia coli cells were purchased from Life Technology (ThermoFisher). Isopropyl-β-D-thiogalactoside (IPTG) was purchased from Gold Biotechnology. Lysozyme was purchased from ACROS Organics (ThermoFisher). Hoechst 33342 was purchased from Invitrogen. Dimethyl sulfoxide (DMSO) (99.9% high-performance liquid chromatography grade, under argon) was from Alfa Aesar. Dulbecco's Mg2+ and Ca2+ free phosphate-buffered saline (PBS) was purchased from Corning. Ni2+-conjugated resin beads were purchased from Clontech. Imidazole was purchased from Calbiochem (EMD Millipore). The bicinchoninic acid (BCA) protein assay kit was purchased from Pierce (ThermoFisher).
Cells and Tissue Culture
PC-3 and DU-145 cells were provided by the National Cancer Institute (NCI) as part of the NCI 60 tumor cell line panel. LnCaP (CRL-1740) and 22-Rv1 (CRL-2505) cells were obtained from the American Type Culture Collection. C4-2 cells were purchased from UroCor and kindly provided by Dr. Zhou Wang (University of Pittsburgh, Pittsburgh, PA). All of the CaP cell lines were maintained in RPMI 1640 medium with 2 mM L-glutamine (Invitrogen) that was supplemented with 10% fetal bovine serum (Gemini Bio-Products), and 100 U/mL penicillin and streptomycin (Invitrogen) in a humidified incubator at 37°C, 5% CO2, and 95% humidity.
Compound Libraries and Compound Handling
The 1,280 compound Library of Pharmacologically Active Compounds (LOPAC) was purchased from Sigma-Aldrich and replica daughter plate sets were prepared, stored, and handled as previously described. 20,39 –43 To determine 50% inhibition concentrations (IC50), 10-point twofold serial dilutions of test compounds in 100% DMSO were performed by using a 384-well P30 dispensing head on the Janus MDT automated liquid handling platform (Perkin Elmer). Daughter plates containing 2 μL of the serially diluted compounds in DMSO were prepared and replicated from the 384-well serial dilution master plates by using the Janus MDT platform that was outfitted with a 384-well transfer head. Aluminum adhesive plate seals were applied, and plates were stored at −20°C. For testing in the bioassays, daughter plates were withdrawn from −20°C storage, thawed to ambient temperature, and centrifuged for 1 min at 100 g, and the plate seals were removed before the transfer of 38 μL of serum-free media (SFM) into wells by using the BioTek Microflo liquid handler (BioTek) to generate an intermediate stock concentration of library compounds ranging from 1.95 to 500 μM (5.0% DMSO). The diluted compounds were mixed by repeated aspiration and dispensation by using a 384-well P30 dispensing head on the Janus MDT platform and then, 5 μL of diluted compounds was transferred to the wells of assay plates to provide a final concentration response ranging from 0.195 to 50 μM (0.5% DMSO).
Image Acquisition on the ImageXpress Micro-Automated Imaging Platform
The ImageXpress Micro (IXM) is an automated wide-field high-content imaging platform integrated with the MetaXpress Imaging and Analysis software (Molecular Devices LLC). The IXM optical drive includes a 300 W Xenon lamp broad spectrum white light source and a 2/3″ chip Cooled CCD Camera and optical train for standard field-of-view imaging and an IXM transmitted light option with phase contrast. The IXM is equipped with a 4 × Plan Apo 0.20 NA objective, a 10 × Plan Fluor 0.3 NA objective, a 20 × Ph1 Plan Fluor ELWD DM objective, a 20×, S Plan Fluor ELWD 0.45 NA objective, a 40×, S Plan Fluor ELWD 0.60 NA objective, and a single slide holder adaptor. The IXM is equipped with the following ZPS filter sets: DAPI, FITC/ALEXA 488, CY3, CY5, and Texas Red.
Image Analysis Using the Multi-Wavelength Cell Scoring and Translocation Enhanced Modules
We used the multi-wavelength cell scoring (MWCS) image analysis module to quantify the expression of the AR-RFP and TIF2-green fluorescent protein (GFP) biosensors in the digital images of infected PC-3 cells acquired on the IXM as previously described. 20 The MWCS module image segmentation identified and classified Hoechst 33342 stained fluorescent objects in Ch1 that exhibited appropriate fluorescent intensities above background and size (width, length, and area) characteristics of PC-3 nuclei and used these objects to create nuclear masks for each cell. After applying user-defined background average intensity thresholds in Ch2 and Ch3, the multi-wavelength translocation module image segmentation then created cell masks for each cell. The nuclear mask from Ch1 was then used to quantify the amount of target channel fluorescence within the nuclear region of the derived cell masks in Ch2 (TIF2-GFP) and Ch3 (AR-RFP). After subtracting the nuclear mask of the Ch1 region from the derived cell masks in Ch2 (TIF2-GFP) and Ch3 (AR-RFP), the amount of target channel fluorescence within the cytoplasm region in Ch2 (TIF2-GFP) and Ch3 (AR-RFP) could be derived. The MWCS image analysis module outputs quantitative data include: the average and integrated fluorescent intensities of the Hoechst-stained objects (compartments) in Ch1; the number of compartments or total cell count in Ch1; and the integrated and average fluorescent intensities of the Ch2 and Ch3 signals in whole cells and/or their nucleus and cytoplasm regions. By applying the user-defined average intensity thresholds in Ch2 (TIF2-GFP) and Ch3 (AR-RFP), the MWCS module can calculate the percentage of cells that exhibit signals above and below the designated background levels. We used the percentage of positive Ch2 (TIF2-GFP) and Ch3 (AR-RFP) outputs of the MWCS module to quantify the infection and co-infection rates in PC-3 cells exposed to the respective TIF-GFP and AR-RFP recombinant adenovirus (rAVs) biosensors, either alone or combined.
We utilized the translocation enhanced (TE) image analysis module to analyze and quantify AR-TIF2 PPIs from digital images acquired on the IXM as previously described. 20 We used the TIF2-GFP biosensor component in Ch2 to create a translocation mask of the nucleoli within the Hoechst-stained nucleus. The TIF2-GFP remains localized to bright fluorescent puncta anchored within the nucleolus of the nucleus, and objects in Ch2 that had TIF2-GFP fluorescent intensities above background with appropriate morphologic characteristics (width, length, and area) were classified by the image segmentation as nucleoli and used to create a TIF2 mask and to count the number of TIF2-GFP-positive nucleoli. Objects that met these criteria were used to create masks of the nucleoli within the Hoechst-stained nuclei of each cell. AR-RFP images from Ch3 were segmented into an “Inner” nucleolus region with a mask set by using the edge of the detected TIF2-GFP-positive nucleoli in Ch2. The TE image analysis module outputs quantitative data such as: the average fluorescent intensities of the TIF2-GFP-stained objects in Ch2; the selected object or nucleoli count in Ch2; and the integrated and average fluorescent intensities of the AR-RFP Ch3 signal in the TIF2-positive nucleolus (inner) region. The mean average inner intensity of AR-RFP within the TIF2-GFP positive nucleoli output of the TE image analysis module was used to quantify AR-TIF2 PPIs. 20
Automated AR-TIF2 PPIB HCS Assay Protocol in PC-3 Cells
The automated AR-TIF2 PPIB HCS assay protocol in PC-3 cells is presented in Table 1, and only three adjustments were made to the protocol previously developed in U-2 OS cells. 20 The changes to the protocol included: the co-infection of PC-3 cells rather than U-2 OS cells with the rAVs PPIB; PC-3 cells required ∼10-fold more adenovirus than U-2 OS cells for co-infection; and co-infected PC-3 cells were seeded into 384-well assay plates at a higher density of 6,000 cells per well. 20
AR-TIF2 Protein–Protein Interaction Biosensor HCS Assay Protocol in PC-3 Cells
1. PC-3 cells maintained in RPMI 1640 medium with 2 mM L-glutamine supplemented with 10% fetal bovine serum, and 100 U/mL penicillin and streptomycin in a humidified incubator at 37°C, 5% CO2, and 95% humidity. Cell monolayers (<70% confluent) were washed 1× with PBS, and they were then exposed to trypsin-EDTA until they detached from the surface of the tissue culture flasks. Cells were pelleted at 270 g for 5 min in a Sorvall ST 16 Centrifuge with a TX-400 Rotor.
2. Aspirate medium, re-suspend pelleted cells in tissue culture medium+FBS, and count the number of trypan blue excluding viable cells, in a hemocytometer.
3. PC-3 cells were co-infected with the TIF2-GFP and AR-RFP adenovirus expression constructs by incubating cells with the required volume of virus, typically 40–50 μL/106 cells, in 1.0 mL culture medium for 1 h at 37°C, 5% CO2, and 95% humidity with periodic inversion (every 10 min) to maintain cells in suspension.
4. PC-3 cells co-infected with the rAV biosensors were seeded into 384-well black-walled clear-bottom Collagen I coated plates, Greiner Bio-one Cat. No. 781956, BioTek Microflo (BioTek), at 6,000 cells per well and incubated for 24 h at 37°C, 5% CO2, and 95% humidity in RPMI 1640 medium with 2 mM L-glutamine supplemented with 10% fetal bovine serum, and 100 U/mL penicillin and streptomycin.
5. 0.2–50 μM compounds were added to wells in columns 3–22 by using a Janus MDT automated liquid handler outfitted with a 384-well transfer head (Perkin Elmer).
6. Incubate treated co-infected PC-3 cells for 3 h at 37°C, 5% CO2, and 95% humidity.
7. DHT (100 nM final in well) was added to maximum controls and compound wells, media to minimum control wells using a Janus MDT automated liquid handler outfitted with a 384-well transfer head (Perkin Elmer).
8. Incubate treated co-infected PC-3 cells ± DHT 30 min at 37°C, 5% CO2, and 95% humidity.
9. Aspiration of media and fixative addition automated on BioTek ELx405 (BioTek) plate washer.
10. 30 min incubation at ambient temperature to fix cells and to stain nuclei with Hoechst.
11. Aspiration of fixative and PBS wash steps automated on BioTek ELx405 (BioTek) plate washer.
12. Plates sealed with adhesive aluminum plate seals.
13. Plates loaded into the ImageXpress Micro HCS platform (Molecular Devices LLC).
14. Images analyzed using the TE Image analysis module of MetaXpress (Molecular Devices LLC).
AR, androgen receptor; DHT, dihydrotestosterone; DMSO, dimethyl sulfoxide; FBS, fetal bovine serum; GFP, green fluorescent protein; HCS, high-content screening; PBS, phosphate-buffered saline; RFP, red fluorescent protein; TE, translocation enhanced; TIF2, transcriptional intermediary factor 2.
AR-Ligand Binding Domain Expression and Purification
A pET28a expression vector containing a 6x Histidine-tagged AR-ligand binding domain (LBD) residues 622-919 (pET28a-His6-AR-LBD) was kindly provided by Dr. Fletterick and Dr. Nguyen of UCSF. OneShot BL21 (DE3) competent E. coli cells (Life Technology; C6060-10) were transformed with the pET28a-His6-AR-LBD plasmid and streaked on kanamycin containing LB agar plates to select colonies for preparing bacterial glycerol stocks. The pET28a-His6-AR-LBD plasmid was isolated from transformed bacteria and sequenced to confirm the identity of the plasmid DNA. Bacteria transformed with pET28a-His6-AR-LBD were used to inoculate cultures that were incubated overnight at 37°C and then used to inoculate an expansion culture that was incubated at 37°C until it reached an OD of 0.1 and was then supplemented with 50 μM DHT. Cultures were switched to 18°C and incubated until they reached an O.D. of 1.0–1.2, and then, His6-AR-LBD expression was induced by incubation with 200 μM IPTG for an additional 18–20 h at 16°C. Cells were pelleted by centrifugation for 20 min at 5,000 g at 4°C and stored frozen at −80°C. Frozen cell pellets were thawed on ice, and they were suspended in “buffer A”: 50 mM HEPES pH of 7.65, 300 mM Li2SO4, 250 μM TCEP, 10% glycerol, and 50 μM DHT containing protease inhibitors and lysozyme (0.1 mg/mL). After 20–30 min of lysozyme treatment, cells were lysed by twelve 30 s 30% amplitude bursts of a probe sonicator (Fisher Scientific Model 505 Sonic Dismembrator), and they were then centrifuged at 20,000 g for 30 min at 4°C; the supernatant was added to Ni2+-conjugated resin beads that had been pre-washed and equilibrated with “buffer A.” The resin was washed twice with approximately eight bed volumes of buffer A, then once with four bed volumes of buffer A supplemented with 2 mM ATP and 10 mM MgCl2, and finally once again with four bed volumes of “buffer A.” The resin was then washed once with approximately four bed volumes of 20 mM imidazole in “buffer A,” and the His6-AR-LBD was eluted in four fractions of two bed volumes of 300 mM imidazole in “buffer A.” The protein concentrations in each elution fraction were determined in the BCA protein assay; the protein constituents were separated on 12% SDS-PAGE gels and transferred to nitrocellulose membranes; and western blots were probed with anti-AR and anti-His antibodies obtained from Santa Cruz Biotechnology. The His6-AR-LBD containing fractions were pooled and then dialyzed in buffer containing 50 mM HEPES pH 7.65, 150 mM Li2SO4, 5% glycerol, 0.2 mM TCEP, and 20 μM DHT. The concentration of pooled, dialyzed protein was determined in the BCA protein assay, and aliquots were stored at −80°C.
AR-LBD H3-DHT Radioligand Binding Assay
The His6-AR-LBD H3-DHT radioligand binding assay was carried out in 96-well Cu2+-coated plates (ThermoFisher) that were incubated overnight at 4°C with 5 μg per well His6-AR-LBD in 100 μL of PBS. Unbound His6-AR-LBD was aspirated; the plate was washed 3 × with 100 μL of 0.05% Tween 20 in PBS and then blocked with 100 μL of 1 mg/mL bovine serum albumin (BSA) in PBS for 1 h. After three more washes with 100 μL of PBS and 0.05% Tween 20, 50 μL of compounds was transferred to the wells by using a Janus MDT automated liquid handling platform outfitted with a 96-well transfer head, and then, 50 μL of 20 nM H3-DHT in PBS was added by using a Matrix pipettor (ThermoFisher). Compounds were tested in the 0.003 to 50 μM concentration range in the presence of 10 nM H3-DHT. After a 1 h co-incubation, compounds and H3-DHT were aspirated and washed 3 × with 0.05% Tween 20 in PBS; 100 μL of micro-scintillation cocktail buffer was added to each well; plates were sealed with adhesive plastic covers; and the counts per minute (CPMs) were captured in a TopCount NXT microtiter plate reader (Perkin Elmer).
PSA-6.1 Luciferase Reporter Assay
The PSA-6.1 LUC luciferase reporter plasmid was kindly provided by Dr. Zhou Wang in the Urology department of the University of Pittsburgh Cancer Institute. The PSA-6.1 LUC plasmid luciferase reporter activity is controlled by a fragment of the PSA promoter that contains at least three androgen response elements. Before the transfection of the CaP cell lines, Fugene 6 and PSA-6.1 LUC were combined at a ratio of 6:1 in serum-free RPMI 1640 media (SFM) and incubated for 25 min at room temperature (RT) before being combined with cells that were suspended in RPMI 1640 media containing 1% penicillin-streptomycin, 1% L-glutamine, and 10% fetal bovine serum. Transfected cells were then seeded into white opaque 384-well assay plates (Greiner Bio-one) at a seeding density of 6,000 cell per well in a volume of 30 μL and incubated at 5% CO2, 37°C, and 95% humidity for 24 h. Each well received 12 ng of PSA-6.1 LUC plasmid DNA. After 24 h, 5 μL of serially diluted compounds was transferred to the wells by using a Janus MDT automated liquid handling platform outfitted with a 384-well transfer head; then, 5 μL of 0.4 μM DHT (50 nM final in well) in SFM was transferred to each well; and the assay plates were returned to the incubator for an additional 24 h before 20 μL of BrightGlo™ luciferase reagent (Promega) was added to the wells and the relative light units (RLUs) were captured on a SpectraMax M5e plate reader (Molecular Devices LLC).
CaP Cell Line Growth Inhibition Assays
The CaP cell line growth inhibition assays were developed and optimized by using methods that were previously applied to other tumor cell lines. On day 1, each CaP cell line was harvested, counted, and seeded into two 384-well assay plates: a time zero (T0) and a time 72 h (T72) plate. PC-3, DU-145, LnCaP, C4-2, and 22-Rv1 cells were seeded at 1,000 cells per well in 45 μL of tissue culture media into uncoated, white, clear-bottom 384-well assay plates (VWR Cat. No. 82050-076) by using a Matrix electronic multichannel pipette (ThermoFisher) and cultured overnight at 37°C, 5% CO2, and 95% humidity. On day 2, 25 μL of the CellTiter-Glo™ (CTG) (Promega) detection reagent was dispensed into the wells of the T0 assay plate by using an Matrix electronic multichannel pipette, and the luminescence signal was captured on the SpectraMax M5e (Molecular Devices LLC) microtiter plate reader. Also, on day 2, 5 μL of compounds diluted in SFM was transferred into the test wells of the T72 384-well assay plates on the Janus MDT automated liquid handler equipped with a 384-well transfer head and the compound-treated assay plates were cultured for 72 h in an incubator at 37°C, 5% CO2, and 95% humidity. Control wells received DMSO alone. On day 5, 25 μL of the CTG detection reagent was dispensed into the wells of the T72 assay plate by using an Matrix electronic multichannel pipette, and the luminescence signal was captured on the SpectraMax M5e microtiter plate reader platform.
Data Processing, Visualization, Statistical Analysis, and IC50 Curve Fitting
An HTS template was utilized to normalize bioassay data as percentage of inhibition based on the performance of assay plate controls and to calculate signal-to-background ratios (S:B) and Z′-factor coefficient assay performance quality control statistics. In each of the 384-well assays, DMSO minimum (n = 32) and maximum (n = 32) plate control wells were utilized to normalize the signals in the compound-treated wells and to represent 0% and 100%, respectively. For the 96-well AR-LBD H3-DHT radioligand binding assay, eight minimum and maximum plate control wells were utilized to normalize the data. For the CaP cell line growth inhibition assays, we used the DMSO control data from the T0 and T72 assay plates to assess the dynamic range of the T0 to T72 cell growth, and to calculate S:B ratios and Z′-factor coefficient statistics for the assay signal window (T0 to T72). To normalize the 72 h compound exposure CaP inhibition data, the signals from the compound-treated wells were processed and expressed as percentage of the T72 DMSO plate controls. IC50 values for each of the bioassays were calculated by using GraphPad Prism 5 software to plot and fit data to curves by using the Sigmoidal dose–response variable slope equation Y = Bottom + [Top-Bottom]/[1 + 10^(LogEC50 − X)*HillSlope].
Results
Development and Optimization of the AR-TIF2 PPIB HCS Assay in PC-3 CaP Cells
Since the AR-TIF2 PPIB components are encoded on separate rAVs, and both must be expressed in the same cells for PPIs to form, we needed to optimize the co-infection and expression of the AR-RFP and TIF2-GFP constructs in the PC-3 CaP cell line (Fig. 1). rAV titers represent only a small fraction of all the virus produced in a culture, and most of the viral particles appear to be noninfectious. 44 Since rAV vectors designed to express the biosensor components must be highly infectious, it is necessary to account for this limited bioactivity. Infectious viral particles (IVPs) are those that can invade cells and, eventually, constrain them to express a gene of interest, and quantifying GFP-expression monitoring was shown to be more reproducible (10% variation) than the more labor-intensive plaque assay titrations or end-point dilutions. 44 The GFP and RFP tags of our rAV biosensor vectors permitted the quantification of the levels of both GFP and RFP expressed by infected cells and IVP numbers by high-content imaging and image analysis in a simple, fast, sensitive, and reliable way (Fig. 1). 20,45,46 We performed titration experiments by increasing the volume of rAV used to infect and/or co-infect 1 × 10⁶ PC-3 cells, acquired 20 × images 24 h post infection and cell seeding (Fig. 1A), and utilized the MWCS image analysis module to quantify the percentage of cells expressing and co-expressing the AR-RFP and TIF-GFP biosensors (Fig. 1B–D). The color composite images of PC-3 cells infected with the AR-RFP and TIF2-GFP biosensors indicated that the addition of more rAV produced higher expression levels (Fig. 1A), and this increased the percentage of cells classified positive by the image analysis module for biosensor expression (Fig. 1B, C). Although the percentage of PC-3 cells that were positive for biosensor expression increased as more of the rAVs were used to infect the cells, the rate of infection appeared to saturate and reach a plateau of 50%–60% and 70%–80% for the TIF2-GFP and AR-RFP biosensors, respectively (Fig. 1B, C). We observed similar trends in PC-3 cells co-infected with increasing amounts of either the TIF2-GFP or AR-RFP rAV at a constant volume of the other biosensor (Fig. 1D). Based on these results, we selected co-infection conditions of 40 μL of the TIF2-GFP plus 50 μL of the AR-RFP rAVs per 106 PC-3 cells for all further assay development experiments. Using these rAV co-infection conditions, ∼50% of the PC-3 cells co-expressed both AR-TIF2 biosensor components (Fig. 1D). In comparison, ≥90% of U-2 OS cells that were co-infected with 10-fold less rAVs co-expressed both biosensors. 20
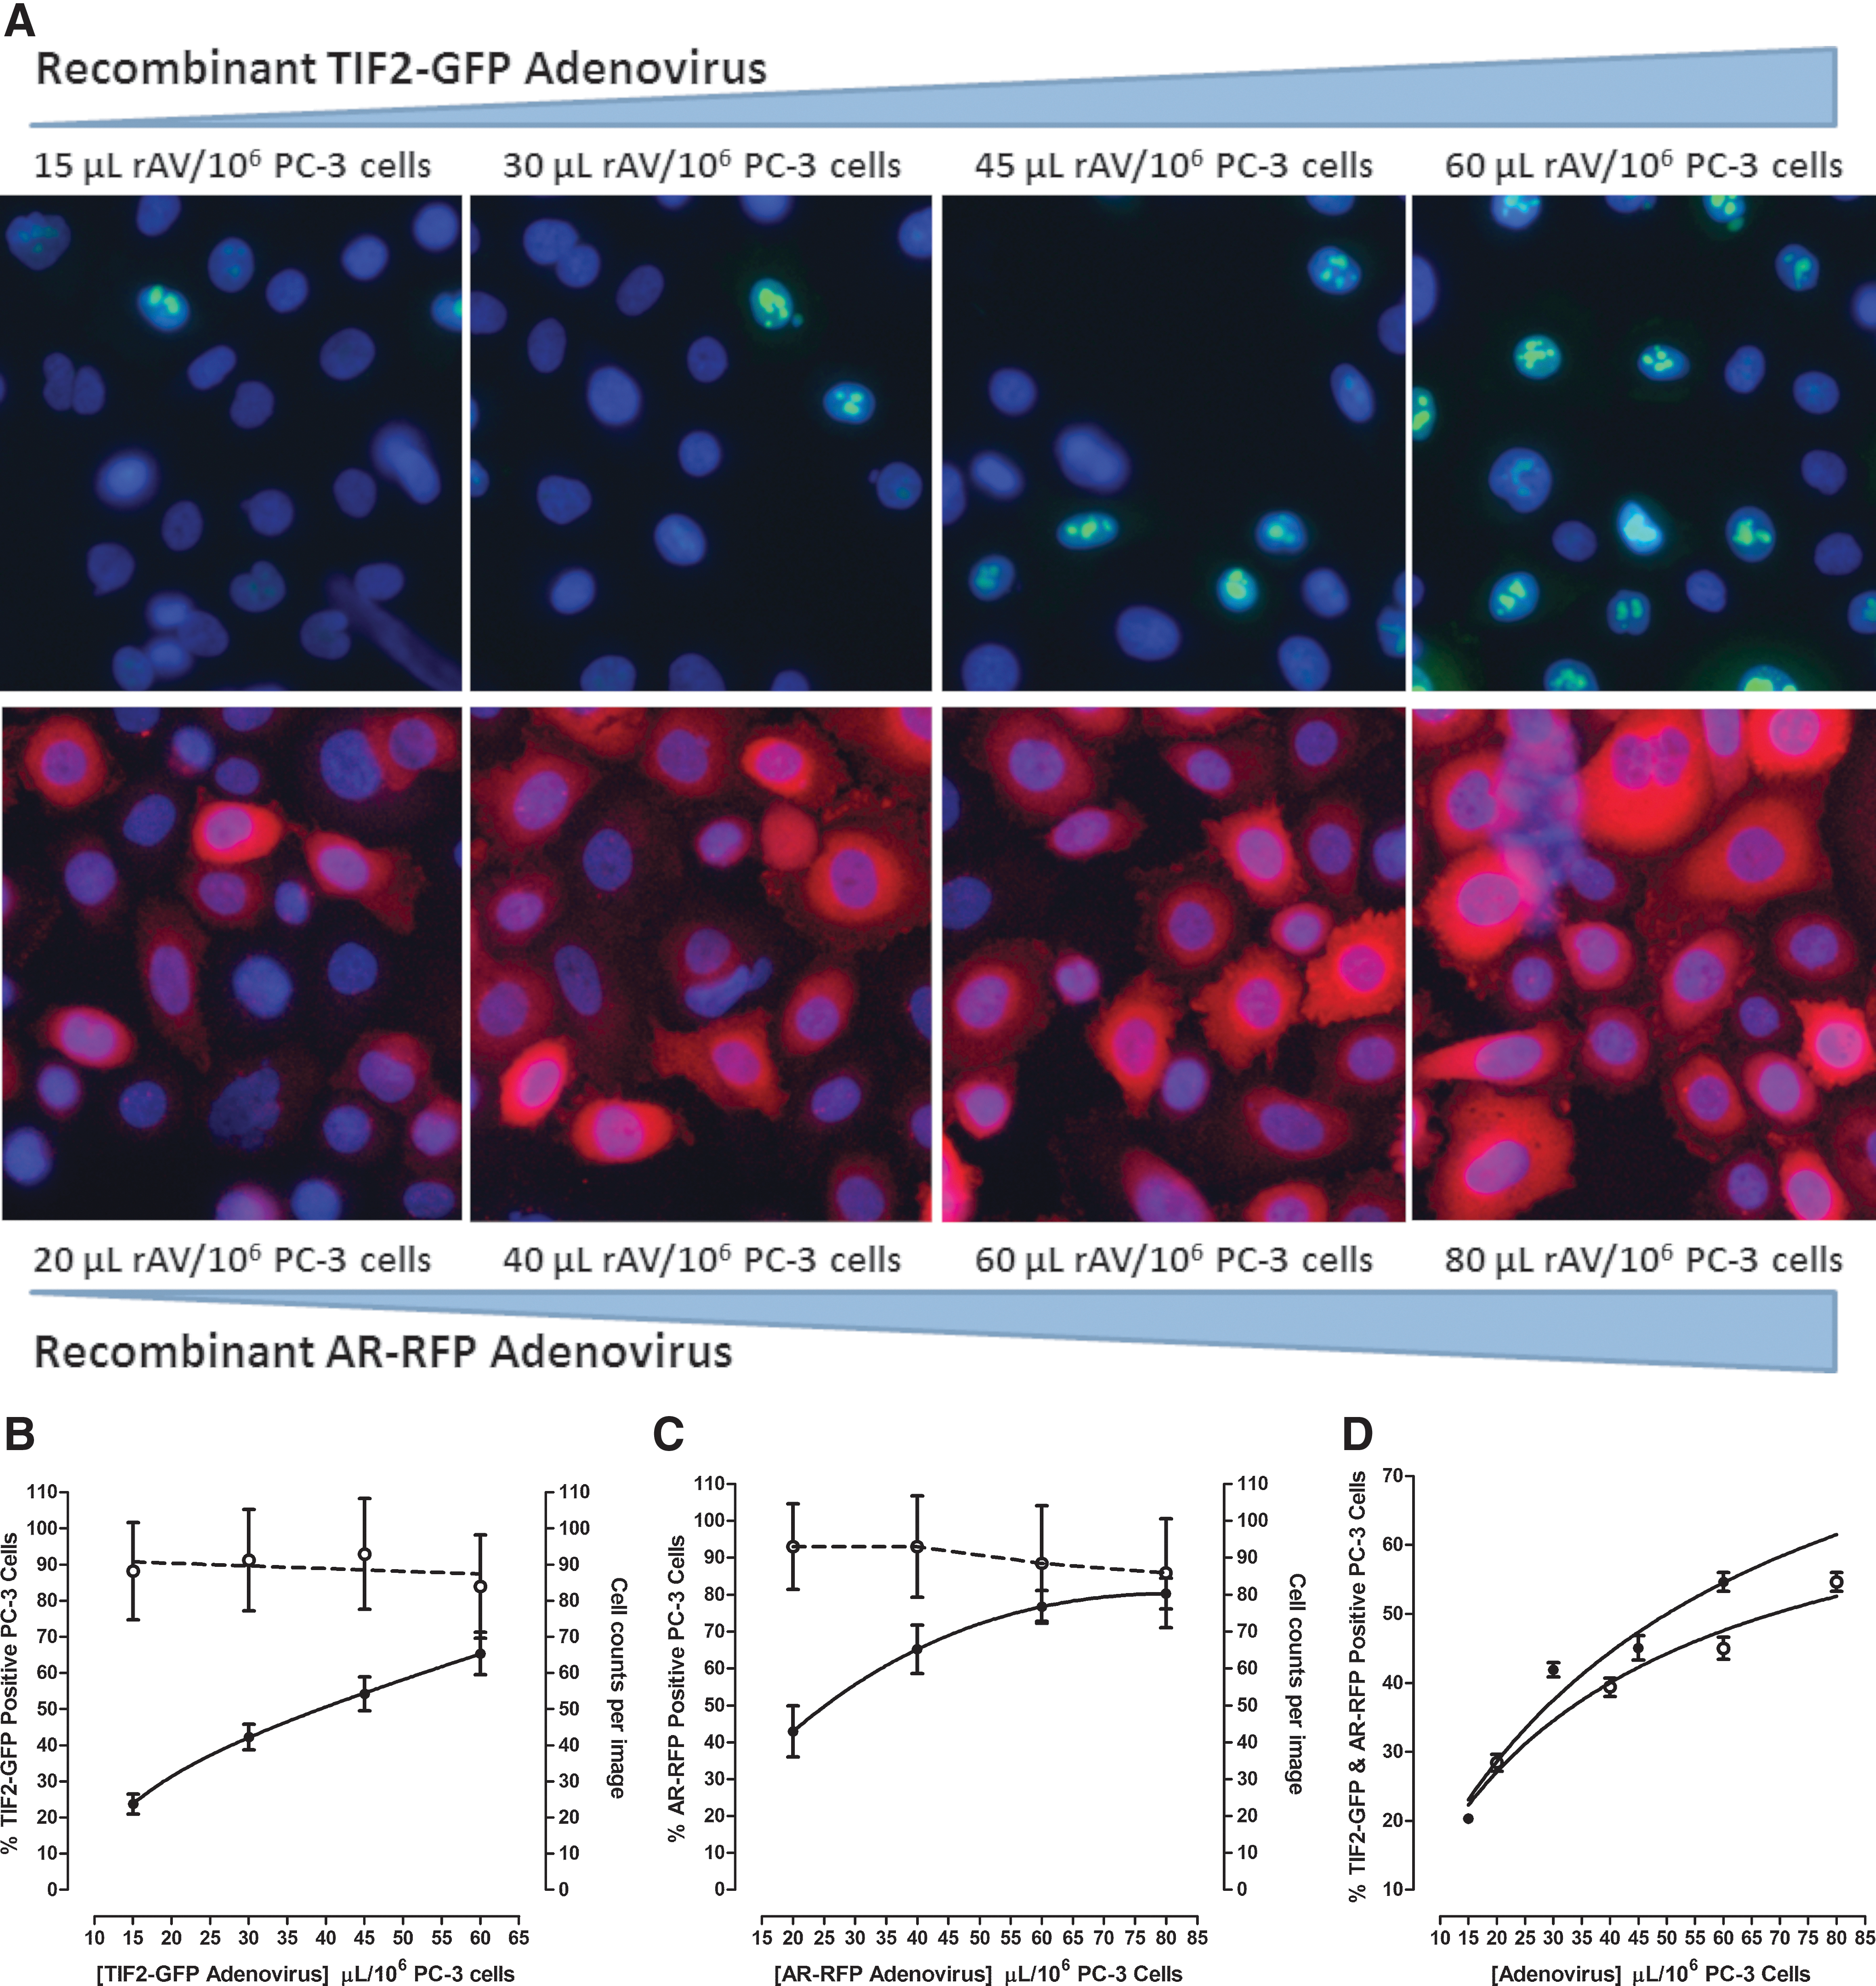
Infection and co-infection of PC-3 CaP cells with the AR-TIF2 PPIB components.
We conducted a series of assay development experiments to optimize the AR-TIF2 PPIB HCS assay in PC-3 cells (Fig. 2). Continuous exposure of AR-TIF2 co-infected PC-3 cells to 100 nM DHT induced a rapid increase in the average fluorescent intensity of AR-RFP co-localized in TIF2-GFP-positive nucleoli that reached a maximum plateau after 15–20 min, was maintained through 30 min, and finally decreased gradually by ∼25% over the next 30 min (Fig. 2A). DHT exhibited an EC50 of 5.33 ± 1.0 nM for the induction of AR-TIF2 PPIs in PC-3 cells (Fig. 2B), which is consistent with the EC50 for the AR-TIF2 PPIB assay conducted in U-2 OS cells, and DHT EC50 values from other assay formats. 20 Based on these observations, we selected 100 nM DHT and 30 min exposure as the conditions for the maximum induction of AR-TIF2 PPIs in PC-3 cells. At densities between 1,000 and 5,000 co-infected PC-3 cells seeded into the wells of 384-well plates, the dynamic range (S:B ratio) of the DHT-induced AR-TIF2 PPI assay signal window increased as more cells were added, but it remained constant at approximately fourfold at cell seeding densities between 5,000 and 10,000 per well (Fig. 2C). At PC-3 seeding densities <5,000, the dynamic range of the AR-TIF2 PPIB assay increases with cell number, because the number of AR-TIF2 co-infected cells captured in the 3 × 20 × images is limited by both the seeding density and the 50% AR-TIF2 rAV co-infection rate. To reduce the cell culture burden and maintain a robust and reproducible assay signal window, we selected a 384-well plate seeding density of 6,000 co-infected PC-3 cells per well for the AR-TIF2 PPIB HCS assay. In comparison, the optimal 384-well cell seeding density for the assay performed in U-2 OS cells was only 2,500 cells per well. 20 The AR-TIF2 PPI responses in un-stimulated and DHT-treated PC-3 cells were unaltered at DMSO concentrations ≤0.625% (Fig. 2D). However, at DMSO concentrations ≥1.25%, the AR-TIF2 PPI responses of un-stimulated PC-3 cells increased in a DMSO-dependent manner; at ≥5% DMSO, the DHT-induced AR-TIF2 PPI response decreased dramatically (Fig. 2D). Based on these data, we selected DMSO concentrations ≤0.5% as the maximum for the PC-3 cell AR-TIF2 PPIB assay.

AR-TIF2 PPIB HCS assay development in PC-3 cells.
Validation of the AR-TIF2 PPIB HCS Assay in PC-3 CaP Cells
To investigate whether the optimized PC-3 AR-TIF2 PPIB HCS assay would identify known modulators of AR signaling and previously identified AR-TIF2 PPI hits, we screened a test set of compounds. The set included the Hsp 90 inhibitor 17-allylaminogeldanamycin (17-AAG), flutamide and bicalutamide, two anti-androgens approved for the treatment of CaP,
7,47
and 15 AR-TIF2 PPI hits from the LOPAC set previously identified in the assay performed in U-2 OS cells (Fig. 3 and Table 2).
20
Representative color composite images of the 0.5% DMSO minimum (min) and 0.5% DMSO +100 nM DHT maximum (max) plate controls illustrate the diffuse cytoplasmic AR-RFP distribution and condensed punctate nucleolar AR-RFP PPI phenotypes of the minimum and maximum controls, respectively (Fig. 3A). The mean average inner intensity of AR-RFP within TIF2-GFP-positive nucleoli output of the TE image analysis module was used to quantify AR-TIF2 PPIs,
20
and maximum and minimum plate controls provided a robust and reproducible signal window in half-plate (n = 192) experiments (Supplementary Fig. S1; Supplementary Data are available online at

Profiling LOPAC hits in the PC-3 CaP cell AR-TIF2 PPIB HCS assay.
IC50 Summary of AR Modulator and AR-TIF2 PPI LOPAC Hits in the PC-3 Cell AR-TIF2 PPIB Assay and Their % Inhibition in Three Counter-Screening Assays
To determine the IC50s of compounds that inhibited the formation of DHT-induced AR-TIF2 PPIs, PC-3 cells were pre-exposed to compounds for 3 h before treatment with 100 nM DHT for 30 min. The IC50 values represent the mean and SD (n = 3) of three independent concentration response assays, each of which was conducted in a 10-point dilution series with triplicate wells per concentration.
To determine the IC50s for compounds that disrupted pre-existing AR-TIF2 PPIs, PC-3 cells were treated with 100 nM DHT for 30 min and then exposed to compounds for an additional 3 h. The IC50 values represent the mean and SD (n = 3) of three independent concentration response assays, each of which was conducted in a 10-point dilution series with triplicate wells per concentration.
The % inhibition data for the AR-TIF2 PPI LOPAC hits in the p53-hDM2 PPIB assay were extracted by querying our HTS database. The p53-hDM2 PPIB HCS assay utilized the same PPI assay format and biosensor design but different protein interacting partners. 45,46
The % inhibition data for the AR-TIF2 PPI LOPAC hits in the AR-GFP nuclear localization assay were extracted by querying our HTS database. The AR-GFP nuclear localization HCS assay was designed to identify compounds that altered the sub-cellular distribution and/or expression of AR-GFP. 47
The % inhibition data for the AR-TIF2 PPI LOPAC hits in the Dex-induced GR nuclear translocation assay were extracted by querying our HTS database. The GR nuclear translocation assay was designed to identify compounds that inhibited the Dex-induced nuclear translocation of GR-GFP. 43,48
17-α-H-PG, 17-alpha-hydroxyprogesterone; 17-AAG, 17-allylaminogeldanamycin; Dex, dexamethasone; GR, glucocorticoid receptor; LOPAC, Library of Pharmacologically Active Compounds; NDA, no data available; NR, nuclear receptor; PPIB, protein–protein interaction biosensor; SD, standard deviation; TPCK, N-p-tosyl-L-phenylalanine chloromethyl ketone; ZPCK, N-carbobenzyloxy-L-phenylalanyl-chloromethyl ketone.
AR-TIF2 PPI Counter-Screening Assays
We employed the p53-hDM2 PPIB assay that utilizes the same assay format and biosensor design but different protein interacting partners as an assay interference and PPI selectivity counter-screen. 45,46 None of the 15 AR-TIF2 PPI LOPAC hits was active in the p53-hDM2 PPIB assay, indicating that they are unlikely to interfere with either the biosensor assay format or to be non-selective PPI inhibitors (Table 2). In an HCS assay designed to identify compounds that altered the sub-cellular distribution and/or expression of AR-GFP, 48 the AR-TIF2 PPI LOPAC hits either enhanced the nuclear localization of AR-GFP or were inactive (Table 2). The AR-GFP data suggest that some of the AR-TIF2 PPI LOPAC hits may be partial AR agonists, and, therefore, would not be expected to inhibit or disrupt AR-TIF2 PPIs. To evaluate the NR selectivity of the AR-TIF2 PPI LOPAC hits, we tested their activity in a dexamethasone (Dex)-induced glucocorticoid receptor (GR) nuclear translocation assay (Table 2). 43,49 Although none of the steroid NR AR-TIF2 LOPAC hits inhibited Dex-induced GR nuclear translocation, the five non-steroid hits inhibited GR trafficking in a concentration-dependent manner (Table 2). 43,49
Do AR-TIF2 PPI Hits Inhibit DHT-Induced PSA-Promoter-Driven Luciferase Reporter Activity?
To confirm that AR-TIF2 PPI inhibitor/disruptor hits inhibit AR-TA, we examined their ability to inhibit the DHT-induced luciferase reporter activity of the PSA-6.1-LUC plasmid transiently transfected into the C4-2 and 22-Rv1 CRPC cell lines (Fig. 4 and Table 3). Exposure of the C4-2 and 22-Rv1 AR-positive cell lines transfected with the PSA-6.1-LUC plasmid to DHT produced a concentration-dependent increase in luciferase reporter activity with EC50s of 3.7 and 0.45 nM, respectively (Fig. 4A, E). In marked contrast, exposure of the PC-3 and DU-145 AR-negative cell lines transfected with the PSA-6.1-LUC plasmid to DHT produced no apparent increase in luciferase reporter activity above background (Fig. 4A, E). It is noteworthy that the un-induced background PSA-6.1-LUC luciferase reporter activity observed in transfected 22-Rv1 cells was much higher than in any of the other CaP cell lines (Fig. 4A, E). Pre-exposure to 17-AAG, bicalutamide and flutamide, inhibited DHT-induced PSA-6.1-LUC luciferase reporter activity in both C4-2 and 22-Rv1 cell lines in a concentration-dependent manner (Fig. 4B, F and Table 3). Similarly, pre-exposure to the 15 AR-TIF2 PPI LOPAC hits also inhibited DHT-induced PSA-6.1-LUC luciferase reporter activity in C4-2 and 22-Rv1 cell lines in a concentration-dependent manner (Fig. 4B, C, F, G and Table 3). Under these conditions, the steroid NR ligand AR-TIF2 PPI LOPAC hits exhibited no apparent cytotoxicity in either the C4-2 or 22-Rv1 cell lines (data not shown), indicating that they effectively blocked DHT-induced AR-TA (Fig. 4C, G and Table 3). In marked contrast, the five non-steroid ligand AR-TIF2 LOPAC hits exhibited some degree of concentration-dependent cytotoxicity in C4-2 and 22-Rv1 (Fig. 4D, H), which likely contributed to their apparent inhibition of AR-TA (Fig. 4B, F and Table 3).
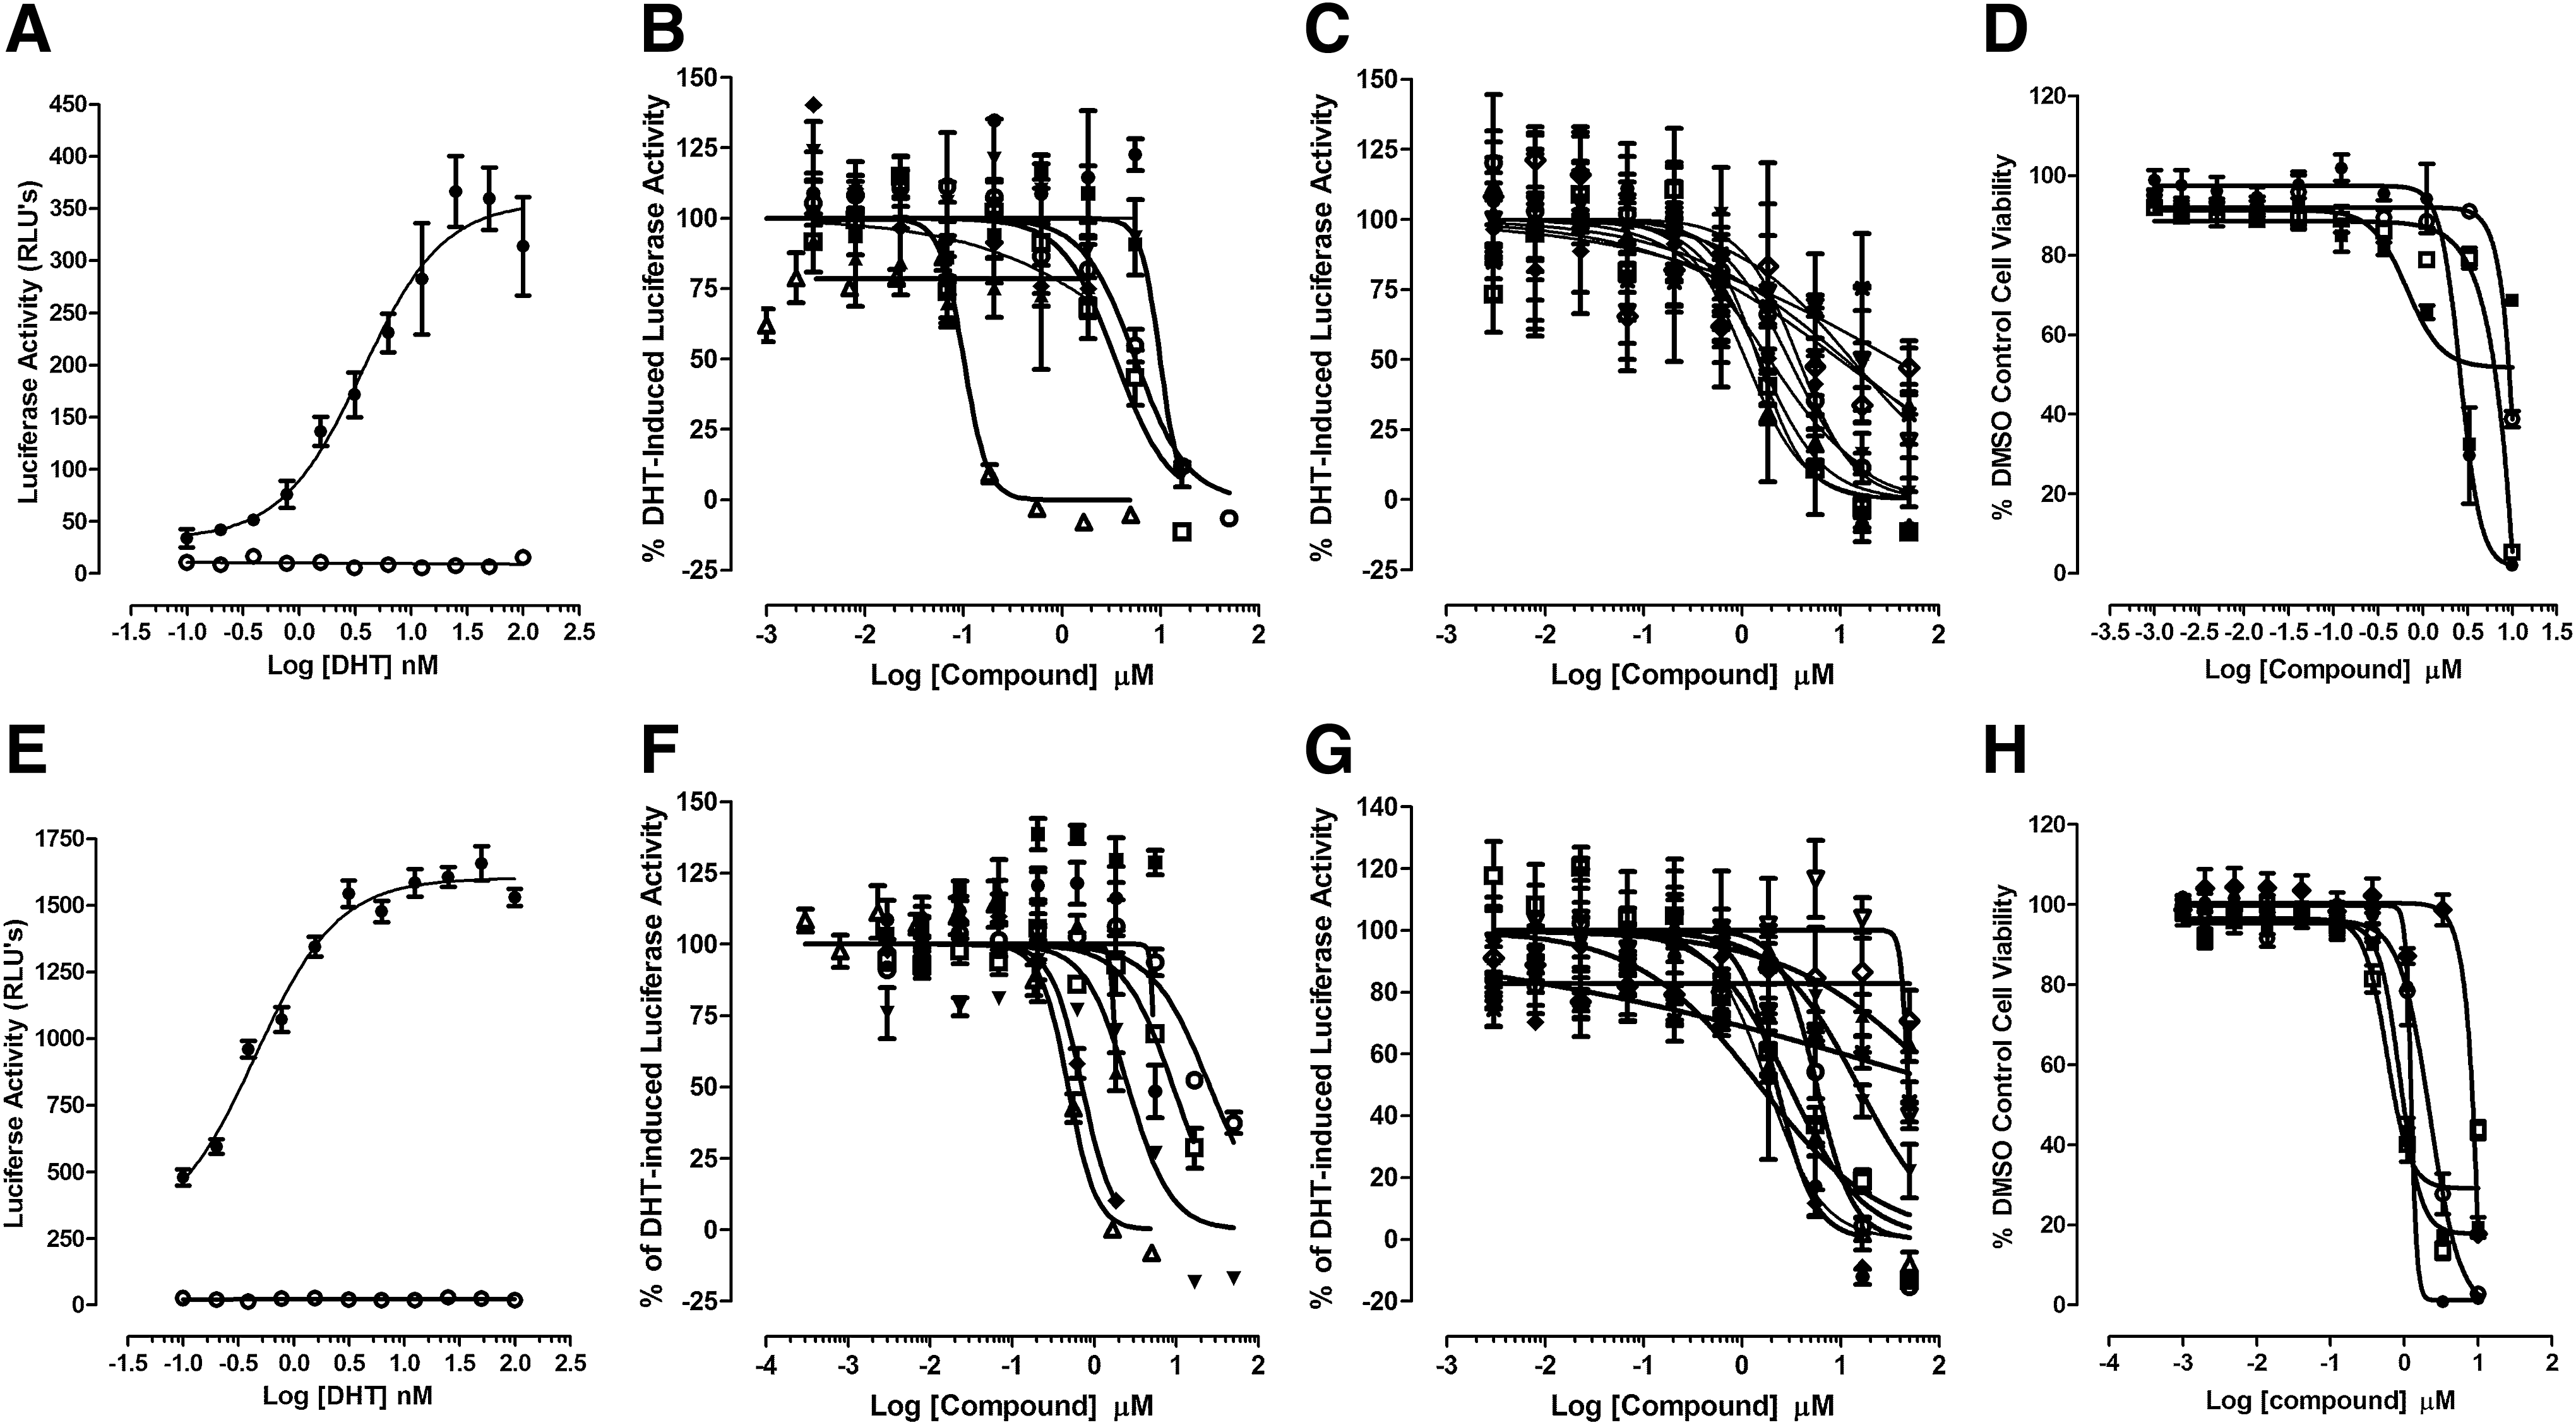
Concentration-dependent inhibition of DHT-induced PSA-6.1 luciferase reporter activity in CaP cell lines by AR-TIF2 PPI LOPAC hits. AR-negative, PC-3 and DU145, and AR-positive, C4-2 and 22RV-1, CaP cell lines were transiently bulk transfected with a 6:1 ratio of Fugene 6: PSA-6.1-LUC plasmid DNA (12 ng/well), then seeded into assay plates at a density of 6,000 cell per well, and finally incubated overnight at 5% CO2, 95% humidity, and 37°C.
PSA-6.1 Luciferase Reporter Assay IC50 Summary for the AR-TIF2 PPI LOPAC Hits
To confirm that AR-TIF2 PPI inhibitor/disruptor hits inhibited AR transcriptional activity, we examined their ability to inhibit the DHT-induced luciferase reporter activity of the PSA-6.1-LUC plasmid transiently transfected into the C4-2 CRPC cell line.
To confirm that AR-TIF2 PPI inhibitor/disruptor hits inhibited AR transcriptional activity, we examined their ability to inhibit the DHT-induced luciferase reporter activity of the PSA-6.1-LUC plasmid transiently transfected into the 22-Rv1 CRPC cell line.
To determine the IC50s of compounds that inhibited the DHT-induced PSA-6.1 luciferase reporter activity in transiently transfected C4-2 or 22-Rv1 CRPC cell lines, cells were pre-exposed to compounds for 3 h before treatment with 50 nM DHT overnight. The IC50 values represent the mean and SD (n = 3) of three independent concentration response assays, each of which was conducted in a 10-point dilution series with triplicate wells per concentration.
2-MOED, 2-methoxyestradiol; 4-P-3-FOCN, 4-phenyl-3-furoxancarbonitrile; 17-α-H-PG, 17-alpha-hydroxyprogesterone; NA, not applicable; PSA, prostate specific antigen.
Do AR-TIF2 PPI Inhibitor/Disruptor Hits Antagonize H3-DHT Binding to the AR-LBD?
DHT binding to the AR-RFP biosensor in the cytoplasm of infected cells induces trafficking to and entry into the nucleus where the PPIs with the TIF2-GFP biosensor result in their co-localization within the nucleolus. 20 Since one potential mechanism of blocking the formation of DHT-induced AR-TIF2 PPIs would be to prevent DHT binding to the AR-LBD, we needed to develop a secondary assay to identify AR antagonists among the AR-TIF2 PPI hits (Fig. 5). His6-AR-LBD expression was induced in bacteria transformed with the pET28a-His6-AR-LBD expression plasmid by IPTG treatment, and partially purified His6-AR-LBD was isolated from bacterial cell lysates by Ni2+-resin affinity chromatography. Bacterial cell lysates and fractions from the affinity purification procedure were separated on 12% SDS-PAGE gels that were, subsequently, stained with Coomassie blue (Fig. 5A) or transferred to nitrocellulose western blots that were then probed with anti-His6 and anti-AR antibodies to confirm the identity of the His6-AR-LBD (Fig. 5B, C). Imidazole fractions eluted from the Ni2+-resin affinity column were enriched for a 37 kDa protein that was recognized by the both the anti-His6 and anti-AR antibodies (Fig. 5A–C). To determine the optimal amount of His6-AR-LBD required for the H3-DHT radioligand binding assay, the indicated protein amounts of the pooled and dialyzed His6-AR-LBD imidazole fractions were added to the wells of 96-well Cu2+-coated plates and incubated overnight at 4°C. Unbound protein was removed by aspiration; the plate was washed, incubated with blocking buffer, and washed; and 10 nM H3-DHT was added to the plate and incubated for 1 h at RT. The unbound H3-DHT was removed by aspiration and washing, micro-scintillation reagent was added to the wells, and the CPMs were captured on a TopCount scintillation counter (Fig. 5D). The bound H3-DHT CPMs increased linearly with increasing amounts of His6-AR-LBD added to the wells up to 10 μg/well, after which the CPMs did not increase further (Fig. 5D). We selected 5 μg/well His6-AR-LBD for all further assay development experiments and performed saturation binding experiments with increasing concentrations of H3-DHT (Fig. 5E). Non-specific binding was determined in wells that were incubated overnight with 1 mg/mL BSA in PBS instead of His6-AR-LBD (Fig. 5E). Based on the saturation binding of H3-DHT to 5 μg/well of His6-AR-LBD, we selected 10 nM H3-DHT as the optimal radiolabel concentration for displacement-binding experiments (Fig. 5F). The addition of increasing concentrations of unlabeled DHT competitively displaced the binding of H3-DHT to His6-AR-LBD (Fig. 5F). The apparent KD for H3-DHT binding to His6-AR-LBD was 3.68 nM, and the IC50 for displacement binding by unlabeled DHT was 0.058 nM (Fig. 5E, F). In competitive displacement-binding experiments, the anti-androgens bicalutamide and flutamide exhibited IC50s of 5.2 ± 1.2 μM and 49.2 ± 18.2 μM, respectively, for H3-DHT binding to His6-AR-LBD; whereas the Hsp 90 inhibitor 17-AAG failed to inhibit binding at ≤50 μM (Table 4). All of the steroid NR ligand AR-TIF2 PPI LOPAC hits competitively displaced H3-DHT binding to His6-AR-LBD (Fig. 6A–C), with IC50s in the sub-μM to 40 μM range (Table 4). Mifepristone was the most potent AR antagonist with an IC50 of 0.84 ± 0.72 μM, whereas estrone was the least potent AR antagonist with an IC50 of 36.7 ± 10.5 μM (Fig 6A, C and Table 4).
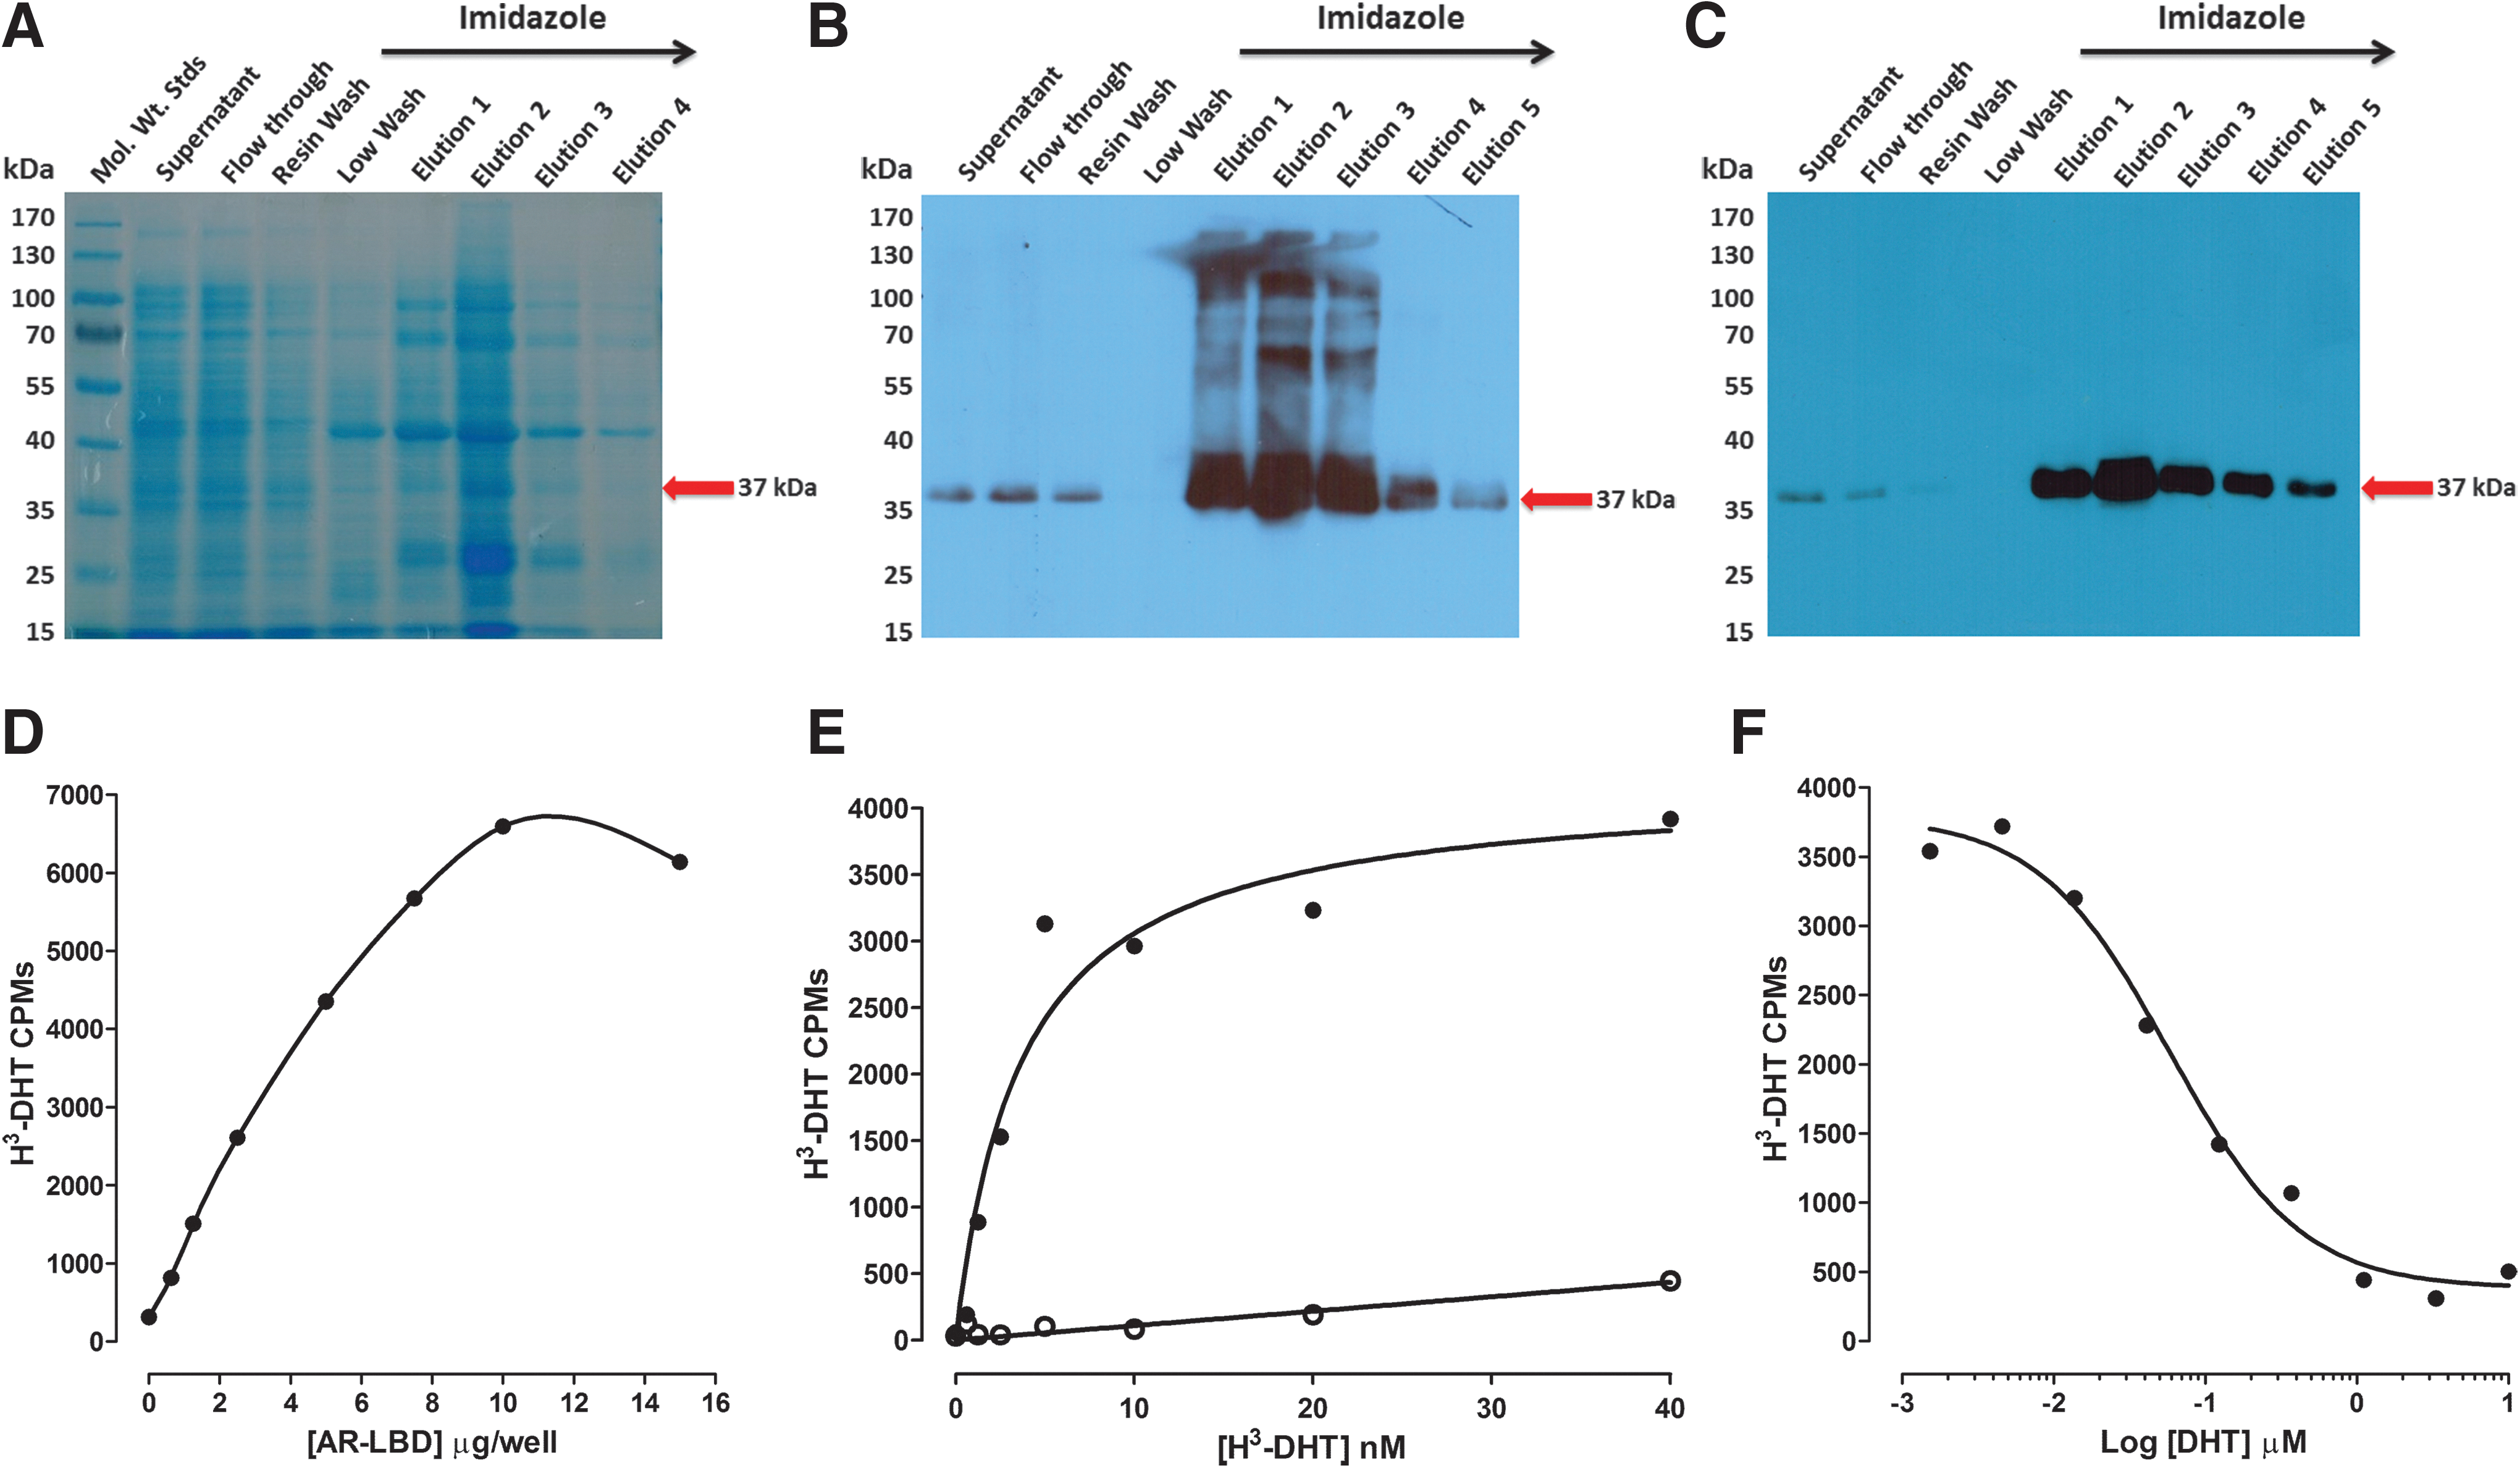
Recombinant His6-AR-LBD expression, purification, and H3-DHT-binding assay development.

Competitive displacement binding of H3-DHT to His6-AR-LBD for the AR-TIF2 PPI LOPAC hits. Five micrograms of His6-AR-LBD protein was added to the wells of 96-well copper-coated plates and allowed to bind overnight at 4°C. Unbound protein was removed by aspiration; the plate was washed 3× with PBS-Tween 20 buffer and blocked for 1 h with 1 mg/mL BSA in PBS-Tween 20. After 3× washes with PBS-Tween 20 buffer, 10 nM H3-DHT was added to the wells of the plate in the presence or absence of the indicated concentrations of LOPAC AR-TIF2 PPI inhibitor hits and incubated at RT for 1 h. Unbound H3-DHT was removed by aspiration and washing, micro-scintillation reagent was added to the wells, and the CPMs were captured on a TopCount NXT microtiter β-counter. The data from triplicate wells (n = 3) were fit to a log inhibitor versus normalized response displacement-binding model Y = 100/(1 + 10^[(X − LogIC50)]) by using the GraphPad PRISM software. Representative data from one of three independent experiments are presented.
IC50 Summary of the AR-TIF2 PPI LOPAC Hits in AR-LBD H3-DHT Competitive Displacement-Binding Assays
To determine the ability of AR-TIF2 PPI LOPAC hit compounds to inhibit the binding of H3-DHT to recombinant AR-LBD and to measure their IC50s in competitive displacement-binding assays, 5 μg of recombinant His-AR-LBD was pre-bound to Cu2+-coated plates and then co-incubated with 10 nM H3-DHT plus test compounds for 1 h before unbound radiolabel was removed by washing and the remaining bound H3-DHT CPMs were captured on a Topcount scintillation counter.
The IC50 values represent the mean and SD (n = 3 or n = 4) of three or four independent concentration response assays, each of which was conducted in a 10-point dilution series with singlicate wells per concentration.
CPM, counts per minute; LBD, ligand-binding domain; N/A, not applicable.
Do AR-TIF2 PPI Inhibitor/Disruptor Hits Inhibit CaP Cell Line Growth in an AR-Dependent Manner?
We would anticipate that AR-TIF2 PPI inhibitors/disruptors would be more effective at inhibiting the growth of CaP cell lines that express AR than those that do not express AR. To test this hypothesis, we developed and implemented CTG growth inhibition assays in five CaP cell lines: LnCaP, C4-2, and 22-Rv1 cells that express AR, and PC-3 and DU-145 that do not express AR (Fig. 7 and Table 5). The CTG RLU signals for all five CaP cells lines were linear with respect to the number of viable cells seeded into the wells of 384-well assay plates (Fig. 7A). When seeded into 384-well assay plates at 1,000 cells per well, each of the five CaP cell lines proliferated exponentially throughout the 96 h assay period, although the doubling times for each of the five CaP cell lines were quite different: LnCaP–37 h, C4-2–34.5 h, 22-Rv1–29.4 h, PC-3–31.3 h, and DU-145–30.2 h (Fig. 7B). Four of the 10 steroid NR ligand AR-TIF2 PPI LOPAC hits failed to inhibit the growth of any of the CaP cells lines at ≤50 μM (estrone, cortexelone, 17-α-H-PG, and nilutamide) and of the others, only 2-methoxyestradiol (2-MOED) inhibited the growth of all five CaP cell lines (Fig. 7C and Table 5). None of the steroid NR ligand AR-TIF2 PPI LOPAC hits differentially inhibited the growth of AR-positive CaP cell lines more than AR-negative CaP cell lines. Although the non-steroid AR-TIF2 PPI LOPAC hits were more potent and inhibited the growth of all five CaP cell lines in a concentration-dependent manner (Fig. 7D–H), they were equally effective at inhibiting the growth of AR-positive and AR-negative CaP cell lines (Table 5). Therefore, none of the AR-TIF2 PPI LOPAC hits exhibited the anticipated differential growth inhibition activity in CaP cell lines expressing AR relative to those that do not express AR.

Concentration-dependent inhibition of CaP cell line growth by selected AR-TIF2 PPI LOPAC hits.
Growth Inhibition (GI50) Summary of the AR-TIF2 PPI LOPAC Hits in Androgen Receptor-Positive and -Negative Prostate Cancer Cell Lines
To determine the growth inhibition 50 values (GI50s) of the AR-TIF2 PPI LOPAC hits compounds in AR-positive (LnCaP, C4-2, & 22-Rv1) and AR-negative (PC-3 & DU-145) CaP cell lines, each cell line was harvested, counted, and seeded at 1,000 cells per well into two 384-well assay plates on day 1: a time zero (T0) and a time 72 h (T72) plate. After overnight culture at 37°C, 5% CO2, and 95% humidity, CTG detection reagent was dispensed into the wells of the T0 assay plate and the luminescence signals (RLUs) were captured on the M5e microtiter plate reader. Also, on day 2, 5 μL of compounds diluted in SFM was transferred into the test wells of the T72 384-well assay plates that were then cultured in an incubator for an additional 72 h. Control wells received DMSO alone. On day 5, CTG detection reagent was dispensed into the wells of the T72 assay plate and the RLUs were captured on the M5e microtiter plate reader platform. The GI50 values represent the mean and SD (n = 3) of three independent concentration response assays, each of which was conducted in a 10-point dilution series with triplicate wells per concentration.
CaP, prostate cancer; CTG, CellTiter-Glo™; RLU, relative light unit; SFM, serum free media.
Discussion
The continued activation of AR transcription and elevated expression of AR and TIF2 observed in CaP recurrence and CRPC development support the discovery of small-molecule inhibitors of AR-TIF2 PPIs as a strategy for CRPC therapy. 5,12,13,20 –22,24,30 –32 SERMs and SARMs exhibit tissue-selective behaviors because of the different expression levels and cohorts of coregulatory proteins found in different tissues. 7,14,32,35,37 In this article, we reconfigured the AR-TIF2 PPIB assay in the PC-3 CaP cell line to see whether AR modulators and hits from an AR-TIF2 PPIB screen conducted in U-2 OS cells 20 would behave differently in the CaP cell background (Figs. 1 –3 and Tables 1 and 2). We did not observe any significant differences in the compound responses between the AR-TIF2 PPIB assay performed in osteosarcoma and CaP cells (Table 2). 20 However, since neither the number of compounds nor the number of cell lines used in our comparison were extensive, we cannot definitively conclude that the cell background does not influence AR-TIF2 PPIB compound responses. Compared with the AR-TIF2 PPIB assay performed in U-2 OS cells, 20 PC-3 cells required 10-fold more rAV for infection, the maximum co-infection rate achieved was only ∼50%, and we needed to seed 2.4-fold more PC-3 cells per well in the 384-well assay plates. From a purely logistical standpoint therefore, the AR-TIF2 PPIB assay performed in U-2 OS cells would be more amenable to screening, because both the virus and cell culture demands are lower.
We have developed a testing paradigm designed to identify and prioritize the real AR-TIF2 PPI inhibitors in the hits from an AR-TIF2 PPIB HCS campaign (Fig. 8). The 15 AR-TIF2 PPIB LOPAC hits included 10 steroid family NR ligands and 5 non-steroid compounds with a variety of pharmacological actions, including chymotrypsin inhibition (ZPCK & TPCK), NFκB inhibition (Bay 11-7085), serotonin antagonism (pathenolide), and a nitric oxide donor (4-P-3-FOCN). 20 None of the AR-TIF2 PPI hits was active in a p53-hDM2 PPIB counter-screen that utilizes the same PPI assay format and biosensor design but different protein interacting partners (Table 2). 45,46 The AR-TIF2 PPI hits do not interfere with the PPIB assay format and are unlikely to be non-selective PPI inhibitors. The hits either enhanced the nuclear localization of AR-GFP 48 or were inactive (Table 2), suggesting that some hits are partial AR agonists and, therefore, would not be expected to inhibit or disrupt AR-TIF2 PPIs. Since none of the 10 steroid NR ligands inhibited Dex-induced GR nuclear translocation, 43,49 these AR-TIF2 PPI hits appear to be selective for AR over GR (Table 2). In contrast, the five non-steroid hits all inhibited the agonist-induced trafficking of GR to the nucleus (Table 2). 43,49 It was reassuring that all 15 AR-TIF2 PPI hits inhibited the DHT-induced PSA-6.1-LUC luciferase reporter activity in transiently transfected C4-2 and 22-Rv1 CRPC cell lines (Fig. 4 and Table 3). The much higher un-induced background PSA-6.1-LUC luciferase reporter activity observed in 22-Rv1 cells reflects the higher expression of the constitutively active AR-V7 splice variant in this cell line and its ligand-independent transcriptional activity. 50,51 Although the 10 steroid NR ligands blocked DHT-induced AR transcriptional activity without any apparent cytotoxicity, the 5 non-steroid hits exhibited cytotoxicity that likely contributed to the observed inhibition of AR-TA. The competitive displacement-binding assay revealed that all 10 steroid NR AR-TIF2 LOPAC hits antagonized H3-DHT binding to His6-AR-LBD, whereas the 5 non-steroid hits did not (Fig. 6 and Table 4). Finally, none of the 15 AR-TIF2 PPI LOPAC hits exhibited the anticipated differential growth inhibition activity in CaP cell lines expressing AR relative to those that do not express AR (Fig. 7 and Table 5).
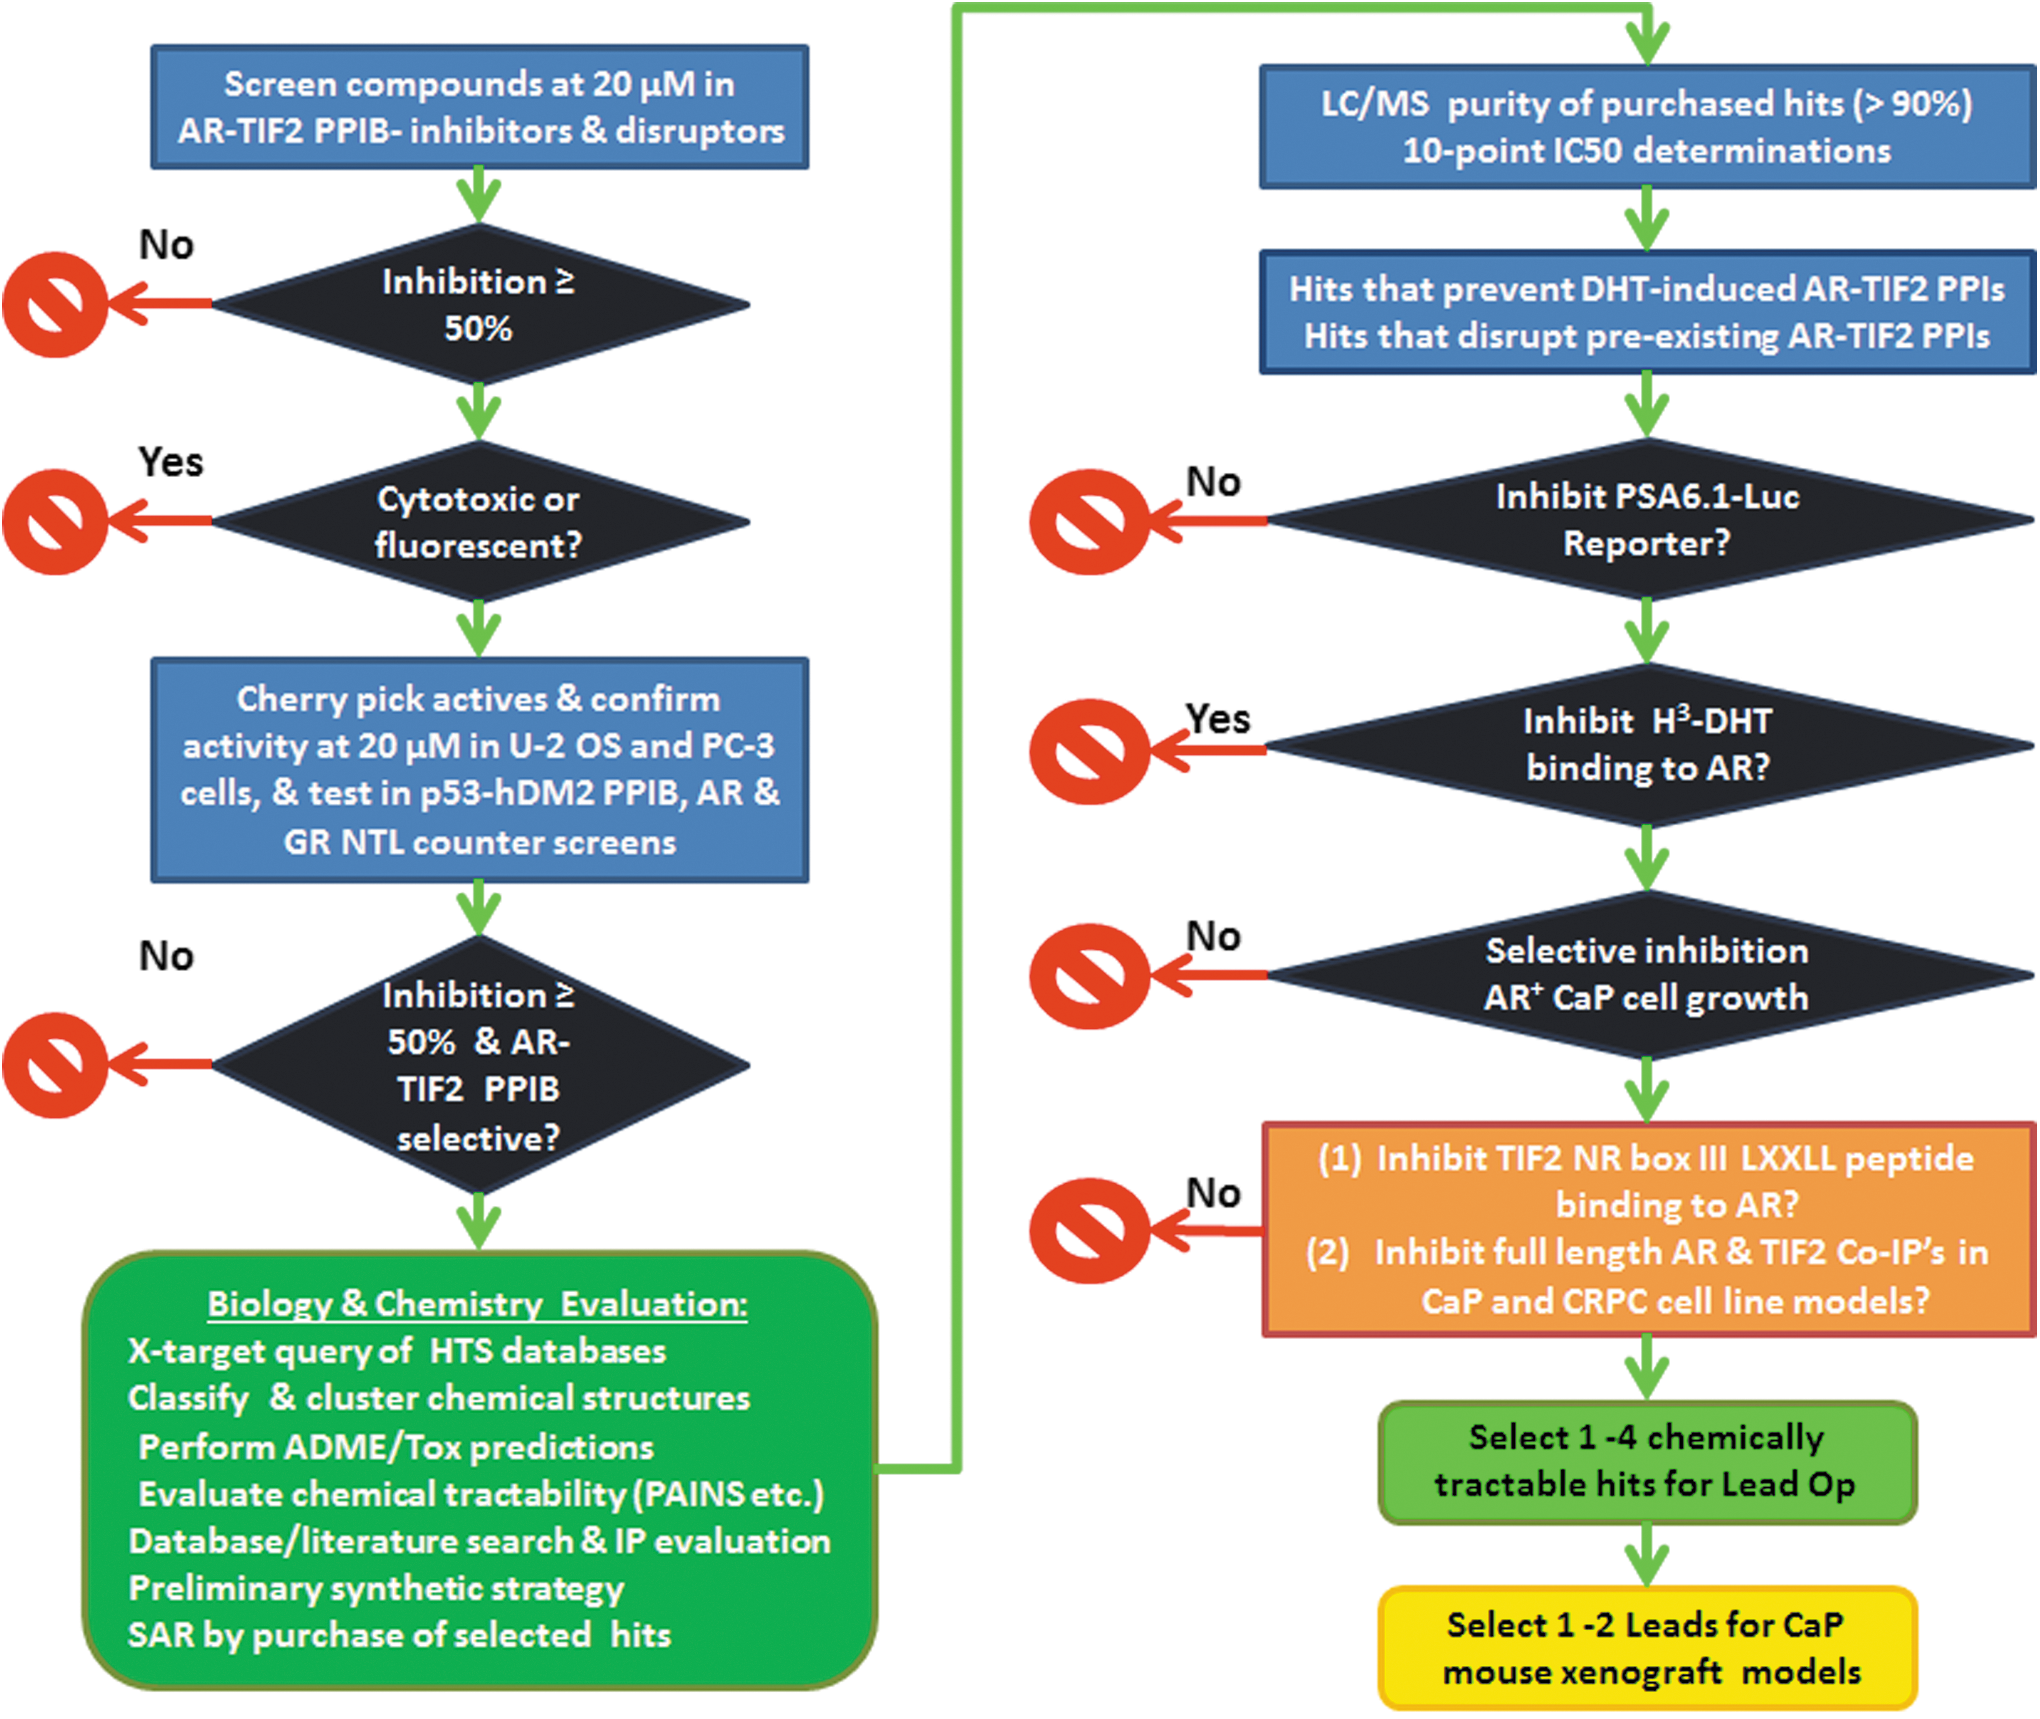
AR-TIF2 PPI inhibitor screening and hit prioritization paradigm. Compounds that inhibit or disrupt AR-TIF2 PPI's by ≥50% at 20 μM will be classified active, and we will utilize a z-score plate-based statistical scoring method to identify and eliminate compounds that behave as cytotoxic and/or fluorescent outliers. 20,42,43,45,46,48 We will cherry pick actives and confirm that they reproducibly inhibit or disrupt AR-TIF2 PPI's in both PC-3 and U-2 OS cell backgrounds. These assays will highlight hits that are selectively active in CaP cell backgrounds and might, therefore, be tissue selective. Confirmed actives will be tested in three counter-screens. The p53-hDM2 PPIB assay utilizes the same assay format and biosensor design but different protein interacting partners, and it provides both an assay interference and a PPI selectivity counter-screen. 45,46 Since the AR-TIF2 PPIB assay is dependent on a ligand-induced nuclear translocation, we will use two other counter-screens to investigate non-specific effects on NR trafficking and NR selectivity. The AR-GFP nuclear localization assay measures the distribution of AR-GFP between the nucleus and cytoplasm compartments in the C4-2 CRPC cell line, and the GR nuclear localization assay measures dexamethasone-induced GR-GFP translocation from the cytoplasm to the nucleus. 43,48,49 AR-TIF2 PPI hits that inhibit DHT-induced AR-GFP nuclear localization and/or Dex-induced GR-GFP nuclear translocation would be deprioritized as AR antagonists, inhibitors of heat shock protein-regulated NR folding, cytoplasmic dynein-mediated NR trafficking to the nucleus, or importin α/β-mediated NR entry through the nuclear pore complex. 43,48,49 AR-TIF2 hits that inhibit Dex-induced GR-GFP nuclear translocation assay would also be excluded as non-selective steroid NR modulators. To identify and eliminate hits with promiscuous bioactivity profiles, we will perform cross-target queries of the PubChem database and our internal HTS database. 39 –41,57,58 We will perform chemical classification and clustering of the remaining hits and apply computational filters (PAINS/REOS) to identify and eliminate nuisance compounds and to evaluate their drug-like properties. 39 –41,57,58 We will evaluate the ADME/Tox properties of the hits, their chemical tractability; perform database, patent, and literature searches to evaluate the intellectual property position; and devise a preliminary synthetic strategy for development. Finally, we will perform similarity and sub-structure searches of the core compound libraries to identify and select structurally related analogs to purchase for potency determinations and to assess the preliminary structure–activity relationship. We will confirm the identity and purity (>90%) of the purchased hits and analog samples by LC/MS and determine their potencies and efficacies in AR-TIF2 concentration response assays. We will review the AR-RFP distribution phenotype images of confirmed hits to distinguish between those that blocked AR translocation and those that blocked AR-TIF2 PPIs. To confirm that AR-TIF2 PPI hits inhibit AR-TA, we will test their ability to inhibit the DHT-induced luciferase reporter activity of the PSA-6.1-LUC plasmid transiently transfected into the CRPC cell lines, and hits that fail to inhibit AR-TA will be deprioritized. Since DHT binding to the AR-RFP biosensor is required to induce trafficking from the cytoplasm to the nucleus where the PPIs with the TIF2-GFP biosensor produces co-localization within the nucleolus, we will profile the hits in our H3-DHT radioligand AR binding assay and exclude compounds with AR antagonist activity. Since we anticipate that AR-TIF2 PPI inhibitors/disruptors would be more effective at inhibiting the growth of CaP cell lines that express AR than those that do not express AR, we will perform growth inhibition assays in three CaP cell lines that express AR and in two that do not. Only hits that selectively inhibit the growth of AR expressing CaP cell lines will be progressed. We are in the process of developing additional biochemical and cellular assays to delineate the mechanism of actions of our hits. We will deploy a biochemical AlphaScreen assay that measures the binding of TIF2 NR box III LXXLL peptides to His6-AR-LBD, to identify AR-TIF2 PPI hits that directly interfere with the binding interactions between the LXXLL motifs of TIF2 and AR. We will then use AR and TIF2 antibody-mediated co-IP pull-down assays performed in CaP and CRPC cell line models to confirm that AR-TIF2 PPI hits also inhibit or disrupt the PPIs between the native full-length AR and TIF2 proteins. In the future, it would be our intention to select 1–4 chemically tractable series for medicinal chemistry lead optimization based on their profiles in the testing scheme described earlier. We would then select 1–2 of the most promising AR-TIF2 PPI disruptor leads for in vivo pharmacokinetics and efficacy testing in established CaP mouse xenograft models. co-IP, co-immunoprecipitation; CRPC, castration-resistant CaP; Dex, dexamethasone; GR, glucocorticoid receptor; TA, transcriptional activation.
The 10 steroid NR ligand AR-TIF2 PPI LOPAC hits do not interfere with the PPIB assay format, are not non-selective PPI inhibitors, and appear to be selective for AR over GR. However, these compounds inhibit both DHT-induced AR-TIF2 PPIs and AR-TA, because they antagonize DHT-binding to AR, and they do not preferentially inhibit the growth of AR expressing CaP cell lines. Although novel AR antagonists identified in an AR-TIF2 PPIB HCS campaign could potentially be optimized and developed into new AATs, they would not be pursued as AR-TIF2 PPI inhibitors/disruptors. The five non-steroid AR-TIF2 PPI LOPAC hits also do not interfere with the PPIB assay format and are not non-selective PPI inhibitors, and in addition, they do not antagonize DHT-binding to AR. Although the apparent cytotoxicity of the five non-steroid hits contributed to the observed inhibition of AR-TA, they did not preferentially inhibit the growth of AR expressing CaP cell lines. Based on the cytoplasmic AR-RFP distribution phenotypes of the five non-steroid hits (Supplementary Fig. S2B) and their inhibition of Dex-induced GR-GFP nuclear translocation, it is possible that these compounds interfere with some common component of NR activation and trafficking. 43,49 Among the possibilities are the following: The Hsp 90 and Hsp 70 chaperones maintain both NRs in high-affinity structural conformations for ligand binding, both ligand-bound AR and GR are cargos of dynein-mediated retrograde trafficking along microtubules to the nucleus, and the importin-α/β adaptor system mediates entry through the nuclear pore complex for both NRs. 1 –4,43,47,49 Although novel compounds that inhibit nuclear trafficking identified in an AR-TIF2 PPIB HCS campaign might become useful probe molecules for cell biology, since they are not AR-TIF2 PPI inhibitors/disruptors, they would be deprioritized.
PPIs have enormous potential as targets for drug discovery, because they are obligatory for all cellular functions. 52 –56 Structural studies indicate that protein-binding interfaces contain discrete “hot spots” where a relatively small number of amino acids at the PPI interface contribute the majority of the binding energy, and that contact surfaces contain cavities, pockets, and grooves for small molecules to bind to and disrupt PPIs. 52,53,55,56 TIF2 is an AR coactivator implicated in the development and progression of CRPC. 5,21,28,29 Agonist-induced conformational changes to the AR-LBD create the activation function 2 (AF2) surface that binds to the LXXLL motifs of SRC/p160 coactivators. 1,2,25 –27 The AR-TIF2 PPIB assay recapitulates the ligand-induced translocation of AR from the cytoplasm into the nucleus where the PPIs between AR and TIF2 drive the accumulation and co-localization of AR-RFP into TIF2-GFP-positive nucleoli. 20 The assay has the specificity of binding assays, because the interacting components incorporate structural information about AR and TIF2 functional domains along with intracellular targeting sequences and fluorescent reporters, and it uses high-content imaging and analysis to quantify AR-TIF2 PPIs in cells. 20 We have successfully reconfigured the AR-TIF2 PPIB assay in the PC-3 CaP cell line and shown that it is capable of hit identification. Our counter-screens and secondary hit characterization assays allowed us to identify and deprioritize hits that inhibited/disrupted AR-TIF2 PPIs and AR-TA through antagonism of AR ligand binding or by non-specifically blocking NR trafficking. In the future, we plan to incorporate additional biochemical and cellular assays to delineate the mechanism of actions of our hits. We will deploy a biochemical AlphaScreen assay that measures the binding of TIF2 NR box III LXXLL peptides to His6-AR-LBD, to identify AR-TIF2 PPI hits that directly interfere with the binding interactions between the LXXLL motifs of TIF2 and AR. We will then use AR and TIF2 antibody-mediated co-immunoprecipitation pull-down assays performed in CaP and CRPC cell line models to confirm that AR-TIF2 PPI hits also inhibit or disrupt the PPIs between the native full-length AR and TIF2 proteins. Since AR-TIF2 PPI inhibitor/disruptor molecules act distally to AR ligand binding, they have the potential to modulate AR-TA in a cell-specific manner that is distinct from existing anti-androgen drugs, and to overcome the development of resistance to AR antagonism. We have screened a large and diverse library of 143,000 compounds in the AR-TIF2 PPI HCS assay and applied our counter-screens and secondary assays to characterize the hits (manuscript in preparation). We expect that the AR-TIF2 PPI HCS campaign will result in the discovery of PPI inhibitor/disruptor hits that have the potential to be developed into novel therapeutics for CaP and CRPC.
Footnotes
Acknowledgments
The studies reported here were funded by grant support from the National Institutes of Health (NIH); R21NS073889 Johnston (PI) from the NINDS; and R01CA160423 and RO1CA183882 Johnston (PI) from the NCI.
Disclosure Statement
No competing financial interests exist.