




Abstract
Postchemotherapy cognitive impairment (PCCI) is commonly exhibited by cancer patients treated with a variety of chemotherapeutic agents, including the endocrine disruptor tamoxifen (TAM). The etiology of PCCI is poorly understood. Our goal was to develop high-throughput assay methods to test the effects of chemicals on neuronal function applicable to PCCI. Rat hippocampal neurons (RHNs) were plated in 96- or 384-well dishes and exposed to test compounds (forskolin [FSK], 17β-estradiol [ES]), TAM or fulvestrant [FUL], aka ICI 182,780) for 6–14 days. Kinetic Image Cytometry™ (KIC™) methods were developed to quantify spontaneously occurring intracellular calcium transients representing the activity of the neurons, and high-content analysis (HCA) methods were developed to quantify the expression, colocalization, and puncta formed by synaptic proteins (postsynaptic density protein-95 [PSD-95] and presynaptic protein Synapsin-1 [Syn-1]). As quantified by KIC, FSK increased the occurrence and synchronization of the calcium transients indicating stimulatory effects on RHN activity, whereas TAM had inhibitory effects. As quantified by HCA, FSK also increased PSD-95 puncta and PSD-95:Syn-1 colocalization, whereas ES increased the puncta of both PSD-95 and Syn-1 with little effect on colocalization. The estrogen receptor antagonist FUL also increased PSD-95 puncta. In contrast, TAM reduced Syn-1 and PSD-95:Syn-1 colocalization, consistent with its inhibitory effects on the calcium transients. Thus TAM reduced activity and synapse formation by the RHNs, which may relate to the ability of this agent to cause PCCI. The results illustrate that KIC and HCA can be used to quantify neurotoxic and neuroprotective effects of chemicals in RHNs to investigate mechanisms and potential therapeutics for PCCI.
Introduction
Chemotherapeutic agents (e.g., fluorouracil, epirubicin, cyclophosphamide, adriamycin, and cisplatin, used alone or in cycles and combinations—CHEMO) and endocrine disruptors (EDs, e.g., tamoxifen [TAM], an inhibitor of the estrogen receptor, and aromatase inhibitors, e.g., letrozole) are cytotoxic or growth inhibitory to tumor cells. Unfortunately, CHEMO and EDs cause impaired cognition (postchemotherapy cognitive impairment [PCCI]) by affecting neurons of the central nervous system (CNS). PCCI is very common among breast cancer survivors, with a prevalence of up to 75% 1 and ∼4.5 million people in the United States currently suffer from PCCI. 2 PCCI manifests as reductions in visual memory, word fluency, visuospatial ability, verbal memory, processing speed, and executive function, and the degree of impairment can be substantial. For example, TAM-treated breast cancer survivors displayed a 21.5% reduction in performance in a word fluency test, versus healthy, age-matched, control subjects. 3 In a longitudinal study, with cognition evaluated after 5 years of adjuvant therapy with TAM or letrozole, both groups had lower scores than healthy controls, with patients who received TAM exhibiting greater impairment than those that received letrozole 4 ; furthermore, cognition improved after cessation of treatment. 5 Similar impaired cognition occurs in postmenopausal women treated with TAM. 6 –9
Cognition depends upon the formation of neuronal networks, in which synapses play key roles in establishing the routes, frequency, and strength of information flow. 10 Neuroplasticity, in which neural circuits form from neuronal progenitor cells through neurite extension, axonal sprouting, dendritic remodeling, and synaptogenesis, is a function of the healthy brain, particularly in the hippocampus. 11,12 17β-estradiol (ES), the predominant form of naturally occurring estrogen, is critically important for cognitive function, with both acute and long-term effects on neural circuitry, 13,14 and there is endogenous production of estrogens within the brain. 15 TAM and other EDs might induce PCCI by interfering with the effects of ES on brain neurons. 16 Consistent with this idea, pre- or neonatal exposure to TAM inhibits neurogenesis in the hippocampus. 17,18 In contrast, neuroprotective effects of TAM have been observed in certain model systems including cerebral ischemia, 19,20 spinal cord injury, 21 and brain injury, 22 and TAM protects cultured rat cortical neurons against toxicity induced by manganese. 23 Thus, TAM can have harmful or protective effects on neurons, depending on the context, and the mechanisms by which TAM induces PCCI remain to be elucidated.
TAM is thought of as a “mixed” estrogen effector, exhibiting antagonistic effects against ES in certain systems, but mimicking ES in others. 24 The situation is complex as there are several estrogen receptors, including nuclear receptor family members (e.g., ERα-66, ERα-36, ERβ1, ERβ2, and ERβ5) and G protein-coupled receptors (e.g., G protein-coupled estrogen receptor [GPER]). The different ES receptors are differentially activated by ligands and couple to distinct regulatory pathways. 25,26 An emerging hypothesis is that ES is a “master regulator” of bioenergetics, as ES regulates expression of mitochondrial proteins. 27 Thus TAM and EDs might elicit PCCI through inhibitory effects on ES-regulated neuronal metabolism. Furthermore, TAM is toxic to mitochondria in the liver, 28 and activates mitochondrial-based apoptosis in breast cancer cell lines. 29 –31 The variety of possible effects of TAM and EDs on neuronal function and the lack of understanding of PCCI emphasize the need for model systems in which compounds can be tested for neurotoxic or neuroprotective effects.
Hippocampal neurons feature extensively branched dendritic and axonal structures. Synapses, located on the dendrites (dendritic spines), receive input from other neurons, whereas action potentials, originating at sites proximal to the neuronal cell body, travel along the axonal structures to initiate communication with other neurons. Through these structures, each neuron links to thousands of other neurons in the hippocampus and other regions in the brain. In a recent study, the activity of hippocampal neurons was recorded in anesthetized mice utilizing simultaneous patch-clamp measurements of voltage and two-photon fluorescence microscopy of intracellular calcium.
32
Calcium transients were observed in the neurons because of excitatory stimuli from glutamate-releasing neurons, as glutamate activates postsynaptic N-methyl-
Rat hippocampal neurons (RHNs) can be isolated from embryonic rats and cultured to form networks that display spontaneous calcium transients. 37 Accordingly, RHNs have been widely used for a variety of purposes, including elucidating the relationships between intracellular calcium and membrane voltage, 38 control of activity by neurohormones and magnesium, 39 quantifying effects of β-amyloid protein on neuronal activity, 40 glutamate-mediated excitotoxicity, 41 and mechanisms of neuronal signal propagation. 42 Relating to PCCI, the CHEMO drug cisplatin reduces and alters dendritic spines and elicits apoptosis in RHNs. 43 Thus, RHNs are a relevant model system for investigating the potential mechanisms of PCCI and for identifying potential protective strategies.
In previous work, researchers at Vala Sciences Inc. developed the Kinetic Image Cytometer (KIC™), an automated digital microscope, which enables calcium transients that occur in excitable cells to be quantified on a cell-by-cell basis. KIC methods have been extensively developed for use with stem cell-derived cardiac myocytes. 44 –47 The calcium transients exhibited by cardiac myocytes are similar to those that occur in neurons, suggesting that KIC methods can be applied to neurons. Also, Vala researchers previously developed high-content analysis (HCA) methods (in which cells are exposed to test compounds, fixed, and observed for biomarkers through stains and immunolabeling, and imaged through digital fluorescence microscopy followed by automated image analysis) to quantify lipid droplets and associated proteins in adipocytes relevant to obesity and lipolysis. 48 –50 Notably, certain lipid droplets are similar in size to synaptic puncta, suggesting that these HCA methods can be adapted to quantification of neuronal synapses. Thus, the goals of this study were to develop KIC and HCA methods to quantify the effects of compounds such as TAM on the activity and characteristics of synapses in cultured RHNs, an in vitro neuronal model system relevant to PCCI.
Materials and Methods
Cell Culture
RHNs were purchased from either Lonza (Cat. #R-HI-501) or Cell Applications, Inc. (Cat. #R886N-10) and were cultured according to the manufacturer's recommendations. Cells were seeded onto either 96- or 384-well Greiner Bio-One μClear multiwell polystyrene dishes with optically clear well bottoms (Cat. #s 655096, 781091) coated with poly-
384-Well Rat Hippocampal Neuron Assay Plate Preparation
1. RHNs obtained from Lonza or Cell Applications, Inc. and prepared according to each manufacturer's instructions using provided maintenance medium and supplements. Greiner Bio-One 384-well plates are coated with poly-
2. Media changes performed using electronic multichannel pipette (Eppendorf) with aspiration speed setting on “1” (slowest speed) and dispensing speed set to “2.” Medium is prewarmed to 37°C in water bath.
3. Stock solutions prepared at 1,000 × concentration in DMSO. Preparation of 2 × treatment compounds achieved by freshly diluting stock 1:500 in medium; further 1:2 dilution occurs with 50% media change, effectively making 1 × [treatment] in medium. 1 × [compounds] used in our study: [ES] = 20, 100 nM; [FSK] = 5, 25, 50 μM; [TAM] = 0.2, 1, 2 μM; [FUL] = 16, 82 nM. 0.1% DMSO is vehicle control.
4. Total compound incubation time is 6–7 days after initial 7 days culture (total assay time: 13–14 days).
DMSO, dimethyl sulfoxide; ES, 17β-estradiol; FSK, forskolin; FUL, fulvestrant; HCA, high-content analysis; KIC™, Kinetic Image Cytometry™; RHNs, rat hippocampal neurons; TAM, tamoxifen.
Treatment Compounds
ES (Cat. #E2758), forskolin (FSK; Cat. #F6886), TAM (Cat. #T5648), and fulvestrant (FUL; Cat. #I4409) were obtained from Sigma Aldrich. All test compounds were prepared as 1,000 × stock solutions in dimethyl sulfoxide (DMSO), which were then freshly diluted in culture medium to make appropriate 1× treatments.
Calcium Imaging Reagents
The Fluo-4 No Wash Calcium Assay Kit (Cat. #F36205; Thermo Fisher) was used to image calcium transients. For live cell nuclear staining, 10 mg/mL Hoechst 33342 (Cat. #H3570; Thermo Fisher) was diluted to 0.2 μg/mL in Assay Buffer (a component of the Fluo-4 assay kit). A modified version of Tyrode's buffer (135 mM NaCl, 4.5 mM KCl, 2 mM CaCl2, 25 mM HEPES, and 10 mM
Kinetic Image Cytometry
A dye loading solution consisting of Fluo-4 (intracellular calcium indicator) was prepared according to the manufacturer's instructions containing 0.2 μg/mL Hoechst 33342 and 1 × water-soluble probenecid (100 × stock solution, Cat. #P36400; Thermo Fisher). The loading solution was warmed to 37°C and applied to the cells, which were incubated for 1 h at 37°C (Table 2). After incubation, wells were rinsed with modified Tyrode's buffer, which was then aspirated and replaced with fresh Tyrode's buffer for imaging. In earlier experiments to establish feasibility of performing KIC analysis of primary neurons, imaging was performed with an inverted Nikon TE2000 PFS-equipped epifluorescence microscope controlled by MetaMorph software (Molecular Devices, Sunnyvale, CA) and enclosed in a custom incubator controlled at 37°C and 5% CO2. Images were acquired with an Orca II (Hamamatsu, Japan) CCD camera. Later experiments were performed with Vala Science Inc.'s IC200-KIC at 37°C and 5% CO2 utilizing the built-in environmental chamber. Plates were mounted on the KIC for 20 min before initiation of imaging. For each experimental run, a single image was taken of the Hoechst 33342-labeled nuclei; the optics was then switched to the green fluorescence channel (to observe Fluo-4) and videos were collected at 3–30 frames per second (fps) for 10–30 s. A Nikon 20 × /0.75 NA VC objective was used for image acquisition.
Automated Neuronal Calcium KIC Assay Protocol
1. Complete aspiration of medium (and of solutions in steps 3 and 5) performed using manual pipetting mode at slowest speed setting on Eppendorf electronic multichannel pipette.
2. Dye loading solution (per mL): 250 μL Fluo-4 NW (Thermo Fisher Scientific), 750 μL Assay Buffer (1 × HBSS, 20 mM HEPES), 1 μL 1:50 Hoechst (trihydrochloride, trihydrate 10 mg/mL solution from Thermo Fisher Scientific) in Assay Buffer, 1 μL of 77 mg/mL water-soluble probenecid (Thermo Fisher Scientific).
4. Modified Tyrode's solution: 135 mM NaCl, 4.5 mM KCl, 2 mM CaCl2, 1 mM MgCl2, 25 mM HEPES, 10 mM
6. Test compounds are not added to imaging buffer because of investigation of chronic long-term effects of treatment on RHNs.
7. Nuclear reference image used to establish cell locations during analysis with CyteSeer™ software.
fps, frames per second; HBSS, Hanks' balanced salt solution.
Image Acquisition for HCA
Images were acquired with a Beckman Coulter IC100 using established methods. 50 Images were acquired with a Hamamatsu Orca ERG progressive scan 1344 × 1024 pixel cooled interline CCD camera, without binning, utilizing a 20 × 0.5 NA objective (resulting in 0.342 × 0.342 μm2/pixel). Images were stored as gray-scale bit mapped images (*.bmp).
Cell Labeling for HCA
RHNs seeded in 384-well dishes were exposed to test compounds, gently rinsed with Dulbecco's phosphate-buffered saline (DPBS) with calcium and magnesium, and fixed for 20 min at room temperature with 4% paraformaldehyde in PBS (see protocol in Table 3). After fixation, cells were blocked and permeabilized in blocking buffer (5% goat serum, 1% bovine serum albumin, and 0.2% fish gelatin in PBS) with 0.3% Triton X-100 for 1 h at 37°C or overnight at 4°C. A primary antibody cocktail consisting of rabbit polyclonal anti-Synapsin-1 (anti-Syn-1, Cat. #106103; Synaptic Systems) and mouse monoclonal antipostsynaptic density protein-95 (anti-PSD-95, Cat. #124011, clone 108E10; Synaptic Systems) both diluted 1:300 in blocking buffer was then applied to the cells and incubated for 1 h at 37°C or overnight at 4°C. The cells were then rinsed three times with DPBS without calcium and magnesium and incubated with a cocktail of secondary antibodies (goat anti-rabbit IgG-Alexa Fluor 568 [Cat. #A-11011; Thermo Fisher] and goat antimouse IgG-Alexa Fluor 488 [Cat. #A-11001; Thermo Fisher] diluted 1:1,000 in DPBS) for 1 h at 37°C. Next, the cells were rinsed three times with DPBS and stained for nuclei with 4′,6-diamidino-2-phenylindole (DAPI; 150 ng/mL DAPI in 10 mM Tris, 10 mM EDTA, 100 mM NaCl, and 0.02% NaN3). Plates were sealed with foil and left at room temperature for at least 20 min before imaging.
Automated Synaptic Marker Colocalization High-Content Analysis Assay Protocol
1. Complete aspiration of medium (and of solutions before and during rinses) performed using manual pipetting mode at slowest speed setting on Eppendorf electronic multichannel pipette.
2. Addition of reagents to wells performed in dispensing mode at speed setting “2.” Use of DPBS with Ca2+ and Mg2+ promotes adherence of cells to the substrate.
5. Blocking buffer: 5% goat serum, 1% bovine serum albumin, 0.2% fish gelatin in PBS. Alternatively, this step may be performed overnight at 4°C with similar results.
6. 1° Abs: rabbit polyclonal anti-Syn-1, mouse monoclonal anti-PSD-95 (both from Synaptic Systems). Alternatively, this step may be performed overnight at 4°C with similar results.
8. 2° Abs: goat antirabbit IgG-Alexa Fluor 568, goat antimouse IgG-Alexa Fluor 488 (both from Thermo Fisher Scientific).
10. DAPI solution: 150 ng/mL DAPI in 10 mM Tris, 10 mM EDTA, 100 mM NaCl, 0.02% NaN3. Seal plate with foil adhesive seals after application of DAPI. No wash step is required after DAPI staining; cells should incubate in DAPI for 20 min at room temperature before imaging. Plates may be stored at 4°C. Before imaging, warm to room temperature for at least 20 min.
11. For this study, a tiled matrix of 25 contiguous FOVs (5 across × 5 down) was acquired for analysis.
DAPI, 4′,6-diamidino-2-phenylindole; DPBS, Dulbecco's phosphate-buffered saline; Em, emissions; FITC, fluorescein isothiocyanate; PBS, phosphate-buffered saline; FOV, fields of view; PSD-95, postsynaptic density protein-95; Syn-1, Synapsin-1; TRITC, tetramethylrhodamine.
Digital Image Analysis
To develop methods for analyzing calcium transients in neurons, digital video clips of Fluo-4 fluorescence were loaded into Image J, soma regions were circled to create regions of interest (ROI, 78–151 per video), and the average fluorescence in each ROI for each frame was calculated using the “Multi-Measure” plug-in. The tabulated data were uploaded into Excel, and spreadsheets were developed to enable recognition of calcium transient upstrokes and quantification of synchronization. The peak identification and synchronization analysis methods were then incorporated into Vala's CyteSeer™ image analysis program to analyze videos collected with the KIC instrument.
To quantify synaptic structures through HCA, the Colocalization Algorithm, encoded within CyteSeer, was used. This algorithm, originally developed to quantify lipid droplets and lipid droplet-associated proteins in adipocytes, precisely identifies subcellular puncta and quantifies colocalization of biomarkers labeled in two distinct fluorescent channels through a variety of methods (e.g., Pearson's correlation coefficient [PCC], Manders' colocalization coefficients M1 and M2, and the Tanimoto coefficient). 48,49
Statistical Analysis
GraphPad Prism was used to test for statistically significant differences between control and experimental groups (ANOVA followed by Dunnett's test). Levels of statistical significance versus control are denoted by *, **, ***, and **** corresponding to P < 0.05, P < 0.01, P < 0.001, and P < 0.0001, respectively. Strictly standardized mean difference (SSMD) values 51 were also calculated between controls (DMSO) and certain experimental treatments to access assay robustness.
Results
Nonautomated Image Acquisition and Analysis
In an initial experiment to develop KIC methods to quantify neuronal activity, RHNs were plated in a 96-well dish and exposed to 20 nM ES (13 days), 100 nM ES (6 or 13 days), or 50 μM FSK (6 or 13 days). In a second experiment, the conditions tested were DMSO, 100 nM ES (7 or 14 days), or 50 μM FSK (7 or 14 days). For both experiments, two wells were used per condition, and two to three videos were collected per well (3 fps for 12 s). Since the purpose of these experiments was to test for long-term effects of the test compounds, rather than acute changes, neuronal activity was monitored in the absence of drugs.
Under these conditions, the RHNs exhibited spontaneous increases in Fluo-4 fluorescence that correspond to calcium transients (Fig. 1A, B). When images were observed at increased brightness and contrast, a complex network of cellular processes was revealed, representing dendrites and axonal structures (collectively referred to as neurites) that likely link the neurons into functional circuits (Fig. 1C). A single nucleus was centrally located with each cell body (soma) (Fig. 1D). The mononucleate characteristic of these neurons facilitates analysis as nuclei are easily recognized by automated image segmentation algorithms, which enables cell-by-cell tabulation of cellular responses and biomarker expression.
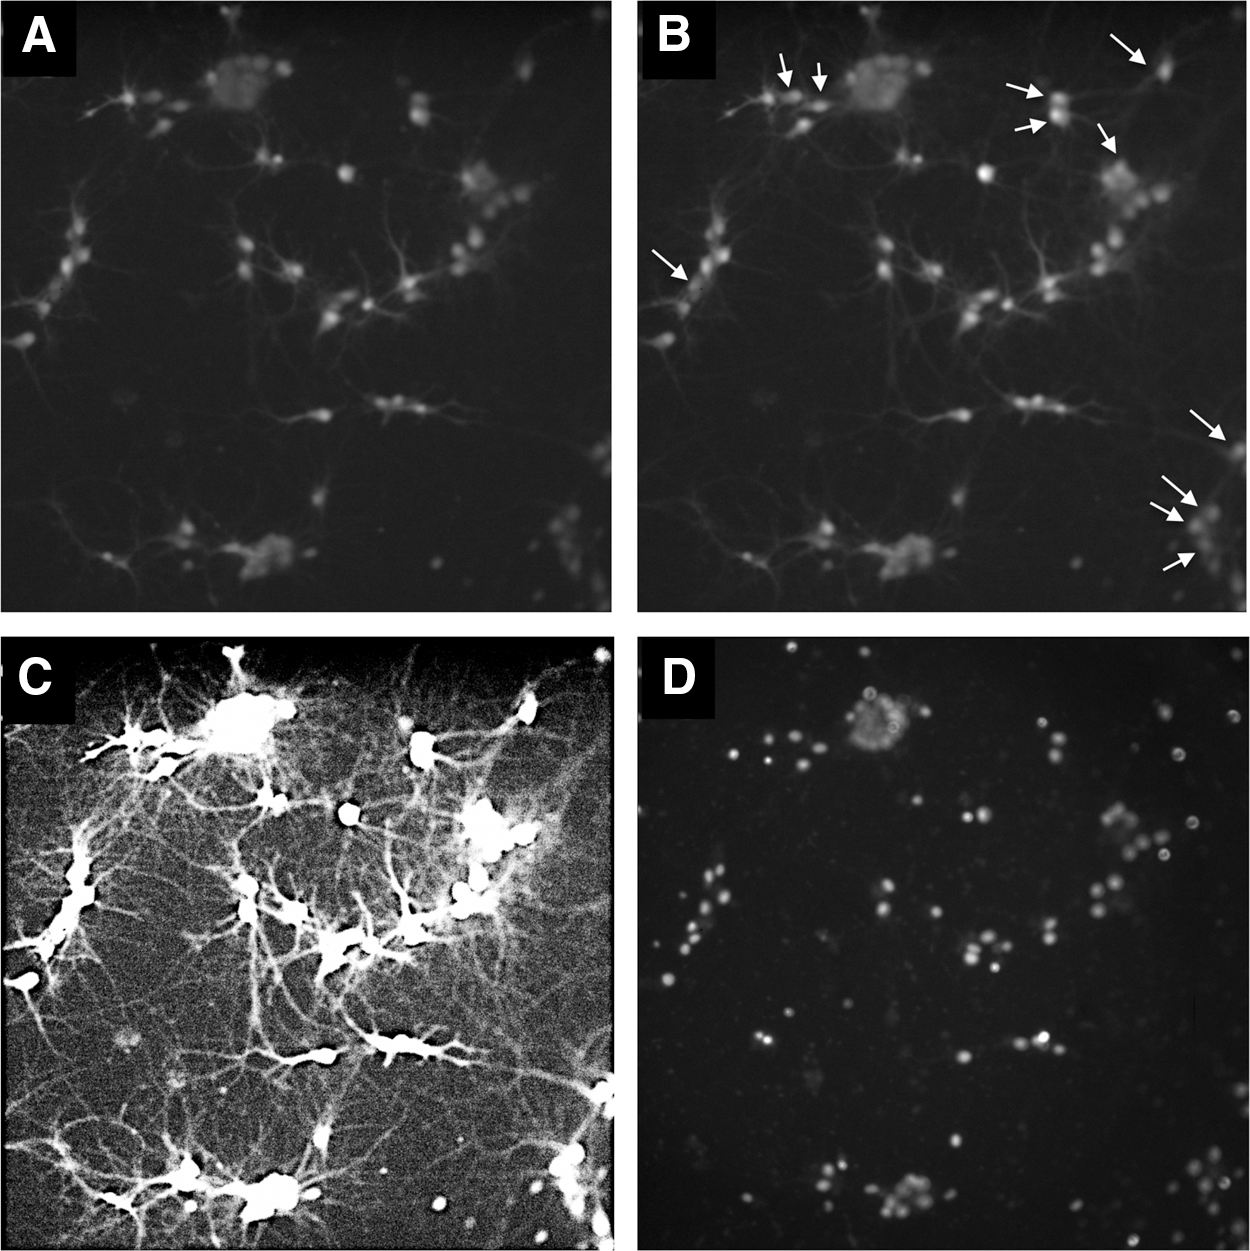
RHNs imaged for intracellular calcium with Fluo-4. RHNs cultured under control conditions were imaged at 3 fps for 12 s.
To quantify the frequency and characteristics of the calcium transients, the digital videos were imported into Image J, and the neuronal somas were analyzed for Fluo-4 fluorescence over the time course. Most calcium transients exhibited a rapid upstroke, with maximal values achieved in <1 s, followed by a slower decay phase lasting 1–2 s. Visual inspection of the digital videos and traces indicated that certain cells exhibited transients in an independent manner, whereas other cells exhibited synchronous calcium transients (Fig. 2). It was also apparent that neurons cultured in the presence of FSK exhibited more robust, more synchronized, calcium transients.
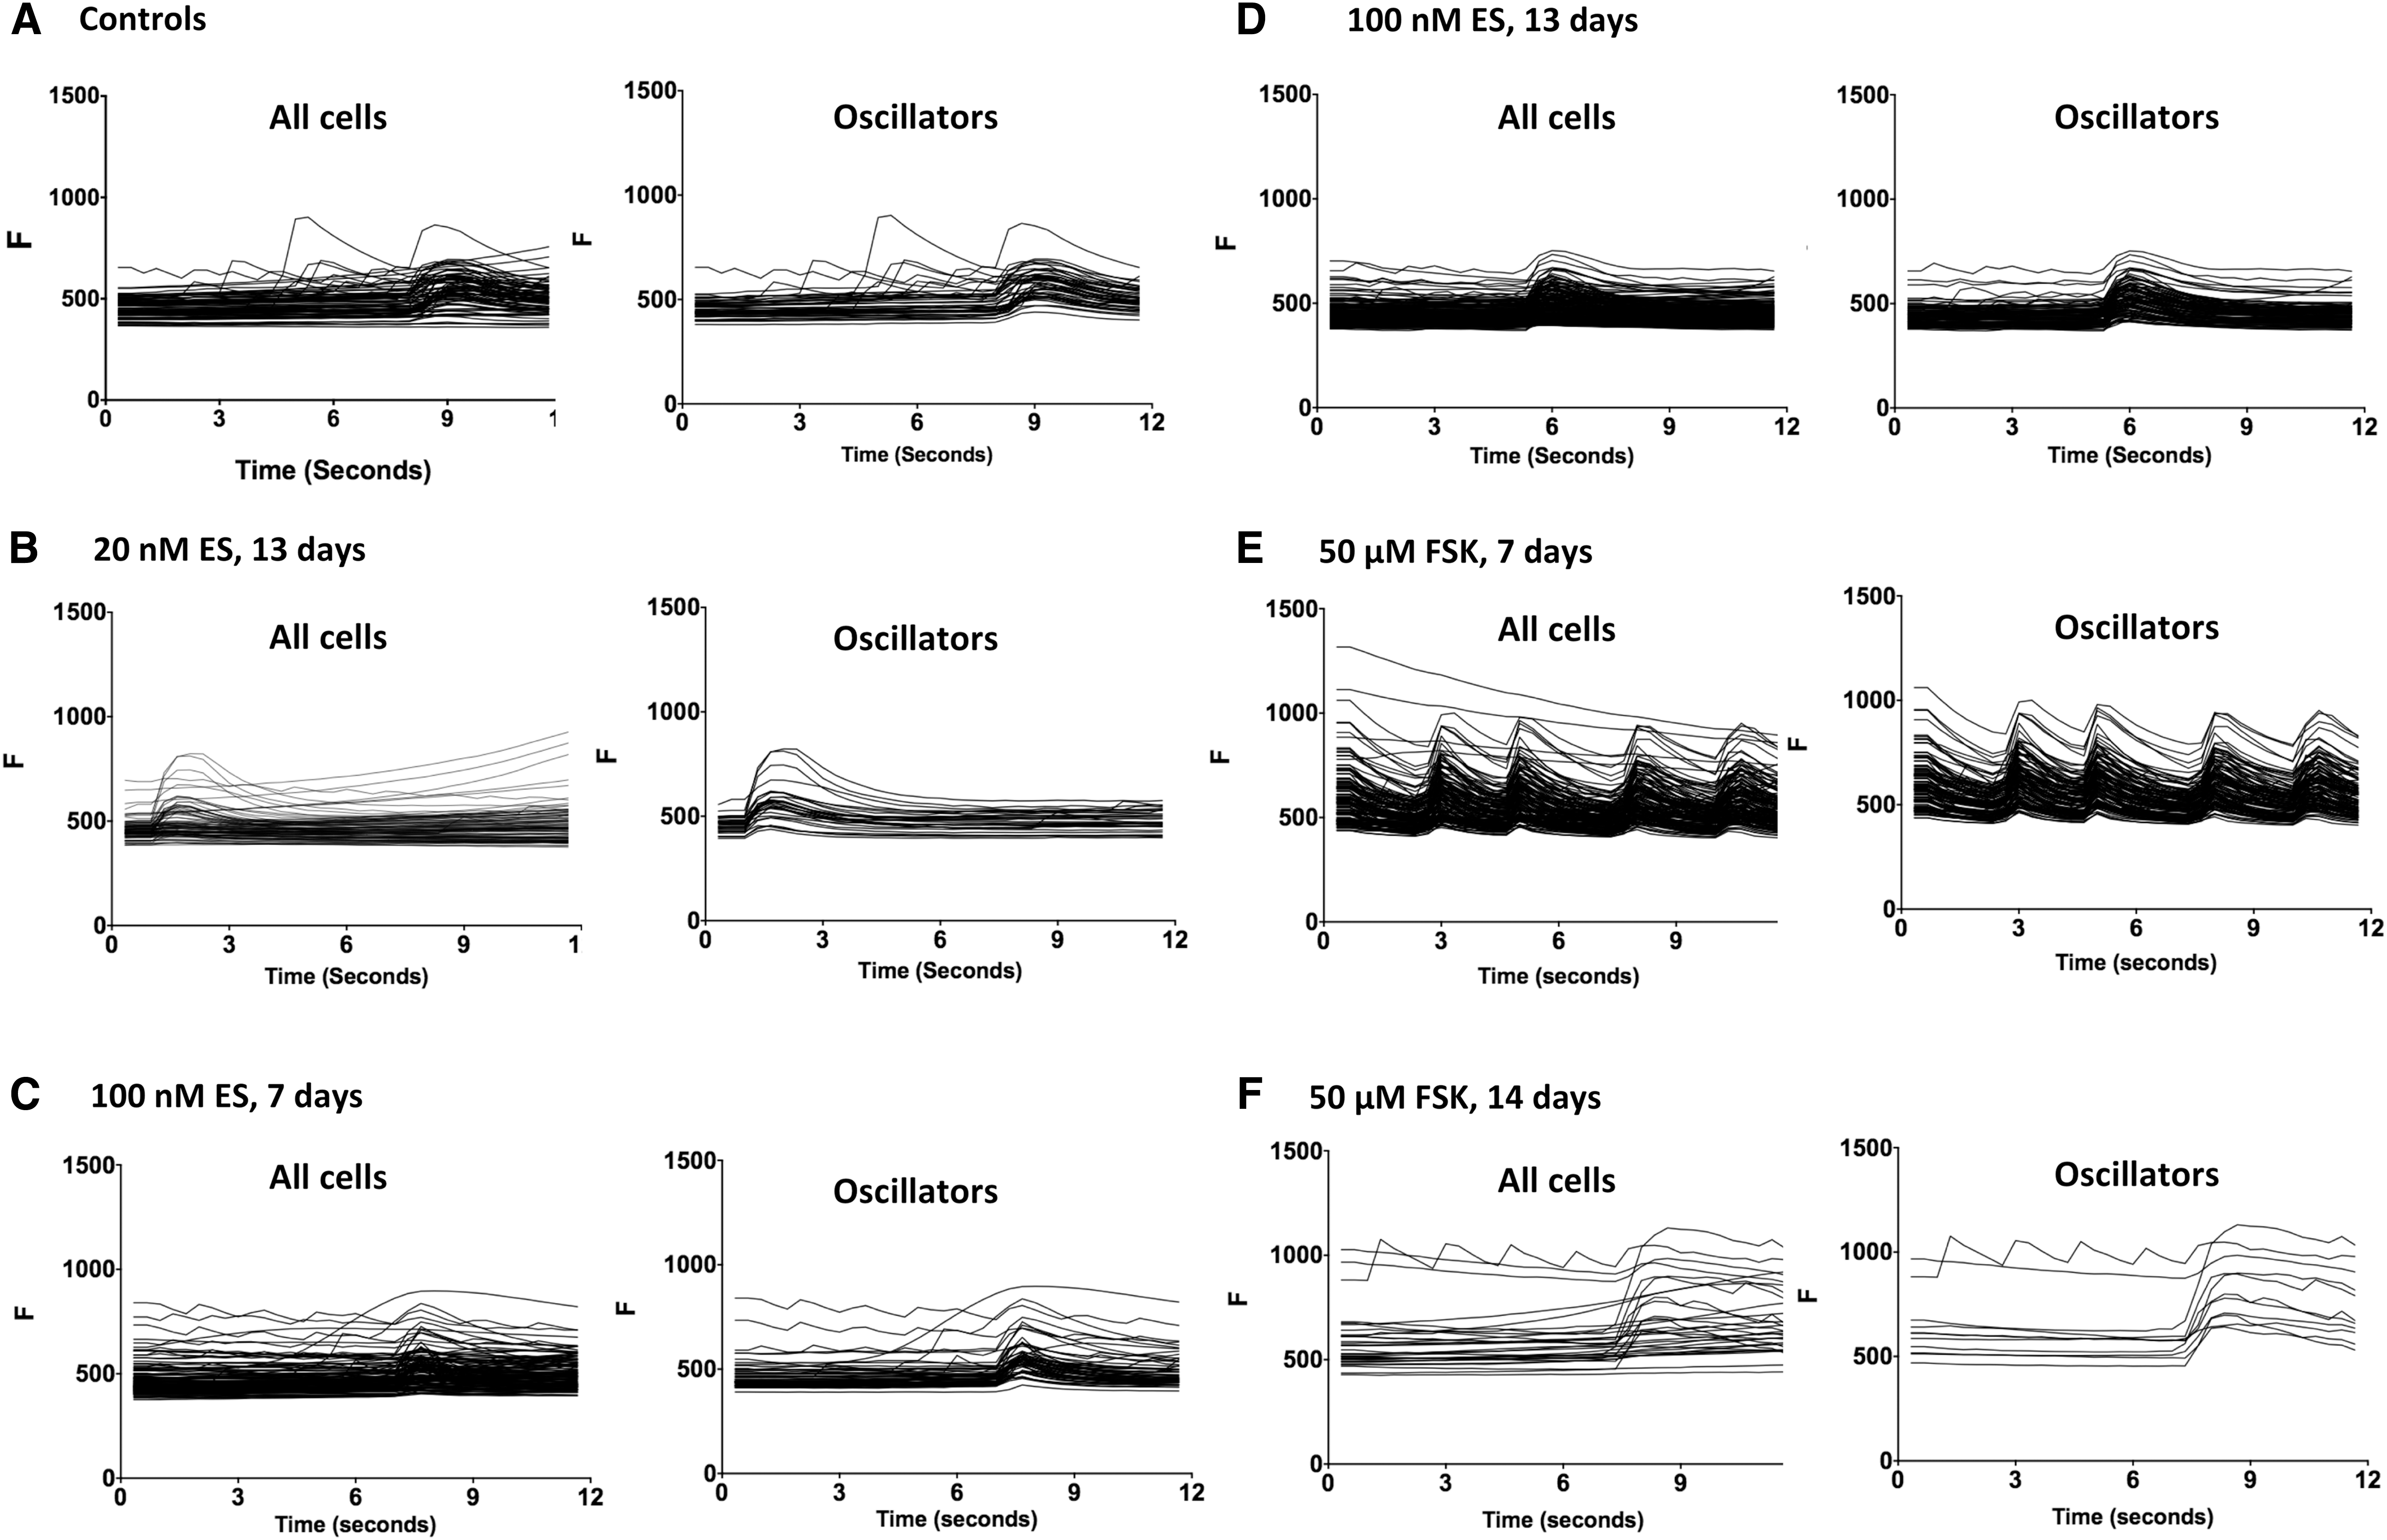
Cell-by-cell analysis of calcium transients. Representative traces are shown for wells exposed to control medium plus DMSO
To quantify the activity of the RHNs, a thresholding strategy was employed. For each cell, an increase in Fluo-4 fluorescence >15%, from one frame to another, was considered the initiation of a calcium transient. Cells exhibiting Fluo-4 fluctuations that fulfilled this criterion were classified as “Oscillators” (Fig. 2). Also, to further characterize synchronized activity, a “Synchronized Event” data parameter was defined, which corresponds to an event in which four or more cells within the field of view simultaneously initiated calcium transients. For analysis and statistical evaluation, the results from the two experiments were combined; for this, data were pooled between the 6- and 7-day drug exposures (considered “one week” treatments), and between the 13- and 14-day drug exposures (considered to be “two week” treatments).
For control wells exposed to DMSO, oscillating cells comprised 12% of the total (Fig. 3A). Exposure to 20 nM ES for 2 weeks did not significantly affect the percentage of oscillating cells, nor did exposure to 100 nM ES for 1 week. Cells exposed to 100 nM ES for 2 weeks averaged slightly higher for the oscillators (15%), but this was not statistically different from controls. Interestingly, 30% of the cells exposed to 50 μM FSK for 1 week exhibited oscillations, which was statistically above the controls (P < 0.05). For cells exposed to 50 μM FSK for 2 weeks, 18% exhibited oscillations; although this was above the control value, the difference did not achieve statistical significance.
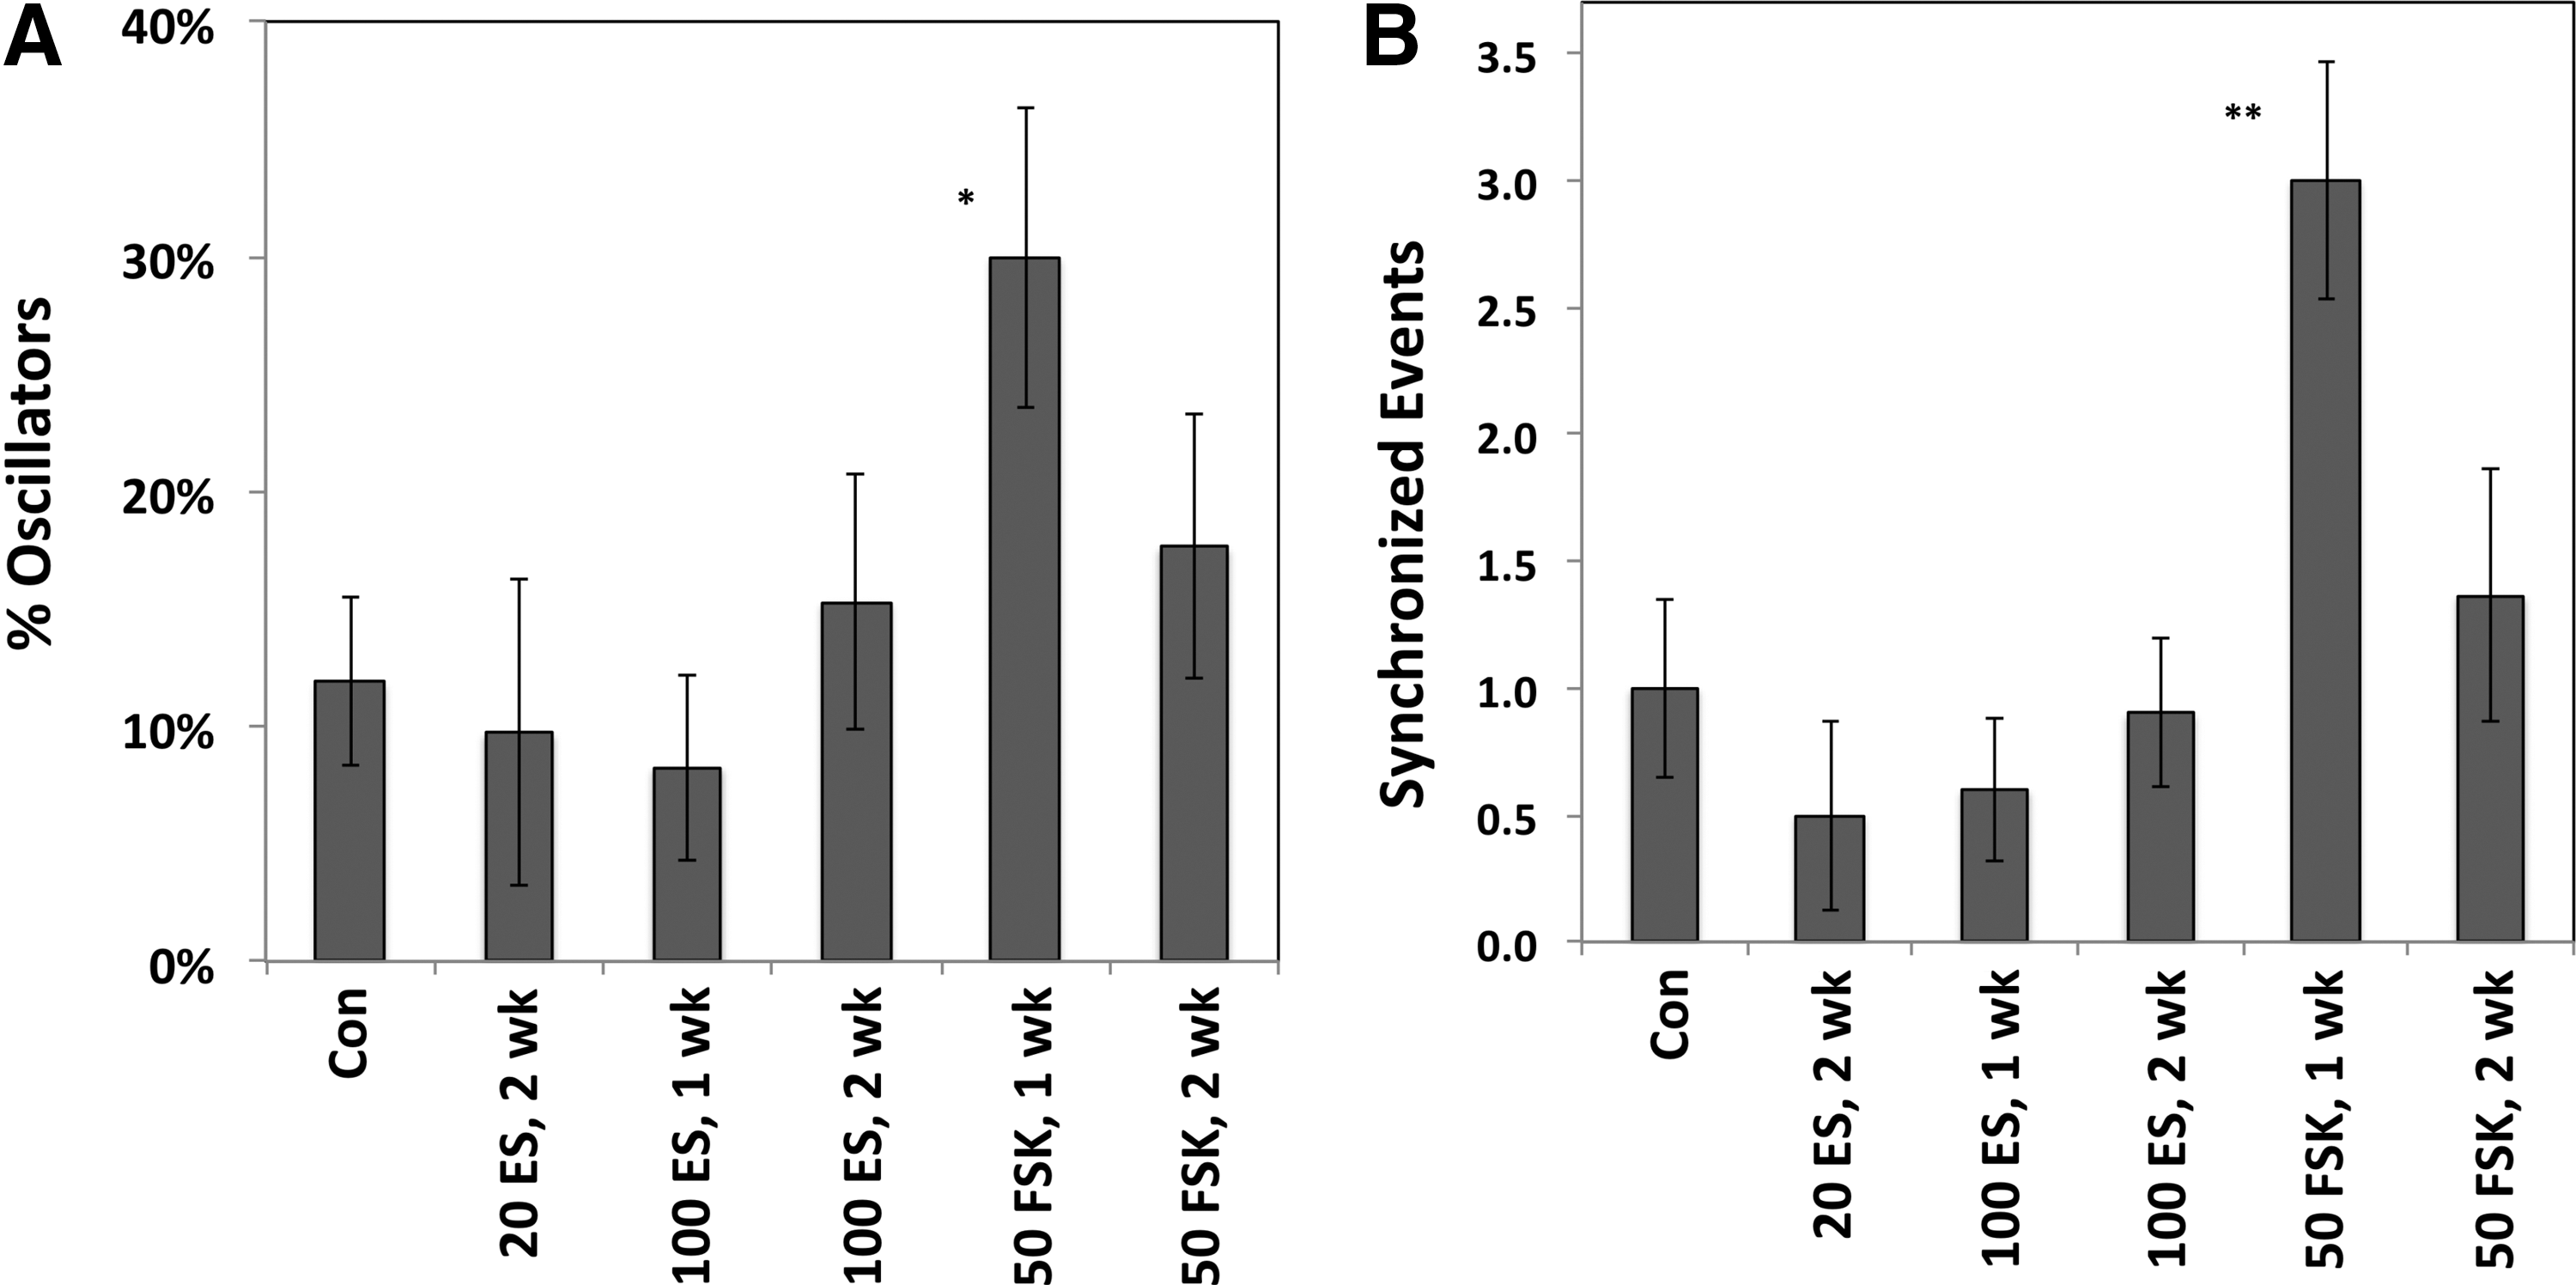
Quantification of oscillating cells and synchronized events. Data are shown derived from the experiments described in Figure 2; concentrations of ES are shown in nM, whereas concentrations of FSK are in μM.
Regarding synchronized activity, control wells averaged one synchronous event per video, and the frequency of synchronized events was not significantly changed by ES (Fig. 3B). For cells exposed to FSK for 1 week, an average of three synchronized events were observed per recording period, which was significantly greater than the controls (P < .01). Wells exposed to 50 μM FSK for 2 weeks averaged 1.36 synchronized events per video; although this value was above the mean value for controls, it was not statistically different at the P < 0.05 criteria.
Automated Image Acquisition and Analysis
Subsequent experiments were performed utilizing Vala's KIC. For use with the KIC, RHNs were plated in 384-well dishes and treated with test compounds for 1 week before testing. A single image was collected per field of view for nuclei and images of Fluo-4 were collected at 30 fps. Images were acquired from a single field of view per well in an automated manner. Images from the experiment were analyzed with CyteSeer, utilizing algorithms previously developed for cardiac myocytes that identify each cell (based on nuclear location) and quantify Fluo-4 fluorescence within the nuclear region over the time course of the experiment. This region was chosen because each nucleus represents a unique cell, whereas the complexity of the cultures makes it difficult to accurately distinguish the neurites of neighboring cells from each other. For identification of the oscillating cells, an increase in Fluo-4 fluorescence of 2% was considered the threshold; this is a lower percentage increase than used as a threshold in analysis of the previous experiment because a greater frame rate (30 fps) was used for image acquisition with the KIC.
The digital camera of the KIC features an approximately fourfold increase in image area compared with the previously used system, and in this experiment ∼800 cells were observed per field of view. There were typically one or two major calcium transient events per run (Fig. 4A). Control wells featured ∼16% oscillators, whereas wells treated with 5 μM FSK featured 63% oscillators, which was a highly significant effect (Fig. 4B). Treatment with 25 μM FSK also increased the percentage of oscillators, but to a lesser extent than the 5 μM treatment, whereas 50 μM FSK did not increase the percentage of oscillators in a statistically significant manner. In contrast, 0.2 and 2 μM TAM strongly reduced the percentage of oscillators to 1.9% and 0.5%, respectively. At the highest dose of TAM, <10 cells per field of view exhibited spontaneous activity.
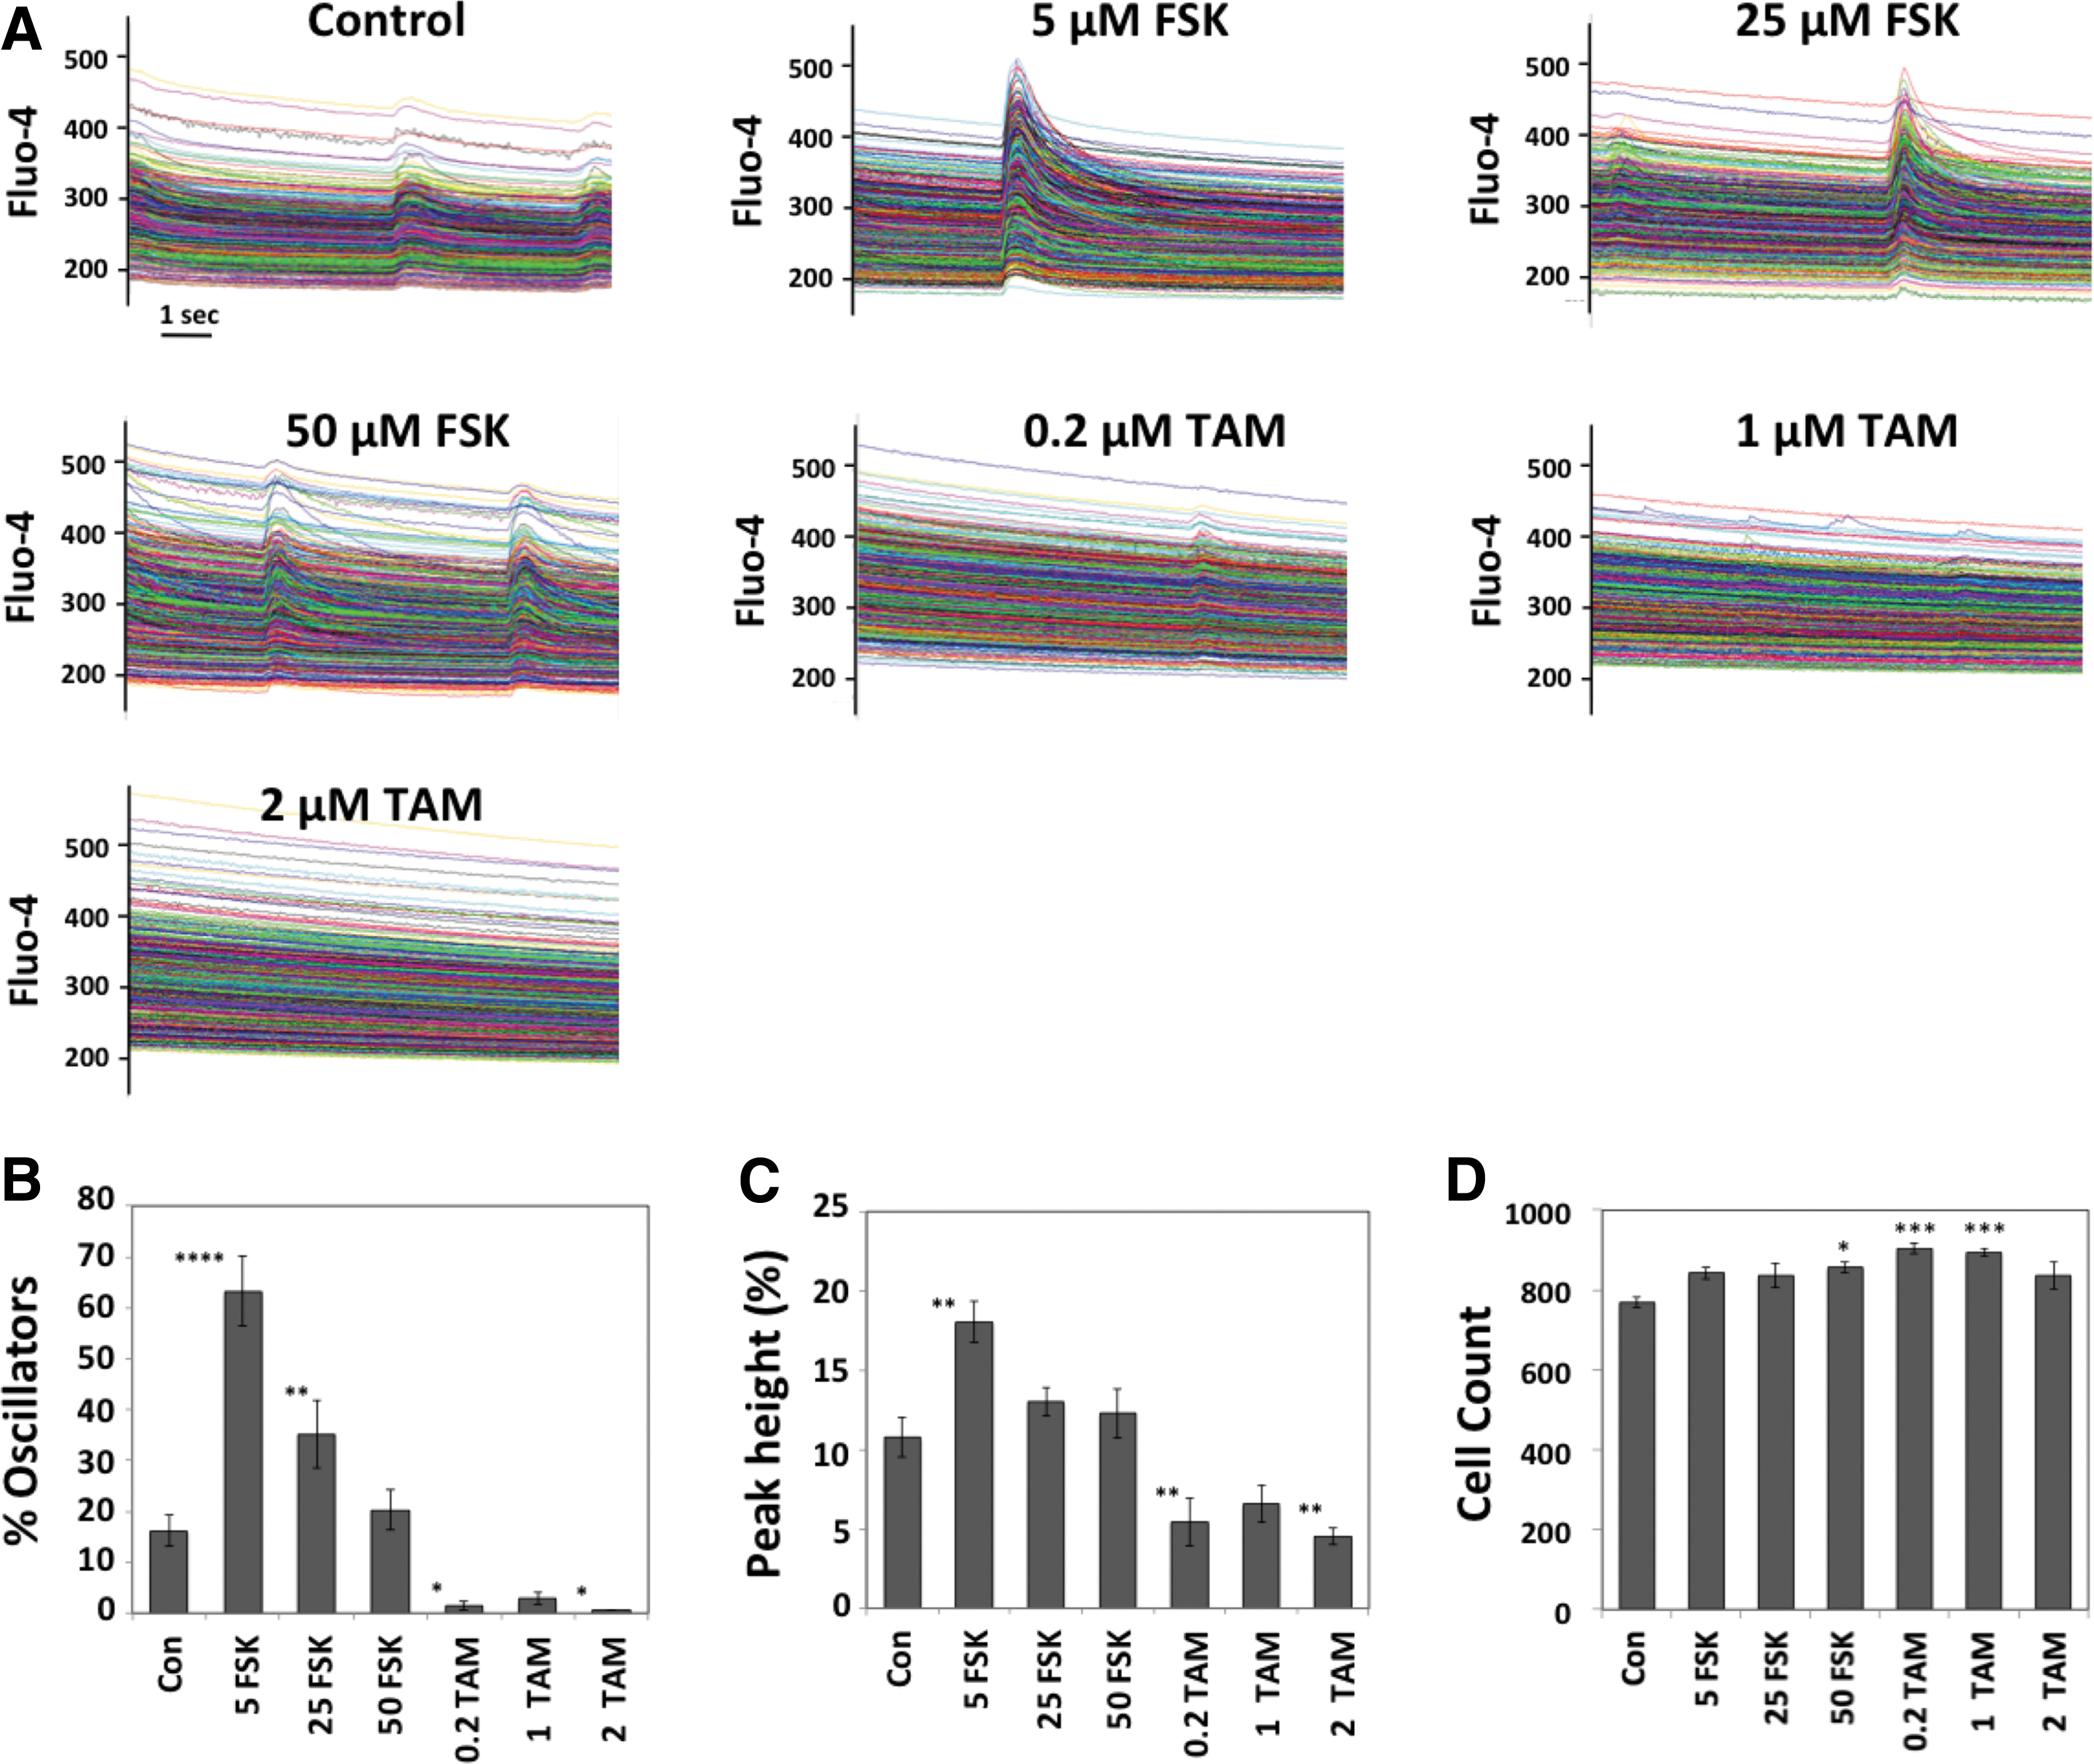
Automated quantification of calcium transients in RHNs. Cells were treated with test compounds for 7 days, loaded with Fluo-4, and imaged with the KIC at 30 fps.
The peak magnitude of each transient was also quantified and normalized to the baseline immediately before initiation of the calcium transient (Fig. 4C). For control wells, peaks averaged ∼11% above baseline, whereas peaks in the FSK-treated wells averaged 18% above baseline (P < 0.001). Treatment with 0.2 and 2 μM TAM reduced peak height in a statistically significant manner to values of 6.8% and 4.5% above baseline, respectively.
In this experiment, cell counts (average per field of view) for the wells exposed to FSK and TAM were also somewhat elevated versus controls (Fig. 4D). This effect was statistically significant for 50 μM FSK (an increase of 11%), 0.2 TAM (18%), and 1 μM TAM (16%).
HCA of Synaptic Structures
As neurological dysfunction involves alterations in synapses, we tested whether the drug treatments that altered calcium transients also had effects on synaptic structures. To do this, neurons seeded in 384-well dishes were exposed to FSK, ES, and TAM and FUL for 6 days, then were fixed, immunolabeled for Syn-1, a presynaptic protein, and PSD-95, a postsynaptic protein, and the nuclei were stained with DAPI. Images were collected with the IC100 Image Cytometer in three optical channels for 25 contiguous fields of view within each well. PSD-95 was distributed in the cell bodies, near the nuclei, and, also at synaptic puncta distributed along the neurites (Fig. 5A). Syn-1 was primarily distributed in puncta that generally colocalized with the PSD-95 puncta; the puncta of both proteins were recognized by the Colocalization Algorithm encoded in CyteSeer. 52 The algorithm initially recognizes the pixels corresponding to each nucleus in the field of view (the Nuclear Mask), calculates the size of each nucleus (Nuclear Area, in pixels), and assigns a unique identification number (the cell ID). The algorithm also estimates the area within the field of view occupied by each cell (the Whole Cell Mask) by considering spacing and orientation of the nuclei. Pixels within the Whole Cell Mask are then identified that are positive for PSD-95 expression (the PSD-95 Protein Mask), and, similarly, pixels are independently identified that are positive for Syn-1 expression (the Syn-1 Protein Mask); note that the Protein Masks for PSD-95 and Syn-1 can overlap, and, indeed, do so at the synapses. The algorithm also quantifies the number of puncta that are positive for each protein. For each mask (Nuclear Mask, Whole Cell Mask, PSD-95-Protein Mask, and Syn-1-Protein Mask), the average pixel intensity (API) is calculated for each fluorescence channel (DAPI, PSD-95, and Syn-1). Furthermore, a variety of colocalization coefficients are calculated between the PSD-95 and Syn-1 channels (e.g., Pearson's, Manders' M1, Manders' M2, and Tanimoto).
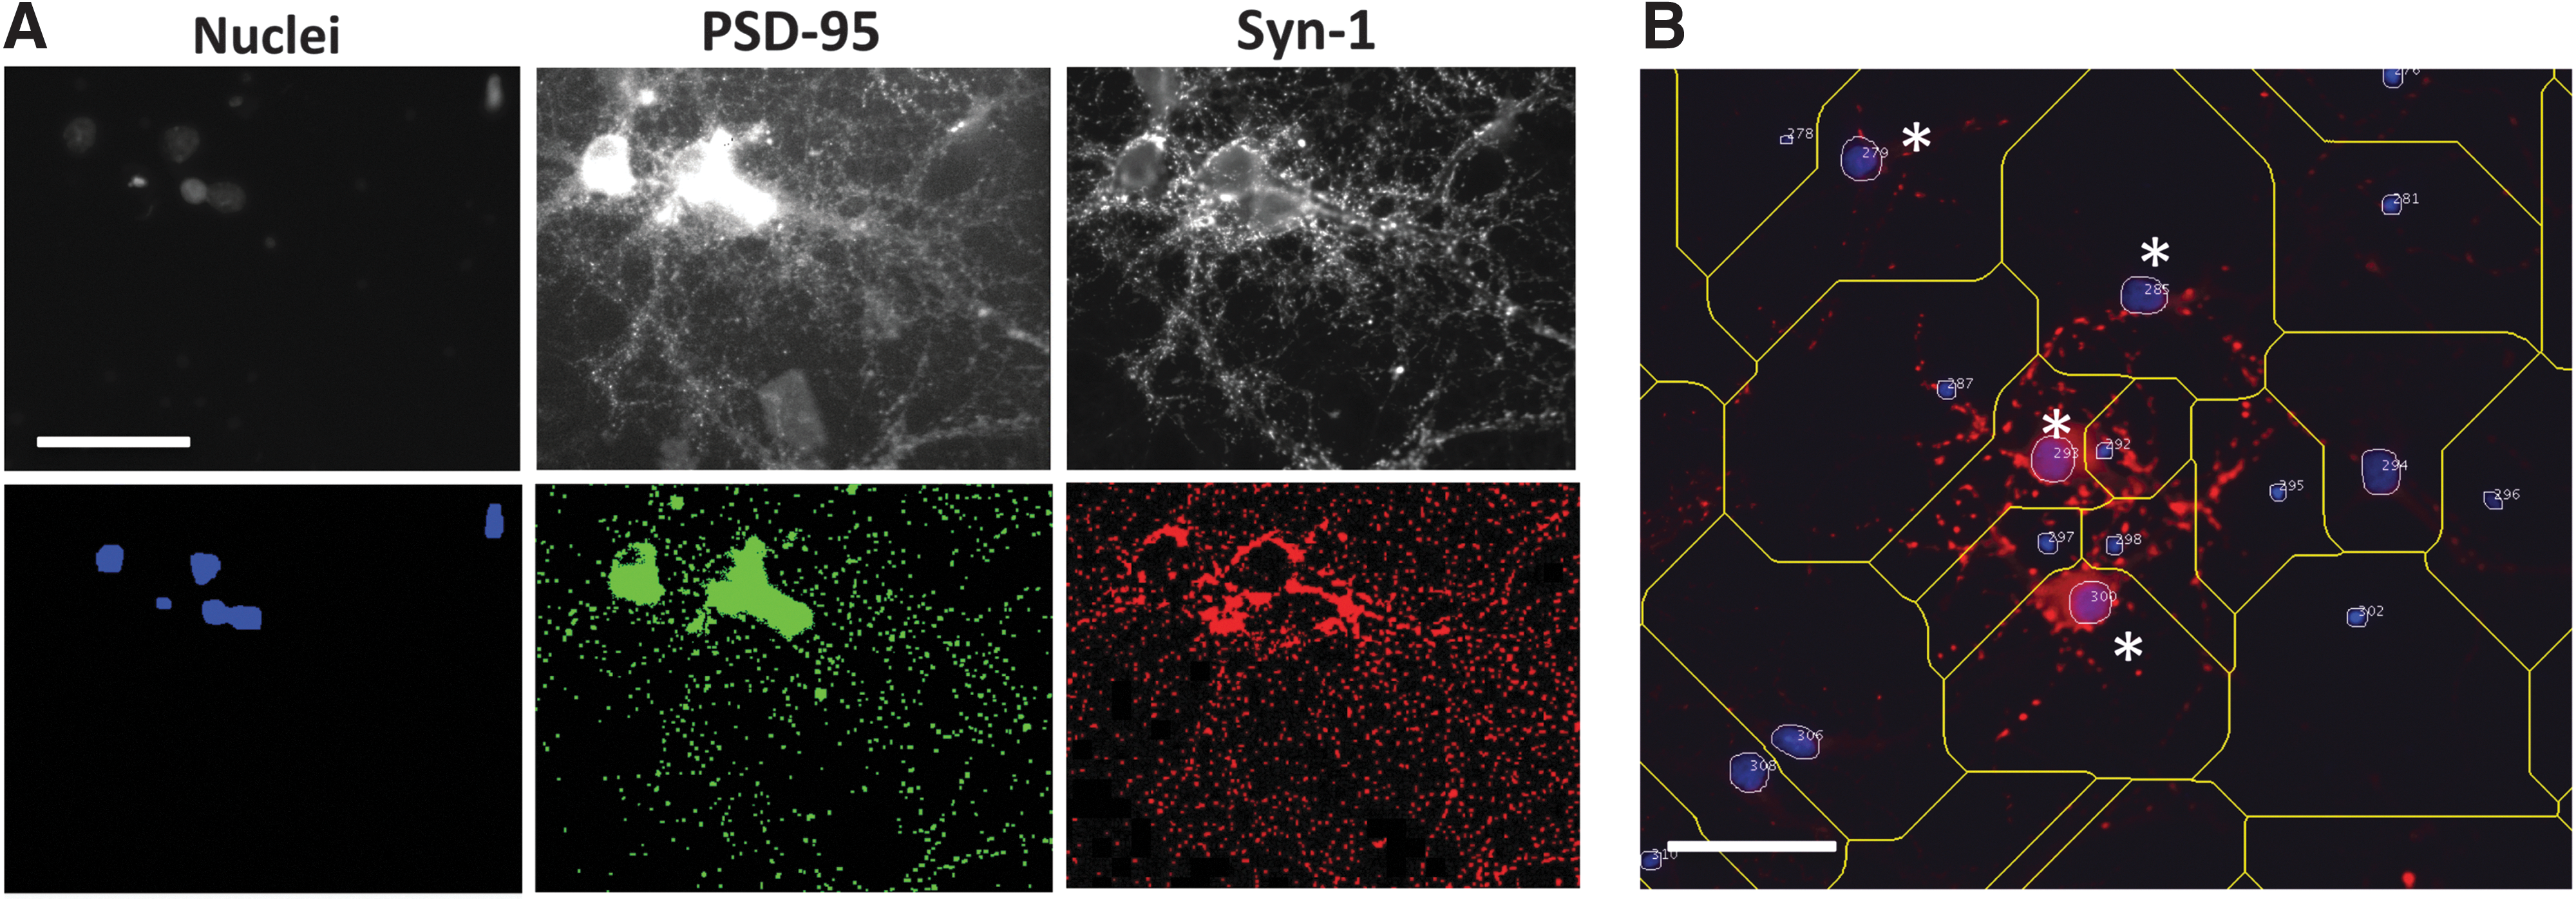
Image segmentation of RHNs by CyteSeer.
The nuclei in these primary cultures tended to be of two size classes. Relatively large nuclei were often found centrally located in the neuronal cell bodies (somas); in contrast, small nuclei were often found located remotely from the neuronal somas and synaptic puncta, and likely represent non-neuronal cells (perhaps glial or other cell types). To identify neurons in an automated manner, a gating strategy was employed. For this, cells were classified as neurons if their nuclei were >400 pixels in Nuclear Area, and if the API of the PSD-95 image for the Nuclear Mask was >38 fluorescence intensity units (Fig. 5B). Although PSD-95 is not specifically localized to the nuclei, PSD-95 labeling above background was usually observed within Nuclear Masks in the neuronal somas, because of the presence of PSD-95 in perinuclear cytoplasmic regions or in puncta that overlie the nuclei because of the three dimensional nature of the cultures or synaptic puncta associated with perinuclear regions of the somas.
Representative images from the experiment are shown in Figure 6. Visual inspection of the images suggested that FSK, ES, and FUL increased expression of the synaptic biomarkers and puncta, and that TAM had an inhibitory effect. HCA representing cell number, biomarker expression, and synaptic puncta is shown (Fig. 7). For wells exposed to DMSO (controls), the average total number of nuclei per field of view was 487 ± 61 (mean ± SE, Fig. 7A). Exposure to 50 μM FSK resulted in a twofold increase in total nuclei, and this effect was highly significant (P < 0.001). Total nuclei were also significantly increased after exposure to 100 nM ES and by 1 μM TAM. For the neuronal nuclei (gated for size and PSD-95 expression), control wells averaged 236 ± 20 per field of view (Fig. 7B). FSK increased the number of neuronal nuclei in a dose-dependent manner, with a twofold effect at 50 μM. Twofold increases in neuronal nuclei also resulted from exposure to 100 nM ES, 0.2 μM TAM, and 1 μM TAM. The average number of neuronal nuclei was also elevated for 20 nM ES, 2 μM TAM, and both concentrations of FUL, but these values did not achieve statistical significance versus DMSO.

Representative images of RHNs exposed to test agents for 6 days. Images shown for cells are observed for nuclei (blue), PSD-95 (green), and Syn-1 (red) after treatments with DMSO

HCA quantification of number of cells, Syn-1, and PSD-95 in RHNs. Data are for RHNs treated with test compounds for 6 days. Concentrations for FSK and TAM are in micromolar, whereas concentrations for ES and FUL are in nanomolar.
Regarding PSD-95, for control wells, there was an average of 25,163 ± 1,986 PSD-95 puncta associated with neurons, per field of view (Fig. 7C). The PSD-95 puncta were significantly increased by 25 μM FSK (158% vs. control), 50 μM FSK (182%), 20 nM ES (159%), 100 nM ES (192%), 16 nM FUL (170%), and 32 nM FUL (158%). Although the number of PSD-95 puncta after exposure to 2 μM TAM was less than for controls (67%), this was not a statistically significant reduction. We also quantified the fluorescence intensity resulting from immunolabeling of the PSD-95 (Fig. 7D). For neurons in the control wells, the PSD-95 puncta averaged 66 ± 1 intensity units. Exposure to 5 μM FSK led to a statistically significant increase in intensity (108%, P < 0.05 vs. controls); in contrast, PSD-95 puncta intensity was reduced by TAM in a dose-dependent manner to 90%, 85%, and 81% of control at 0.2, 1, and 2 μM TAM. Notably, SSMD was 2.50 for the effect of 2 μM TAM, which was the largest SSMD obtained for treatments on puncta counts or protein intensity.
Regarding Syn-1, control wells averaged 50,039 ± 2,850 neuronal puncta per field of view (Fig. 7E) and this was increased to 140% and 153% of control by 20 and 100 nM ES, respectively. In contrast, 2 μM TAM reduced the count of neuronal Syn-1 puncta to 64% of control. Regarding fluorescence intensity of the immunolabeling, Syn-1 puncta in control wells averaged 105 ± 1 fluorescence units. Unexpectedly, intensity of the Syn-1 puncta was diminished by all of the agents, to a certain degree, including a reduction to 89% versus control by 50 μM FSK, 92% by 100 nM ES, 94% by 2 μM TAM, and 88% by 32 nM FUL to 88% (Fig. 7F).
Since PSD-95 and Syn-1 are located pre- and postsynaptically in synaptic puncta, it was of interest to quantify the degree of colocalization of these proteins (Fig. 8). All colocalization values reported are for the neurons (cells positive for PSD-95 with relatively large nuclei). For control cells treated with DMSO, the PCC (which can range from −1 [perfect exclusion] to +1 [perfect colocalization], with 0 = random distribution) averaged 0.613, and this was increased to 106%, 111%, and 111% of control by 5, 25, and 50 μM FSK, respectively (Fig. 8A). Although the changes in absolute value of PCC were relatively small, there was little variation between samples within each condition, so the effects of FSK had a high degree of statistical significance (P < 0.0001, at 50 μM). SSMD was 1.50 for the effect of 50 μM FSK.
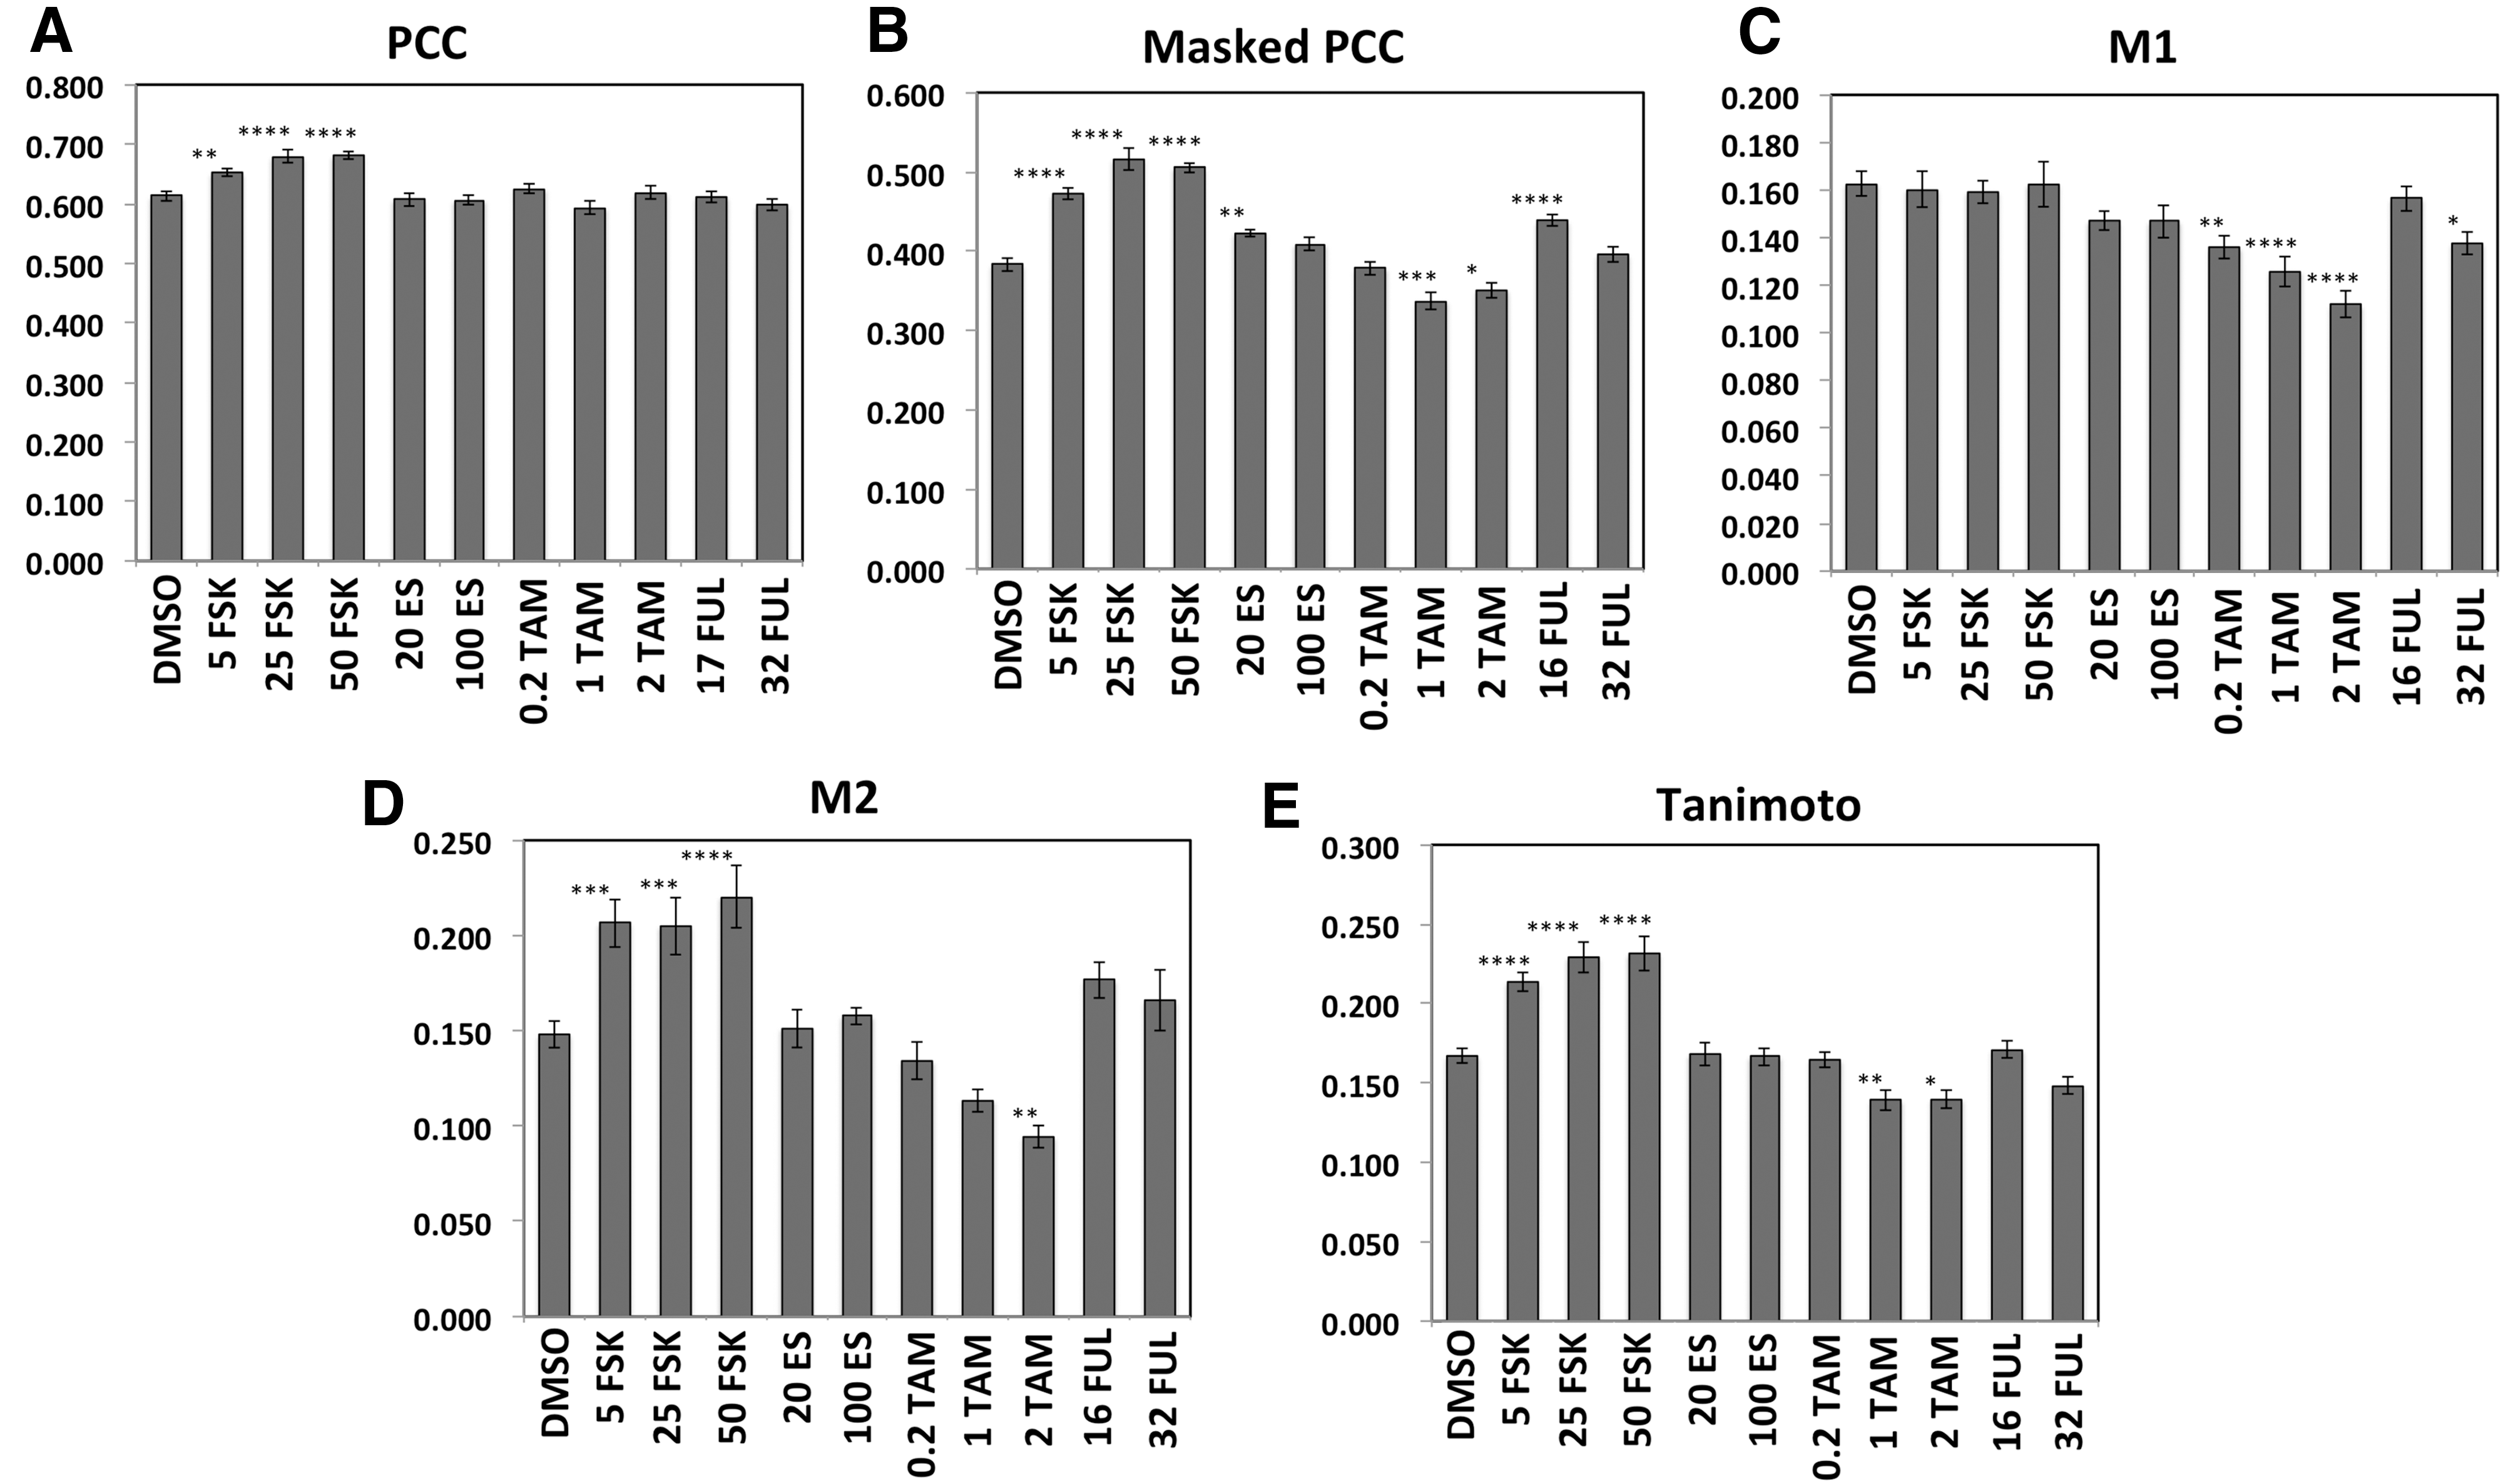
HCA quantification of Syn-1:PSD-95 colocalization in RHNs. Colocalization data are shown for RHNs treated with test compounds for 6 days. Values of the PCC
The Masked PCC is a specialized correlation coefficient developed to specifically quantify colocalization of proteins at cellular structures 53 ; for this study, the Masked PCC was the PCC calculated for all pixels within the cell positive for either PSD-95 or Syn-1 expression (PSD-95 Protein Mask + Syn-1 Protein Mask). The Masked PCC in DMSO-treated control cells averaged 0.383 and this was increased to 123%, 135%, and 132% of control by 5, 25, and 50 μM FSK, respectively. SSMD was 2.91 for the effect of 50 μM FSK, the largest SSMD value obtained in the study. The Masked PCC was also increased to 110% by 20 nM ES, and 114% by 32 nM FUL (Fig. 8B). In contrast, the Masked PCC was reduced to 88.0% and 91.7% of control by 1 and 2 μM TAM, respectively.
The Manders' M1 coefficient has a theoretical range of 0 to +1 and is the fraction of PSD-95 fluorescence that is colocalized with Syn-1. M1 was not increased by any agent but was diminished to 83.5%, 77.4%, and 68.7% of control by 0.2, 1, and 2 μM TAM, respectively (SSMD was 1.69 for the effect of 2 μM TAM), and to 84.6% of control by 32 nM FUL (Fig. 8C).
The Manders' M2 is the fraction of fluorescence of Syn-1 that is colocalized with PSD-95. M2 averaged 0.148 for DMSO-treated wells and this was increased to 139%, 138%, and 149% of control by 5, 25, and 50 μM FSK, respectively (SSMD was 1.17 for the effect of 50 μM FSK), and diminished to 63.8% of control by 2 μM TAM (SSMD was 1.40 for the effect of 2 μM TAM) (Fig. 8D).
The Tanimoto coefficient 53 is the fraction of overlap between the PSD-95 and Syn-1 Protein Masks. The Tanimoto coefficient averaged 0.167 for DMSO-treated wells, was increased to 128%, 137%, and 138% of control by 5, 25, and 50 μM FSK, respectively (SSMD was 1.64 for the effect of 50 μM FSK), and diminished to 83% and 84% of control by 1 and 2 μM TAM (Fig. 8E).
Discussion
In this study, novel methods were developed that enable the effects of chemical compounds to be tested on the activity and synapses of RHNs cultured in 96-well and 384-well dishes—assay formats suitable for high-throughput screening of compounds—to investigate mechanisms of neurotoxicity or neuroprotection. The methods presented here include KIC, to quantify the occurrence and characteristics of spontaneous calcium transients, and HCA, to quantify synaptic puncta in the cultures. Overall, the results demonstrate that TAM, which is implicated in PCCI, reduces spontaneous calcium transients exhibited by the RHNs, and expression, colocalization, and punctal distribution of the synaptic proteins PSD-95 and Syn-1. FSK, an activator of cyclic adenosine monophosphate (cAMP) production, had the opposite effect, increasing calcium transients, synaptic puncta, and colocalization of PSD-95 with Syn-1. Synaptic puncta were also increased by ES and by FUL.
The calcium transients observed in the RHNs likely arise from action potential-induced glutamate release, activation of postsynaptic NMDA receptors, and depolarization-induced calcium influx, as others have demonstrated that calcium transients in this model are blocked by the sodium channel antagonist, tetrodotoxin, and by the NMDA antagonist, 2-aminophosphonovaleric acid. 37 Calcium-induced calcium release also likely contributes to the calcium transients, 54 particularly within the synaptic structures. 52,55 The synchronization of the calcium transients often observed among neurons throughout the field of view is likely because of rapid propagation of the action potentials through the cultures. We have not yet measured action potential conduction velocity in the RHNs but conduction velocities of ∼0.2–0.3 m/s have been reported for cortical neurons cultured from embryonic mice. 53 The images recorded by the KIC correspond to a field of view that is 832 × 703 μm in dimension. Thus, an action potential propagating at 0.2 m/s would transverse the field of view in 4 msec and calcium transients triggered by the action potential would appear to initiate simultaneously at the rates of image acquisition (3–30 fps) utilized in this study. To measure action potential conduction velocities with KIC, it will be necessary to utilize a fluorescent voltage indicator (e.g., FluoVolt™) and acquire images at a faster frame rate (e. g., 100–1,000 fps) and such methods are currently in development.
The positive effects of FSK in the RHNs are consistent with results by others, suggesting that cAMP is a key regulator of neurodifferentiation. For example, in neural progenitor cells, FSK, which produces cAMP by activating adenylate cyclase, and 3-isobutyl-1-methylxanthine (IBMX), which increases cAMP by inhibiting phosphodiesterase, strongly promote differentiation to glutamatergic and GABAergic neurons 56 ; furthermore, effects of IBMX are reduced by inhibitors of Na+ and Ca2+ channels, suggesting that calcium transients participate in neurodifferentiation. In our study, FSK increased the peak height of calcium transients, suggesting that FSK may increase expression of calcium regulatory proteins. Notably, the phosphodiesterase-4 inhibitor rolipram, which likely increases cAMP in a manner similar to IBMX, increases neurogenesis in the murine hippocampus 57 and has positive effects in a preclinical rodent model of PCCI. 58 Relatedly, phosphodiesterase inhibitors are being investigated for therapeutic benefits against cognitive decline in a variety of contexts, including Alzheimer's disease. 59 –61
In our hands, exposure of the RHNs to ES did not alter occurrence or synchronization of the calcium transients in the neurons monitored after washout of the hormone. This result is consistent with a previous study with RHNs in which long-term exposure to ES did not affect basal intracellular calcium. 62 In contrast, acute exposure to ES increases calcium oscillations in neurons derived from murine and human embryonic stem cells through activation of ER-β, 63 and potentiates glutamate-induced miniature excitatory postsynaptic currents in rat hippocampal brain slices. 64 Thus, ES can have complex effects on neuronal calcium likely depending on factors such as dose, time of exposure, and neuronal type. Certain studies have linked hormone replacement therapy, which includes ES, to improved cognition in postmenopausal women, but there is lack of consensus as to the occurrence and magnitude of this effect. 65,66
To the best of our knowledge, this is the first report demonstrating that TAM reduces spontaneous calcium transients in RHNs, in vitro. Previous studies have yielded mixed results regarding effects of TAM on neurons. When injected into pregnant rats, TAM inhibits neurogenesis in the CA1 region of the embryonic hippocampus, 17,18 a result that is compatible with our observations. Also, in isolated rat hippocampal brain slices, incubation with 1 μM TAM for 4 h reduces ATP levels. 67 In contrast, TAM increases neuroexcitability in hippocampal slices under conditions of oxygen/glucose deprivation. 68 In cultured rat embryonic forebrain neurons, acute exposure to low concentration of TAM protects against glutamate-induced mitochondrial depolarization, but high concentration of TAM is neurotoxic. 69 The heterogeneity in responses to TAM in various model systems highlights the likely possibility that TAM affects multiple pathways in CNS, including inhibition of ER-α, activation of GPER, and likely inhibition of mitochondrial function. 28 –31,70,71
Regarding HCA, the dose-dependent increase in neurons with FSK is consistent with the ability of FSK to promote neurogenesis in neural progenitor cells. 56 The effect of ES to increase neurons in our system is also consistent with positive effects of ES on hippocampal neurogenesis that manifest during development and the rodent estrous cycle, 72 and possibly during the human menstrual cycle. 73 Our observation that ES increased synaptic proteins and puncta is also consistent with previous work. For example, others have demonstrated that exposing RHNs to 370 nM ES elicits a twofold increase in dendritic spine density. 74 Administration of ES to ovariectomized rats also increases hippocampal mRNA of PSD-95 and Syn-1. 75 Relatedly, acute administration of ES elicits rapid recruitment of PSD-95 to dendritic spines in cultured cortical neurons, which may be mediated by ER-β. 76 Although we did not explore rapid recruitment of synaptic proteins in this study, our HCA methods are very amenable to exploring this area of synaptogenesis.
In our study, FUL increased the number of PSD-95 puncta. Although FUL is a “pure antagonist” for ER-α, it is also an agonist for GPER and can increase cAMP. 77,78 Consistent with our data, FUL increases neurite outgrowth in cultured mouse hippocampal neurons in a GPER-dependent manner. 79 GPER may also play a role in neuroprotective effects of ES in cerebral ischemia. 80 Relatedly, G-1, a selective agonist of GPER, reduces cognitive impairment and loss of hippocampal neurons after traumatic brain injury 81 and enhances spatial recognition memory, a task associated with hippocampal function, in ovariectomized rats. 82
In contrast to our results, TAM has been reported to increase synapses in the hippocampus of ovariectomized rats, similar to ES, and to increase phosphorylation of cAMP response element-binding protein. 83 It has also been reported that TAM increases cAMP through activation of GPER. 77 Thus, there is heterogeneity in the responses to TAM at the synaptic level as well as neural activity, as already discussed.
In this study, colocalization of Syn-1 and PSD-95 was quantified using several analysis strategies. Interestingly, the different colocalization coefficients reported different aspects of the results. For example, the widely used PCC identified positive effects of FSK, but did not identify inhibitory effects of TAM. In contrast, Mander's M1 value did not identify positive effects of any agent, but reported dose-dependent inhibitory effects of TAM. Finally, both positive effects of FSK and inhibitory effects of TAM on PSD-95:Syn-1 colocalization were reported by the Masked PCC, Manders' M2, and the Tanimoto coefficients, which are consistent with the respective positive and negative effects of these agents on spontaneous calcium transient activity. The results demonstrate that colocalization analysis can quantify effects of test agents on synapses in cultured RHNs, providing additional characterization of potential neurotoxic or neuroprotective effects.
Regarding robustness of the assay for high-throughput screening, SSMD values of up to 2.50 (for the inhibitory effect of TAM on PSD-95 intensity) and 2.91 (for the positive effect of FSK on the Masked PCC) were obtained. SSMD values in this range indicate the system would yield an acceptable “hit rate.” 51 This level of robustness and the use of primary RHNs suggest that the system will be most useful for screens utilizing multiple wells per compound dose and chemical libraries of moderate size (e.g., for targeted libraries or as a secondary screen). The use of confocal methods to image the cells (in development) will likely further improve the robustness of the assay (e.g., delivering SSMD values >3.0).
The KIC and HCA methods developed in this study can be applied to a variety of in vitro neuronal models, including primary neurons isolated from different regions of the brain and neurons derived from induced pluripotent stem cells. In addition to PCCI, the methods will also likely be applicable to elucidating mechanisms and therapeutic strategies for neurodevelopmental (e.g., autism, bipolar disorder, and schizophrenia) and neurodegenerative (e.g., Parkinson's and Alzheimer's) diseases.
Footnotes
Acknowledgment
This project was funded, in part, by NIH/National Cancer Institute grant R41CA180954 “Kinetic Image Cytometry assays for neuronal activity/toxicity.”
Disclosure Statement
No competing financial interests exist.