
Abstract
Protease-activated receptor 2 (PAR2) is a proinflammatory G-protein coupled receptor (GPCR) that is activated by inflammatory proteases, and its activation initiates signaling pathways that modulate the nonselective cation channel transient receptor potential vanilloid-4 (TRPV4). PAR2-dependent opening of TRPV4 has been attributed to kinase activation, but the identity of the responsible enzymes is unknown. Deciphering the signaling pathways involved in the PAR2-dependent opening of TRPV4 may yield new targets for pain treatment. This study has identified specific kinases that are involved in opening TRPV4, using a selective screen of short interfering ribonucleic acid (siRNA) SMARTpools, which individually targeted all human kinases, in human embryonic kidney 293 (HEK293) cells that stably express inducible TRPV4. This screen is unique because it uses a real-time assay measuring intracellular calcium with Fura-2AM dye. From the primary screen, subsequent confirmation screen, and on-target messenger ribonucleic acid expression analysis, we identified two kinases as crucial to the PAR2-dependent opening of TRPV4 in HEK293 cells, mitogen-activated protein kinase 13 and with no lysine kinase 4. In conclusion, this study describes a powerful new application of siRNA knockdown to identity signaling molecules that are responsible for the PAR2-dependent opening of TRPV4, which will help elucidate this signaling process.
Introduction
Activation of the transient receptor potential vanilloid-4 (TRPV4) ion channel sensitizes sensory neurons to painful mechanical 1 and thermal stimuli 2 , and it also contributes to migraine pain 3 and ultraviolet B light-induced epidermal pain. 4 Injection of a mixture of proinflammatory G-protein coupled receptor (GPCR) agonists, including bradykinin, substance P, prostaglandin E2, and serotonin, into the paw of the mouse, caused a profound mechanical hyperalgesia that was not observed in TRPV4 knockout mice. 1 These observations are consistent with the involvement of TRPV4 in a range of inflammatory pain states and its sensitization or activation by some GPCRs.
The GPCR, protease-activated receptor 2 (PAR2) is activated by proteolytic cleavage of its N-terminus by pro-inflammatory proteases, including trypsin, and by proteases released from immune cells such as cathepsin S, elastase, and matrix metalloproteinase 9, to reveal an N-terminal, tethered peptide ligand. 5 It is also activated by peptides that mimic the tethered ligand. Studies of PAR2 knockout mice have revealed the receptor's involvement in pain signaling. 6
PAR2 signaling sensitizes and activates TRPV4 in animal models of mechanical hyperalgesia. 7 –10 In TRPV4-expressing human embryonic kidney 293 (HEK293) cells, activation of the endogenous PAR2 results in the opening of TRPV4 through intracellular signaling. 7,9 Several studies have investigated the mechanism(s) by which PAR2 activation opens TRPV4 7,9,11,12 ; however, the detailed mechanism(s) remain poorly understood.
To investigate the signaling pathway(s) from PAR2 activation to the opening of TRPV4, we used TRPV4-expressing HEK293 cells and measured intracellular calcium ([Ca2+]i) in a real-time, plate-based fluorescence assay.
TRPV4 activity may be modulated by the action of protein kinases. For example, it is sensitized by protein kinase C, 10 protein kinase A, 8 serum glucokinase-1, 13 and src family kinases. 14 We previously showed that the kinase inhibitors wortmannin and bafetinib, at moderate to high concentrations, inhibited the PAR2-dependent opening of TRPV4. 9 This led us to hypothesize that protein kinases play a vital role in sensitizing and opening TRPV4. To discover their molecular identity, we used a discovery-based approach to find kinases that are important for the PAR2-dependent opening of TRPV4.
We established a novel screening approach, measuring intracellular calcium levels in real time to decipher the multiphase responses in a high-throughput manner, and screened all human kinases by using Dharmacon SMARTpool siRNAs (GE Dharmacon RNAi Technologies). This screen has implicated two novel kinases, mitogen-activated protein kinase 13 (MAPK13) and with no lysine kinase 4 (WNK4), in the PAR2-dependent opening of TRPV4 in HEK293 cells.
Materials and Methods
Cell Culture and Cell Lines
HEK293 cells stably expressing TRPV4 cells 7 were maintained in Dulbecco's modified Eagle's medium (DMEM; Life Technologies, Mulgrave, Victoria), 10% fetal bovine serum (FBS), and selection with blasticidin (5 μg/mL) and hygromycin B (100 μg/mL) at 37°C in 5% CO2. Cells were dissociated by using TrypLE™ express (Life Technologies) on reaching 80%–90% confluence, frozen at 1.6 × 10⁷ cells/mL in 70% v/v culture medium, 20% v/v FBS, and 10% v/v DMSO, and stored in liquid nitrogen. For each screening experiment, cells were thawed, immediately resuspended in DMEM, 10% FBS (50 mL/1 mL of frozen cells), and finally seeded into 96-well plates at 1.6 × 10⁴ cells/well by using a BioTek 406 (BioTek, Winooski, Vermont) automated liquid-handling instrument. The use of frozen stocks removed the need to passage and maintain stocks.
Conditions for the Short Interfering Ribonucleic Acid Transfection
We screened the human kinome of SMARTpool siRNAs (Human siGENOME RTF–Protein Kinases, H-003505) comprising 721 kinase targets with four individual short interfering ribonucleic acids (siRNAs) targeting each gene per well. siRNAs were transfected by using high-throughput liquid-handling robotics (Calliper ALH3000) in a 96-well format in HEK293 cells expressing TRPV4. siRNA library plates were transfected in duplicate. DharmaFECT1 lipid (DF1, 0.2 μL/well; Dharmacon) was mixed with Opti-MEM basal medium (Life Technologies) and complexed with siRNA (40 nM final concentration, 10 nM for each siRNA in the pool) for 20 min (final volume 20 μL/well). Each plate included controls in columns 1 and 12, which consisted of mock transfection with DF1 only (Mock) in six wells, nontargeting control siRNA (siOTP-NT, D-001810-0X) in two wells, and positive cell-death-inducing control siRNA-targeting polo-like kinase 1 (siPLK1) (Entrez gene ID 5347; Cat. no. M-003290-01) in two wells. Frozen cell stocks were resuspended in DMEM containing 10% FBS at 1.6 × 10⁵ cells/mL (100-fold from frozen stock), and 80 μL of the cell suspension was added to the siRNA lipid complex per well. Cells were incubated (37°C, 5% CO2) for 24 h. After that time, an additional 100 μL of media was added to each well, to avoid dislodging the weakly adherent HEK293 cells with a complete media change. Tetracycline (50 μL of 0.5 μg/mL stock to a final concentration of 0.1 μg/mL) was added 32 h later to induce expression of TRPV4 and 16 h later, the cells were tested for PAR2-dependent calcium flux in a plate reader (Table 1). Confirmation screens were performed, transfected as described earlier except that the SMARTpool deconvoluted siRNAs (individual duplex) were screened at a final concentration of 25 nM, in duplicate assays. The following individual SMARTpool siRNAs were purchased for follow-up experiments: (Entrez gene ID, Dharmacon Cat. no.), siBUB1 (699, M-004102-01), siITPK1 (3702, M-006741-01), siMAPK13 (5603, M-003591-02), and siWNK4 (65266, M-005031-02).
Protocol for Short Interfering Ribonucleic Acid Screening in Human Embryonic Kidney 293 Cells Using a Plate-Based Fluorescent Calcium Imaging
1. Filter sterilized poly-lysine solution (10 μg/mL).
2. Remove poly-
3. Directly into poly-
4. Allow lipid and Opti-MEM to equilibrate for 5 min and then add to siRNA by using a BioTek 406 liquid-handling instrument to dispense lipid Opti-MEM into each well and complex for a further 20 min.
5. Thaw cells from frozen stocks and resuspend immediately; keep at 37°C.
6. Using high-throughput liquid-handling robotics (Calliper ALH3000) in 96-well format, remove 20 μL from first plate (plate A) and dispense in the duplicate plate (plate B).
7. Using a BioTek 406 liquid-handling instrument, dispense the cell suspension to all wells.
8. Plates cultured in a high-throughput incubator (LiCONiC) to minimize edge effects.
9. Use a BioTek 406 instrument to dispense media to dilute transfection reagents rather than a full media change to maintain adherence of loosely adherent cells.
10. Plates cultured in a high-throughput incubator (LiCONiC).
11. Use a 5 × stock (0.5 μg/mL) added directly to each well for better mixing, final tetracycline concentration of 0.1 μg/mL.
12. Plates cultured in a high-throughput incubator.
13. Remove media and load FURA-2 buffer manually by using an 8-channel multichannel pipette to minimize loss of cells from wells.
14. When loading multiple plates, this time frame can range from 30 to 70 min.
15. Wash gently with an 8-channel multichannel pipette to minimize loss of cells from wells.
16. When reading multiple plates, this time frame is flexible, from 10 to 30 min.
17. Total run time per column is 150 s, injections of PAR2-AP (50 μM final concentration) at 15 s, GSK1016790A (30 nM final concentration) at 80 s.
siRNA, short interfering ribonucleic acid.
Plate-Based Fluorescent Calcium Imaging
Seventy-two hours after transfection, cells were loaded with Fura-2AM (2.5 μM) and pluronic acid (0.5 μM) diluted in HEPES solution (10 mM HEPES, 140 mM NaCl, 2 mM CaCl2, 5 mM KCl, 1 mM MgCl2, 11 mM
Initial Identification of Effective siRNAs
To set the limits of functional inhibition, we established the expected thresholds of knockdown for effective siRNAs. The PAR2-TRPV4 calcium assay measures several different phases of intracellular calcium. Therefore, identification of siRNAs that were effective in inhibiting TRPV4 opening in response to PAR2 activation required controls to confirm that the siRNAs had only blocked the PAR2-dependent opening of TRPV4 and that they had not affected cell viability or TRPV4 expression; bright-field images were taken of each well post-calcium imaging for visual verification of cell confluence and confirmation of toxic siRNA treatments.
Cell confluence was determined visually by estimating the percentage of the well that was covered by cells in the field of view and assigning a percentage value in 10% increments. A microscope field of view (40 × ) that was fully covered was assigned a score of 100%; transfections were deemed successful if siPLK-1 treatment resulted in 10% or less coverage. The nontargeting control, siOTP-NT treatment required at least 90% coverage to be acceptable. All plates included in the primary and the confirmation screens met the confluence requirements. siRNA library plates were screened in duplicate, and responses for peak and plateau phases were normalized to the transfection reagent control (mock). Gene knockdown that resulted in a reduction of the plateau phase (Fig. 1ii) greater than the response to transfection with the non-targeting control (siOTP-NT) but did not reduce the initial peak response (Fig. 1i) was considered effective, and the siRNAs were suitable for further validation.

PAR2-dependent opening of TRPV4 in HEK293 cells. Intracellular calcium ([Ca2+]i) levels in response to PAR2-AP (50 μM) and GSK1016790A (30 nM) in non-transfected HEK293 cells (black square, HEK) and hTRPV4-expressing HEK293 cells (open square, HEK + TRPV4). Arrows indicate agonist injections PAR2-AP (50 μM) at 15 s and GSK1016790A (abbreviated to GSK101; 30 nM) at 80 s.
Quantitation of Messenger Ribonucleic Acid Expression
To quantify siRNA knockdown of messenger ribonucleic acid (mRNA) expression, RNA was extracted and pooled from six replicate siRNA-treated wells, after calcium imaging experiments were completed. RNA was extracted by using a QIAGEN RNeasy mini kit with a QIAcube robotic system according to the manufacturer's specifications. RNA concentration was determined by using a Nandrop2000, measuring absorbance at 240 nm. RNA (1 μg) from each sample was digested by using DNase I (1 U; Applied Biosystems) for 10 min at room temperature, and it was inactivated by addition of EDTA (2 mM) and heating at 65°C for 10 min. RNA was reverse transcribed to circular deoxyribonucleic acid (cDNA) (High-capacity RNA-to-cDNA kit; Applied Biosystems) in a 20 μL reaction.
Quantitative polymerase chain reaction (qPCR) reactions were performed in a 384-well plate by using Taqman® Fast Advanced MasterMix protocol with a specific TaqMan® Gene Expression Assay (20 × ) (Applied Biosystems) for specific targets and glyceraldehyde 3-phosphate dehydrogenase (GAPDH) as the internal loading control for normalization. The protocol was performed according to the manufacturer's specifications, using a QuantStudio 7 flex real-time PCR system (Applied Biosystems).
Data Analysis
Intracellular calcium levels were expressed as a ratio of two excitation wavelengths (340/380 nm). For all time traces, the baseline was defined as the average of the first three readings before agonist injection. The baseline was subtracted from each subsequent time point to determine the relative increase in calcium fluorescence. The peak PAR2 response was calculated as the average of the three highest readings between 15 and 40 s (Fig. 1i). The plateau PAR2 response was calculated as the area under the curve from 50 to 80 s (Fig. 1ii) (integrated fluorescence ratio). In the primary screen, we performed duplicate assays in a single well for each siRNA sample, on separate plates. To normalize results between plates, both the average peak response to the PAR2 agonist for each condition (Fig. 1i) and the averaged integrated plateau response (Fig. 1ii) were divided by the corresponding average response for all mock transfected wells (six wells) on that plate. All other values are expressed as mean ± SEM.
Intracellular calcium time traces shown in Figures 4 and 5 collected data for 150 s but we have only presented the first 80 s, the duration of the PAR2-dependent response, excluding the GSK1016790A response for clarity. The area under the curve from 50 to 80 s was calculated, and significance was tested by using a one-way ANOVA with a Dunnett's post hoc test; significance was accepted when P < 0.05. All statistical analysis used Graphpad Prism 7.0. The qPCR data generated by Quantstudio 7 were normalized to the housekeeping gene GAPDH mRNA levels for each sample. The relative fold change of mRNA levels was compared with the mock transfection conditions, with a value of 1 indicating that the target had the same mRNA level as in the mock transfection.
Z′-factor calculations
The Z′ factor is a statistical measure of the difference between positive and negative controls that is adjusted to take into account variation of each control. This is used in high-throughput screening to determine whether an assay has sufficient dynamic range to identify hits as it weighs the effect size against the inherent variability in the assay.
where μp and σp are the mean and standard deviation of the plateau phase for HEK293 cells expressing TRPV4, and μn and σn are the mean and standard deviation of the plateau phase for HEK293 cells.
Coefficient of variation calculation
The coefficient of variation (CV) is a quality control metric that is used to evaluate plate-to-plate variability by reporting on the positive and negative control wells per plate. We monitored this since excessive variation in the transfection controls would mask the effect of SMARTpool siRNAs that were effective at blocking the PAR2-dependent opening of TRPV4. For siRNA screening assays, a CV <24% has been shown to have sufficient signal-to-noise ratio to be able to identify effective siRNAs.
15
Results
PAR2 Response in HEK293 Cells
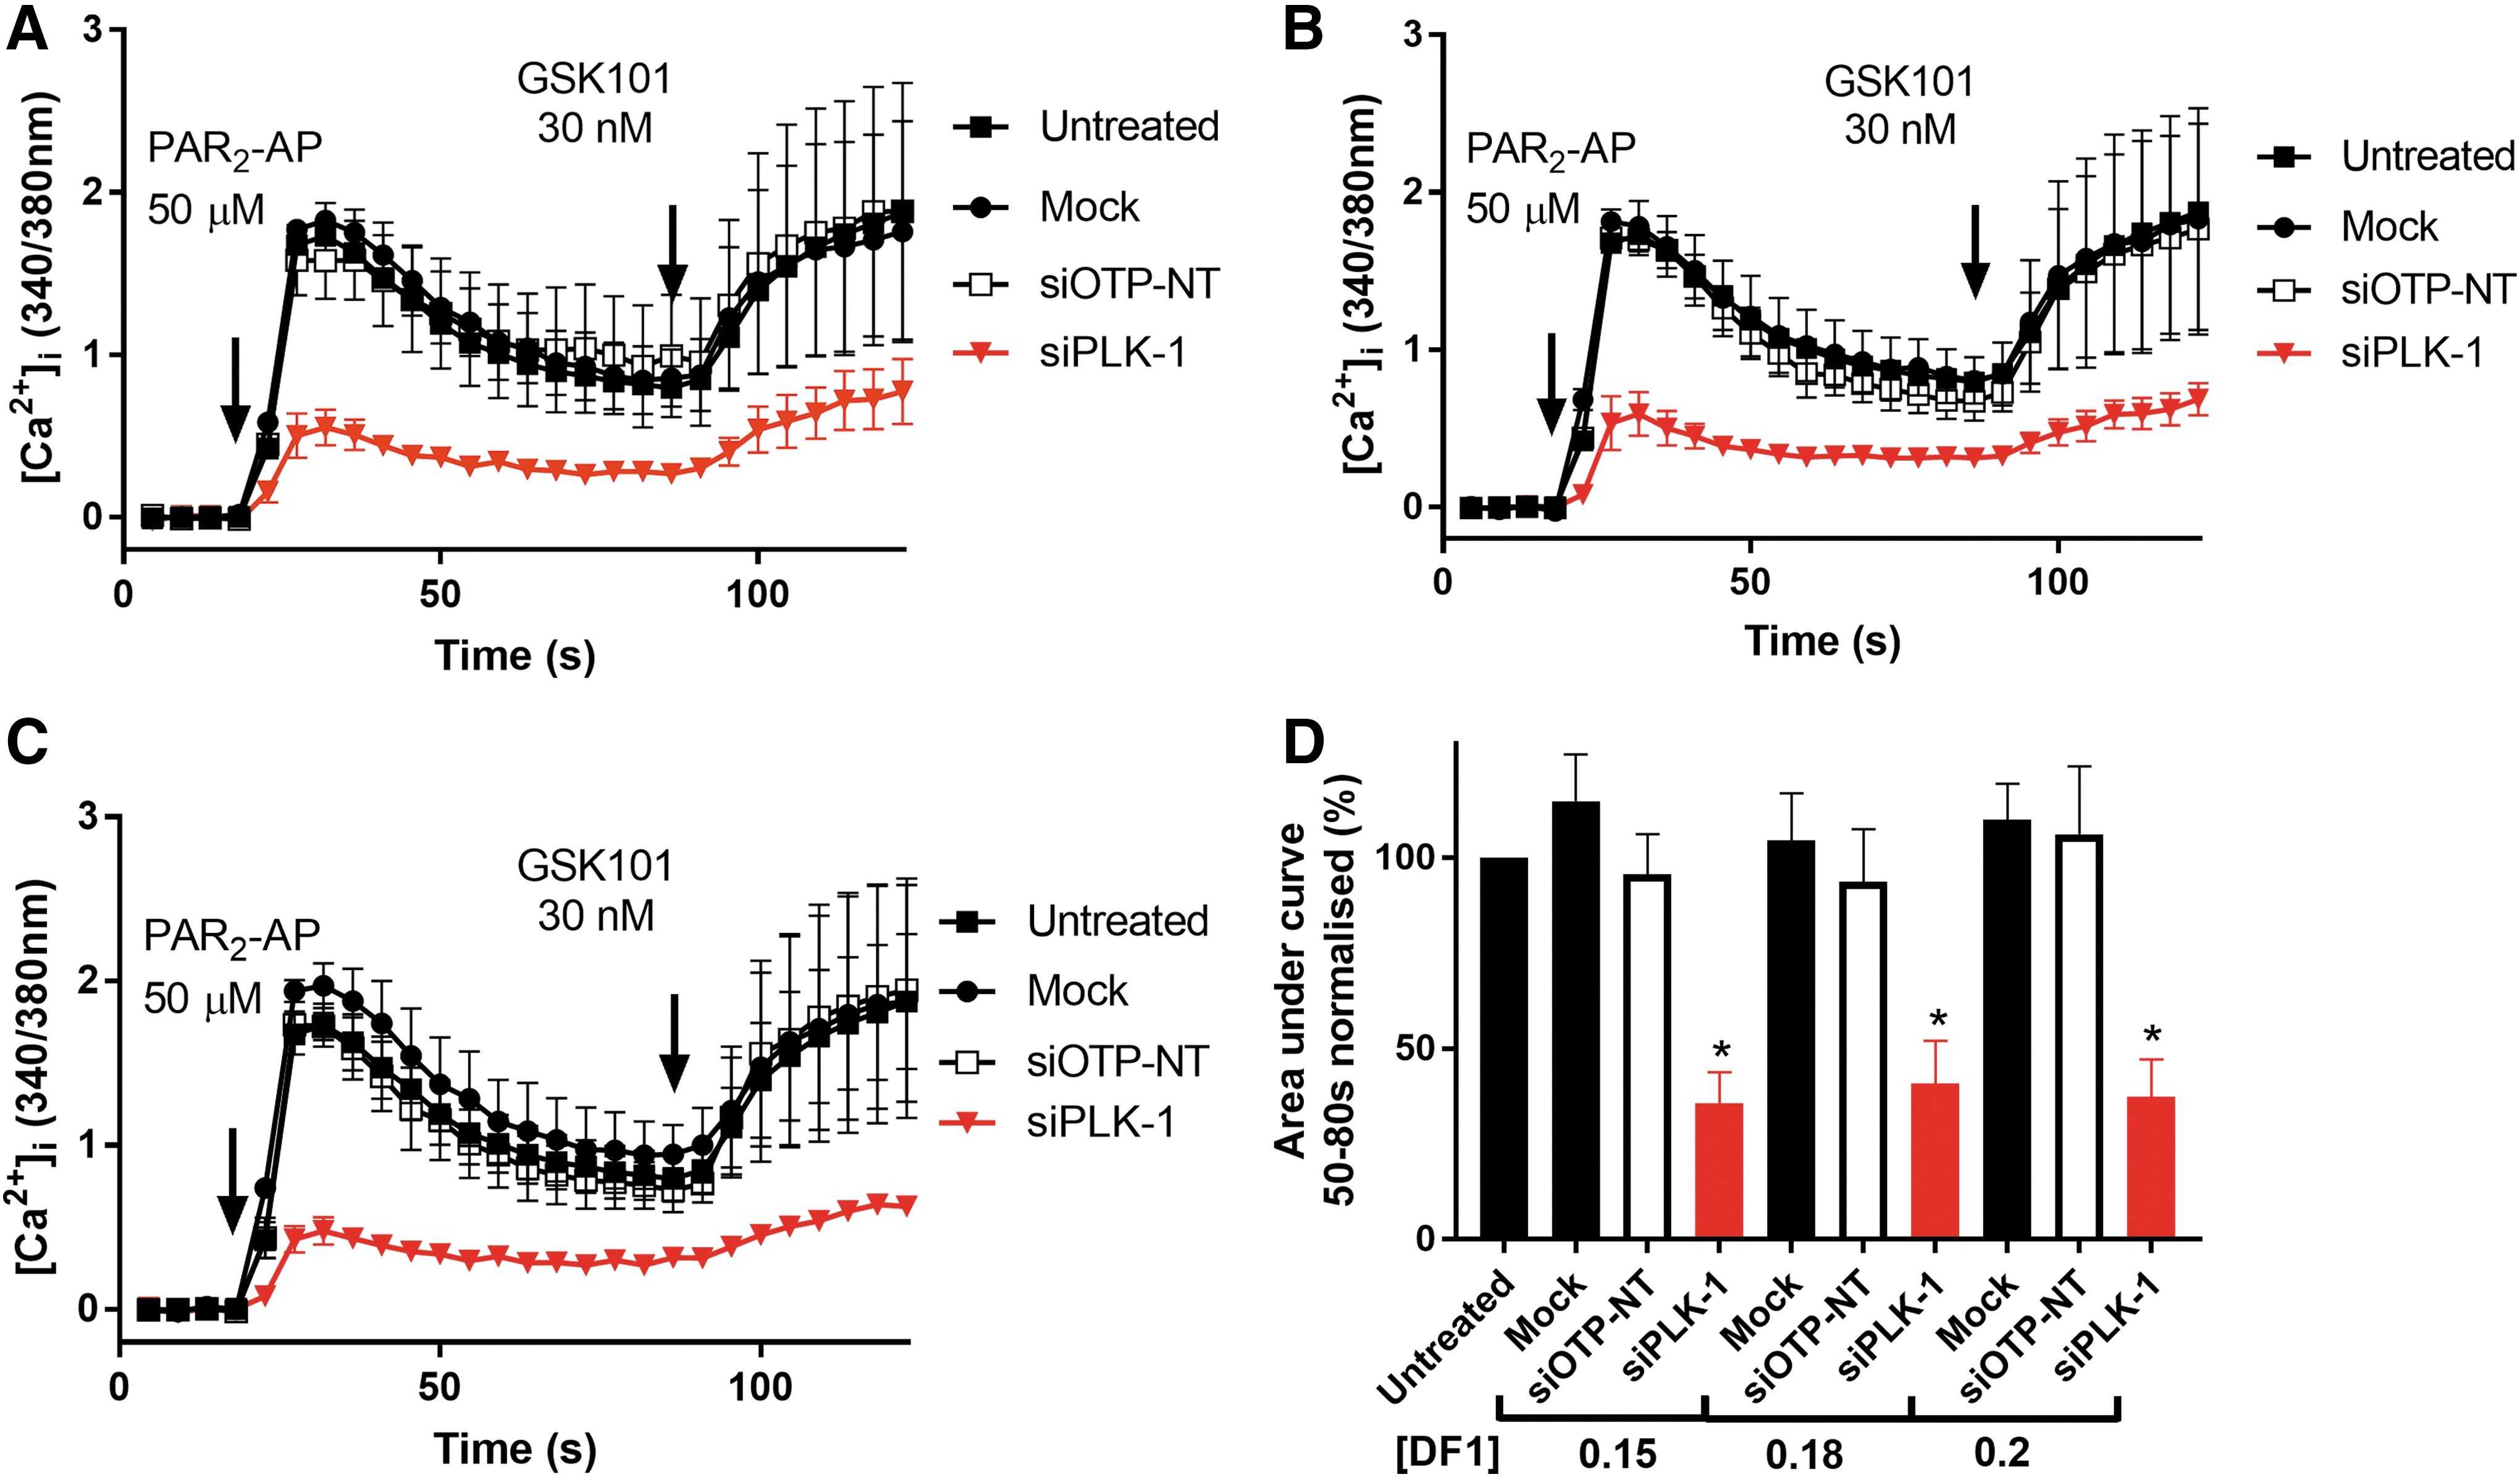
The isogenic HEK293 flip-in cell line we used enabled us to assess the function of TRPV4 in comparison to parental cells. PAR2 is endogenously expressed in these cells and when stimulated with the agonist, PAR2-AP (50 μM) it caused calcium to be released from stores, seen as a transient, initial peak (Fig. 1i). When HEK293 cells express TRPV4, stimulation with PAR2-AP caused PAR2-dependent calcium release from stores as well as a (TRPV4-dependent) sustained influx of extracellular calcium, generating a second calcium plateau, as previously described 9 (Fig. 1ii). When testing the effects of transfection of siRNAs on TRPV4, we assessed the initial peak to ensure that siRNAs were not affecting cell viability or PAR2 function. We first showed that the peak PAR2 responses of non-targeting siRNA control (siOTP-NT), mock transfected and untreated cells, were not significantly different (Fig. 3A).
We next assessed the plateau phase of the response (Fig. 1ii), since a reduction of this value would indicate inhibition of the PAR2-dependent opening of TRPV4. To prove that treatments did not affect TRPV4 function directly, we injected the TRPV4 agonist GSK1016790A (30 nM), which usually caused a large sustained influx of intracellular calcium through TRPV4 (Fig. 1iii). An increase of [Ca2+]i greater than 50% from the reading at 80 s (just before GSK1016790A injection) was considered an acceptable TRPV4 response.
Optimization of siRNA Transfection
To determine the dynamic range of the PAR2-dependent opening of TRPV4 and to confirm we would be able to identify target genes from the screen, we used two concentrations of PAR2 agonist and a Z′-factor calculation to compare their reliability. 15 We compared the HEK293-TRPV4 cells (positive control, 16 wells) with parental cells (negative control, 16 wells). The Z′-factor comparison of the plateau response of [Ca2+]i between these cell lines was performed by using two different concentrations of PAR2-AP, and we found that 30 μM PAR2-AP gave a value of 0.43 and 50 μM gave a value of 0.66. A Z′-factor greater than 0.3 is generally considered acceptable for RNAi screens 16 but a more robust response is desirable; therefore, we chose 50 μM as the treatment concentration of PAR2-AP.
We optimized the transfection conditions for the HEK293 cell line by using the DharmaFECT lipid series 1–4 and settled on DF1 as the most robust. In the absence of a biological control, we established the screening conditions by using siPLK1 (Entrez Gene ID, 5347), which induces cell death, as a technical control; cell viability was visually confirmed as a readout for reproducibility each week.
We evaluated DF1 transfection efficiency at increasing concentrations of 0.15, 0.18, and 0.2 μL/well of DF1 in a total transfection volume of 100 μL in 96-well plates. Mock transfection 0.2 μL/well did not reduce cell confluence; siPLK1 treatment reduced the cell number compared with mock transfection at all three DF1 concentrations (Fig. 2). We then compared untreated cells (untreated) with mock transfection (mock) and with a non-targeting control siRNA (siOTP-NT) and neither treatment significantly reduced the plateau phase, PAR2-dependent increase in [Ca2+]i, (mock compared with untreated, DF1 0.15 μL/well P = 0.88, 0.18 μL/well P = 0.99, 0.2 μL/well P = 0.98), (siOTP-NT compared with untreated, DF1 0.15 μL/well P = 0.99, 0.18 μL/well P = 0.91, 0.2 μL/well P = 0.97, using ANOVA as described in the Materials and Methods section) (Fig. 3A–D). By contrast, the siPLK1 control caused a significant reduction of the PAR2-dependent increase in [Ca2+]i at all three concentrations of DF1 (siPLK1 compared with untreated, DF1 0.15 μL/well P = 0.003, 0.18 μL/well P = 0.005, 0.2 μL/well P = 0.004, using ANOVA as described in the Materials and Methods section) (Fig. 3D). Therefore, we selected 0.2 μL/well of DF1 in a total transfection volume of 100 μL. Reduction in the initial PAR2 peak response by siPLK1 treatment (Fig. 3A–C) correlated with reduced cell confluence (Fig. 2). Any siRNA identified in the screen that reduced the PAR2 peak to a greater or equal extent as siPLK1 was deemed to be toxic to cells. We used the non-targeting negative control (siOTP-NT) and the apoptosis-inducing positive control (siPLK1) in columns 1 and 12 of each plate, and each assay was performed twice.
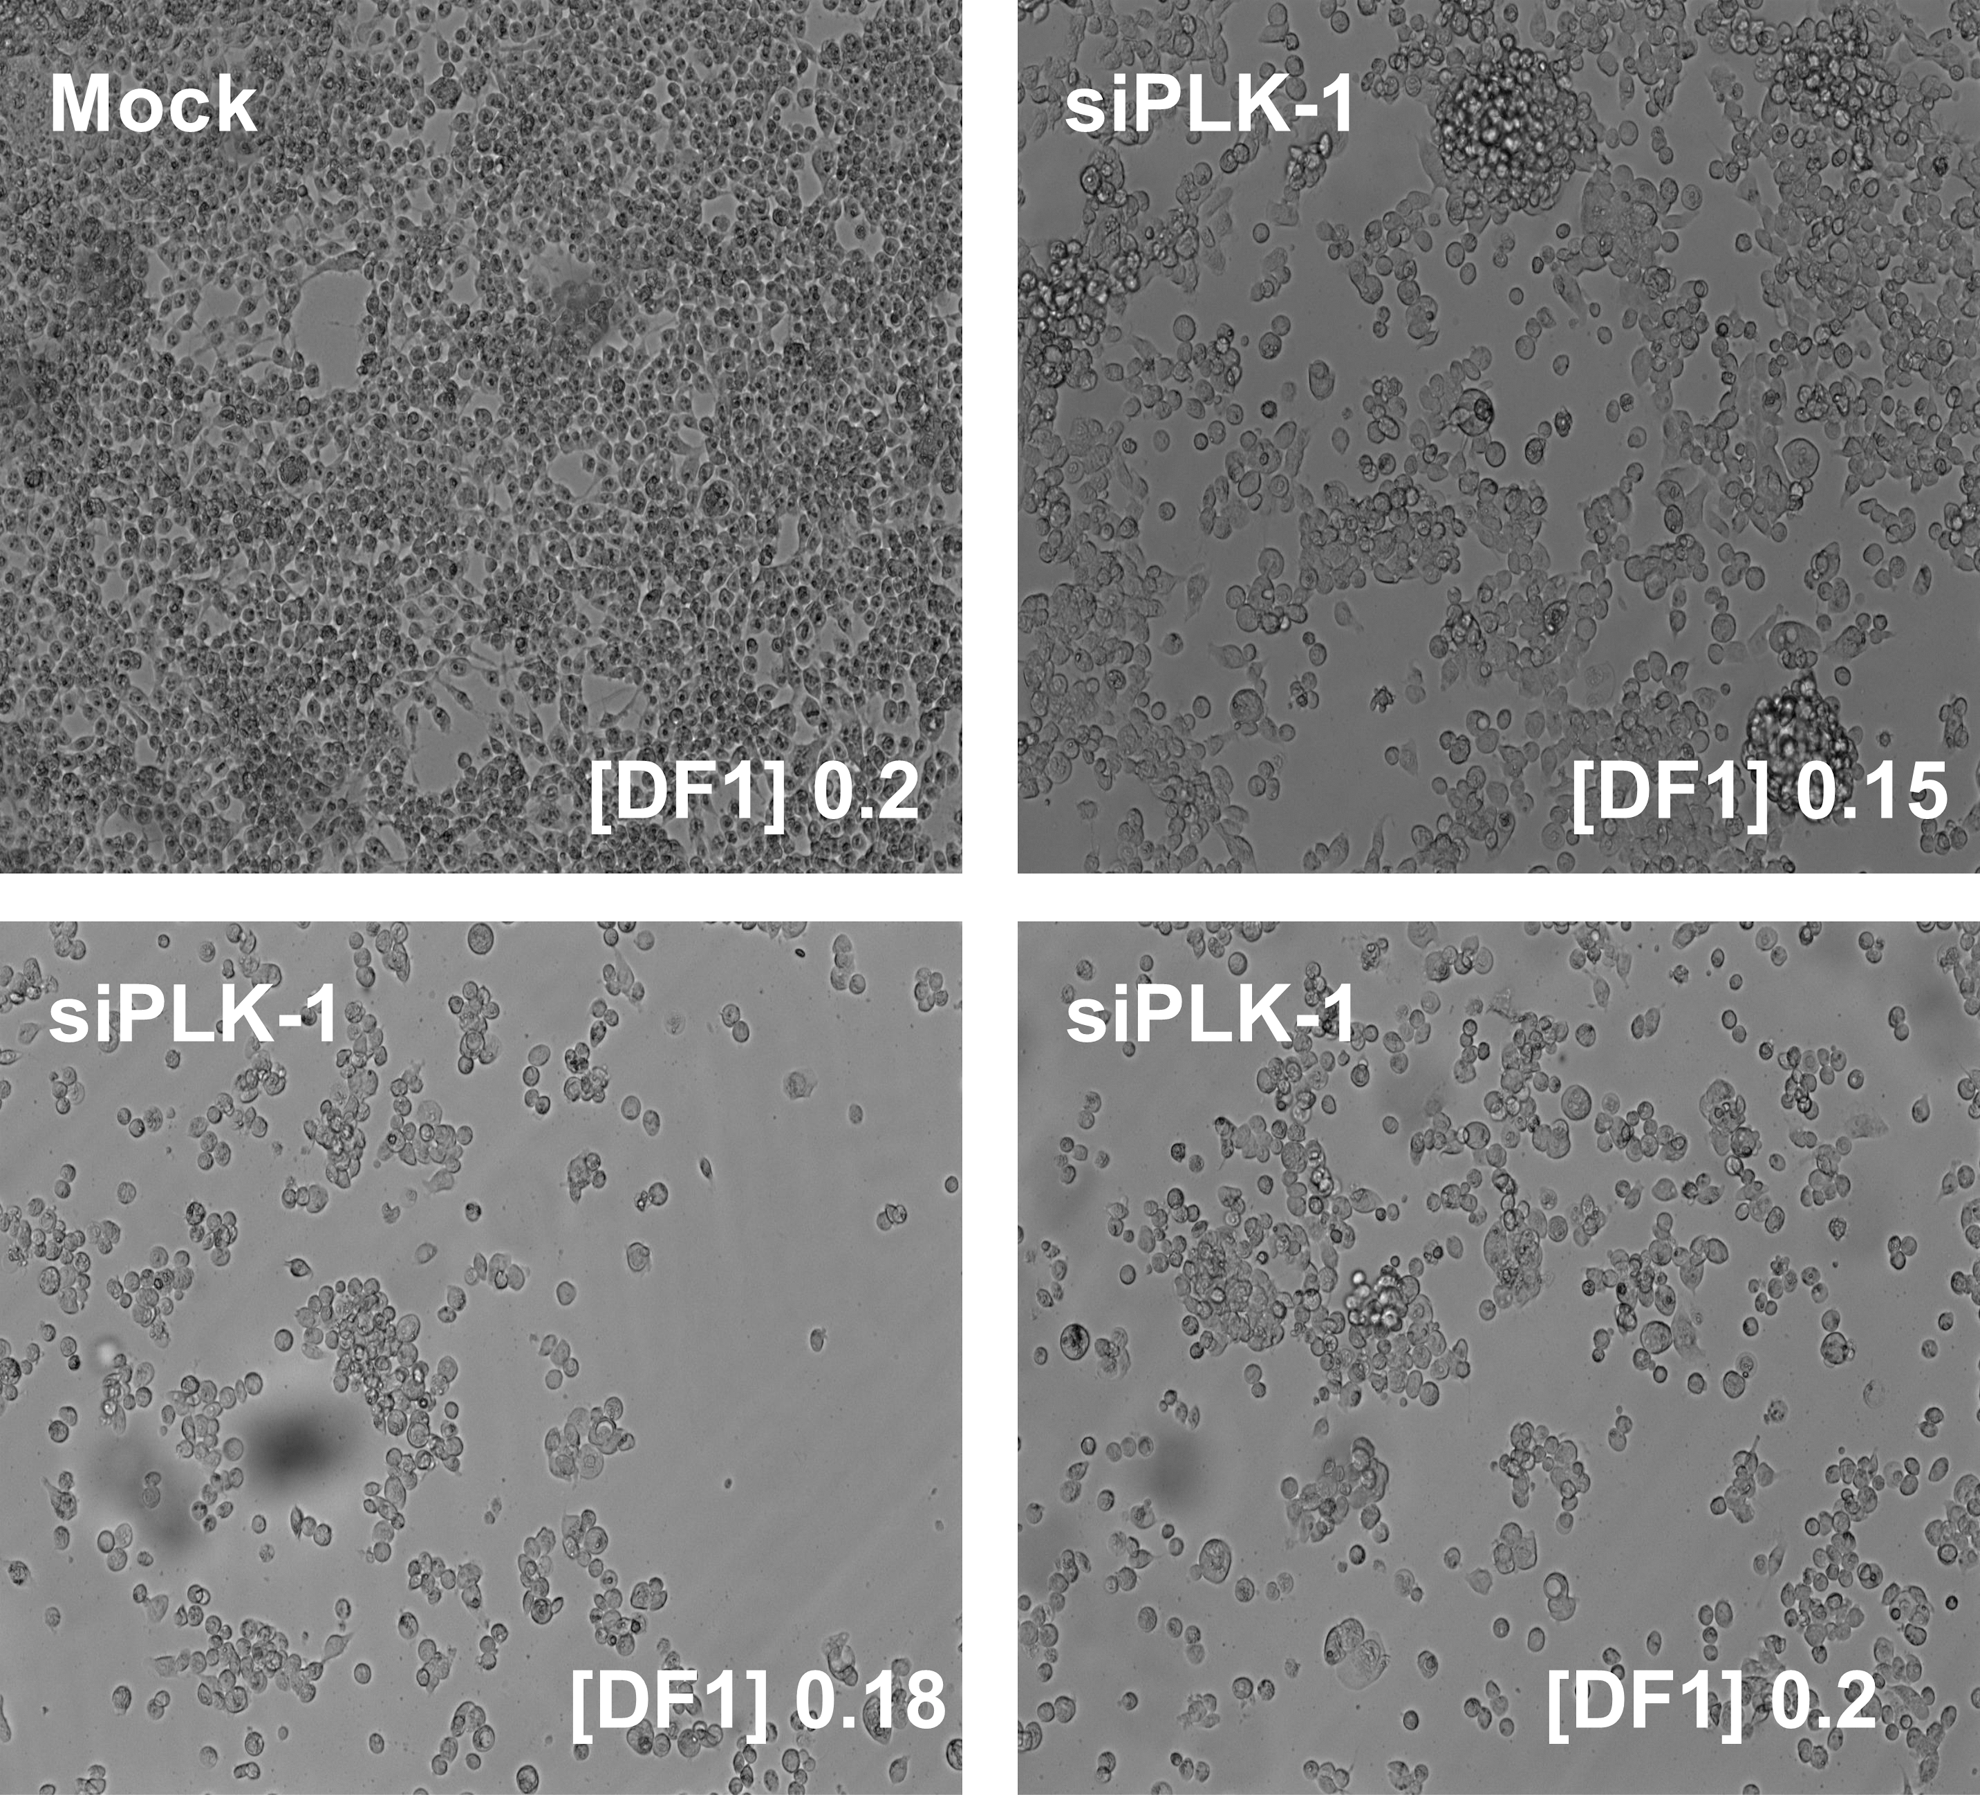
Bright-field images (40 × ) of HEK293 cells after mock transfection (top left) or treated siPLK1 with DF1 at different concentrations ([DF1] μL/well). Image taken at 72 h post-transfection after the calcium imaging assay.
siRNA transfection optimization.
Screening the Kinase siRNAs for Inhibition of PAR2-Dependent TRPV4 Opening
Primary screen
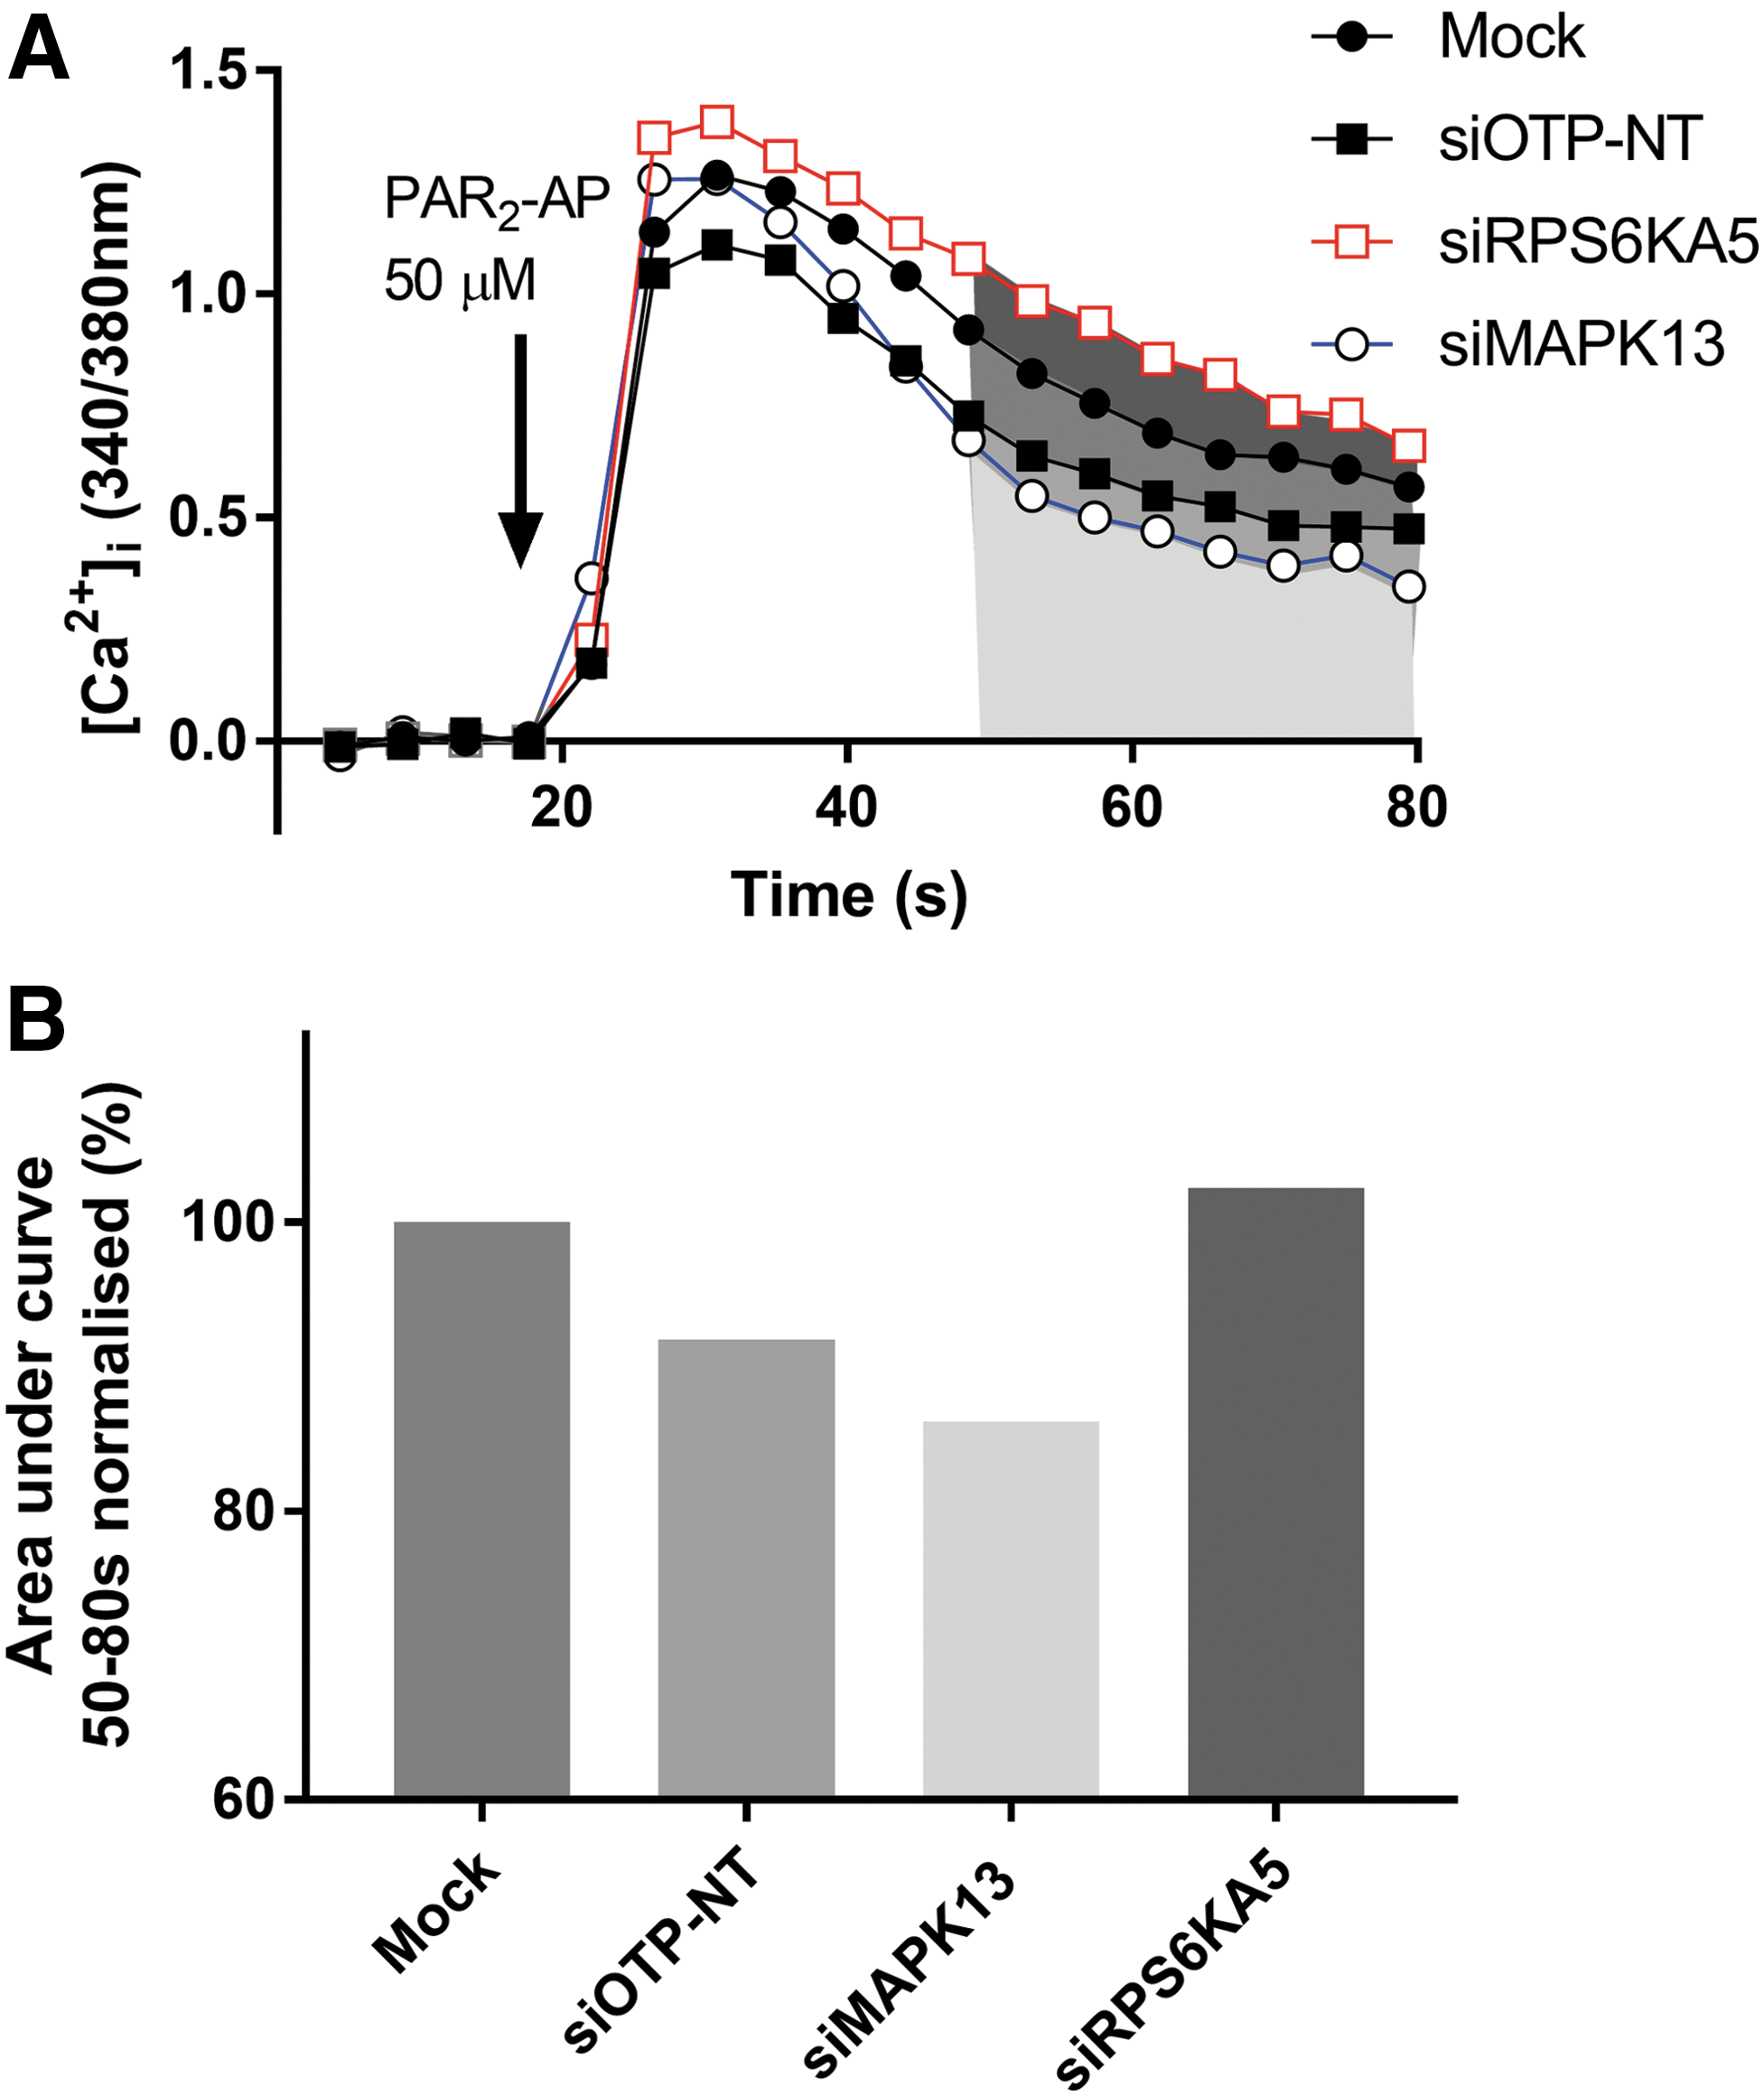
We screened 721 SMARTpool siRNAs targeting kinases in a 96-well plate format. Plates were controlled each week by inclusion of two positive (siPLK1) and two negative (siOTP-NT) controls that were compared with six mock transfections per plate. For each gene knockdown, we reviewed the calcium response curves, quantifying the PAR2 responses, the peak response from 15 to 40 s, and the plateau response as the area under the curve 50–80 s as shown in Figures 1 and 4. The effect of siOTP-NT was assessed for all representative wells across all 18 plates and when normalized to the average mock transfection control wells, we calculated a peak response of 92.8% ± 1.6%, with a CV of 7.4% (standard deviation of 6.9%) and a plateau response of 90.6% ± 1.6% with a robust CV of 7.02%, which was well within thresholds from other siRNA screens. 15 Based on the siOTP-NT response, we set the threshold for identification of an effective siRNA as having a PAR2 peak response within two standard deviations of the mean (i.e., >79%) and having a plateau response (integrated from 50 to 80 s) less than the mean plateau phase of the siOTP-NT control treatment (mean of 90%). A representative trace for cells treated with an siRNA irrelevant to TRPV4 function, RPS6KA5 (“non-hit”), shows that the siRNA had no effect on either the peak (100%) or plateau phase (102%), that is, it was not toxic to PAR2 activation and did not inhibit signaling to TRPV4 (Fig. 4A). By contrast, knockdown of siRNA for the “hit,” MAPK13, did not affect the initial PAR2 peak response (98%), but did reduce the plateau phase to 87% when normalized to mock (Fig. 4A). Values for the plateau phase were averaged and normalized to the mock transfection for assessment of the peak and plateau responses (Fig. 4B). We identified 33 genes that fell within these defined thresholds and that were ranked according to their ability to inhibit the plateau phase, the PAR2-dependent opening of TRPV4 (Table 2).
Representative trace of intracellular calcium for selected targets.
Effective Short Interfering Ribonucleic Acids from the Initial Screen of the Kinome for Signaling Molecules Between Protease-Activated Receptor 2 and Transient Receptor Potential Vanilloid-4
Entrez gene symbol and gene ID are listed alongside the peak and plateau response of [Ca2+]i to PAR2-AP (50 μM) in HEK293 cells expressing TRPV4. Duplicate responses for a given treatment were averaged and normalized to the mock transfection and expressed as a percentage. Hits were ranked by their ability to inhibit the plateau phase. The thresholds for effective siRNA treatments were a peak response >79% and a plateau response <90% of mock control.
This screen also identified two potentially toxic siRNAs: diacylglycerol kinase kappa and checkpoint kinase 1. These siRNAs reduced the initial PAR2 peak response and the GSK101 response to a similar extent as siPLK1 treatment; as these responses are independent, it indicated that knockdown of these kinases is affecting cell number in the well. However, further confirmation of cytotoxicity needs to be confirmed. The full data set is reported in the PubChem repository under AID 25549.
Confirmation of the SMARTpool siRNA Screen
We took the 33 hits from the primary SMARTpool screen and performed a secondary confirmation screen by deconvolution of the SMARTpool into its 4 constituent siRNAs. Each individual duplex siRNA was re-screened in the same assay, and they were scored by using the same defined thresholds identified in the primary screen. Targets were considered a high confidence hit if three or more of the siRNAs scored the same as the SMARTpool (Table 3).
Deconvolution Screen for Primary Screen Hits
Targets were given a confidence ranking dependent on the number of effective individual duplex siRNAs identified from each SMARTpool (out of 4) when measuring PAR2-dependent opening of TRPV4.
Confirmation of High-Confidence Hits
After the SMARTpool deconvolution, we identified four high-confidence hits: BUB1 (budding uninhibited by benzimidazoles 1), ITPK1 (inositol tetrakisphosphate 1-kinase), WNK4, and MAPK13, which are involved in the PAR2-dependent opening of TRPV4. To further validate these hits, we returned to the SMARTpool siRNA format and transfected six wells per target gene to generate sufficient material for qPCR evaluation of gene expression after we measured the calcium signaling and we compared the results. Independent knockdown of ITPK1, MAPK13, and WNK4 caused a significant reduction of the PAR2-dependent opening of TRPV4 by attenuating the plateau phase Δ[Ca2+]i (Fig. 5B–D) to 49.2% ± 2.9%, 34.12% ± 2.0%, and 50.28% ± 2.4%, respectively, when normalized to mock transfection (compared with siOTP-NT by using ANOVA as described in the Materials and Methods section: ITPK1, MAPK13, and WNK4 had P < 0.002) (Fig. 5E). Conversely, knockdown of BUB1 did not cause a significant reduction to the plateau phase in response to PAR2-AP in this assay, 63.1% ± 2.8% when normalized to mock transfection (compared with siOTP-NT using ANOVA as described in the Materials and Methods section, BUB1 P = 0.12) (Fig. 5A, E). Confirmation of on-target activity was evaluated by reverse transcription polymerase chain reaction at 72 h post-transfection. All the high-confidence targets were expressed in HEK293 cells with threshold values above controls and knockdown with siBUB1, siMAPK13, and siWNK4 significantly reduced the mRNA levels when compared with the siOTP-NT. However, knockdown of ITPK1 did not cause a significant reduction of mRNA (Table 4). Without detailed off-target analysis, we have concluded that ITPK1 and BUB1 require further validation, whereas MAPK13 and WNK4 are robust targets for modulation of TRPV4.
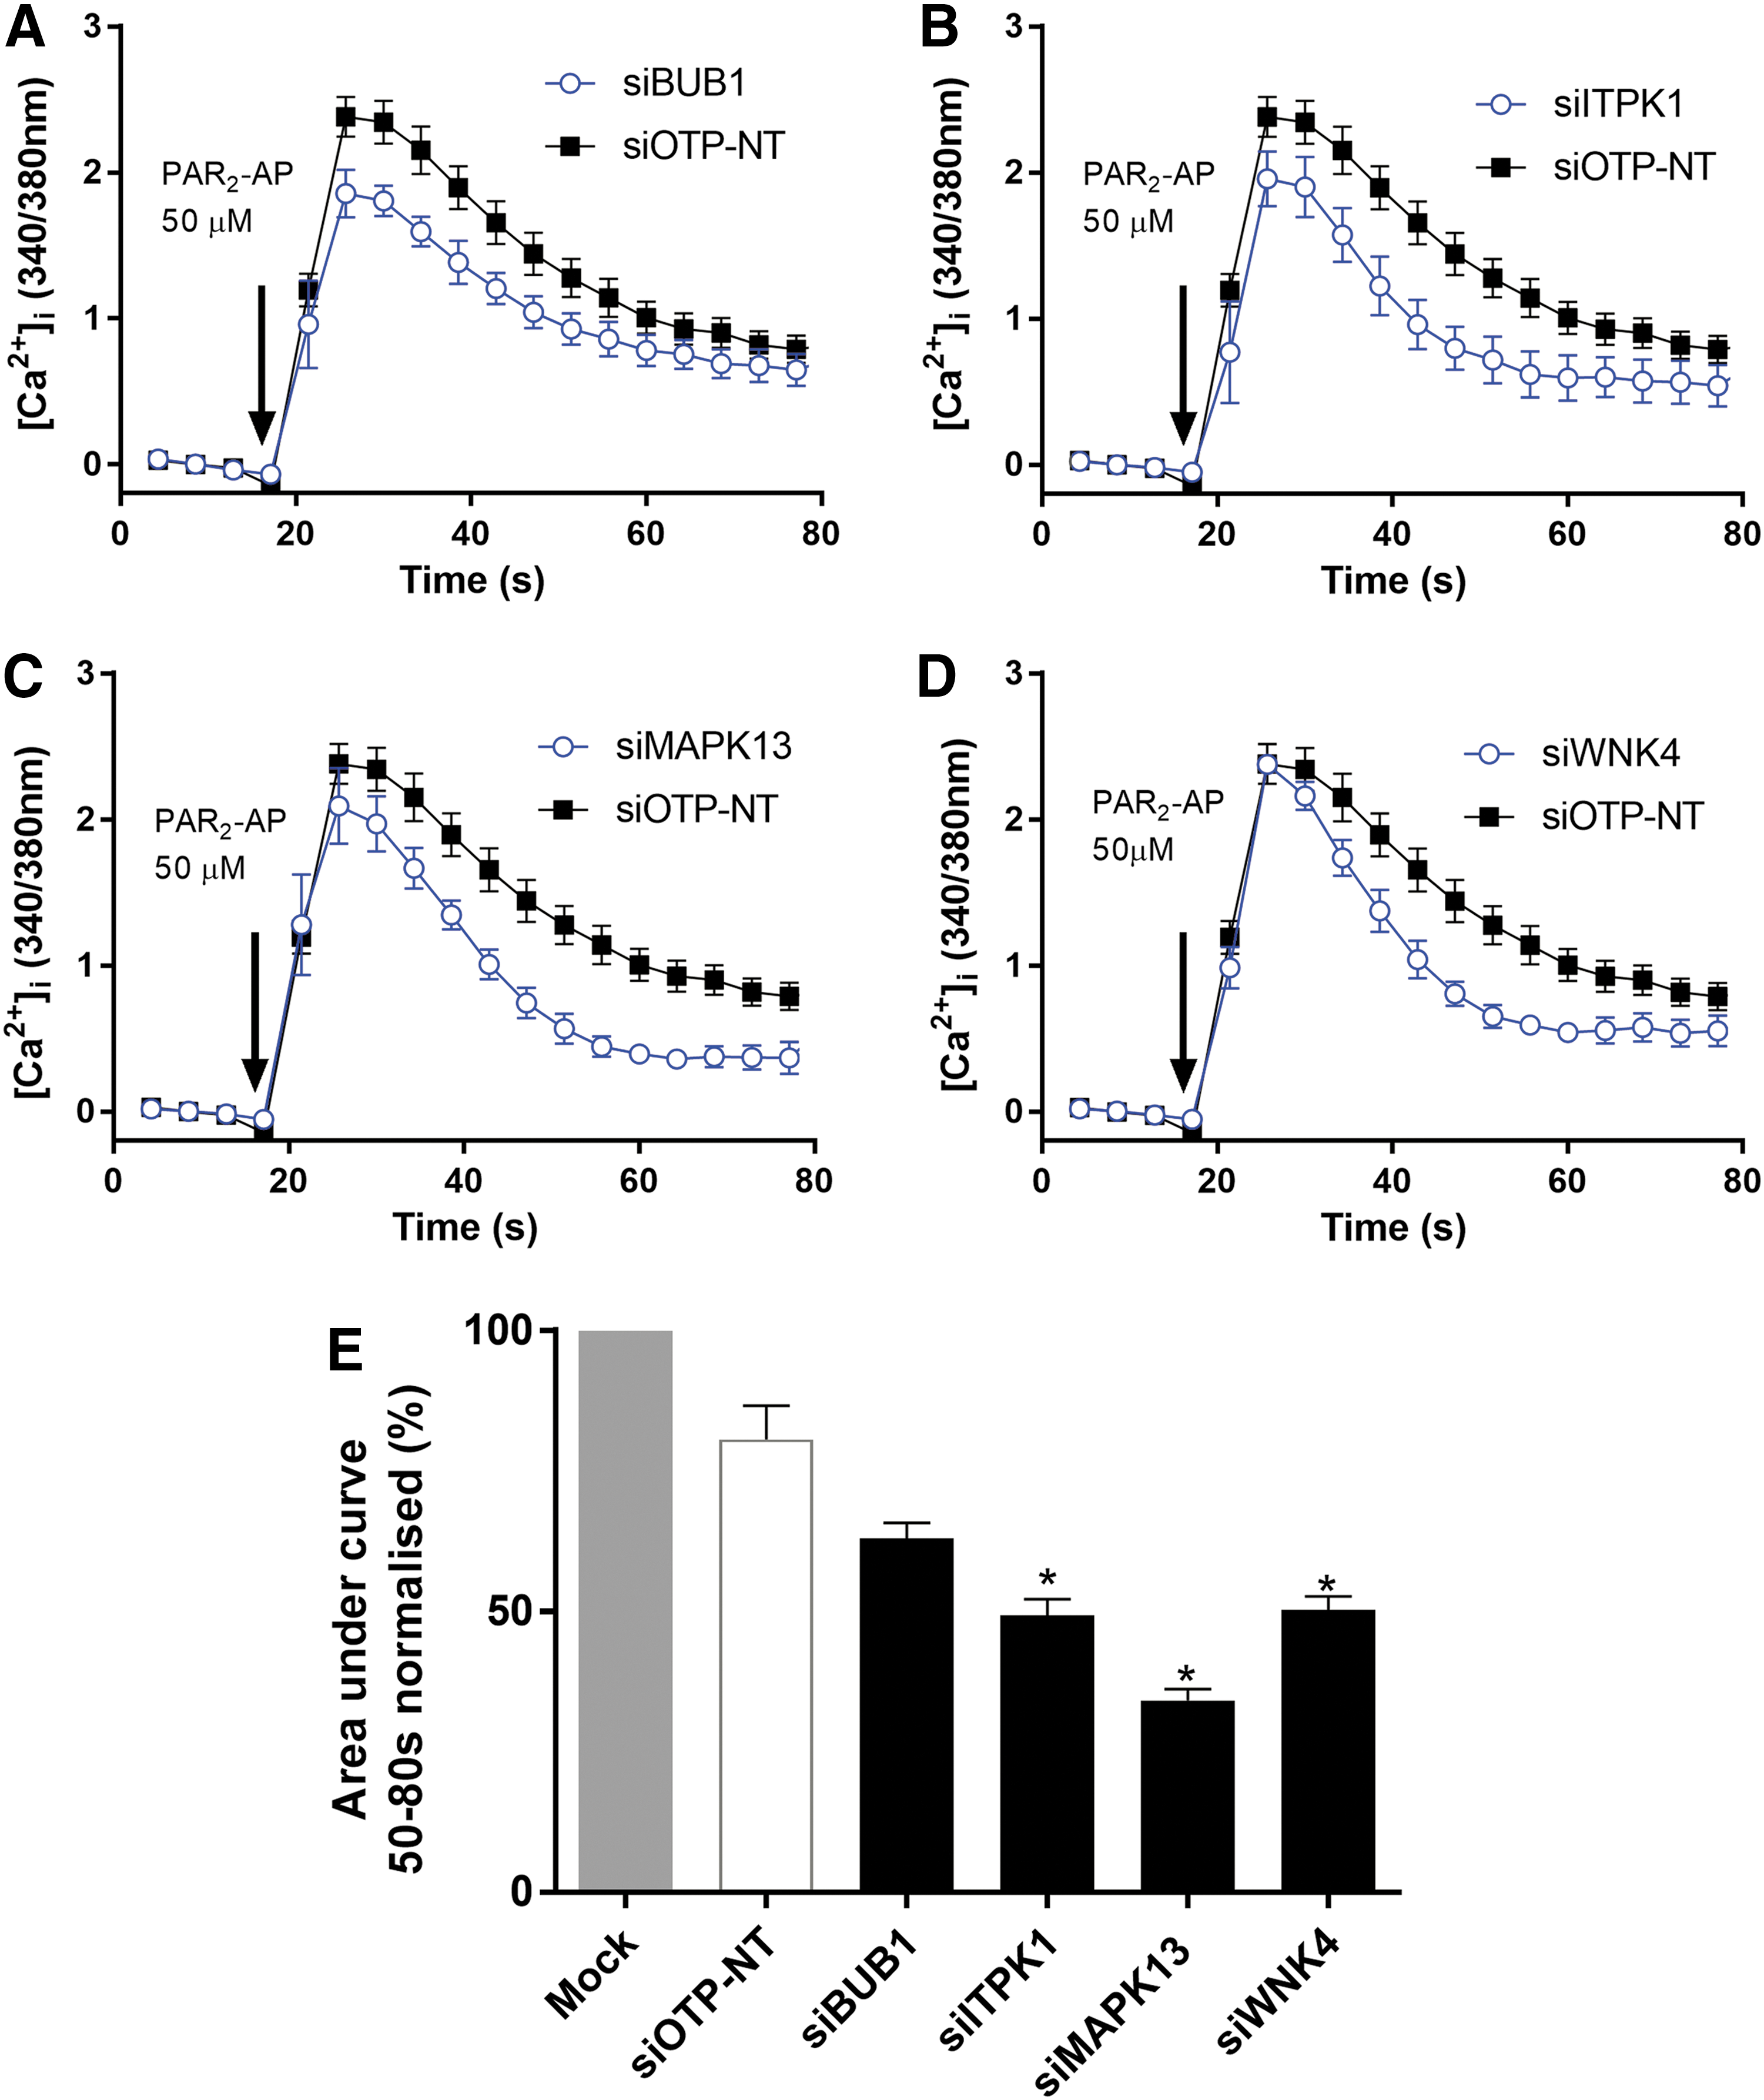
Key signaling molecules in the PAR2-dependent opening of TRPV4 in HEK293 cells. Graphs
Quantitative Polymerase Chain Reaction Data for Relative Levels of Messenger Ribonucleic Acid Expression in Human Embryonic Kidney 293 Cells Treated with Short Interfering Ribonucleic Acid for Specific Gene Targets
Significance was defined as a P < 0.05, using one-way ANOVA, Dunnett's post hoc test, N = 5.
mRNA, messenger ribonucleic acid.
Discussion
Here, we have used a real-time functional assay and siRNA knockdown to identify kinases that modulate the opening of TRPV4 by PAR2 activation in HEK293 cells. In combination with siRNA transfection, the intracellular calcium assay is even more demanding than most end-point assays, so its development required multiple steps of optimization. These included identifying optimal siRNA transfection conditions, appropriate on-plate controls for transfection and assessment of siRNA function, well-to-well variation, cell viability, and off-target effects. To reduce variation between experiments, we used cells that were thawed from frozen stocks and plated in 96-well plates for immediate use rather than maintaining and continually passaging cells in culture.
PLK1, a regulator of mitotic cell division, induces apoptosis in cancer cells 17 and was used as a control siRNA as it also killed HEK293 cells. Using siPLK1, we monitored the efficacy of transfection on each plate by measuring the remaining cell density after transfection. If the treatment with siPLK1 did not reduce the cell count by 90%, then the results from that transfection were rejected. We assessed the CV values of the PAR2 plateau responses between transfections, to ensure the assay variability was within strict parameters, CV <24% 15 so an effective difference in [Ca2+]i could be assessed. The use of these controls gave us confidence in the assay results. We have uniquely identified a screening process that is able to dissect a real-time, multiphase response, enabling us to use a systematic approach to define the processes involved and to identify molecular targets in this signaling pathway.
This study identified two kinases, MAPK13 and WNK4, as novel kinases involved in the PAR2-dependent opening of TRPV4. The approach we have used will enable identification of other signaling proteins that play an important role in opening TRP ion channels by signaling processes in HEK293 cells and in other cell types. However, we need to interpret our negative results with the understanding that a lack of inhibition from a particular SMARTpool siRNA does not prove that the target was unimportant in all cell types and assay conditions. We consider that the two genes identified in this study are likely to play an important role in the PAR2-dependent opening of TRPV4 in a variety of cell types, and we are actively investigating this possibility.
WNK4 has previously been linked to TRPV4 expression and function in hypertension, 18 and it has been shown to downregulate cell surface expression of TRPV4 in HEK293 cells. 19 We observed that the knockdown of WNK4 expression caused a decrease in the PAR2-dependent opening of TRPV4, which confirms a functional interaction between TRPV4 and WNK4.
Both MAPK13 and TRPV4 are implicated in ultra violet (UV)-induced pain 4 and are activated by UV irradiation in keratinocytes. 20 Similar to TRPV4, MAPK13 is activated by osmotic stress. 20 –22 Thus, there is a coincident activation of these proteins by the same stimuli in the same cells that have been overlooked until now.
Several hits from the confirmation screen remain to be verified but are of note. For example, the mixed-lineage kinase domain-like protein was a medium confidence hit, has been reported as a pseudokinase that has ion channel activity in HEK293 cells, 23 and has been shown to be active upstream of an ion channel TRPM7. 24
TRPV4 contains a carboxy-terminus PDZ-like domain. 25 The medium-confidence hit, microtubule-associated serine/threonine kinase 1, is a PDZ-domain binding protein, 26 which suggests a potential mode of interaction for the regulation of TRPV4 function.
Kinases such as PKC, PKA, and SGK-1, 10,13 which have been linked to TRPV4 function, were not identified as targets in this screen. Previously identified kinases that interact with TRPV4 were found by using protein interaction or activation with specific TRPV4 agonist or hypotonic stress, whereas we have uniquely focused on the PAR2-dependent opening of TRPV4, which is likely to be mechanistically different. For instance, it has been shown that inhibition of PKC did not block the PAR2-dependent opening of TRPV4. 7 In addition, the nature of the assay we describe here means that there will also be false negatives. For this reason, the genes for siRNAs that were ineffective at blocking the PAR2-dependent opening of TRPV4 were not eliminated as potential candidates but they were not prioritized in this study.
The confirmation screen, using individual deconvoluted SMARTpool siRNAs, enabled the identification of false positive siRNAs from the primary screen. However, the identification of siBUB1 as an siRNA that caused significant reduction of mRNA but did not significantly inhibit the PAR2-dependent opening of TRPV4, and siITPK1 that caused a significant reduction of PAR2-dependent opening of TRPV4 without a significant reduction in mRNA are examples of false positives. These confounding results highlighted the need for further validation of these identified targets, potentially using CRISPR sgRNA of shRNA to knock out the relevant genes, but these experiments are not within the scope of the current screen.
We have released the annotated full data set from the primary and confirmation screens on PubChem (AID 25549). The unbiased assay methodology described has uniquely enabled the identification of novel enzymes in the PAR2-TRPV4 signaling pathway, whereas previous studies have used a candidate-based approach, using small-molecule inhibitors to identify specific modulation of the pathway. Using inhibitors to investigate the PAR2-dependent opening of TRPV4 made it hard to be sure whether the effects seen were specific to the signaling molecule being inhibited because of potential lack of specificity at the high concentrations of inhibitors used; thus, they were not able to provide a clear indication of the molecular identity of the target of that inhibition. 9
This novel screening assay has helped us to identify components of the pathway by which PAR2 activation opens TRPV4 in HEK293 cells by using a screening approach. We believe that this approach will be useful to identify the upstream components of GPCR signaling that have a major role in TRPV4 opening, such as heterotrimeric G protein subunits and downstream effectors such as phospholipases. Using a functional assay screen such as the one described here is a general approach that is well suited to identifying functional components of intracellular pathways that regulate proteins that control intracellular calcium levels.
Footnotes
Acknowledgments
The authors would like to thank Dan Thomas, Jenni Luu, and Piyush Madhamshettiwar from the Victorian Centre for Functional Genomics for their help with siRNA transfections and data analysis. This work was funded by a grant from the National Health and Medical Research Council to P.M. (GNT1046860). K.J.S. is funded by the Australian Cancer Research Foundation, the Australian Phenomics Network through funding from the Australian Government's National Collaborative Research Infrastructure Strategy program, and the Peter MacCallum Cancer Centre Foundation.
Disclosure Statement
No competing financial interests exist.