
Abstract
Human pregnane X receptor (hPXR) is a nuclear receptor that regulates the expression of phase I and phase II drug-metabolism enzymes, as well as that of drug transporters. hPXR is a “xenobiotics sensor” and can be activated by structurally diverse compounds. The activation of hPXR by its agonists increases the clearance of xenobiotics by increasing the expression of drug-metabolism enzymes and drug transporters, possibly leading to drug toxicity, drug resistance, and other adverse drug reactions. Therefore, hPXR antagonists might attenuate agonist-mediated activation of hPXR and reduce the risk of adverse drug reactions. Several hPXR antagonists have been reported, but none of them is specific for hPXR. In this study, we present the first large-scale, unbiased, cell-based high-throughput screen to identify specific hPXR antagonists. Among the 132,975 compounds screened, we identified the 1,4,5-substituted 1,2,3-triazole analogs as potent and specific hPXR antagonists by sequentially performing primary screening, retesting, and dose–response analysis using cell-based hPXR gene reporter and receptor binding assays, as well as receptor and promoter specificity assays. The compound SJ000076745-1 is the most potent and specific hPXR antagonist in the 1,4,5-substituted 1,2,3-triazole chemical class, having a cell-based hPXR antagonist 50% inhibitory concentration (IC50) value of 377 ± 16 nM and an hPXR binding inhibitory IC50 value of 563 ± 40 nM.
Introduction
Human pregnane X receptor (hPXR; NR1I2), 1 also known as steroid and xenobiotic receptor 2 or pregnane-activated receptor, 3 belongs to the nuclear receptor 1I (NR1I) subfamily, along with the vitamin D receptor (VDR; NR1I1) and the constitutive androstane receptor (NR1I3). 4
hPXR is a promiscuous receptor that is activated by a wide range of chemicals, including xenobiotics such as synthetic dihydropyridine calcium antagonists 5 and the naturally occurring adenylyl cyclase activator forskolin, 6 as well as certain endobiotics, such as pregnanes 7 and bile acids. 8 A panel of 170 clinically used drugs with diverse chemical structures covering various therapeutic areas was intensively studied for cytochrome P450 3A4 (CYP3A4) induction using an hPXR-mediated transactivation assay. 9 The results demonstrated that 54% of the tested drugs induced CYP3A4 at levels ranging from 5% to 120% of the level induced by rifampicin (10 μM), which is a well-known hPXR agonist. Because hPXR interacts with structurally diverse chemicals, including numerous clinical drugs and exogenous and endogenous substances, it is recognized as a xenobiotic sensor. 10
Upon activation, hPXR induces the expression of phase I and phase II drug-metabolism enzymes, as well as phase III drug transporters, 11 that could cause an adverse drug reaction 12 or compromise the therapeutic efficacy of a drug. 13,14 hPXR antagonists might reverse an hPXR-mediated adverse drug reaction 15 or restore the therapeutic efficacy of the drug. 16 However, few hPXR antagonists have been reported, 16,17 and none of them is potent or specific to hPXR.
Both the in vitro biochemical hPXR time-resolved fluorescence resonance energy transfer (TR-FRET) binding assay 18 –20 and the hPXR cell-based gene reporter assay 21 –25 are suitable for large-scale screening of chemicals for hPXR activities. The biochemical TR-FRET binding assay measures the binding affinities of hPXR ligands, but does not distinguish agonists from antagonists. hPXR cell-based gene reporter assays have been used to measure the activity of hPXR-regulated promoters 21 –25 and can be used to identify both agonists and antagonists of hPXR.
In this study, we report the first large-scale, unbiased, cell-based high-throughput screening (HTS) aimed at identifying potent, less toxic, and specific hPXR antagonists (Fig. 1). We first screened 132,975 unique compounds with the hPXR cell-based gene reporter assay to identify putative hPXR antagonists. We then confirmed the activity of the putative hPXR antagonists and determined their 50% inhibitory concentration (IC50) values using dose–response (DR) analysis. We further evaluated the specificity of the confirmed hPXR antagonists. Our efforts led to the identification of chemicals possessing the 1,4,5-substituted 1,2,3-triazole scaffold as potent and specific hPXR antagonists. Within this chemical class, SJ000076745-1 is the most potent and specific hPXR antagonist, having a cell-based hPXR antagonist IC50 value of 377 ± 16 nM and an hPXR binding inhibitory IC50 value of 563 ± 40 nM.
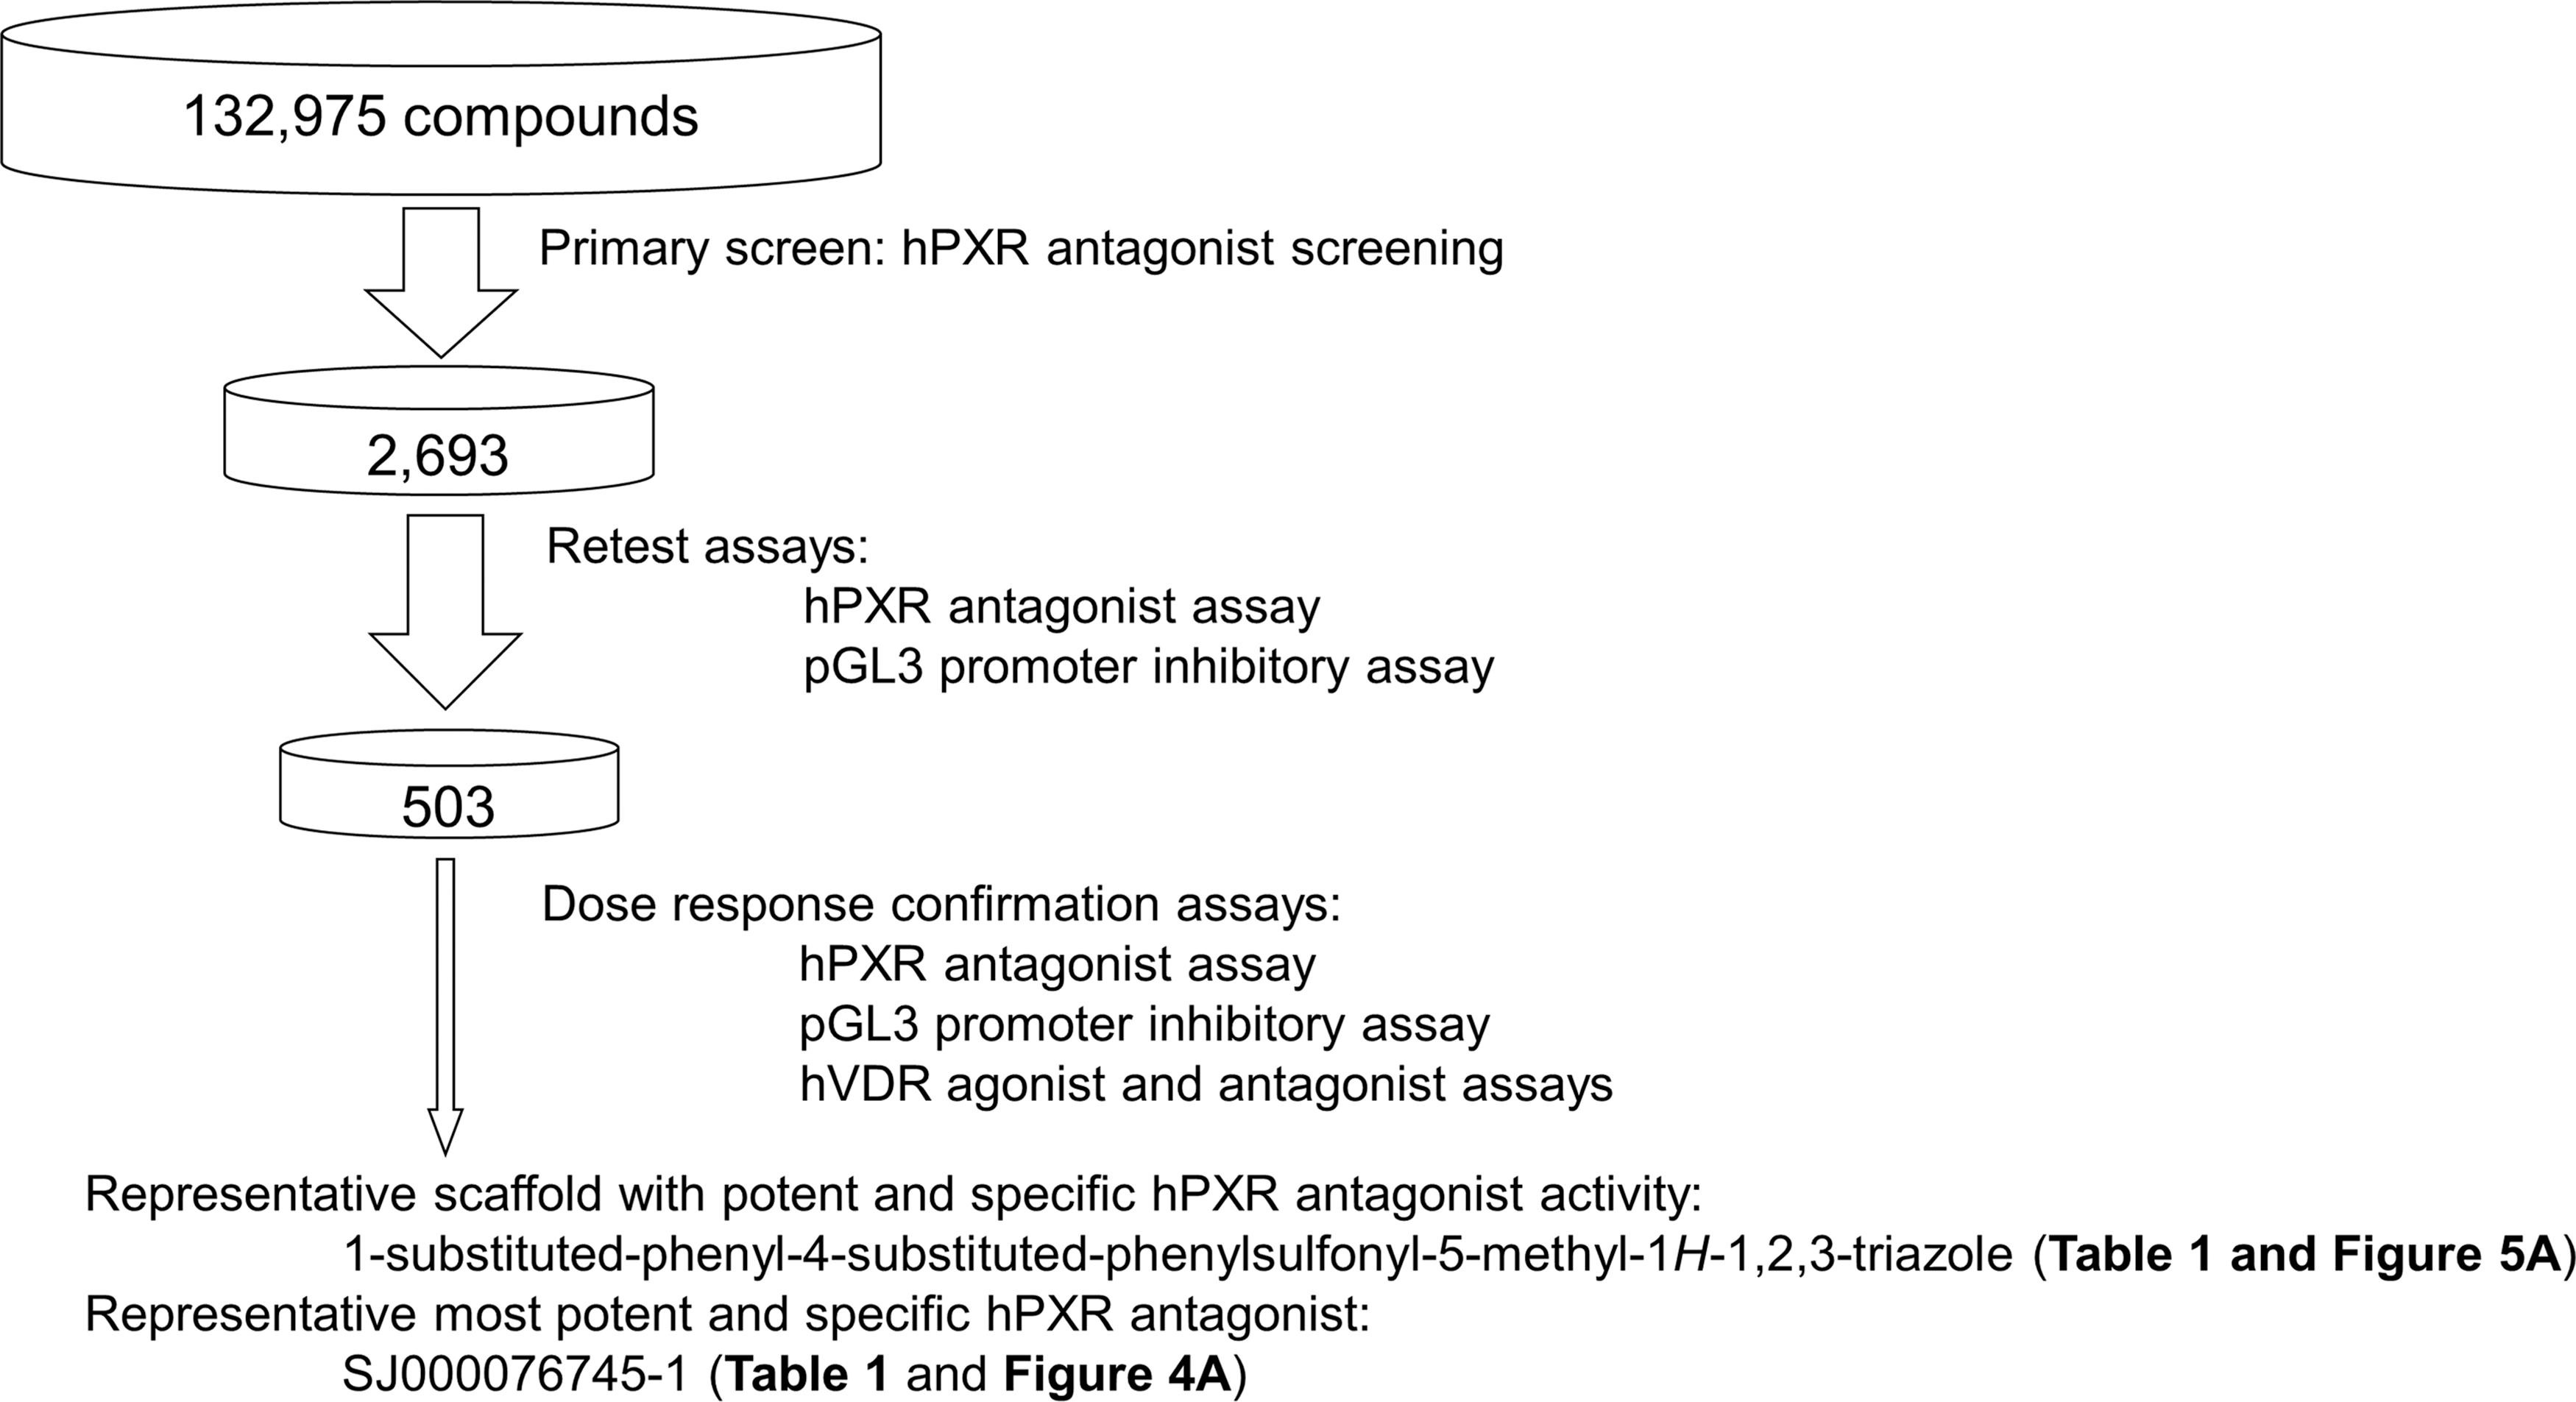
Screening flowchart for identifying potent and specific hPXR antagonists. hPXR, human pregnane X receptor.
Materials and Methods
Materials
Rifampicin, dimethyl sulfoxide (DMSO), actinomycin D, and 1α,25-dihydroxyvitamin D3 were purchased from Sigma (St. Louis, MO). White 384-well tissue culture–treated plates and steadylite™ HTS reagent were obtained from PerkinElmer (Waltham, MA). Fetal bovine serum (FBS) and charcoal/dextran-treated FBS were purchased from HyClone (Logan, UT). Modified Eagle's minimal essential medium (EMEM) was obtained from the American Type Culture Collection (ATCC, Manassas, VA). pGL3-control luciferase reporter vector and FuGENE® 6 transfection reagent were purchased from Promega (Madison, WI). All other tissue culture reagents, Tris, MgCl2, bovine serum albumin (BSA), GST-hPXR-LBD (ligand binding domain), Tb-anti-GST antibody, and 1 M DTT (dithiothreitol), were purchased from Invitrogen (Carlsbad, CA). The hPXR ligand T0901317 was purchased from Cayman Chemical (Ann Arbor, MI). All tissue culture supplies and black 384-well low-volume assay plates were obtained from Corning Life Sciences (Tewksbury, MA). BODIPY FL vindoline 20 was prepared in-house.
Compound Library, HTS, and Data Analysis
A diverse set of chemical libraries, including 132,975 unique compounds from various commercial sources (ChemDiv, ChemBridge, and Life Chemicals), were arrayed at individual concentrations of 10 mM in DMSO in 384-well polypropylene plates. 26,27 The purity of the compounds was reported by the vendors to exceed 90%. HTS was performed in a custom system with integrated automatic Liconic plate incubators, Matrix WellMate® and V&P Scientific pin-tool liquid dispensers, a Velocity11 VSpin microplate centrifuge, a PlateLoc thermal microplate sealer, plate and lid hotels, and a PerkinElmer EnVision™ plate reader. Plates were transferred between instruments by Staubli robot arms. All compound transfers were accomplished with a 384-well pin tool with various transfer capabilities (for example, 25 nL was transferred in the primary and retest screenings, with the final tested chemical concentration being 10 μM; 112.5 nL was transferred in the DR confirmation assays, with the final tested chemical concentration ranging from 45 μM to 2.3 nM at 10 concentration levels prepared by one to three serial dilutions).
To retest primary hits, compounds were plated in 384-well polypropylene plates at 10 mM in DMSO. For DR confirmation analysis, compounds were plated in 384-well polypropylene plates at concentrations of 10 mM to 0.508 μM in DMSO (one to three dilutions for 10 concentration levels). Large-scale data analyses were performed using an in-house data analysis platform as previously described. 26,27 For DR analysis, the activities of individual chemicals tested at various concentrations were normalized to the respective positive and negative controls to generate %activation (in agonist assays) and %inhibition (in antagonist and pGL3-control vector promoter inhibition assays) values. The curve-fitting software GraphPad Prism 4.0 (GraphPad Software, La Jolla, CA) was used to generate the DR curves and determine the IC50 and 50% effective concentration (EC50) values for those individual compounds displaying dose-responsive activities.
Cell Culture, Plasmids, and Transfection
All cells were maintained at 37°C in a humidified atmosphere containing 5% CO2. The HepG2 cell line was obtained from the ATCC and maintained in modified EMEM with 10% FBS, 2 mM L-glutamine, 100 units/mL penicillin, and 100 μg/mL streptomycin. HepG2 cells stably transfected with FLAG-tagged human PXR (FLAG-hPXR) and an hPXR-regulated CYP3A4 promoter luciferase reporter (CYP3A4-luc) (referred to as HepG2 Clone 1 cells), as described previously, 21 were maintained in modified EMEM from the ATCC with 10% FBS supplemented with 800 μg/mL Geneticin® (G418). Transfections were performed using FuGENE 6 according to the manufacturer's instructions. For transient transfection–based assays, HepG2 cells were first transfected, then beginning at 24 h post-transfection, they were treated with compounds for a further 24 h before a luciferase assay was performed.
hPXR Antagonist Assay
HepG2 Clone 1 cells 21 were used in the hPXR antagonist assay for the primary screen aimed at identifying hPXR antagonists. Briefly, test chemicals (at a final concentration of 10 μM) were added to the wells of white 384-well tissue culture–treated plates (with each well containing 2 μM rifampicin added immediately before the test compound) with 5,000 cells in 25 μL of phenol red–free Dulbecco's modified Eagle's medium (DMEM) supplemented with 5% charcoal/dextran-treated FBS. The plates were incubated for 24 h at 37°C and then a luciferase assay was performed using steadylite HTS reagent (PerkinElmer Life Sciences). The final DMSO concentration was 0.2% for all assay wells. The luminescence signal was detected using an EnVision plate reader (PerkinElmer Life Sciences). Rifampicin alone (2 μM, with a final DMSO concentration of 0.2%) was used as the negative control (0% inhibition), and DMSO alone (0.2%) was used as the positive control (100% inhibition). The activities of individual chemicals tested at 10 μM concentrations were normalized to the corresponding positive and negative controls to generate the %inhibition in the antagonist screening: %inhibition = 100% × (2 μM rifampicin signal − compound signal)/(2 μM rifampicin signal − DMSO signal). A total of 2,693 compounds with %inhibitions of 50% or greater were selected as primary screening hits (putative hPXR antagonists) and retested to eliminate nonspecific hits with activities arising from cytotoxicity or nonspecific transcription repression. The same hPXR antagonist assay was used in the retest and also in the DR analysis. Different concentrations of test chemicals (ranging from 45 μM to 2.3 nM, prepared using one to three serial dilutions for 10 concentration levels) with rifampicin (5 μM), along with controls in the form of rifampicin alone (5 μM, as a negative control [0% inhibition]) or DMSO alone (0.9%, as a positive control [100% inhibition]), were added to the wells of white 384-well tissue culture–treated plates with 5,000 HepG2 Clone 1 cells in 25 μL of phenol red–free DMEM supplemented with 5% charcoal/dextran-treated FBS. The plates were then incubated for 24 h at 37°C before a luciferase assay was performed using steadylite HTS reagent. The final DMSO concentration was 0.9% for all assay wells. The luminescence signal was detected using an EnVision plate reader. Rifampicin (5 μM, with a final DMSO concentration of 0.9%) was used as the negative control (0% inhibition), and DMSO (0.9%) was used as the positive control (100% inhibition).
hPXR Agonist Assay
Different concentrations of test chemicals (40 μM to 1.2 nM, prepared using 1-to-2 dilutions for 16 concentration levels), rifampicin (10 μM, positive control [100% activation]), or DMSO (0.40%, negative control [0% activation]) were added to the wells of white 384-well tissue culture–treated plates with 5,000 HepG2 Clone 1 cells in 25 μL of phenol red–free DMEM supplemented with 5% charcoal/dextran-treated FBS. The plates were then incubated for 24 h at 37°C before a luciferase assay was performed using steadylite HTS reagent. The final DMSO concentration was 0.40% for all assay wells. The luminescence signal was detected using an EnVision plate reader. The activities of individual chemicals were normalized to the positive and negative controls to generate the %activation, as described previously. 21,28
pGL3-Control Vector Promoter Inhibition Assay
Forty million HepG2 cells were seeded in a T150 flask in 30 mL EMEM supplemented with 10% FBS, penicillin, and streptomycin. The cells were grown overnight to ∼85% confluence. They were then rinsed with PBS, replenished with 30 mL EMEM supplemented with 10% FBS but without antibiotics, and transiently transfected overnight with 15 μg of pGL3-control vector (in which the luciferase gene is constitutively expressed under the control of the SV40 promoter) mixed with 45 μL FuGENE 6 in 1.5 mL blank Opti-MEM® I medium according to the manufacturer's instructions. The transfected cells were then harvested and seeded in 384-well plates. Test chemicals (at a final concentration of 10 μM), actinomycin D (2 μM, as a positive control [100% inhibition]), or DMSO (0.1%, as a negative control [0% inhibition]) were added to the wells of white 384-well tissue culture–treated plates with 5,000 HepG2 cells transiently transfected with pGL3-control vector in 25 μL of phenol red–free DMEM supplemented with 5% charcoal/dextran-treated FBS. The plates were then incubated for 24 h at 37°C before a luciferase assay was performed using steadylite HTS reagent. The final DMSO concentration was 0.1% for all assay wells. The luminescence signal was detected using an EnVision plate reader. The activities of the individual chemicals tested were normalized to the corresponding positive and negative controls to generate the %inhibition. Those hits with %inhibition of 50% or less were selected for further analysis.
The same assay was also used for DR analysis. Different concentrations of test chemicals (ranging from 45 μM to 2.3 nM, prepared using one to three serial dilutions for 10 concentration levels), actinomycin D (2 μM, with 0.45% DMSO, as a positive control [100% inhibition]), or DMSO (0.45%, as a negative control [0% inhibition]) were added to the wells of white 384-well tissue culture–treated plates with 5,000 HepG2 cells transiently transfected with pGL3-control vector in 25 μL of phenol red–free DMEM supplemented with 5% charcoal/dextran-treated FBS. The plates were then incubated for 24 h at 37°C before a luciferase assay was performed using steadylite HTS reagent. The final DMSO concentration was 0.45% for all assay wells. The luminescence signal was detected using an EnVision plate reader.
Human VDR Agonist and Antagonist Assays
Forty million HepG2 cells were seeded in a T150 flask in 30 mL EMEM supplemented with 10% FBS, penicillin, and streptomycin. The cells were grown overnight to ∼85% confluence, rinsed with PBS, and replenished with 30 mL EMEM supplemented with 10% FBS and without antibiotics. The cells were then transfected overnight with pCMV-human vitamin D receptor (hVDR) and CYP3A4-luc 21 in FuGENE 6. For each T150 flask, the plasmid–lipid complex was formed with 0.75 μg pCMV-hVDR plasmid, 14.25 μg CYP3A4-luc plasmid, and 45 μL FuGENE 6 in 1.5 mL blank Opti-MEM I medium according to the manufacturer's instructions. The transiently transfected cells were then harvested and seeded in 384-well plates. Different concentrations of test chemicals (ranging from 45 μM to 2.3 nM, prepared using one to three dilutions for 10 concentration levels) either alone (for the agonist assay) or together with 2 nM 1α,25-dihydroxyvitamin D3 (for the antagonist assay), along with 1α,25-dihydroxyvitamin D3 (2 or 100 nM) and DMSO (as controls), were added to individual wells of white 384-well tissue culture–treated plates with 5,000 HepG2 cells transiently transfected with pCMV-VDR and CYP3A4-luc 21 plasmids in 25 μL of phenol red–free DMEM supplemented with 5% charcoal/dextran-treated FBS. The plates were then incubated for 24 h at 37°C before a luciferase assay was performed using steadylite HTS reagent. The final DMSO concentration was 0.45% (for the agonist assay) or 0.9% (for the antagonist assay) for all assay wells. The luminescence signal was detected using an EnVision plate reader. In the agonist assay, 1α,25-dihydroxyvitamin D3 (100 nM with a final DMSO concentration of 0.45%) was used as the positive control (100% activation), and DMSO (0.45%) was used as the negative control (0% activation). In the antagonist assay, DMSO (0.9%) was used as the positive control (100% inhibition), and 1α,25-dihydroxyvitamin D3 (2 nM with a final DMSO concentration of 0.9%) was used as the negative control (0% inhibition).
TR-FRET hPXR Binding Assay
The TR-FRET hPXR binding assay was performed as previously described, 20 with only minor modifications. Briefly, in black 384-well low-volume assay plates, 1-to-2 serially diluted preparations of T0901317, SJ000076727-1, SJ000076730-1, SJ000076739-1, SJ000076741-1, or SJ000076745-1, along with DMSO and 10 μM T0901317 controls, were incubated with 100 nM BODIPY FL vindoline, 5 nM GST-hPXR-LBD, and 5 nM Tb-anti-GST in 20 μL/well assay buffer (50 mM Tris pH 7.5, 20 mM MgCl2, 0.1 mg/mL BSA, 0.05 mM DTT) for 30 min. TR-FRET signals (10,000 × 520 nm/490 nm) were then collected with a PHERAstar® FS plate reader (BMG Labtech, Durham, NC), using a 340-nm excitation filter, a 100-μs delay time, and a 200-μs integration time. The final DMSO concentration was 1.1% for all assay wells. The signal values from 10 μM T0901317 and DMSO were used as positive (100% inhibition) and negative (0% inhibition) controls, respectively. The activity of each well was normalized to that of the positive and negative controls, and the normalized results for each chemical were fitted into a single-site competitive-binding equation with GraphPad Prism to derive the IC50 values. In the test, the positive control T0901317 had an IC50 value of 104 ± 6 nM, which is consistent with the IC50 value of 101.6 nM under similar assay conditions reported in the literature. 20
Results
Primary Screen to Identify Putative hPXR Antagonists
We used a cell-based assay to identify hPXR antagonists. HepG2 Clone 1 cells, which were stably transfected with FLAG-hPXR and the hPXR-regulated CYP3A4-luc reporter, as previously described, 21,28 responded to the hPXR agonist rifampicin in a dose-responsive manner. This hPXR-driven CYP3A4-luc reporter system has been widely used to reliably characterize known hPXR agonists, 9,11,21 known hPXR antagonists (such as ketoconazole), 11 and novel hPXR ligands. 9,29 Figure 2 shows a representative DR curve for rifampicin in HepG2 Clone 1 cells, with a maximal signal-to-background ratio of 4.7. The mean EC50 value was 1.45 ± 0.12 μM across the primary and DR screens, as discussed below.
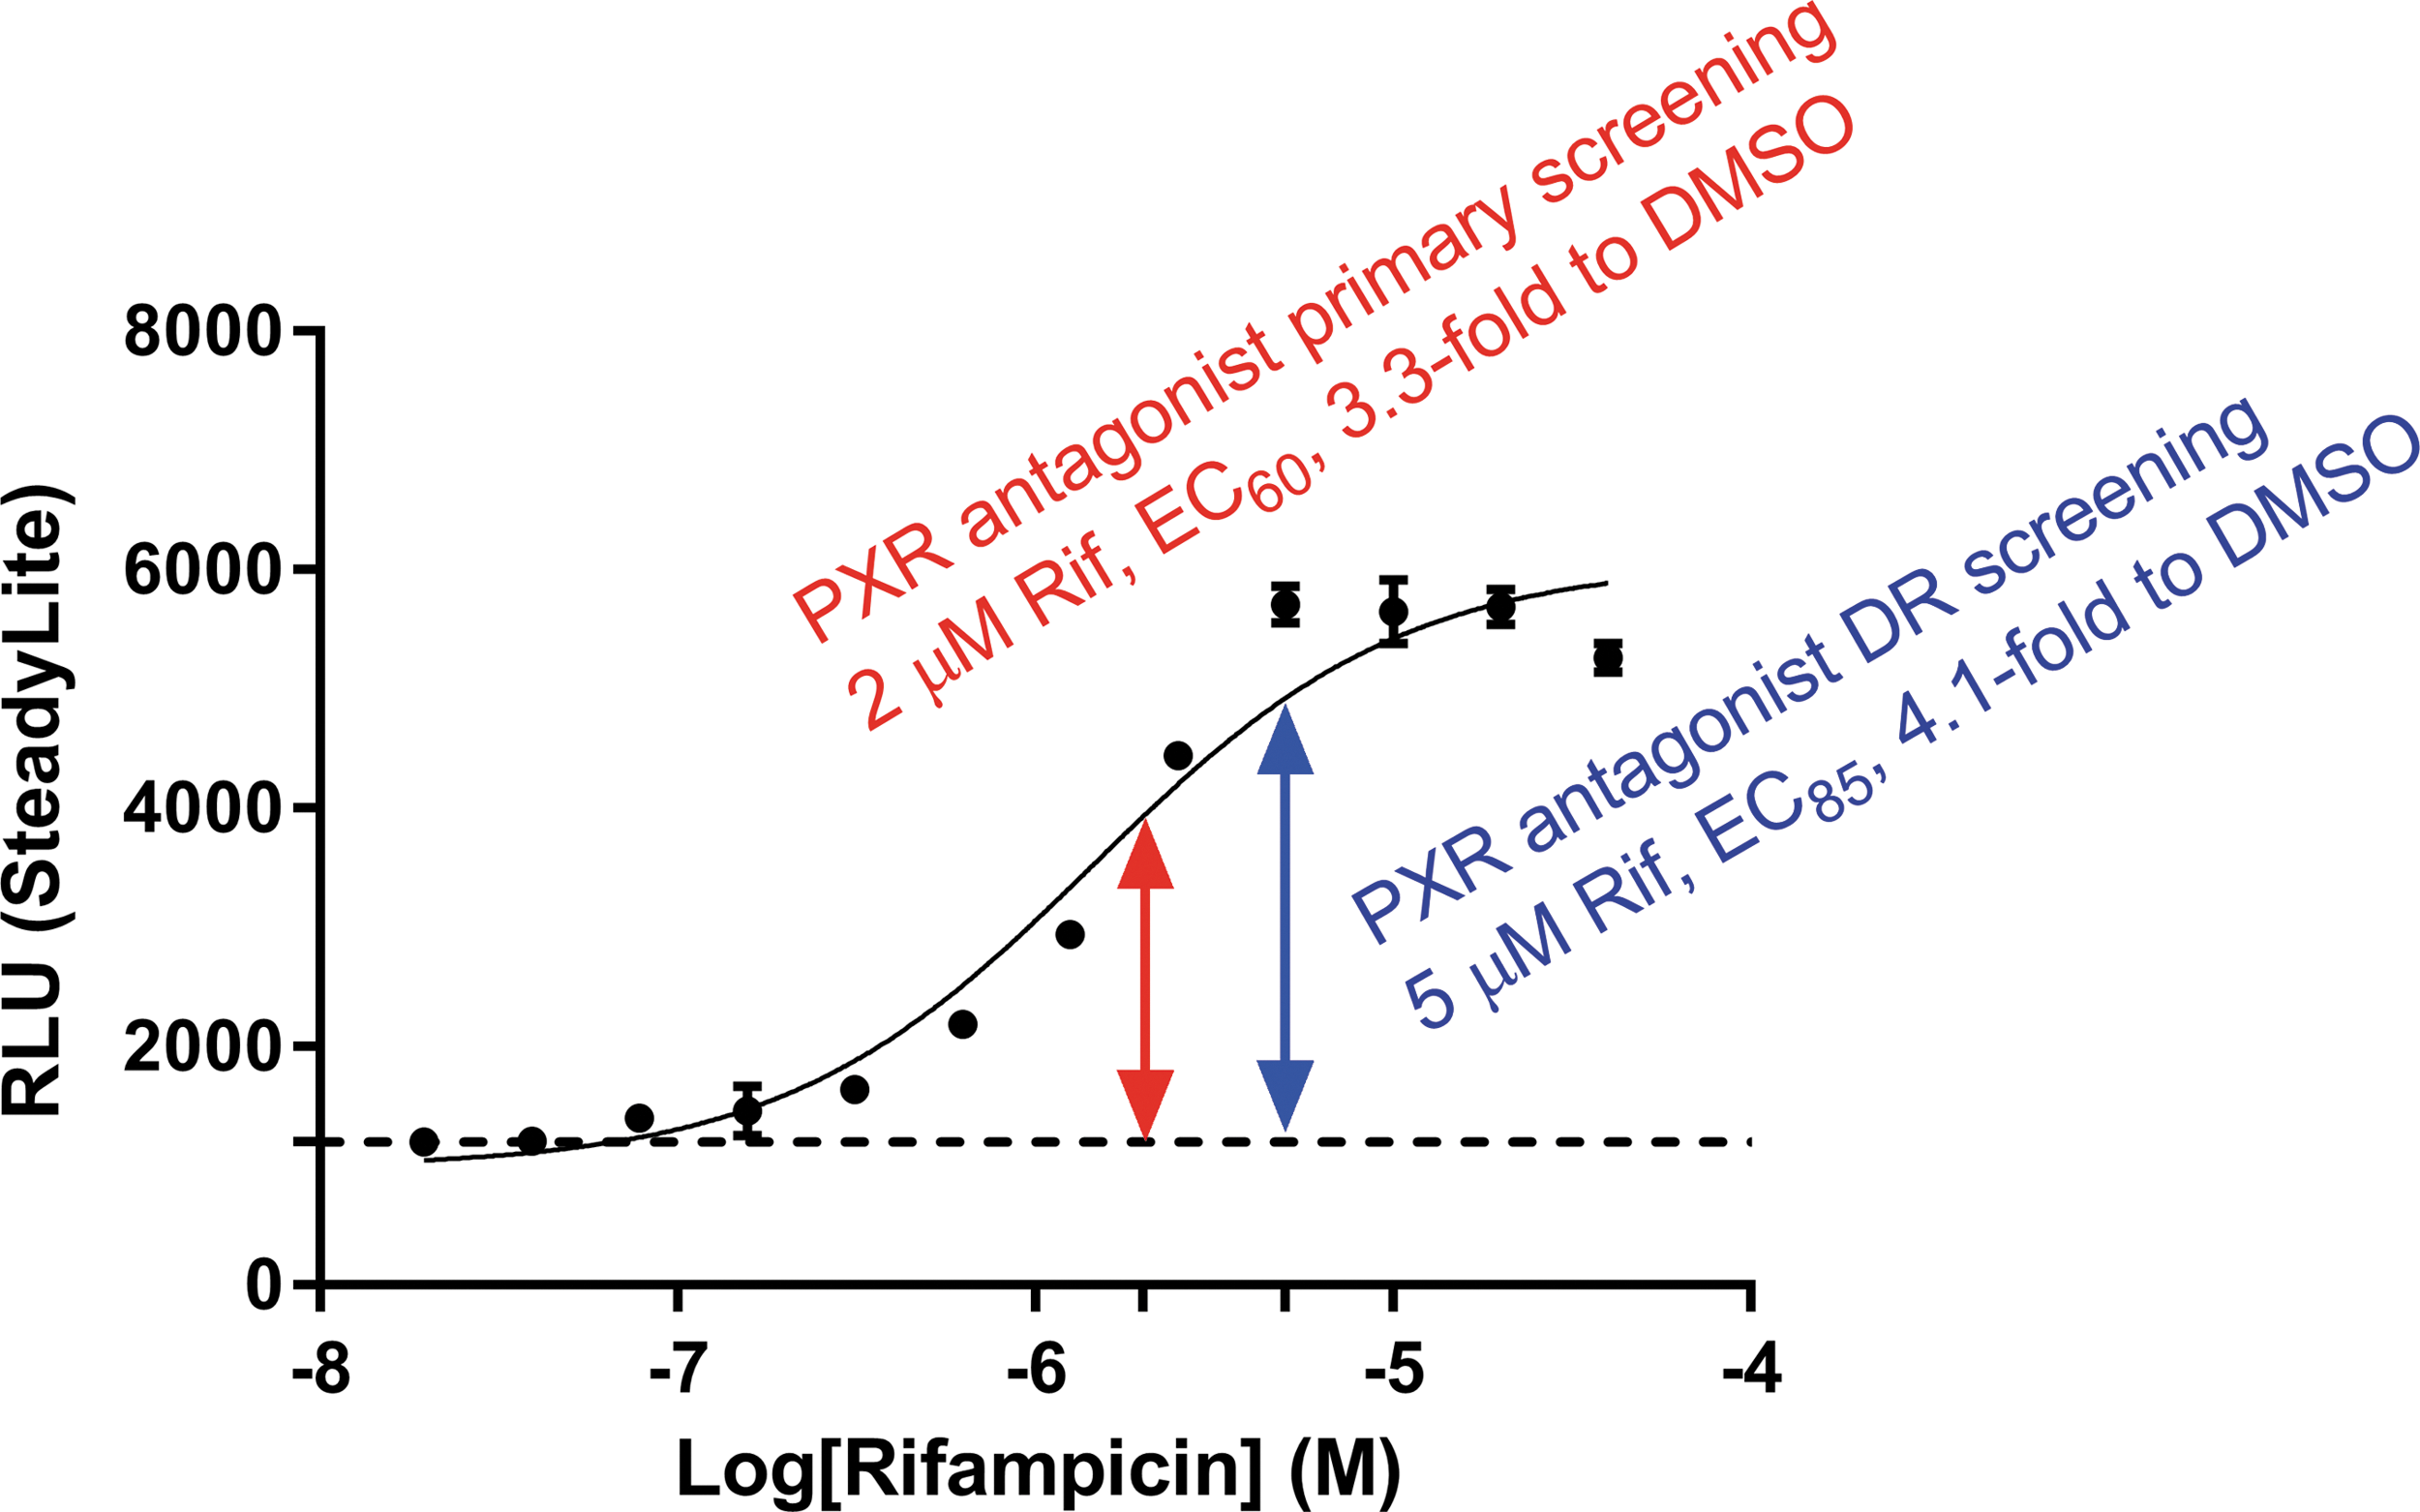
A representative dose–response curve for rifampicin in HepG2 Clone 1 cells. Each data point represents the mean ± standard deviation from triplicate measurements. DMSO, dimethyl sulfoxide; DR, dose–response; PXR, pregnane X receptor; RLU, relative luminescent unit from the luciferase assay using steadylite.
In the primary screening, 2 μM rifampicin was incubated with HepG2 Clone 1 cells to stimulate the hPXR-regulated CYP3A4-luc luciferase activity to ∼3.3-fold above the background (with DMSO as the vehicle control) (Fig. 2). A concentration of 2 μM corresponds approximately to the EC60 of rifampicin; we chose to use a lower concentration of rifampicin in the primary screening to identify as many putative hPXR antagonists as possible. Compounds were screened at concentrations of 10 μM; because we are interested in potent hPXR antagonists, we chose compounds that inhibited the activity of 2 μM rifampicin by at least 50% as primary hits (putative hPXR antagonists). We screened 132,975 compounds from 417 compound plates in 17 screening runs and identified 2,693 primary hits (Fig. 3A). The Z′-factor, which was used to assess assay performance, 30 ranged from 0.45 to 0.83, with an average value of 0.56 (0.56 ± 0.08) (Fig. 3B). In addition, false-positive hits, such as compounds that were either cytotoxic or were nonspecific inhibitors of transcription, were included among the primary hits. We decided that a retest step was necessary to eliminate the false positives before we performed a full DR analysis.

Compound activity and plate Z′-factor for the entire primary screening of 17 runs.
Retest to Eliminate False-Positive Primary Hits
To eliminate false-positive primary hits, we used two cell systems in cell-based assays: an hPXR antagonist assay that used HepG2 Clone 1 cells in the presence of 2 μM rifampicin (the same assay as in the primary screen) to confirm primary hits (in triplicate); and a luciferase reporter assay that used HepG2 cells transiently transfected with pGL3-control vector to eliminate nonspecific inhibitors of transcription and cytotoxic agents (in duplicate). We retested 2,693 primary hits in both assays. In the hPXR antagonist assay with HepG2 Clone 1 cells, 1,401 compounds showed at least 50% inhibition of 2 μM rifampicin. In the HepG2/pGL3-control vector promoter inhibition assay, 1,488 compounds inhibited transcription by less than 50%. Among the 2,693 compounds retested 503 of them showed hPXR antagonist activity exceeding 50% and nonspecific pGL3-control vector inhibition or cytotoxicity of less than 50%. By selecting less than 50% as cutoff in the HepG2/pGL3-control vector promoter inhibition assay, we may eliminate the majority of toxic or nonspecific compounds. However, additional assays to obtain the IC50 values in both assays are needed to further eliminate toxic and nonspecific compounds. These 503 compounds were further evaluated in the DR analysis.
DR Analysis to Identify Potent and Specific hPXR Antagonists
To further evaluate the potency and specificity of the 503 compounds that passed the retest, we performed DR analysis in four cell-based assays as follows: the HepG2 Clone 1 hPXR antagonist assay in the presence of 5 μM rifampicin; the HepG2/pGL3-control vector promoter inhibition assay; and the VDR agonist and antagonist reporter assays. Both hPXR and VDR belong to the NR1I subfamily and can regulate the transcription of CYP3A4. 4 Compounds that antagonize both hPXR (activated by rifampicin) and VDR (activated by 1α,25-dihydroxyvitamin D3)–mediated activation of CYP3A4 promoter are not specific for hPXR. The compounds were tested at 10 serially diluted concentrations and in triplicate.
In the HepG2 Clone 1 hPXR antagonist assay, we used a rifampicin concentration of 5 μM (which corresponds approximately to its EC85) to increase the signal-to-background ratio and the stringency of inhibition to identify hPXR antagonists with higher potency (Fig. 2). With the resulting 4.1-fold higher signal-to-background ratio (Fig. 2), an average Z′-factor value of 0.63 (0.63 ± 0.08) was obtained from the DR analysis.
Identification of Compounds with the 1-Substituted-Phenyl-4-Substituted-Phenylsulfonyl-5-Methyl-1H-1,2,3-Triazole Scaffold as Potent and Specific hPXR Antagonists
Many of the 503 compounds tested in the 4 DR analysis assays are potent and specific hPXR antagonists. One class of compounds with the 1-substituted-phenyl-4-substituted-phenylsulfonyl-5-methyl-1H-1,2,3-triazole scaffold is of particular interest, because 5 compounds (namely SJ000076745-1, SJ000076727-1, SJ000076730-1, SJ000076739-1, and SJ000076741-1) in this class (Table 1 and Fig. 4) were confirmed as potent and specific hPXR antagonists without hVDR agonist or antagonist activities, and only 1 of the 5, SJ000076741-1 exhibited nonspecific promoter-inhibitory activity (Table 1 and Fig. 4E). These 5 chemicals were further evaluated for their hPXR binding affinities with an hPXR TR-FRET binding assay and for hPXR agonist activities with the hPXR Clone 1 cell–based agonist assay (Table 1 and Fig. 4). hPXR agonists bind to the LBD to activate hPXR; we are interested in antagonists that bind to the LBD to competitively antagonize the effect of the agonists and have therefore used the hPXR LBD in the TR-FRET assay. In the hPXR TR-FRET binding assay, a high affinity hPXR fluorescent ligand, BODIPY FL Vindoline, was used to evaluate ligands for their hPXR binding affinities. This TR-FRET binding assay has been successfully used to characterize other known hPXR ligands, such as T0901317, SR12813, hyperforin, clotrimazole, rifampicin, ginkgolide A, and ginkgolide B, 20 as well as novel hPXR ligands such as indirubin derivative E804, cdk1/2 inhibitor III, and UCN-01. 31 All 5 of the chemicals exhibited relatively high hPXR binding affinities with no intrinsic hPXR agonist activity. Of the 5, compound SJ000076745-1 was the most potent hPXR antagonist, having a cell-based hPXR antagonist IC50 value of 377 ± 16 nM and an hPXR binding inhibitory IC50 value of 563 ± 40 nM but being devoid of hVDR agonist, hVDR antagonist, and pGL3 promoter–inhibitory activities (Table 1 and Fig. 4A).

SJ000076745-1 is a specific and potent hPXR antagonist identified from the screening. Dose–response curves of SJ000076745-1
Compounds with the 1-Substituted-Phenyl-4-Substituted-Phenylsulfonyl-5-Methyl-1H-1,2,3-Triazole Scaffold Are Potent and Specific Human Pregnane X Receptor Antagonists
Cell-based agonist activity.
Cell-based antagonist activity.
TR-FRET binding assay.
pGL3-control vector promoter inhibitory activity.
Maximal %activation or %inhibition <30% for all drug concentrations tested.
EC50, 50% effective concentration; hPXR, human pregnane X receptor; hVDR, human vitamin D receptor; IC50, 50% inhibitory concentration; TR-FRET, time-resolved fluorescence resonance energy transfer.
We also identified 4 other compounds with the 1-substituted-phenyl-4-substituted-phenylaminocarbonyl-1H-1,2,3-triazole scaffold, namely SJ000097644-1, SJ000097734-1, SJ000097764-1, and SJ000097801-1, as potent hPXR antagonists (Table 2). However, SJ000097644-1, SJ000097734-1, and SJ000097764-1 displayed nonspecific pGL3-control vector promoter–inhibitory activities, and SJ000097764-1 showed hVDR antagonist activity (Table 2). Therefore, the compounds with the scaffold of 1-substituted-phenyl-4-substituted-phenylaminocarbonyl-1H-1,2,3-triazole are less suitable for further development as specific hPXR antagonists.
Compounds with the 1-Substituted-Phenyl-4-Substituted-Phenylaminocarbonyl-1H-1,2,3-Triazole Scaffold Are Potent But Less Specific Human Pregnane X Receptor Antagonists
Cell-based antagonist activity.
Cell-based agonist activity.
pGL3-control vector promoter inhibitory activity.
Maximal %activation or %inhibition <30% for all drug concentrations tested.
When the scaffold of 1-substituted-phenyl-4-substituted-phenylsulfonyl-5-methyl-1H-1,2,3-triazole (which is potent and specific) (Fig. 5A) is compared to that of 1-substituted-phenyl-4-substituted-phenylaminocarbonyl-1H-1,2,3-triazole (which is potent but less specific) (Fig. 5B), the only major difference is the linkage between the central 1H-1,2,3-triazole ring and the left aromatic ring. This linkage is a sulfonyl linkage in the 1-substituted-phenyl-4-substituted-phenylsulfonyl-5-methyl-1H-1,2,3-triazole scaffold but a carbonyl amide linkage in the 1-substituted-phenyl-4-substituted-phenylaminocarbonyl-1H-1,2,3-triazole scaffold (Fig. 5). However, this small structural difference between the 2 scaffolds significantly affects their specificity. The scaffold of 1-substituted-phenyl-4-substituted-phenylsulfonyl-5-methyl-1H-1,2,3-triazole is suitable for further development aimed at generating more potent and specific hPXR antagonists.
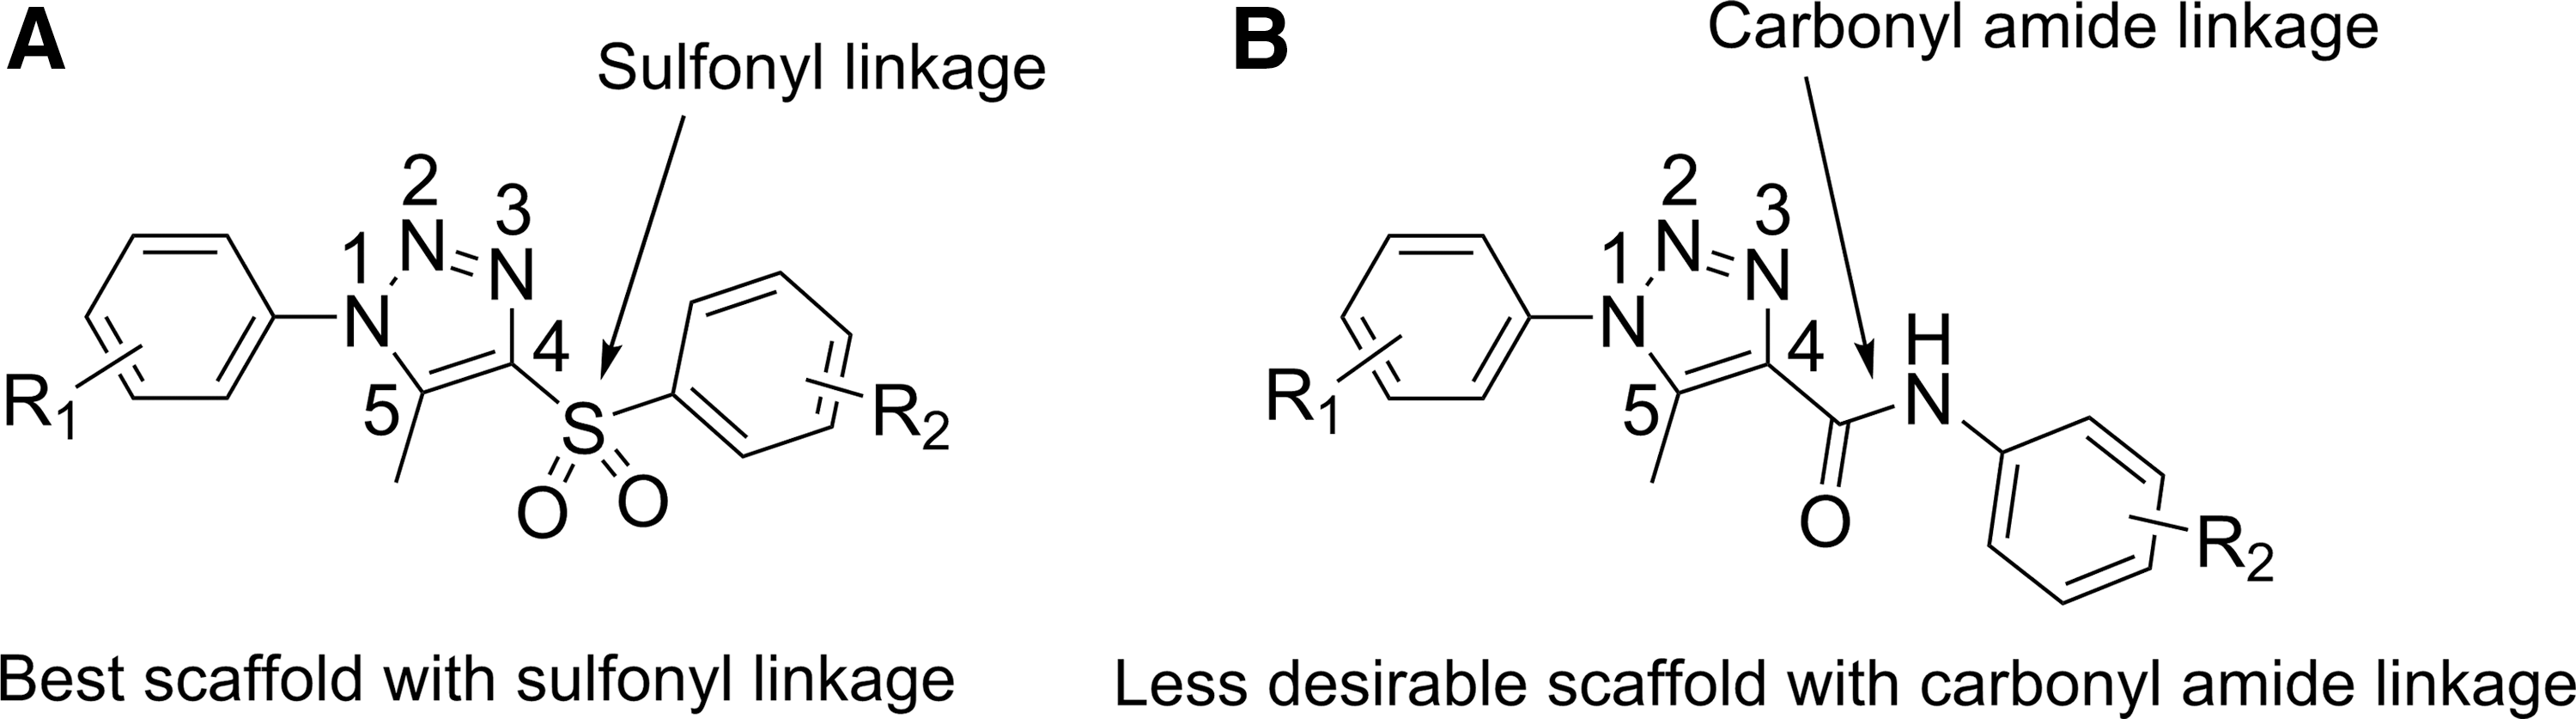
Comparison of the scaffold of 1-substituted-phenyl-4-substituted-phenylsulfonyl-5-methyl-1H-1,2,3-triazole
Discussion
hPXR can be activated by many prescription drugs, phytochemicals, dietary constituents, and endogenous substances, 16 which may enhance the expression of various phase I and phase II drug-metabolism enzymes and phase III drug transporters, 32 possibly leading to unwanted adverse drug reactions such as drug-induced liver injury, 12 reduced anticancer drug efficacy, and drug resistance. 33,34 Sinz et al. have tested 170 known drugs and natural products for their hPXR transactivation potential and found that 55% of the 170 compounds significantly activate hPXR. 9 Among them, hyperforin, nicardipine, rosiglitazone, rifampicin, 1,9-dideoxyforskolin, SR12813, bergamottin, phenylbutazone, omeprazole, reserpine, terbinafine, and rifapentine displayed the greatest extent of hPXR activation (80% to 120% of that of 10 μM rifampicin, an hPXR agonist). In addition, terbinafine, diclofenac, sildenafil, glimepiride, montelukast, and ticlopidine were found to activate hPXR, which were previously unknown to activate hPXR. Co-administering an hPXR antagonist that inhibits the activation of hPXR by drugs may have beneficial effects, such as restoring anticancer drug efficacy 35 or reducing drug-induced liver injury. 12 However, the previously reported hPXR antagonists and inhibitors were neither specific nor potent, limiting their applications. 12
In our unbiased, cell-based HTS approach, we first screened a collection of 132,975 unique chemicals and then performed sequential retesting and DR analysis, including specificity evaluations. As a result of these efforts, we identified the 1,4,5–substituted-1,2,3-triazole analogs as potent and specific hPXR antagonists. Of these compounds, SJ000076745-1 is the most potent, having a cell-based hPXR antagonist IC50 value of 377 ± 16 nM and a PXR TR-FRET binding inhibitory IC50 value of 563 ± 40 nM. The positive control for the binding assay, T0901317 (with an hPXR binding IC50 value of 104 ± 6 nM), has one of the highest binding affinities so far reported for an hPXR ligand. 19,20 SJ000076745-1 has an hPXR binding IC50 value of 563 ± 40 nM, which is comparable to that of T0901317, thus making it another high-affinity hPXR binder. However, SJ000076745-1 is unique because it is an hPXR antagonist with high affinity; all other reported high-affinity hPXR ligands, such as T0901317, SR12813, and hyperforin, are potent hPXR agonists. 19,20,36 –38 The correlation of cell-based hPXR antagonist activity with hPXR binding inhibitory activity for SJ000076745-1 indicates that SJ000076745-1 binds to hPXR to exert its antagonist activity. These newly identified potent and specific hPXR antagonists may serve as novel pharmacologic tools for studying hPXR antagonism. The scaffold of 1,4,5-substituted-1,2,3-triazole may be further developed to generate more potent hPXR antagonists.
After the 5 chemicals with the scaffold of 1,4,5-substituted-1,2,3-triazole have been identified as potent and specific hPXR antagonists (Table 1 and Fig. 4), we retrospectively searched for all analogs among the library of 132,975 chemicals and identified 60 analogs. Among them, 52 were not selected as primary hits because of their lower activity (%inhibition <50%). The other eight analogs among the 2,693 primary hits were retested, and 3 of them were eliminated due to either nonspecific pGL3-Control Vector Promoter inhibition (one analog) or low hPXR antagonistic activity (%inhibition <50%) (two analogs). Five analogs shown in Table 1 and Figure 4 were further confirmed as potent and specific hPXR antagonists. Of the 5, SJ000076745-1 was the most potent hPXR antagonist. In our follow-up studies, we demonstrated that SJ000076745-1 (also known as SPA70 or LC-1) antagonized not only rifampicin but also other known hPXR agonists, such as SR12813 and T0901317, in the hPXR-driven CYP3A4-luc reporter assay. 39 We also showed that SJ000076745-1 was able to enhance the efficacy of chemotherapeutic agents such as paclitaxel. 39
From the 2,693 primary hits, our retest identified 503 compounds with hPXR antagonist activity exceeding 50% and nonspecific pGL3-control vector inhibition or cytotoxicity of less than 50%. These 503 compounds are putative hPXR antagonists and were further evaluated in multiple assays in dose-responsive manner. Besides the 9 compounds described in detail, including the most potent SJ000076745-1 (Tables 1 and 2), we have also identified other compounds as hPXR antagonists. These compounds provide additional scaffolds for further development in our ongoing efforts.
As shown in Figure 3A, a larger number of library compounds enhanced rifampicin-induced PXR-driven CYP3A4-luciferase reporter activity. This is not surprising and is consistent with the fact that hPXR is a promiscuous receptor that is activated by a wide range of chemicals. These compounds could either be hPXR agonists that are more potent than rifampicin so they bind to and displace rifampicin from the LBD of hPXR or be positive hPXR allosteric modulators which bind to sites outside of the ligand binding pocket to additively or synergistically activate hPXR with rifampicin. These putative hPXR agonists or positive allosteric modulators might be valuable because hPXR agonists might be beneficial for treating disease such as inflammatory bowel diseases, 40 –42 primary biliary cirrhosis, 43 and cholesterol gallstone disease, 44 and hPXR allosteric modulators could be useful tools to investigate the regulation of hPXR. 45 Further investigation is warranted, but beyond the scope of this report.
Conclusion
To identify potent and specific hPXR antagonists, we implemented a primary cell-based hPXR antagonist screening of 132,975 unique chemicals and identified 2,693 primary hits. We then retested these primary hits using an hPXR antagonist assay, and a pGL3-control vector promoter inhibition assay, and we selected 503 compounds for DR analysis using hPXR antagonist, hVDR agonist, hVDR antagonist, and pGL3-control vector promoter inhibition assays. We identified potent and specific hPXR antagonists with diverse scaffolds; of these, the compounds with the scaffold of 1-substituted-phenyl-4-substituted-phenylsulfonyl-5-methyl-1H-1,2,3-triazole are the most potent and specific hPXR antagonists and are represented by SJ000076745-1, which has a cell-based hPXR antagonist IC50 value of 377 ± 16 nM and an hPXR binding inhibitory IC50 value of 563 ± 40 nM (Fig. 1).
Footnotes
Acknowledgments
The authors thank Fu-yue Zeng and Anang Shelat for technical assistance, other members of the Chen research laboratory for valuable discussions, and Dr. Keith A. Laycock for editing the article. This work was supported by ALSAC, St. Jude Children's Research Hospital, and the National Institutes of Health (grants RO1GM086415, RO1GM110034, R35GM118041, and P30-CA21765).
Disclosure Statement
No competing financial interests exist.