




Abstract
There is a large amount of information in brightfield images that was previously inaccessible by using traditional microscopy techniques. This information can now be exploited by using machine-learning approaches for both image segmentation and the classification of objects. We have combined these approaches with a label-free assay for growth and differentiation of leukemic colonies, to generate a novel platform for phenotypic drug discovery. Initially, a supervised machine-learning algorithm was used to identify in-focus colonies growing in a three-dimensional (3D) methylcellulose gel. Once identified, unsupervised clustering and principle component analysis of texture-based phenotypic profiles were applied to group similar phenotypes. In a proof-of-concept study, we successfully identified a novel phenotype induced by a compound that is currently in clinical trials for the treatment of leukemia. We believe that our platform will be of great benefit for the utilization of patient-derived 3D cell culture systems for both drug discovery and diagnostic applications.
Introduction
As a model disease for understanding cancer biology, leukemia has been exceptionally revealing. 1 Leukemic stem cells (LSCs) driving acute myeloid leukemia (AML) were the first described cancer stem cells, 2 ultimately leading to the more generalized “cancer-stem-cell hypothesis.” Various translocations involving the mixed lineage leukemia (MLL) gene lead to multiple hematological malignancies, including AML, and are often associated with a poor prognosis. MLL is a DNA-binding protein and epigenetic regulator that methylates histone H3 lysine 4. 3 When present as a leukemogenic fusion protein, MLL has been shown to bind to the promoters of the Hoxa9 and Meis1 genes and be associated with histone modification. 4
When grown in vitro, LSC colonies display graded phenotypes depending on the initiating mutation. 5,6 Looser colonies are surrounded by a spectrum of more differentiated blast-like cells, whereas denser colonies contain more undifferentiated cells. 7 These phenotypes are potentially clinically relevant as it has been shown that colony morphology is correlated with the disease prognosis in mice. 6 Because the phenotype is easily visualized, it is possible to use image-based screening to identify agents that can drive leukemic cells toward a more benign, differentiated phenotype.
We have developed a method for high-throughput, high-content screening of live colonies cultured and imaged in three-dimensional (3D) form. To validate the sensitivity of our approach to variations in genetic background, we performed a pilot screen in three different cell lines. This allowed comparison of effects between human and mouse species and, in mouse, between primary cells transformed by different oncogenes.
Colony formation assays are typically performed in six-well plates and scored manually by a researcher. After initial isolation, cells are mixed with cytokine-containing semi-solid methylcellulose-based media formulated to promote leukemic colony growth in three dimensions through proliferation and differentiation. 8 The methylcellulose colony-forming cell (CFC) assay 9 is a preferred in vitro assay used in the study of primitive hematopoietic cells, and cells can readily be recovered from methylcellulose for further phenotypic and molecular characterization. Due to observed auto-fluorescence of the growth gel (methylcellulose scaffold and growth media mix), direct fluorescent imaging of green fluorescent protein expressing cell colonies in situ could not be utilized for our growth conditions. These colony-forming assays are, therefore, low throughput, susceptible to bias due to manual scoring, and generally unsuitable for arrayed chemical or genetic screening. Being able to employ these 3D assays for automated high-throughput screening of peturbagens would clearly be advantageous, in both probing for mechanistic insights related to disease biology and unearthing new therapeutic agents. In addition, the ability to perform high-content screening for agents that are not simply preventing colony growth but also driving colonies from a dense to loose phenotype would have added utility for drug discovery. 10
Brightfield (BF) images contain rich texture information that, until recently, was inaccessible to automated image analysis. 11 –13 BF imaging of live cells has several advantages over fluorescent imaging. Being label free, there is no need to modify the cells with either a fluorescent protein expression cassette or the addition of dyes that could perturb normal cell function. Quantification of label-free BF images of colonies in situ would also support both short- and long-term live cell kinetic studies. We have previously been successful in developing a simple machine-learning-based analysis pipeline that could determine colony number and size from BF images. 14 In this study, we investigate whether a similar approach could be employed in a screening campaign, not only to count and size colonies but also to use the texture information to phenotypically profile colonies and potentially identify compounds that can induce novel phenotypes.
Materials and Methods
See also Table 1 for a summary of the screen protocol.
Protocol Table
1. CyBio FeliX, non-tissue culture treated edge plate.
2. Media pre-warmed to 37°C.
3. Side trough and unused wells half filled with PBS.
4. Ensures mixing of compound with media.
6. Operetta microscope.
8. With Spotfire HCP or HC Stratominer.
BF, brightfield; DMSO, dimethyl sulfoxide; PCA, principle component analysis; PBS, phosphate buffered saline.
Colony Culture
THP-1 cells were cultured at 500,000 cells/mL in RPMI-1640 GlutaMAX containing 10% fetal bovine serum (FBS), 100 U/mL penicillin, and 100 μg/mL streptomycin.
MMA (MLL-AF9KI/+ cells): Fetal liver hematopoietic cells were extracted from an E14.5 MLL-AF9KI/+ embryo (MLL-AF9KI/+ mice 15 were obtained from The Jackson Laboratory). After c-Kit enrichment using MACS LS columns (Miltenyi Biotec), cells were serially replated every 6 days in MethoCult M3231 (STEMCELL Technologies) supplemented with 20 ng/mL stem cell factor (SCF), 10 ng/mL interleukin (IL)-3, 10 ng/mL IL-6, and 10 ng/mL granulocyte-macrophage colony-stimulating factor (GM-CSF). After 3 rounds of plating, cells were cultured at 300,000 cells/mL in Iscove's modified Dulbecco's medium (IMDM) containing 10% FBS, 100 U/mL penicillin, and 100 μg/mL streptomycin, supplemented with SCF, IL-3, and IL-6.
MMH (Meis1/Hoxa9 cells): Fetal liver hematopoietic cells were extracted from an E14.5 C57Bl/6 embryo. After c-Kit enrichment by using MACS LS columns (Miltenyi Biotec), cells were transduced with MSCV-Meis1a-puro and MSCV-Hoxa9-neo retroviruses as per Vukovic et al. 14 After selection for puromycin/neomycin coresistance, cells were serially replated every 6 days in MethoCult M3231 (STEMCELL Technologies) supplemented with 20 ng/mL SCF, 10 ng/mL IL-3, 10 ng/mL IL-6, and 10 ng/mL GM-CSF. After 3 rounds of plating, cells were cultured at 200,000 cells/mL in IMDM containing 10% FBS, 100 U/mL penicillin, and 100 μg/mL streptomycin, supplemented with SCF, IL-3, and IL-6.
Animal experimentation complied with local and national requirements (UK Animals Act 1986).
For methylcellulose medium, 20 mL IMDM (Life Technologies) was added to 80 mL MethoCult 3231 (STEMCELL Technologies; Cat. No. 03231), vortexed, and allowed to settle. For primary murine cell lines, the methylcellulose was supplemented with cytokines 20 ng/mL SCF, 10 ng/mL IL-3, 10 ng/mL IL-6, and 10 ng/mL GM-CSF. No antibiotics were added. Cells (THP-1 cells, MLL-AF9KI/+ fetal liver cells, or murine fetal liver transformed with Meis1 and Hoxa9 retroviruses) were suspended in IMDM and added to the prepared methylcellulose at a ratio of 1:9. The mixture was vortexed and allowed to settle. Compounds were added as a single dose. Five microliters of 2.1% test compound was pipetted into the center of each well of a 96-well nontissue culture-treated edge plate (Thermo Scientific; Cat. No. 267313) with a CyBio FeLix. Subsequently, 100 μL of premixed methylcellulose containing 400 cells (THP-1) or 600 cells (MLL-AF9KI/+ fetal liver cells, or murine fetal liver transformed with Meis1 and Hoxa9 retroviruses) was syringed into each well (using BD Microlance 3 18 Gauge 1.5″ needles, resultant compound concentration 0.1%). The plate was vortexed, and the side troughs and unused wells were half filled with phosphate buffered saline (PBS) (Sigma) to prevent edge effects due to uneven evaporation. Plates were incubated at 37°C 5% CO2 (day 0), and they were scanned on day 6 (murine cells) or day 9 (THP-1 cells).
Imaging
Images were acquired at 37°C 5% CO2 on an Operetta high-content microscope (Perkin Elmer) equipped with a live cell chamber. The imaging pattern for plates consisted of a snaking pattern across columns beginning with the top left gel containing well (B2), down to B7, across to C7 up to C2, and so on. In each well, the imaging pattern began with the middle field and followed a snaking pattern beginning at the top left field, across rows and avoiding imaging of the central field twice. We chose nine fields of view to maximize well coverage at 10 × magnification while avoiding the well edges. The edge of each of the wells had a texture that the algorithm sometimes identified as a colony and was, therefore, best to avoid. After testing various z-stack options during assay development, focal planes separated by 150 μm were chosen to avoid repeated counting of the same colonies. Above a height of 600 μm there were no colonies found and plate scan times were unnecessarily increased.
Image and Numerical Data Analyses
Image and subsequent numerical analysis was performed by using a variety of software tools:
Columbus 2.7.1 (Perkin Elmer) was used for the initial image analysis step by manually training the “Find texture region” PhenoLogic machine-learning module to find two classes of texture regions in BF images. One class contained in-focus colonies (texture A), and the other class contained background and out-of-focus colonies (texture B). Texture A was split into discrete objects: The outer border was shrunk by six pixels, and any holes were filled. Objects >2,000 μm2 were considered as colonies, and morphology and texture properties were calculated by using the “Calculate morphology properties” and “Calculate texture properties” modules. Well-level aggregated data and data for individual colonies including morphology and texture features were exported as separate text files.
Spotfire HCP 7.5.0 (Perkin Elmer informatics;
HC StratoMineR (Core Life Analytics;
Python (
Results
Supervised Machine-Learning-Based Segmentation of Colonies in 3D
The following automated image acquisition parameters were developed to enable optimal label-free imaging of colonies grown in a 96-well plate while avoiding common pitfalls of assay miniaturization. The imaging pattern avoided issues with both imaging the well wall (Fig. 1a) and identifying the same colony in more than one focal plane (Fig. 1b). Due to their relatively larger size, the number of objects per well of a 96-well plate is limited when measuring colonies rather than cells. To maximize image coverage while minimizing the time taken for imaging each plate, we employed a 10 × objective. This resulted in flatter illumination across fields than the 2 × lens but did result in more colonies that were clipped by the edge of the field (Fig. 1c). Nine fields of view were imaged in each well of the 96-well assay plate (Fig. 1a) covering ∼50% of the well, with each field acquired at five focal planes each separated by 150 μm (Fig. 1b). All images were subsequently segmented by using an algorithm (supervised texture segmentation module in the Columbus image analysis software) that had previously been trained on an independent training set. 14 We tested the algorithm on three independent cell lines: a human AML (M5) cell line harboring an MLL-AF9 translocation (THP-1 cells); cells obtained from a mouse (MLL-AF9KI/+ ) with a genomic rearrangement leading to expression of the MLL-AF9 fusion protein (further referred to as MMA cells); and a primary mouse cell line containing retroviral constructs that overexpress Meis1 and Hoxa9 (further referred to as MMH cells), each of which display differences in size and number of colonies. On visual inspection, the segmentation algorithm performed equally well in identifying colonies grown from each cell line (Fig. 1d–f). As a positive control for compound addition to each plate, we used iBET, 18 a known inhibitor of leukemic cell growth and colony formation. 19 In our assay, iBET proved effective at inhibiting the growth of all three cell lines (Fig. 1g–i).
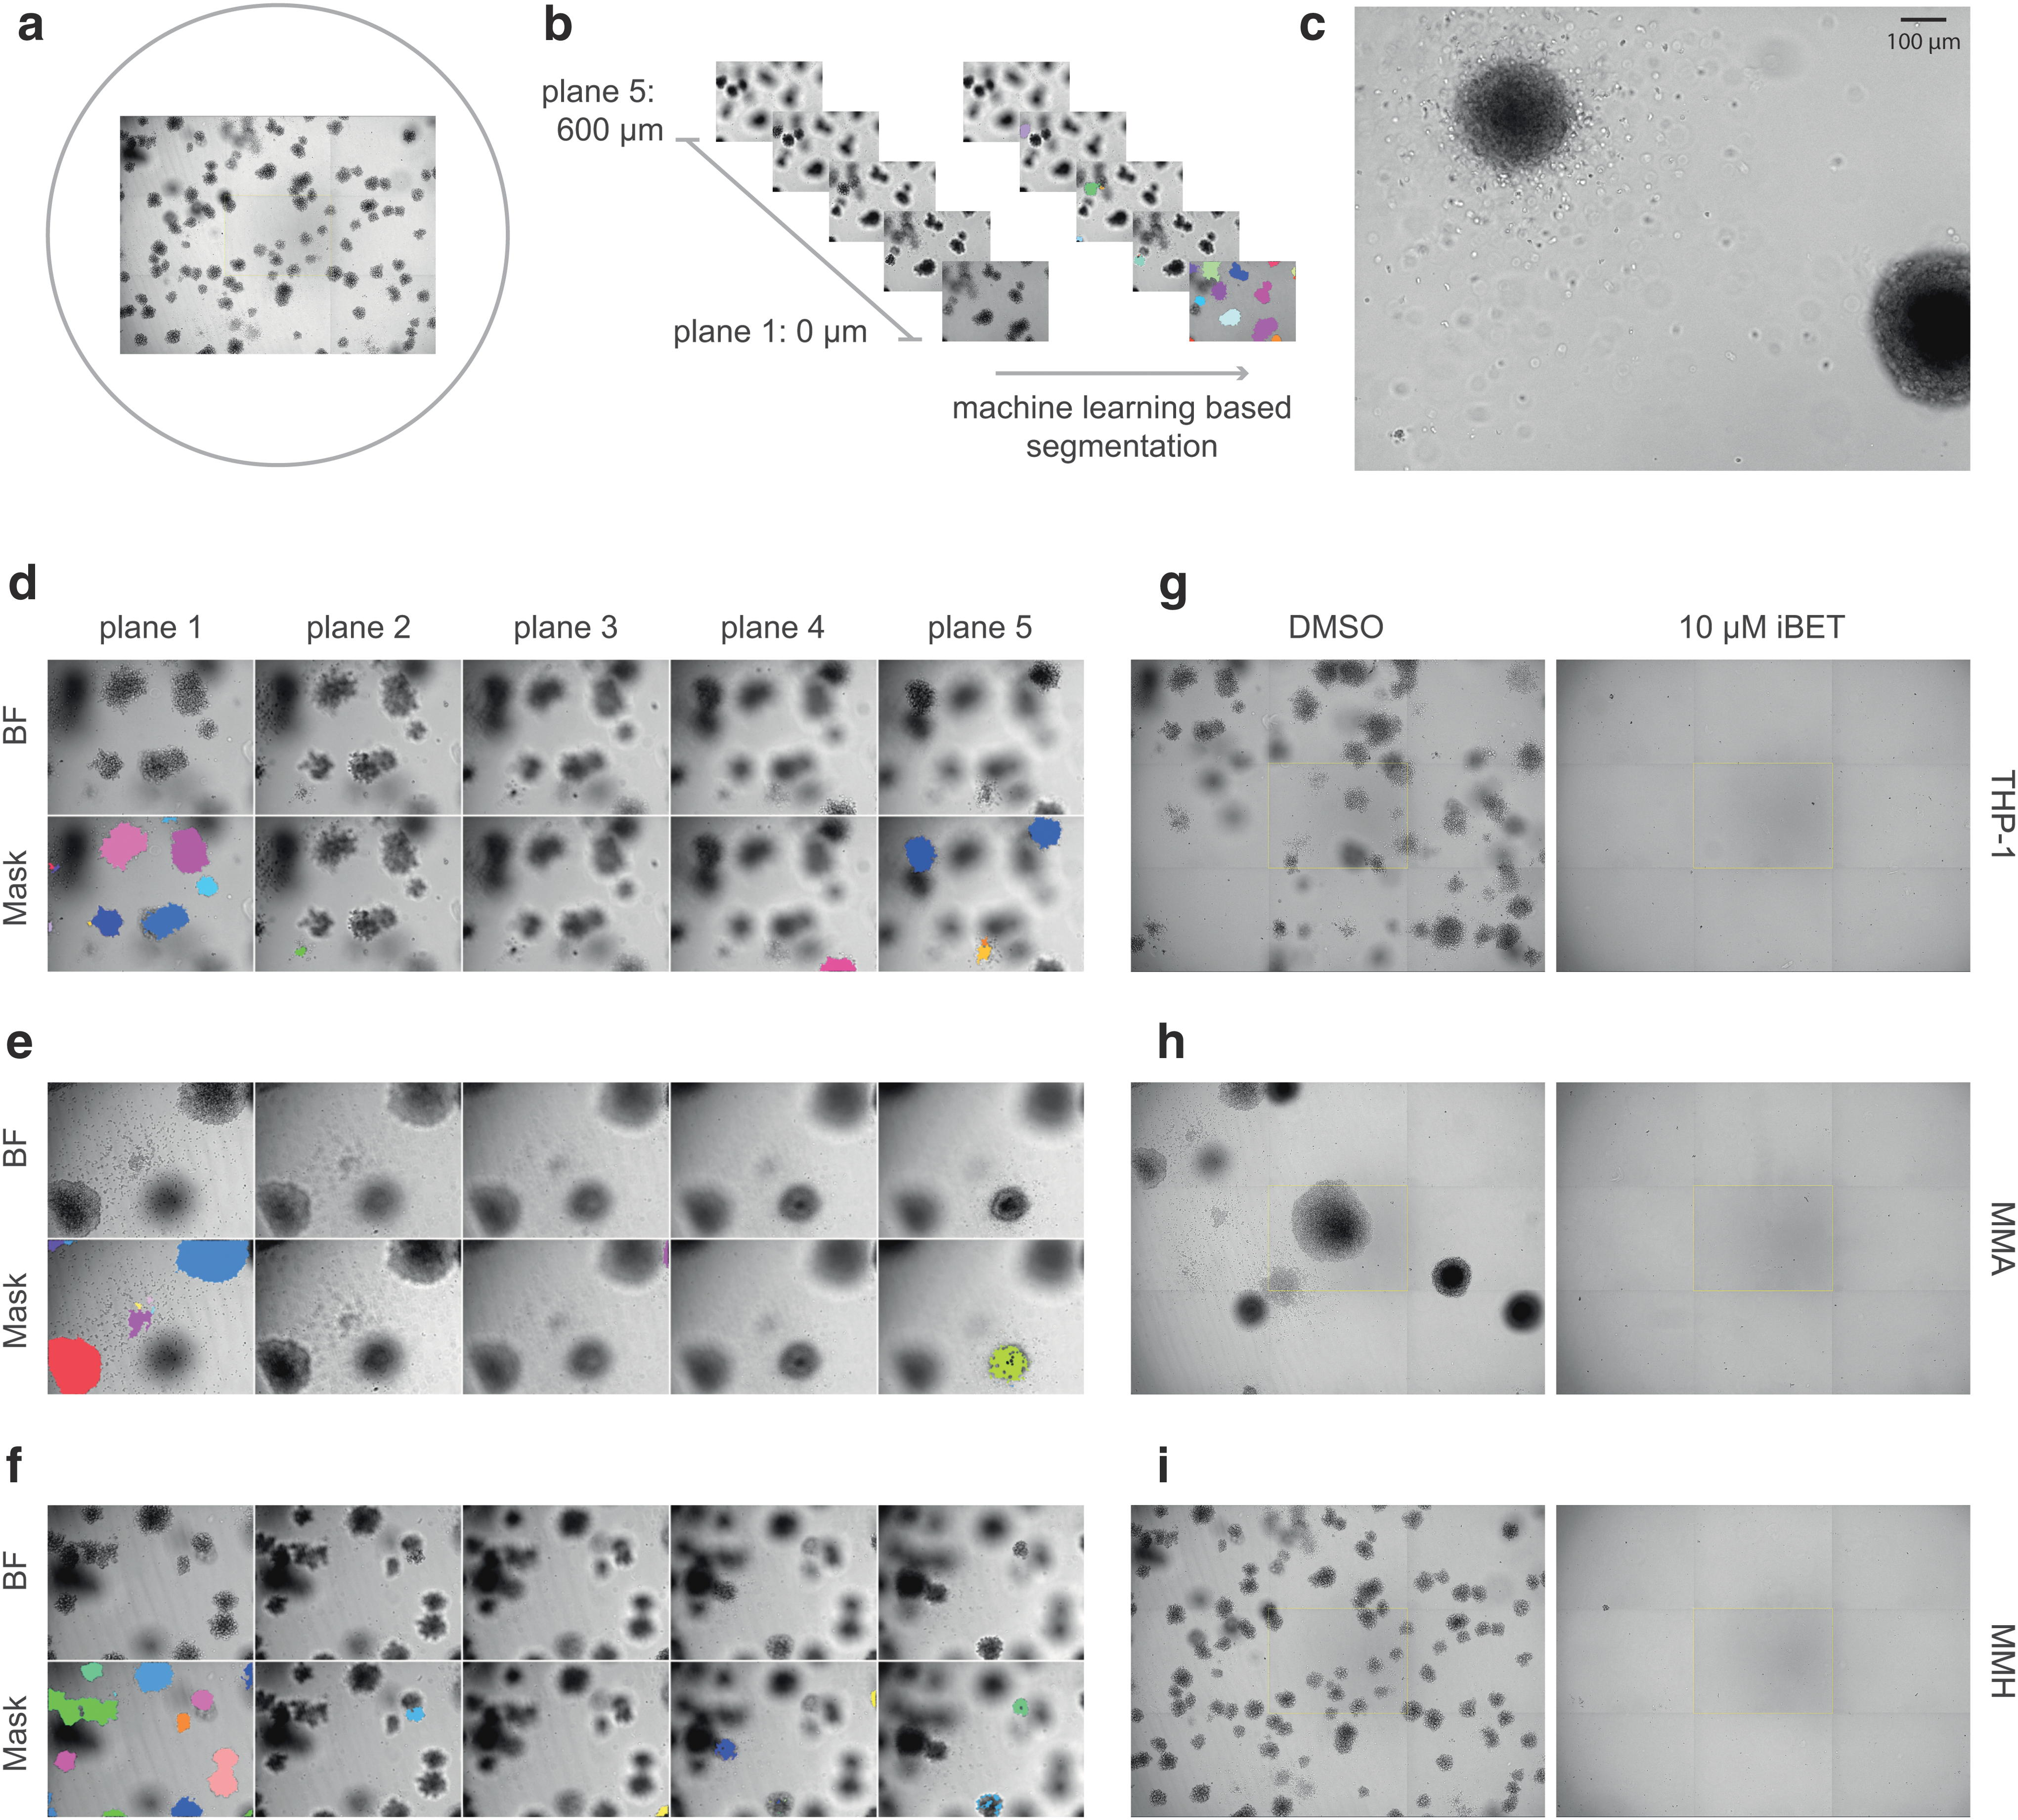
Imaging strategy. Example of BF images showing:
Epigenetic Tool Compound Library
Abnormal epigenetic regulation of gene expression has been implicated as potentially causative in several types of myeloid malignancies. 20 We, therefore, employed the high-quality epigenetic tool compound library from the Structural Genomics Consortium (SGC) 21 to map which epigenetic regulators are involved in colony growth and differentiation across the three different leukemic cell lines. The compounds used are listed in Table 2, along with their plate location and known targets. A six-point dose response was performed starting at 10 μM with a 1 in 5 dilution at each step (giving: 10 μM; 2 μM; 400 nM; 80 nM; 16 nM; and 3.2 nM). Although SGC do not recommend using their compounds at concentrations higher than 1 μM, we had previously observed that in semi-solid methylcellulose medium our positive control iBET was only effective at concentrations ∼10-fold higher than in liquid culture (unpublished data). We, therefore, began the dose response at 10 μM. A summary of the screening protocol is shown in Table 1, with more detailed procedures in the Materials and Methods section.
Compounds Used in This Study
Digitized Colonies: Size, Number, and Location
There was almost complete ablation of colonies in the positive control wells for each cell line (example plates shown in Fig. 2a–c, with iBET added to first 4 wells of rows 2 and last 3 wells of row 11). Compounds ablating colony formation in all three cell lines are also plainly visible (Fig. 2a–c) at the highest concentration used (10 μM). At this concentration, the lack of colonies is most likely due to toxicity given the complete lack of cells found after manual inspection of the full resolution images. Colony location and size are clearly recapitulated by the segmentation algorithm (Fig. 2d–f). Visualizing the performance of the algorithm as an entire digital plate gave added confidence of accurate measurement of colony number and size.
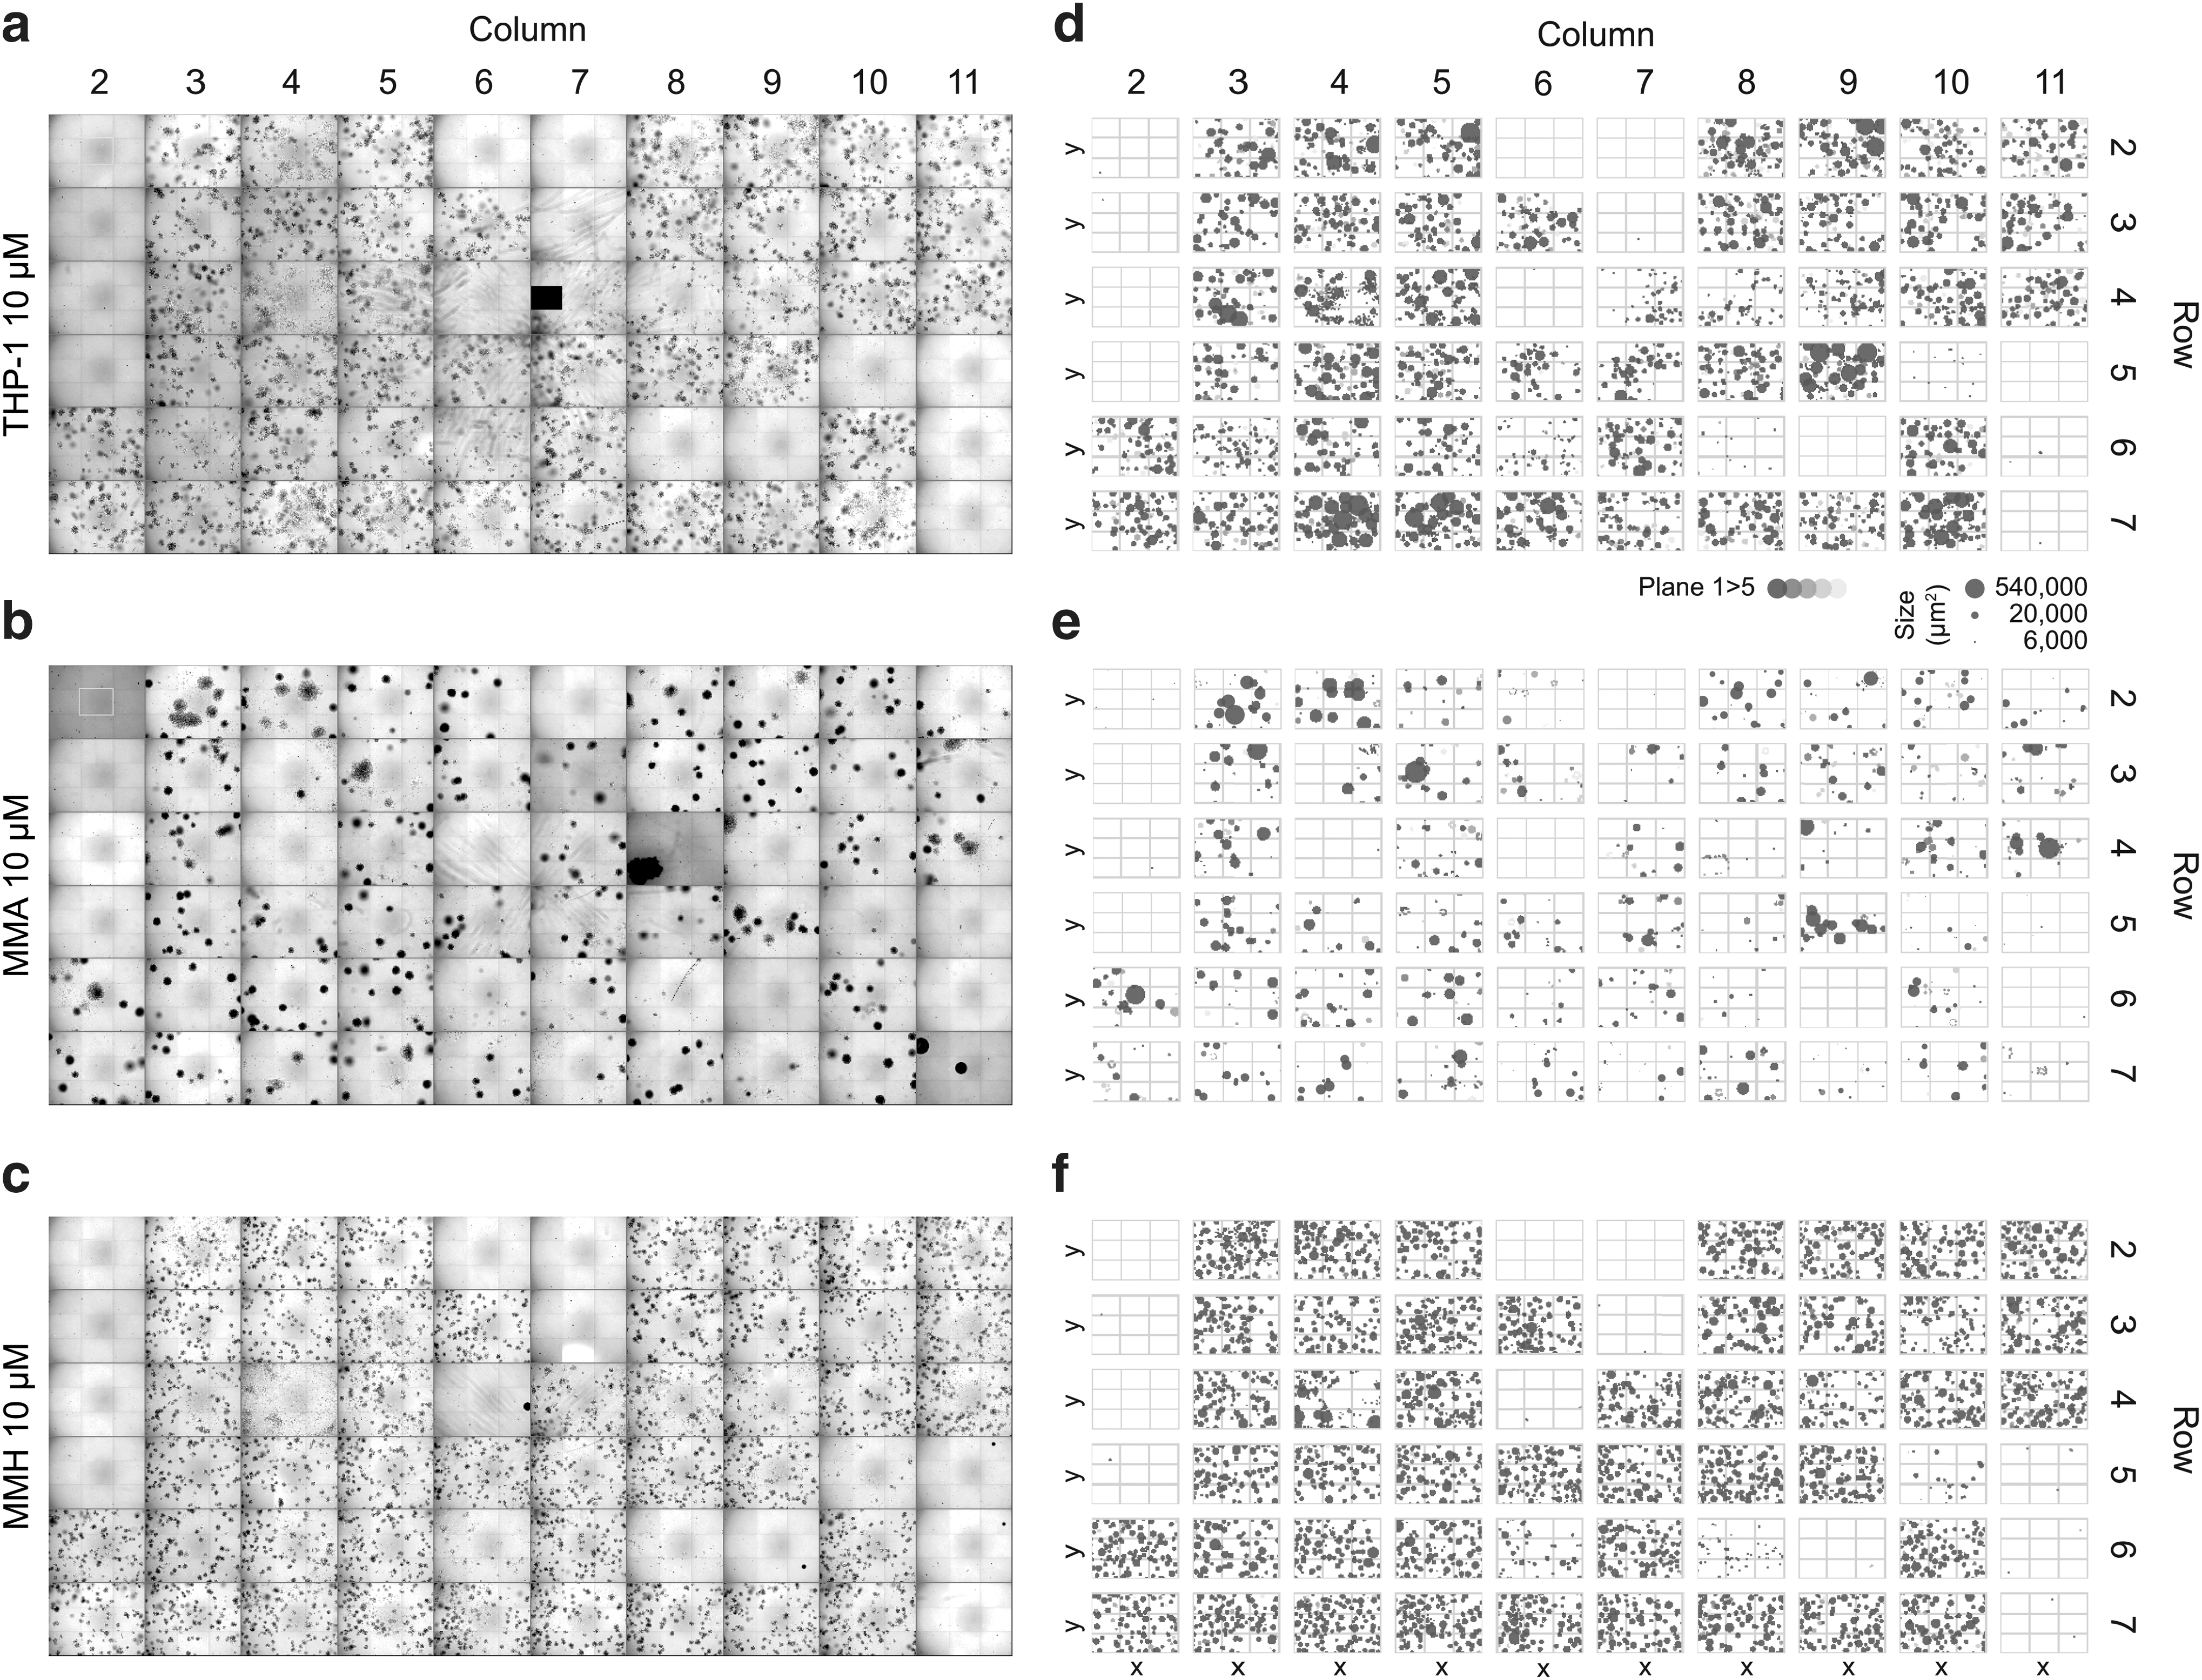
Digitization of colonies. Tiled BF images showing plane 1 of an entire plate at the highest compound concentration for each cell line
Quantification of total number of colonies across all plates in the screen shows several compounds to reduce CFC number at lower concentrations (Fig. 3a). There are no obvious edge effects on colony size or number in the outer wells of the plate. There appears to be a general reduction in CFC numbers, possibly due to a general toxic effect of the compounds at the highest concentration, most apparent in the MMH cell line at 10 μM (Fig. 3b). Surprisingly, there is also a single compound (GSK-LSD1) that increases colony number across a range of concentrations (Fig. 3a and effect size shown in Fig. 3b). Z-prime (Z′) scores based on colony number are excellent for THP-1 (0.57) and for MMH (0.54) cell lines but only −0.52 for the MMA cell line (calculated on 42 positive and 60 negative wells spread across 6 plates for each cell line). The reduced Z′ for this primary cell line is due to increased overall noise in the measurements because of (1) the lower colony numbers leading to reduced number of colonies quantified, and (2) the greatly increased colony size that results in more frequent colony clipping. This is also reflected in called hits based on a reduction in colony number. THP-1 and MMH cell lines have almost perfect hit overlap for reduction of colony numbers (Table 3, all with a P-value <0.0001 and dose response curves for overlapping compounds in Supplementary Fig. S1; Supplementary Data are available online at
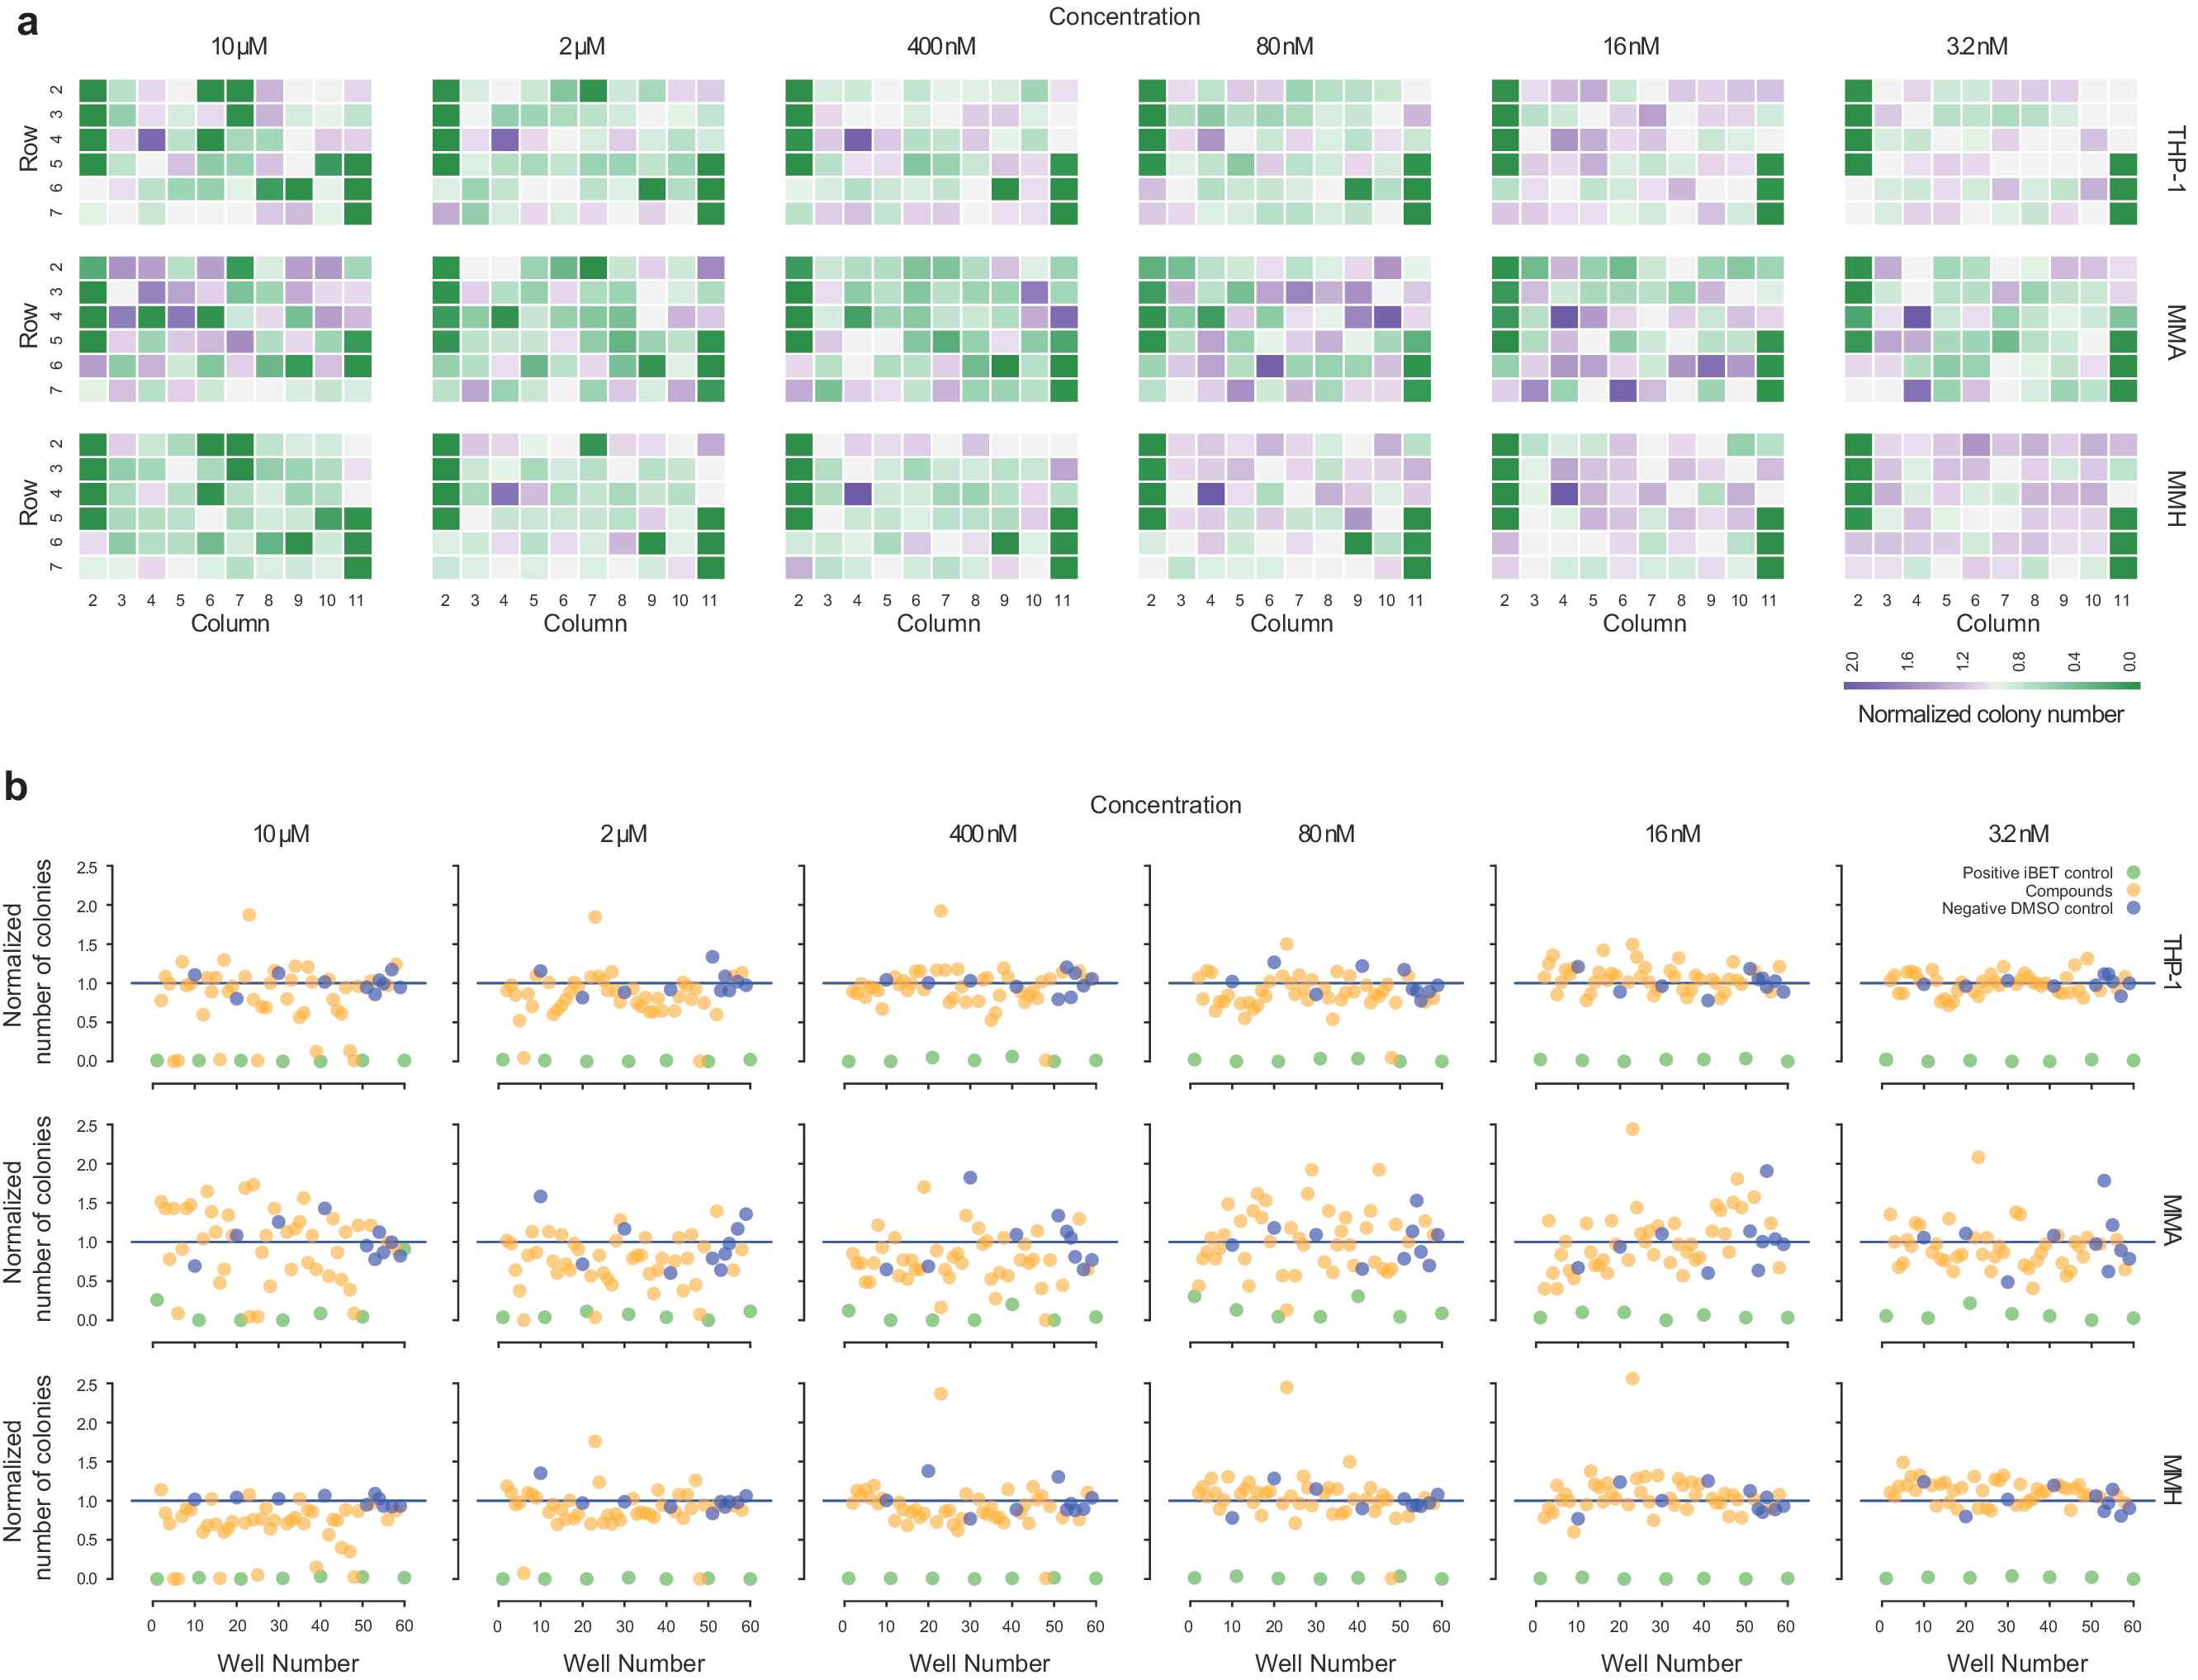
Colony numbers across entire screen. Heatmaps showing effect of compounds while maintaining positional information for each plate
Hits Based on a Reduction in Colony Numbers (P < 0.0001)
Unsupervised Clustering and PCA Identify Novel Colony Phenotypes
Although we had discovered clear hits based on a reduction in colony number, ultimately our goal was to find compounds that induce differentiation within the leukemic colonies, ideally resulting in a less aggressive clinical phenotype and potentially having more specificity (with fewer side effects than a toxic compound that indiscriminately kills proliferating stem cells). To this end, we performed morphology and texture analysis to give 21 further parameters describing each colony (examples in Fig. 4a). Well-level data for the entire screen were further analyzed by using hierarchical clustering (Fig. 4b). Wells containing colonies from the same cell line largely cluster together, demonstrating a specific morphology profile for colonies derived from each cell type. Where there is intermingling of profiles from different cell lines, most of these wells had been treated with either the iBET-positive control (green) or a compound that reduced colony number at a particular dose (red). After treatment with a compound that affects colony number, wells containing affected colonies cluster together, rather than with their own genotype. This indicates that the phenotypic effect elicited by the compound is stronger than the original phenotypic similarity due to the genetics of each cell line.
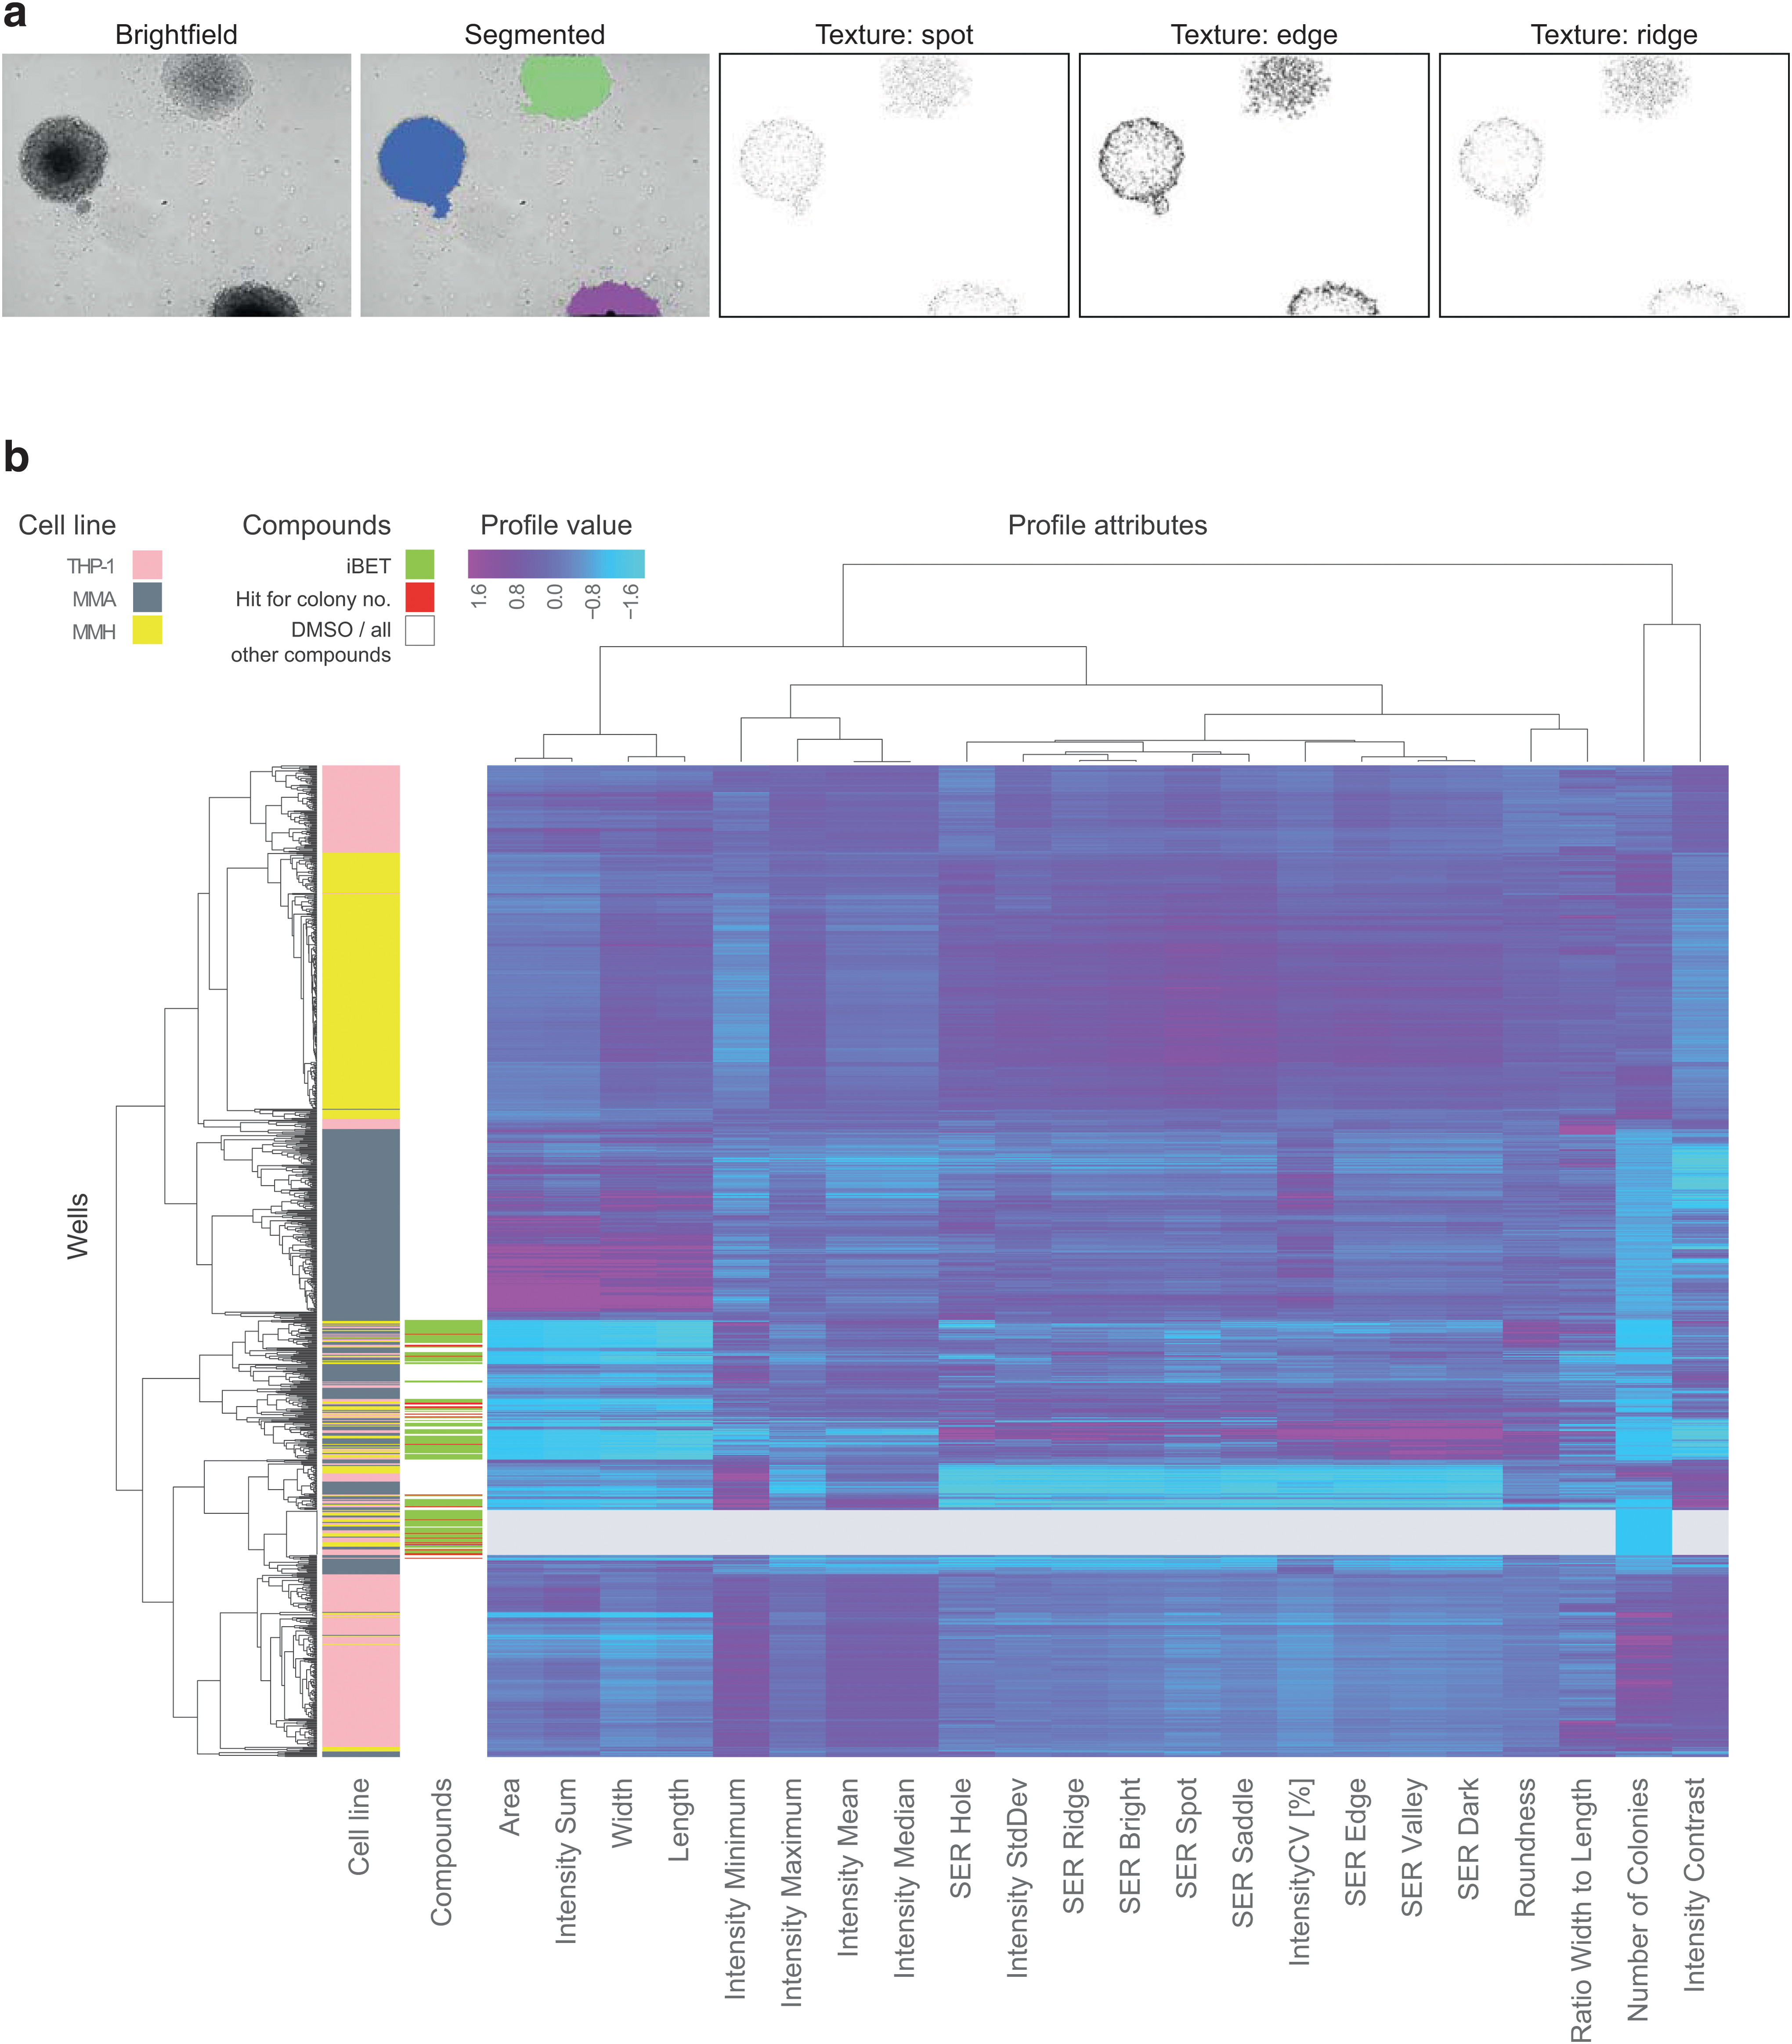
Hierarchical clustering of morphological phenotypes. An example BF image with segmentation and representations of the spot, edge, and ridge texture features
To investigate the presence of potentially novel phenotypes, colony morphology and texture was further analyzed by PCA. PCA was applied to the entire dataset, containing all cell lines and compound concentrations. The first three principal components (PC1, PC2, and PC3), respectively, capture 48%, 16%, and 12% of the variance in the data. In this PCA space, a clear separation of positive (green) and negative (blue) controls can be seen, particularly for the THP-1 and MMH cell lines (Fig. 5a, c). This separation is not as clear for the MMA-derived colonies (Fig. 5b). In all cases, the majority of compounds (yellow) are found clustering together with the dimethyl sulfoxide (DMSO) controls, having no effect. Many compounds are found in the same space as the positive controls (group i in Fig. 5a–c). These compounds overlap exactly with the hits based on a reduction in colony number (LAQ824, PFI-1, JQ1, GSK J4, NVS-1, OLAPARIB, Bromosporine, and CL994 in both THP-1 and MMH cell lines). As was the case for colony number, when only considering compounds at concentrations <10 μM, we are again left with JQ1 and LAQ824 and in the case of the THP-1 cell line also, PFI-1. Most interestingly, a single compound, GSK-LSD1 (at concentrations ranging from 10 μM to 16 nM) occupies PCA space orthogonal to the positive and negative controls (group ii in Fig. 5a, c), and it was not previously called a hit based on a reduction in colony number. Visual inspection of this phenotype shows colonies that have differentiated into single cells.

Orthogonal phenotype in PCA space. Three-dimensional scatter plots of first three principle components, plotted for each genotype
Discussion
Due to the high failure rate in target-based drug discovery approaches, 23 there is a need for renewed emphasis on phenotypic-based approaches 24 that recognize the complexity of the biology involved. 10 Recent advances in imaging, cell culture, and genetic engineering technologies, 25 combined with advances in machine learning 26,27 are converging to facilitate a high-throughput renaissance in empirical drug discovery by using more complex and relevant cell-based models of disease. In this study, we present a simple image-based screening methodology that relies on a complex but commercially available analysis pipeline. Our objective was not to come as close as possible to ground truth measurements or improve the error rate of manual counting. Our aim was to increase assay throughput while quantifying a phenotypic difference. In this study, we have used a machine-learning approach to automate the quantification of a label-free 3D methylcellulose colony formation assay, identifying a novel phenotype based on the induced morphological profiles.
BF is less perturbing and faster than fluorescent imaging in multiple channels and, thus, particularly well suited to complex live-cell kinetic and/or 3D assays. Combined with machine-learning-facilitated analysis, BF images provide a rich source of texture and morphology information that can be mined for novel phenotypes. Because our segmentation algorithm was texture rather than intensity based and trained specifically to only find in-focus colonies, this meant that we could screen in 3D and overcome the issues of uneven illumination across a well due to the gel meniscus. Further, because BF imaging is label free and permits live imaging with minimal genetic or chemical perturbation, the methods described here may be beneficial for personalized diagnostic applications using primary patient-derived cells. We have also used this approach to identify BF imaged liver organoids and in-focus cystic embryoid bodies grown in matrigel and stained with DAPI, followed by further nuclear segmentation (based on standard methods), estimation of relative cell numbers per cyst, and classification of cells based on fluorescent immunohistochemistry labeled markers (data unpublished). Thus, combining BF and fluorescent imaging can lead to even richer phenotypes in multiple tissue types and systems.
To identify and segment colonies in a BF image, it is critical that the colonies do not overlap. Typical image analysis strategies for segmenting touching objects in fluorescent images include peak intensity and shape or the more recently developed approach by the Horvath lab 28 that includes assumptions about nuclear shape and additive pixel intensities of overlapping nuclei. These approaches cannot be employed here as the method for identifying the colonies is texture based. This is a limitation of our approach and necessitates a lower object density to avoid overlap.
During initial assay development, we found it necessary to use non-tissue culture-treated edge plates (Nunc Cat. No. 267313) both to prevent colonies in contact with the bottom of the plate spreading over the plastic and to avoid what was obvious growth retardation in the outer wells, probably due to evaporation. As the number of compounds tested in this pilot screen allowed for only the inner 60 wells of each plate to be used, this further avoided any edge effects. However, for scale-up of compound numbers, it would be desirable to use all 96 wells in a plate. In this case, use of the edge plates would be necessary.
MMA colonies did not display an orthogonal phenotype in PCA space when treated with GSK-LSD1. However, manual examination of GSK-LSD1-treated wells in this cell line reveals a similar differentiation effect but with greatly reduced numbers of cells. These cells, however, had a curious elongated morphology (example seen in Figure 5b, GSK-LSD1 at 400 nM). Because the cells were sparse, they were not grouped as colonies by the algorithm and were lost during the size exclusion step after image segmentation. This compound has promise as a therapeutic agent, being potent down to 16 nM and producing the desired differentiation phenotype without an obvious toxic effect based on the continued presence of cells (and depending on genotype). Indeed, GSK-LSD1 has been through phase I clinical trials to assess safety and activity in patients with relapsed AML (under the generic name GSK2879552,
Future scaleup of this screening method would require development of a pipetting head and automation platform that are capable of dispensing large amounts of methylcellulose gel-containing cells. The current analysis pipeline holds enormous potential for repurposing to a variety of other 3D assay formats. We expect that future use of machine learning to analyze label-free images will aid in the identification of novel leads to treat a variety of diseases and in their initial diagnosis.
Footnotes
Acknowledgments
This project was funded by Cancer Research UK. The authors thank David Egan for a critical reading of this article and Claire Marshall (Thermo) for numerous plate samples during assay development. K.R.K. is a Cancer Research UK Senior Cancer Research Fellow.
Disclosure Statement
No competing financial interests exist.