Cytometry with a View: Application of Imaging Flow Cytometry
Hritzo MK, Courneya JP, Golding A. Imaging flow cytometry: a method for examining dynamic native FOXO1 localization in human lymphocytes.J Immunol Methods2018;454:59–70.
Abstract: While flow cytometry can reliably assess surface and intracellular marker expression within small cell populations, it does not provide any information on protein localization. Several key transcription factors (TF) downstream of lymphocyte surface receptors are regulated by nuclear versus cytoplasmic localization, and one such TF is Forkhead box O1 (FOXO1). FOXO1 integrates antigen-binding, co-receptor activation and metabolic signals in lymphocytes, leading to proliferation and differentiation. Importantly, the nuclear or cytoplasmic localization of FOXO1 is key for gene expression leading to different lymphocyte phenotypes. In effector lymphocytes (Teff), for example, lymphocyte receptor (TCR) signaling leads to an Akt-dependent phosphorylation of FOXO1. Phosphorylated FOXO1 is excluded from the nucleus, promoting proliferation and effector functions. In contrast, nuclear retention of FOXO1 is essential for early and late development of T and B cells and for the thymic development and stability of regulatory T cells. Given the critical role of FOXO1 localization as an indicator and determinant of function, quantification of FOXO1 cellular localization in human lymphocytes can help determine immune cell activation and activity in experimental and clinical scenarios. The standard method used to determine subcellular protein localization is the analysis of nuclear and cytoplasmic protein extracts by Western blotting (WB). However, available techniques, such as WB, are limited by a requirement for a large number of cells and inability to determine FOXO1 localization in individual cells or sub-populations. In contrast, a standardized method using an imaging flow cytometer (IFC) such as the Amnis ImagestreamX Mark II, would provide both qualitative, per-cell localization information, as well as quantitative data on gated sub-populations. To this end, we report the development and optimization of an IFC protocol to examine native FOXO1 localization in human lymphocytes. A human CD4+ lymphocyte line, HuT102, as well as primary human T cells, were assessed for dynamic FOXO1 localization after treatment with a lymphocyte receptor signaling mimic (PMA/ Ionomycin). IFC nuclear translocation analysis permitted us to precisely quantify the alterations over time in nuclear and cytoplasmic localization of native FOXO1 on a per cell basis, including within specific, user-defined sub-populations of cells. For human lymphocytes, using IFC to assess and quantify dynamic FOXO1 localization allows the user to simultaneously study multiple lymphocyte subpopulations as well as to delineate differing effects of dynamic FOXO1 localization that may be lost when other available methods are used.
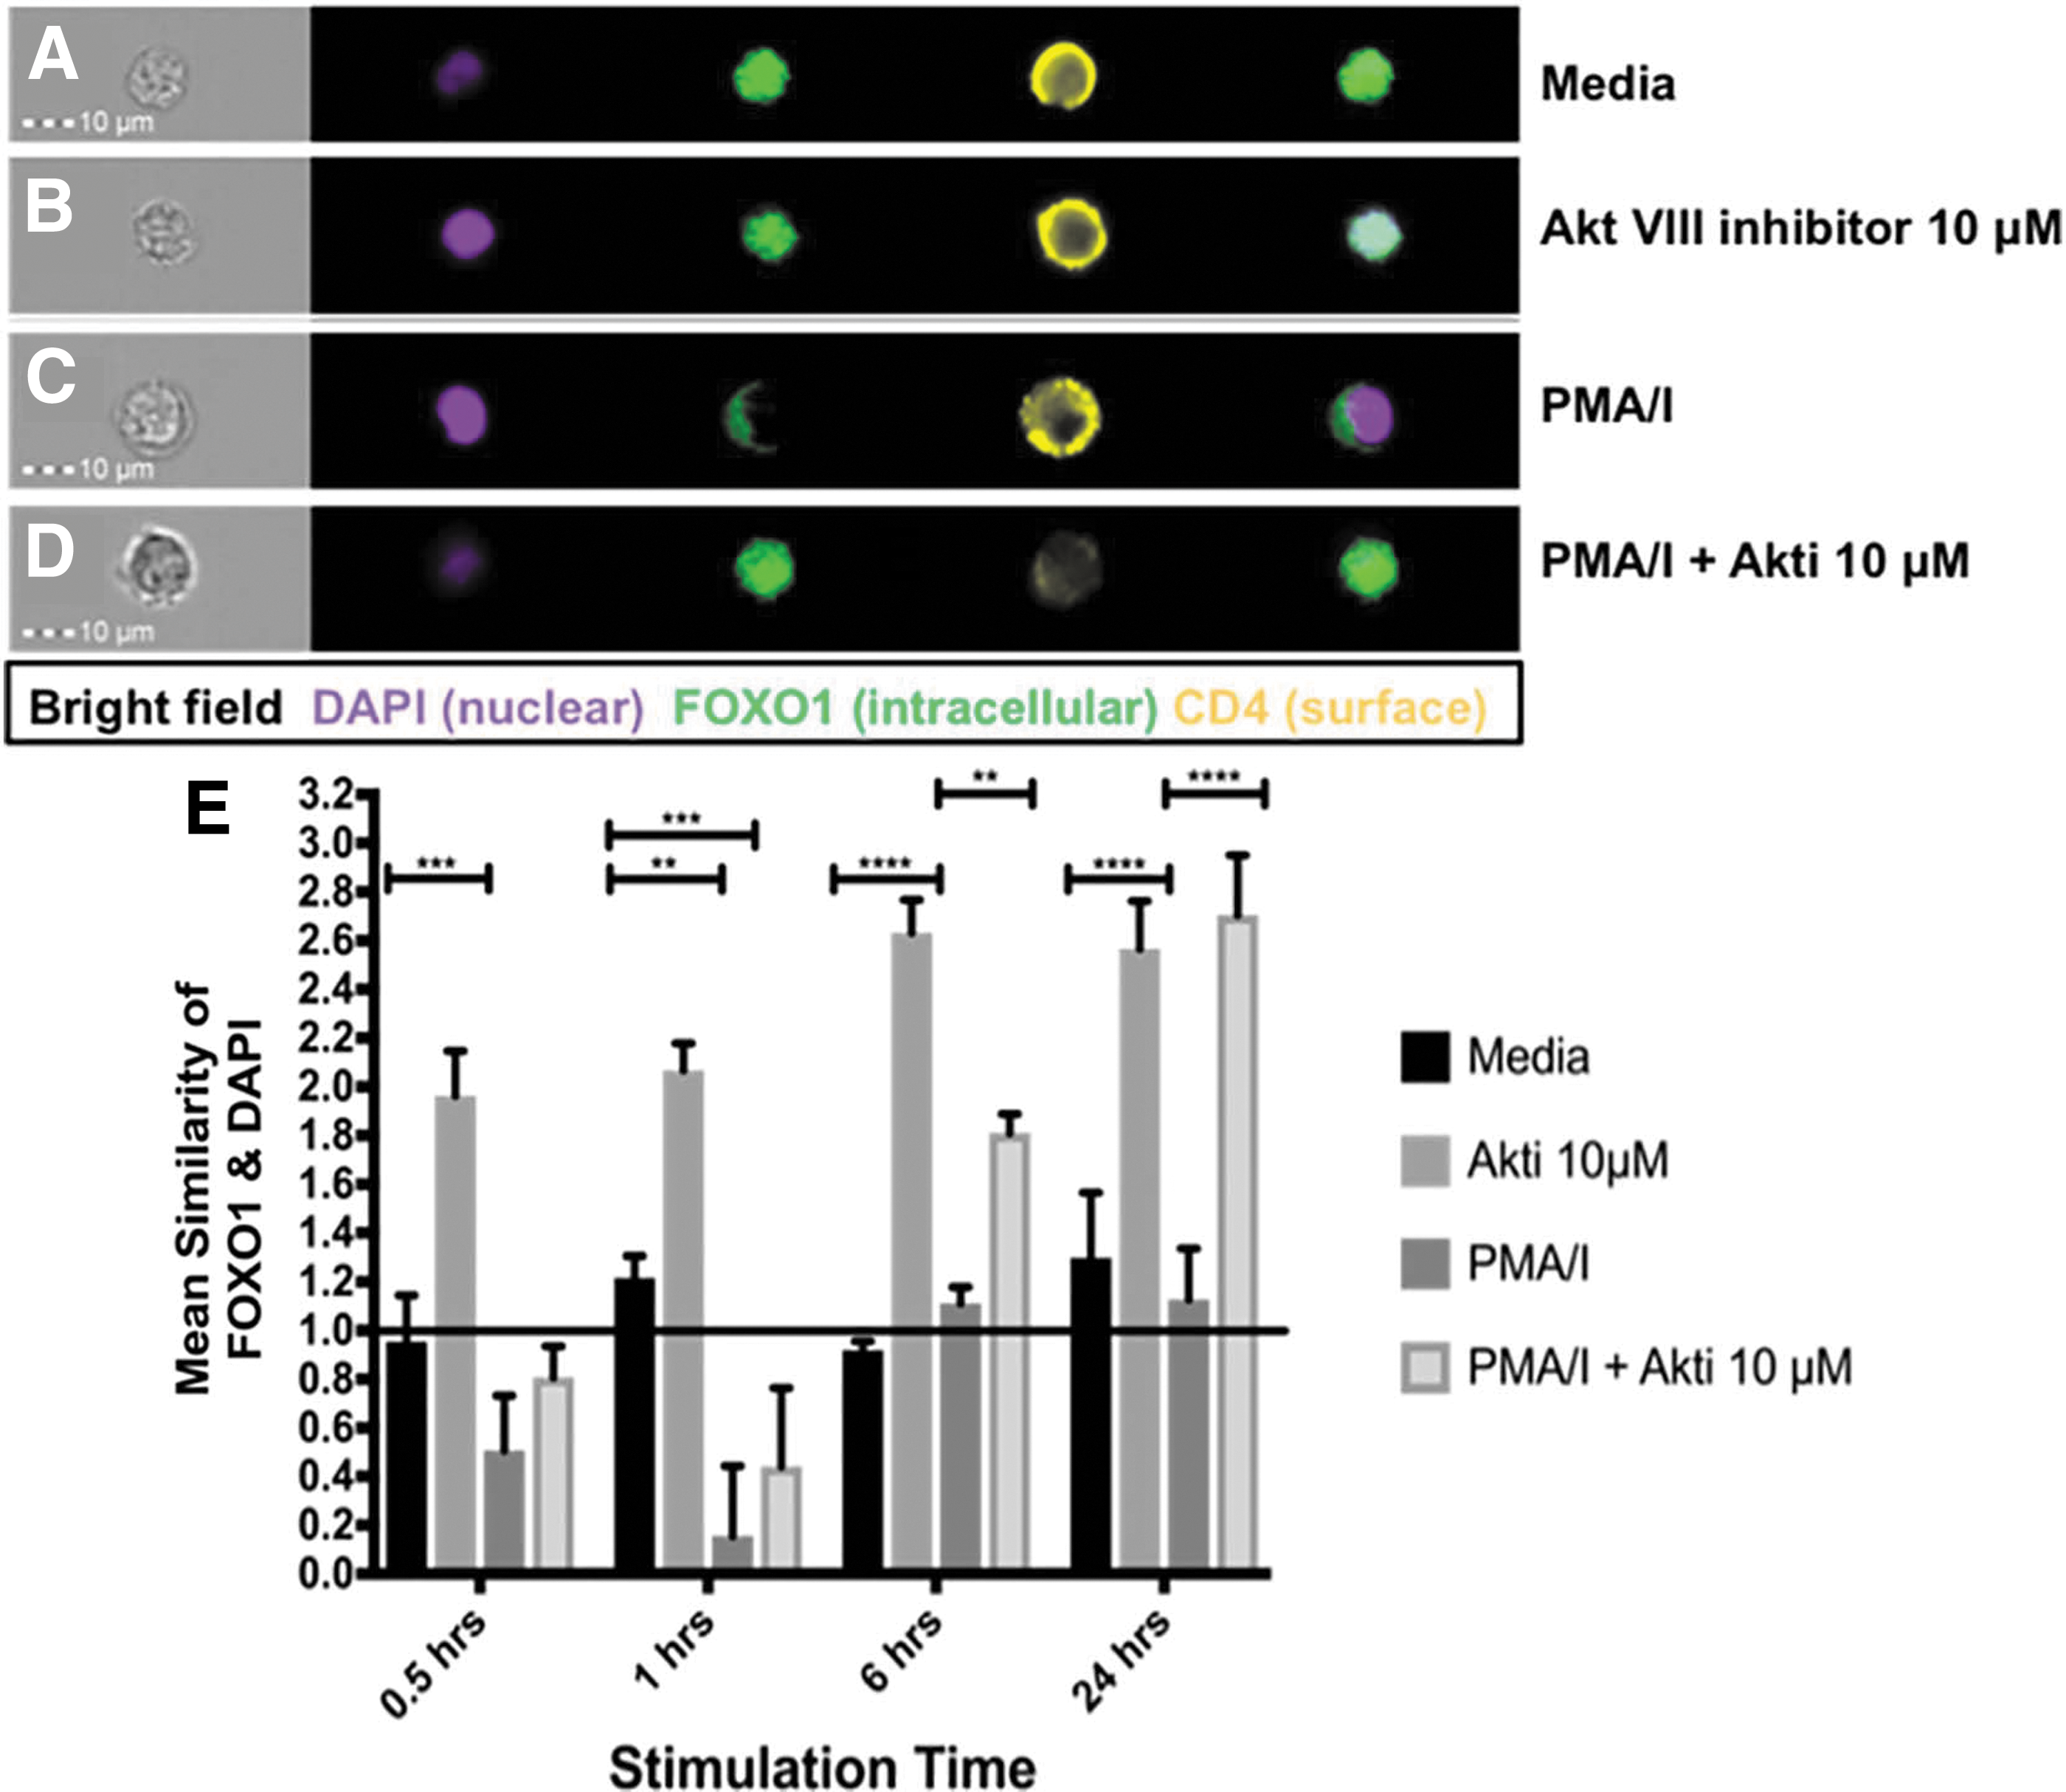
Commentary:Combining two high-content single-cell characterization technologies in a single readout, imaging flow cytometry (IFC) extends the reach of traditional flow cytometry (FC) to obtain single-cell morphological and intracellular localization measurements of desired targets. Used alone, FC can analyze cell surface and intracellular markers, cell supernatants, lysates, and gene expression in a format capable of instantly grouping cell sub-populations to detect even rare cell types among highly heterogeneous populations. In IFC, digital images of each cellular event are collected by magnifying single cells by 20 × , 40 × , or 60 × . Image content is collected by up to 10 fluorescent channels plus bright- and dark-field images. With IFC, cellular phenotypes can be more fully characterized by visualizing the cellular content behind the population distribution plots collected in traditional FC. In a recent article by Golding et al., IFC was used to characterize the intracellular localization of the transcription factor Forkhead box O1 (FOXO1). The authors first establish a model system to monitor FOXO1 in the human cutaneous lymphocyte lymphoma cell line HuT102. By using a classical approach of cellular fractionation and Western blotting, the authors show that this cell model is capable of detecting FOXO1 localization, which when untreated is expected to be located predominantly in the nucleus. Then, by using the TCR agonist, phorbol 12-myristate 13-acetate (PMA)/ionomycin (PMA/I), it is shown that over time FOXO1 expression then becomes shifted to the cytoplasm. This effect can then be reversed by treatment with an Akt VII inhibitor compound (see figure). It is noted that this approach requires at least 3 × 10⁶ cells per condition for an accurate measurement of protein localization, and on its own has no way to resolve a heterogeneous cell population. With these limitations in mind, the authors tested IFC as an alternate and potentially better approach to measure FOXO1 intracellular localization. Here, an Amnis Imagestream Mark II imaging flow cytometer with a 40 × objective was used to collect 10,000 cell events per sample in a time-course experiment. In this test, a live/dead dye to isolate viable cells, DAPI to identify the nucleus, and a CD4 receptor detection antibody were used along with intracellular staining to determine FOXO1 localization. Signal from both DAPI and FOXO1 was used to produce a similarity score by using a log-transformed Pearson's correlation coefficient calculation, which showed localization of FOXO1 primarily to the nucleus. With this baseline established, PMA/I treatment, AKT VII inhibitor, or both in combination were used to again characterize the modulation FOXO1. A heterogeneous population of human peripheral blood mononuclear cells was then used to observe the effects of PMA/I treatment in distinct CD4 and CD8 cell populations. Taken together, these results show that IFC is a reliable system for the characterization of FOXO1 localization and, compared to other established methods, requires far fewer cells and is capable of locating FOXO1 expression in defined single-cell sub-populations. Noted is the low cell number needed for IFC, which is crucial in such studies of generally lymphopenic patients. This observation suggests that this technology could provide from numerous applications in high-throughput 384/1536 plate-based assays that have restrictively low cell numbers. Contributed by Aaron Wilson.
IFC can detect dynamic FOXO1 localization in HuT102 cells treated with an Akt inhibitor or a TCR signaling mimic. HuT102 cells were exposed to media (A), an Akt inhibitor (AktVIII, 10 μM) (B), a TCR signaling mimic, PMA/I (C), or PMA/I + Akti (10 μM) (D), intracellularly stained for FOXO1 and the nucleus (DAPI), and analyzed via IFC. Overlay images confirm that HuT102 cells have nuclear FOXO1 (A), while Akt inhibition increases nuclear FOXO1 (B), PMA/I pushes FOXO1 more cytoplasmic (C) (representative images, 40 × , 1 h), and Akti reverse the PMA effect (representative image, 40 × , 6 h, D). The mean similarity of FOXO1 and DAPI in HuT102 cells was quantified at 0.5, 1, 6, and 24 h (E) and showed that Akt inhibition significantly increases nuclear FOXO1 at all time points ( p < .001, p < .01, p < .0005), PMA/I significantly decreases nuclear FOXO1 ( p < .001) at 1 h, while the Akti reverses the PMA/I effect on FOXO1 at 6 and 24 h ( p < .01, p < .0005). Average of three separate experiments. Mean similarity ≥1 (black line) indicates nuclear FOXO1. Error bars depict standard error of the mean.
HCI QC
Bray M-A, Carpenter AE. Quality control for high-throughput imaging experiments using machine learning in Cellprofiler.Methods Mol Biol2018;1683:89–112.
Abstract: Robust high-content screening of visual cellular phenotypes has been enabled by automated microscopy and quantitative image analysis. The identification and removal of common image-based aberrations is critical to the screening workflow. Out-of-focus images, debris, and auto-fluorescing samples can cause artifacts such as focus blur and image saturation, contaminating downstream analysis and impairing identification of subtle phenotypes. Here, we describe an automated quality control protocol implemented in validated open-source software, leveraging the suite of image-based measurements generated by CellProfiler and the machine-learning functionality of CellProfiler Analyst.
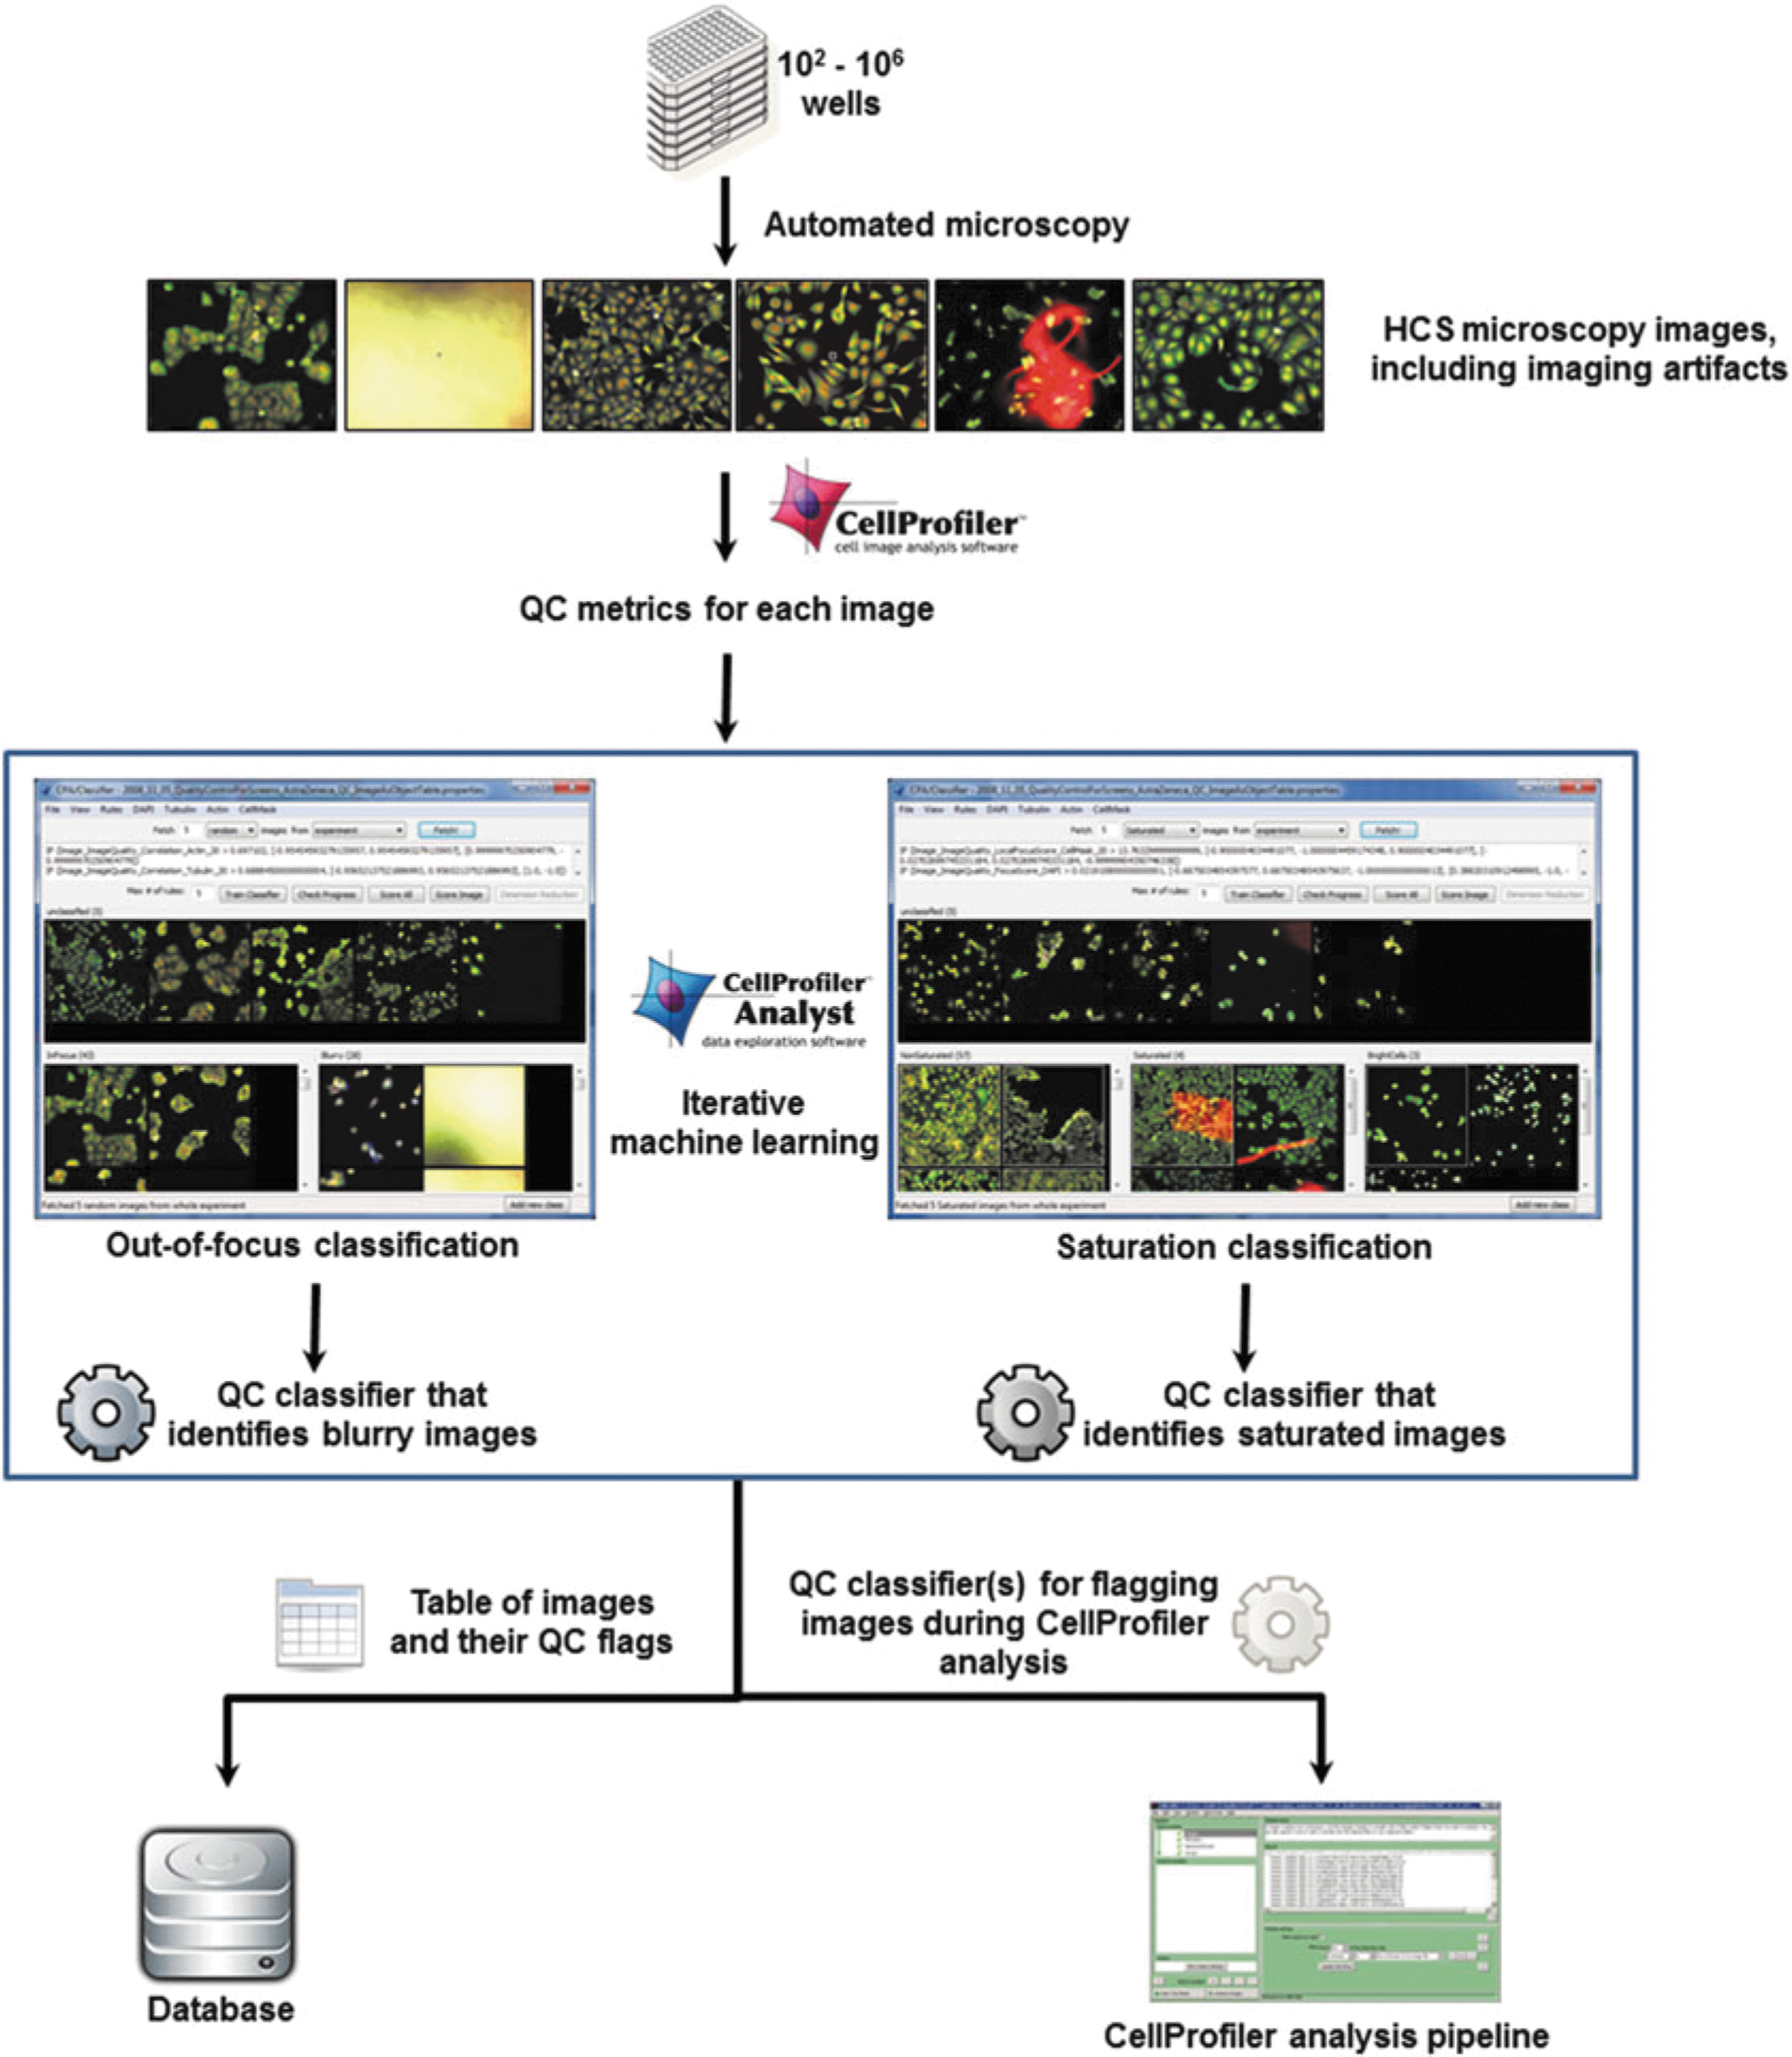
Commentary:Implementation of automated image quality control (QC) annotation workflows in high content imaging (HCI) data sets can substantially reduce data variability due to artifacts resulting from a range of technical issues. This is particularly true in high content screening (HCS) assays where manual QC review is impractical due to the large number of images acquired. Identification and subsequent correction or removal of images with QC issues in HCS image sets such as out of focus images, debris, and large areas of pixels with saturated intensity values are important steps in both traditional model-based image segmentation and machine learning (ML)-based applications. Reducing the number and severity of image artifacts reduces the time required for manual review and data masking, allows for the detection of more subtle phenotypes, and provides an effective method to identify problem images that may provide evidence of technical issues during assay development. In this article, the authors provide a framework that allows scientists conducting HCI-based assays to leverage the CellProfiler (CP) and CellProfiler Analyst (CPA) open source software packages to implement supervised ML-based image QC classification on a variety of computational platforms, ranging from personal computers to high-performance computing clusters (see figure). The flexibility of this framework allows for processing of data sets ranging in scale from dozens of images to hundreds of thousands or more, and the resulting image QC classification workflows can be deployed on computational platforms of differing scales and configurations with minimal modification. The authors provide an example analysis pipeline and compatible example image data set, along with detailed step-by-step instructions for pipeline configuration and execution. The workflows described in this article are useful in a variety of scenarios, ranging from assay development, preliminary batch and campaign-level experimental QC, and analysis of large data sets, to phenotypic profiling via machine learning. An example QC CellProfiler pipeline is available on the Broad Institute web site (https://pubs.broadinstitute.org/bray_methodsmolbiol_2017/). Contributed by John Concannon.
Overall quality control workflow. A suite of image quality measures are obtained by CellProfiler from images collected by an automated microscope. These measurements are used as input into a supervised machine learning tool in CellProfiler Analyst; the researcher then trains the computer to classify images as out‐of‐focus or containing saturation artifacts. The classifier then scores all images from the experiment, with the QC results stored as metadata in a database, or the classifier incorporated into an analysis pipeline
Stoked-Up Fluorescent Proteins
Wang S, Ding M, Xue B, Hou Y, Sun Y. Live cell visualization of multiple protein–protein interactions with BiFC rainbow.ACS Chem Biol2018;13:1180–1188.
Abstract: As one of the most powerful tools to visualize PPIs in living cells, bimolecular fluorescence complementation (BiFC) has gained great advancement during recent years, including deep tissue imaging with far-red or near-infrared fluorescent proteins or super-resolution imaging with photochromic fluorescent proteins. However, little progress has been made toward simultaneous detection and visualization of multiple PPIs in the same cell, mainly due to the spectral crosstalk. In this report, we developed novel BiFC assays based on large-Stokes-shift fluorescent proteins (LSS-FPs) to detect and visualize multiple PPIs in living cells. With the large excitation/emission spectral separation, LSS-FPs can be imaged together with normal Stokes shift fluorescent proteins to realize multicolor BiFC imaging using a simple illumination scheme. We also further demonstrated BiFC rainbow combining newly developed BiFC assays with previously established mCerulean/mVenus based BiFC assays to achieve detection and visualization of four PPI pairs in the same cell. Additionally, we prove that with the complete spectral separation of mT-Sapphire and CyOFP1, LSS-FP-based BiFC assays can be readily combined with intensity based FRET measurement to detect ternary protein complex formation with minimal spectral crosstalk. Thus, our newly developed LSS-FP-based BiFC assays not only expand the fluorescent protein toolbox available for BiFC but also facilitate the detection and visualization of multiple protein complex interactions in living cells.
Commentary:Fluorescent proteins (FPs) have enabled a large range of cell-based assays, including high-content imaging approaches, which examine both expression and localization of the reporter in cells. One issue when multiplexing any fluorescent reagent is spectral overlap of the donor and emission channels, as the different FPs must have sufficient spectral separation for specific detection. To address this issue, a few large Stoke-shift FPs (LSS-FPs) have been described, which include the green fluorescent protein (GFP) mT-Sapphire (λex = 399, λem = 511) and the orange fluorescent protein CyOFP1 (λex = 488, λem = 589; CyOFP1 has broad excitation and emission spectra). These LSS-FPs have a brightness that is between 85% and 95% of GFP. This manuscript describes the construction of the split versions of these LSS-FPs to enable bimolecular fluorescence complementation (BiFC) assays. mT-Sapphire was split between amino acids Ala154 and Asp155, yielding two nonfluorescent fragments. Similarly, CyOFP1 was split between Asp151 and Gly152, yielding N- and C-terminal nonfluorescent fragments. Fusing these fragments to different interacting proteins, which localized to different cellular compartments such as β-Jun/β-Fos (nucleoli), Jun/β-Fos, and Bak/Bcl-xL (mitochondria), showed bright fluorescence in the expected cellular compartments for optimized BiFC pairs. Optimization involved testing all eight possible N and C terminal fusions to the two interacting proteins. For example, testing all eight combinations of β-Jun/β-Fos fused to the N- and C-terminal fragments of CyOFP1 showed that five were able to complement, yielding bright fluorescence upon reconstruction of the FP. In contrast, little fluorescence signal was observed when non-interacting proteins were fused to the FP fragments. Furthermore, the researchers demonstrate that closely related fragments can cross-complement, yielding reconstructed FPs with new spectral properties. Split fragments from mCerulean and mVenus, which differ by either one or two amino acid differences with the C-terminal fragment of mt-Sapphire, are shown to cross-complement with mt-Sapphire, yielding new BiFC donor fluorescent proteins that can be used to studying protein–protein interactions (PPIs) in cells. With this toolbox of BiFC assays in hand, four PPIs could be visualized in cells (see
figure
). In addition, a BiFC FRET assay was constructed to measure the ternary complex of β-Jun-β-Fos-NFAT1 in live HeLa cells. The use of LLS-FPs greatly reduces the issues of spectral bleed-through found in the commonly used CFP/YFP FRET pair. These new FPs described in this paper should further expand applications in both imaging and flow cytometry based assays. Contributed by Doug Auld.
Simultaneous visualization and tracking of four PPI pairs in the same cell with the BiFC rainbow. HeLa cells were cotransfected with mTSapphire‐ N‐Bak, mT‐Sapphire‐C‐Bcl‐xL, Lifeact‐CrN173, Lifeact‐CC155, Jun‐VN173, β‐Fos‐CC155, β‐Jun‐CyOFP1‐C, β‐Fos‐CyOFP1‐N. Images were acquired through mT‐Sapphire (A), mCerulean (B), GFP (C), and CyOFP1 (D) channels 24 h after transfection. The image acquired from mT‐Sapphire channel was colored magenta in the merged image. (F–K) Six selected frames of a living HeLa cell expressing BiFC rainbow detecting four PPI pairs from a 20‐frame movie. Scale bar, 15 μm.