
Abstract
By adding biological information, beyond the chemical properties and desired effect of a compound, uncharted compound areas and connections can be explored. In this study, we add transcriptional information for 31K compounds of Janssen's primary screening deck, using the HT L1000 platform and assess (a) the transcriptional connection score for generating compound similarities, (b) machine learning algorithms for generating target activity predictions, and (c) the scaffold hopping potential of the resulting hits. We demonstrate that the transcriptional connection score is best computed from the significant genes only and should be interpreted within its confidence interval for which we provide the stats. These guidelines help to reduce noise, increase reproducibility, and enable the separation of specific and promiscuous compounds. The added value of machine learning is demonstrated for the NR3C1 and HSP90 targets. Support Vector Machine models yielded balanced accuracy values ≥80% when the expression values from DDIT4 & SERPINE1 and TMEM97 & SPR were used to predict the NR3C1 and HSP90 activity, respectively. Combining both models resulted in 22 new and confirmed HSP90-independent NR3C1 inhibitors, providing two scaffolds (i.e., pyrimidine and pyrazolo-pyrimidine), which could potentially be of interest in the treatment of depression (i.e., inhibiting the glucocorticoid receptor (i.e., NR3C1), while leaving its chaperone, HSP90, unaffected). As such, the initial hit rate increased by a factor 300, as less, but more specific chemistry could be screened, based on the upfront computed activity predictions.
Introduction
High-throughput screening (HTS) is the initial step by which the pharmaceutical industry identifies hit compounds for a desired activity. 1 This process can be either approached in a targeted manner or by using phenotypic HTS where molecules are identified, which induce a desired phenotypic change, while the concrete mechanism of action (MOA) is initially not known. However, compounds can reveal a broad activity spectrum, beyond the desired phenotypic change they induce. Hence, counter screens, selectivity assays, and toxicity assessments are set up to prevent further development of those molecules that lack a therapeutic window (i.e., limited dose range in which the desired activity is measured with no or limited undesired effects). It is, however, desirable to devise strategies that uncover these adverse effects at early stages, reducing compound attrition rates that are still high, 2 Smietana_2016. As a result, pharmaceutical companies have been investigating novel ways to add compound annotation beyond the chemical structure and the on-target, desired, effect. The utility of observed phenotypic activity and other induced biological effects is explored to select and/or flag compounds at the very early steps in the drug discovery process.
High-throughput characterization of transcriptional effects in cells that are exposed to small molecules is one of the currently explored methodologies. 3 –5 Genes that are differentially expressed in this compound exposure setting can be translated into gene signatures, which can be used to discover new connections among compounds, pathways, diseases, and/or phenotypic states in general. 6 To this end, Lamb 6,7 generated the genome-wide gene expression profile in four human cell lines treated with 1309 compounds at different concentrations, using the Human Affymetrix U133 platform and termed this the Connectivity Map (i.e., CMap).
Since the generation of the CMap, technological advances have been made, which could revolutionize high-throughput transcriptional profiling in drug discovery and development. Using combined multiplex ligation mediated amplification with the Luminex FlexMap (Luminex, Austin, TX) optically addressed and barcoded microsphere, and flow cytometric detection technology, Peck et al. 8 developed, for instance, a cost-effective transcriptional profiling methodology in which up to 100 transcripts could be measured in HTS mode. This technology was further developed at the Broad institute to accommodate the direct measurement of 978 carefully selected human gene transcripts and infer the expression values of the remainder, based on computational models that were trained on historical gene expression profiles. Known as L1000 and commercialized by Genometry, Inc. (Cambridge, MA), this automated assay can now be used to screen and measure the transcriptionally induced effect(s) of thousands of compounds per day at a cost far below conventional transcriptomic techniques like microarrays. 9 As such, L1000 enabled the generation of more than a million transcriptional profiles for over 19811 small molecule drugs, tool compounds, and screening library compounds across 3–77 cell lines in the NIH-funded and publicly available LINCS program. 9
Transcriptional similarity between a query gene signature, comprising upregulated and downregulated genes, and the reference CMap/LINCS profiles can be computed by the connectivity score proposed by Lamb. 6 The latter estimates whether the upregulated and downregulated signature query genes are, respectively, correlated or anticorrelated with the reference profiles (i.e., rank based on correlation with query). This methodology has been widely used to recognize drugs with a common MOA, 10 discover new MOA, 6 flag adverse effects, 11 and/or reposition existing drugs. 12 Meanwhile, a variety of similarity-based methods have been proposed for the large-scale analysis of transcriptional drug response profiles, as reviewed by Cha et al. 13 Based on a selection of 29 drugs, Cha et al. 13 showed that the connectivity score is slightly outperformed by the connection methodology proposed by Zhang and Gant, 14 which will be adopted in this article.
Next to similarity-based approaches, one can also use the rich high-dimensional transcriptional compound data to train computational models through machine learning algorithms. The latter aims to predict in which assay a novel compound is likely to be (in)active. Those can either be targeted assays (e.g., biochemical protein binding assays) or phenotypic assays (e.g., genotoxicity assays). Using these predictions, at early stages, one can immediately prioritize compounds and evaluate which compounds need which type of experimental follow-up. As such, computational methods are gaining momentum in the field of drug discovery, as they promise to accelerate the discovery of new therapeutic compounds, while reducing attrition rates. 15,16
Against this background, we profiled 31K compounds of the primary Janssen screening deck in MCF7 cells using the L1000 platform. We investigated under which conditions the transcriptional connection score, proposed by Zhang and Gant, 14 is best used when ranking compounds, based on a query gene signature. The 31K, L1000 profiled compounds were subsequently used to predict their activity against the glucocorticoid receptor (GR, gene symbol: NR3C1 - nuclear receptor subfamily 3, group C, member 1) and heat shock protein (HSP90) genes, using machine learning-based predictive models. These models were trained on Monte Carlo-based sampling of 115 known NR3C1 and/or HSP90 (in) active L1000 profiled compounds. Both NR3C1 and HSP90 play a crucial role in GR signaling pathways, which in turn regulate genes that control, among others, cognition (memory), stress response, metabolism, immune response, and fetal development. In the absence of glucocorticoids, the GR is packaged into multiprotein complexes consisting of heat-shock proteins (e.g., HSP90, HSP70, and HSP23) and immunophilins (e.g., FKBP5, also known as FKBP51), which bind to the receptor and keep it sequestered and inactive in the cytoplasm. 17 A growing body of evidence shows that many depressed patients consistently exhibit hyperactivity of the hypothalamus—pituitary—adrenal axis, which results in increased levels of the glucocorticoid hormone cortisol. 18 Hence, it has been proposed that blocking the GR with an antagonist may reduce the effects of high glucocorticoid levels on the brain, and thus represent a potential treatment strategy for depression. 19,20
Materials and Methods
L1000 Assay
The experimental setup is graphically represented in Figure 1. Compounds were transcriptionally profiled in the MCF7 human breast epithelial adenocarcinoma cell line (ATCC HTB-22). After the start of each new cell culture, one flask of MCF7 cells was tested for possible mycoplasma contamination. Five thousand cells of the MCF7 were plated per well in a 384-well cell culture plate (i.e., 40 μL/well). The cells were incubated for 24 h at 37°C. When the monolayer was approximately 75% confluent, compound, positive controls (i.e., LY-294002, Estradiol, tanespimycin, and trichostatin) or vehicle samples (i.e., DMSO) were added to a final volume of 50 μL/well, yielding a compound concentration of 1 μM and a positive control concentration of 30, 0.1, 1, and 0.1 μM respectively. The 384-well plates were stored in an incubator for 7 h at 37°C, after which 45 μL of a lysis buffer (i.e., Qiagen; 1031576) was added to each well. The plates were subsequently kept at room temperature for 30' and sealed, after which they were stored at −80°C. The lysates were shipped on dry ice to Genometry, Inc., where the L1000 assay is run. The data were preprocessed by Genometry, Inc., following their standard procedure of gene assignment, invariant set normalization within each sample, quantile normalization across samples within each 384-well plate, and a log2 transformation of the signal.

Graphical representation of the experimental setup. L1000 profiling of 31K compounds of Janssen primary screening deck in MCF7 cells and data analysis flow for computing compound similarity (“c” Zhang connection score), and machine learning-based compound activity predictive models. For clarity reasons, only five L1000 genes and two compound treatments are visualized, indicated by different compound and transcript coloring.
Transcriptional Similarity: Zhang Connection Score
The transcriptional effects for each of the 31761 samples were assessed by a Limma differential gene expression analysis. 21 The t-and P-values from this test were computed on the log2-transformed signal for each of the 978 measured genes versus the vehicle sample distribution within the same plate. A total of five genes were filtered out of the analysis, because the t-statistics could not be computed, due to unique signal intensities across all samples (i.e., CCDC86, SLC25A14, NSDHL, ATP6 V1D, and CDC45 L). The P-values were moderated across all tested genes, with the variances of the vehicle samples pooled across all genes. The eBayes function of the R limma package was used for this purpose at a 5% significance level. The Benjamini-Hochberg algorithm was applied to correct for multiple testing. As such, each compound could be rewritten as a vector of t- and p-statistics. The magnitude of the compound effect is given by the P-value, while the direction of the effect is denoted by the sign of the t-value. Based on these two parameters, the 973 genes could be ranked and signed for each of the 31,761 samples.
Transcriptional similarity between a gene signature (i.e., query s) and a transcriptional profile of a compound (i.e., reference R) was computed for all genes “g” in the signature using the standardized ranked Zhang connection score
14
c that ranges between +1 and −1 (Fig. 1):
With Cmax the maximum possible connection score, where m is the number of genes in the query and N is the number of reference genes,
Zhang connection scores were computed for all 15456 pairwise comparisons between compounds and positive controls, affecting significantly at least one gene, using five different gene inclusion criteria for the query compound: (a) All 978 signed ranked genes were used (m = 978) (b) The top five highest ranked genes were used (m = 5) (c) The significant signed ranked genes were used (m = number of significant genes) at a 0.1% significance threshold (d) The significant signed ranked genes were used (m = number of significant genes) at a 0.05% significance threshold (e) The significant signed ranked genes were used (m = number of significant genes) at a 0.01% significance threshold
Since approaches (b)–(e) will often result in nonreciprocal Zhang scores between two compounds, depending on the choice of query and reference compound, and since the number of genes that are included in the analysis may affect the magnitude of the Zhang connection score, a methodology was developed to estimate the significance of the obtained transcriptional connection scores. 6,14
The methodology used to estimate P-values based on the Zhang score 14 was extended to confidence intervals. A total of 1 × 10⁵ random gene signatures were created, with m = 5, on a subset of the compound data (N = 5682). The resulting distribution of the Zhang scores obtained from the random gene signatures, with 5 genes for each of the 5682 samples, could be approximated by a normal distribution. By varying m, the effect of the gene signature size on the population metrics of the randomized Zhang connection score distribution was assessed. The generalized mean and standard deviation from these different distributions were computed to determine a confidence interval of an obtained Zhang connection score, for a given false positive rate.
Target Activity Predictions: Machine Learning Algorithms
When L1000 profiled compounds have activity data for a specific target, a cross-validated predictive gene signature can be constructed for that target, using machine learning algorithms (Fig. 1). For this purpose, the available target activity data were categorized into active and nonactive compounds and split into a training (67% of the data) and a test data set (remaining 33% of the data). A Monte Carlo cross-validation sampling procedure was adopted to generate eight of these training and test data sets, using a modified version of the function from the nlcv package in Bioconductor as to accommodate (a) prediction scores (votes) for the diagonal linear discriminant analysis (DLDA), (b) parallelization for random forest (RF), (c) the use of training samples only, in the training step for RF, and (d) add-ons in current and creation of additional visualizations.
The 973 genes were ranked in each of the 8 training sets by means of an RF procedure. Three diverse algorithms: DLDA, RF, and support vector machine (SVM) were subsequently used to create a gene signature from a gene set that contained an increasing number of the top featured genes. The three algorithms and selected genes were then used to make predictions in the corresponding test sample data set, assigning the test compounds to the active and nonactive classes. The quality of the gene signature was assessed by comparing the predicted versus the observed compound classification, using the balanced accuracy and Kappa statistic from the different models in the 8 different test sets. All quality metrics were computed with the confusionMatrix function in the caret package.
22
with pobs the observed agreement, pexp the expected agreement by chance alone, TP the true positive rate, TN the true negative rate, FP the false positive rate, and FN the false negative rate.
The optimal number of features is determined for each classification algorithm tested as the lowest number of features achieving a performance within one standard deviation of the highest performance (average Kappa across runs). Considering this optimal number of features, the algorithm with a Kappa difference less than 0.01 than the maximum performance obtained and using less than 25% of the total number of features is selected.
The target activity status for newly L1000 profiled compounds with unknown activity can now be predicted and the prediction strength was computed by the margin of victories, class probabilities, and probabilities computed from a logistic distribution in the DLDA, RF, and support vector machine models, respectively. (In)activity data for NR3C1 and HSP90 were available for 114 and 110 L1000 profiled compounds, respectively. Initial and confirmation activity data were obtained by the NR3C1 and HSP90 assay as described below:
NR3C1
The translocation of the GR, encoded by the NR3C1 gene, was measured using the brain epithelial neuroglioma cell line H4. GR was first driven out of the nucleus by incubating the cells for 24 h at 37°C in a medium containing charcoal stripped serum. The cells were seeded and stored overnight in an incubator at 37°C. Compound was subsequently added and the plates were preincubated for 1 h at 37°C. After compound addition and preincubation, hydrocortisone was added to the cells that induce the translocation of GR. After 1 h of incubation at 37°C, the cells were fixed with 5% formaldehyde and permeabilized with 0.3% triton. By measuring the fraction of GR in the nucleus versus that in the entire cell by immunofluorescence imaging, using the CV7000, the nuclear translocation of GR can be determined.
HSP90
HSP90 inhibition was measured using the CellSensor heat shock responsive element (HSE)-bla Hela Cell line (Invitrogen) that contains the β-lactamase receptor gene, controlled by an HSE-responsive element and a promotor cloned in front of the reporter gene. In each well, 5000 cells were seeded in 20 μL 1% Dulbeco's fetal calf serum containing the medium and incubated in a 5% CO2 incubator at 37°C for 16 h. After incubation, the cells were challenged for 5 h using a heat shock inducing tool compound at 1 μM. This heat shock response induces the activation of quiescent heat shock factor (HSF) monomers in the cytosol. Released HSF's trimerize and translocate to the nucleus of the cell, where they bind to their HSE-responsive elements and drive the transcription of β-lactamase. Finally, the CCF4 β-lactamase substrate was added to the cells for 4 h at room temperature. The expression of β-lactamase could subsequently be quantified using the ratio of the 460/535 nm signal output, measured by FRET technology, on Envison (Perkin Elmer), since the cleavage of the substrate by β-lactamase induces a shift in fluorescent signal
Results
To get an overview of the overall transcriptional effects 21 of all tested compounds, including positive controls, Figure 2A shows the distribution of the number of significantly differentially expressed genes for the 31761 samples. Most compounds affect only a limited number of the 978 measured genes (Fig. 2A). Indeed, the number of significantly affected genes ranges from 0 to 768, with an average of 29 and a median of 4 across the entire compound range (Fig. 2A). The number of compounds affecting each gene is represented in detail for the first 20 most specific compound classes (i.e., ranked by increasing number of affected genes) (Fig. 2B). Hence, each bar represents the compounds that affect the same number of genes. Within a bar, genes are ranked from the bottom to the top in decreasing order of appearance (Fig. 2B). It is clear from Figure 2B that no single gene or set of specific genes dominate this distribution. The most frequently affected gene (i.e., INSIG1) is significantly affected at maximum 1.4% of all samples of a category. When a small number of genes are affected significantly by a compound, they tend to be clearly separated from the remaining gene cloud, as expressed by the difference of the absolute median t statistic values from both the significant and nonsignificant gene distributions (Fig. 2C). This absolute median t statistic difference decreases when the number of significantly affected genes per compound increases (Fig. 2C). A total of 330 positive control measurements were analysed in this data set as well, yielding 88, 66, 89, and 87 replicate observations for LY-294002, estradiol, tanespimycin, and trichostatin, respectively. The median number of significantly affected genes across the control replicates, ranged from 3 in estradiol, 40 in tanespimycin, 49 in LY-294002, to 278 in trichostatin.
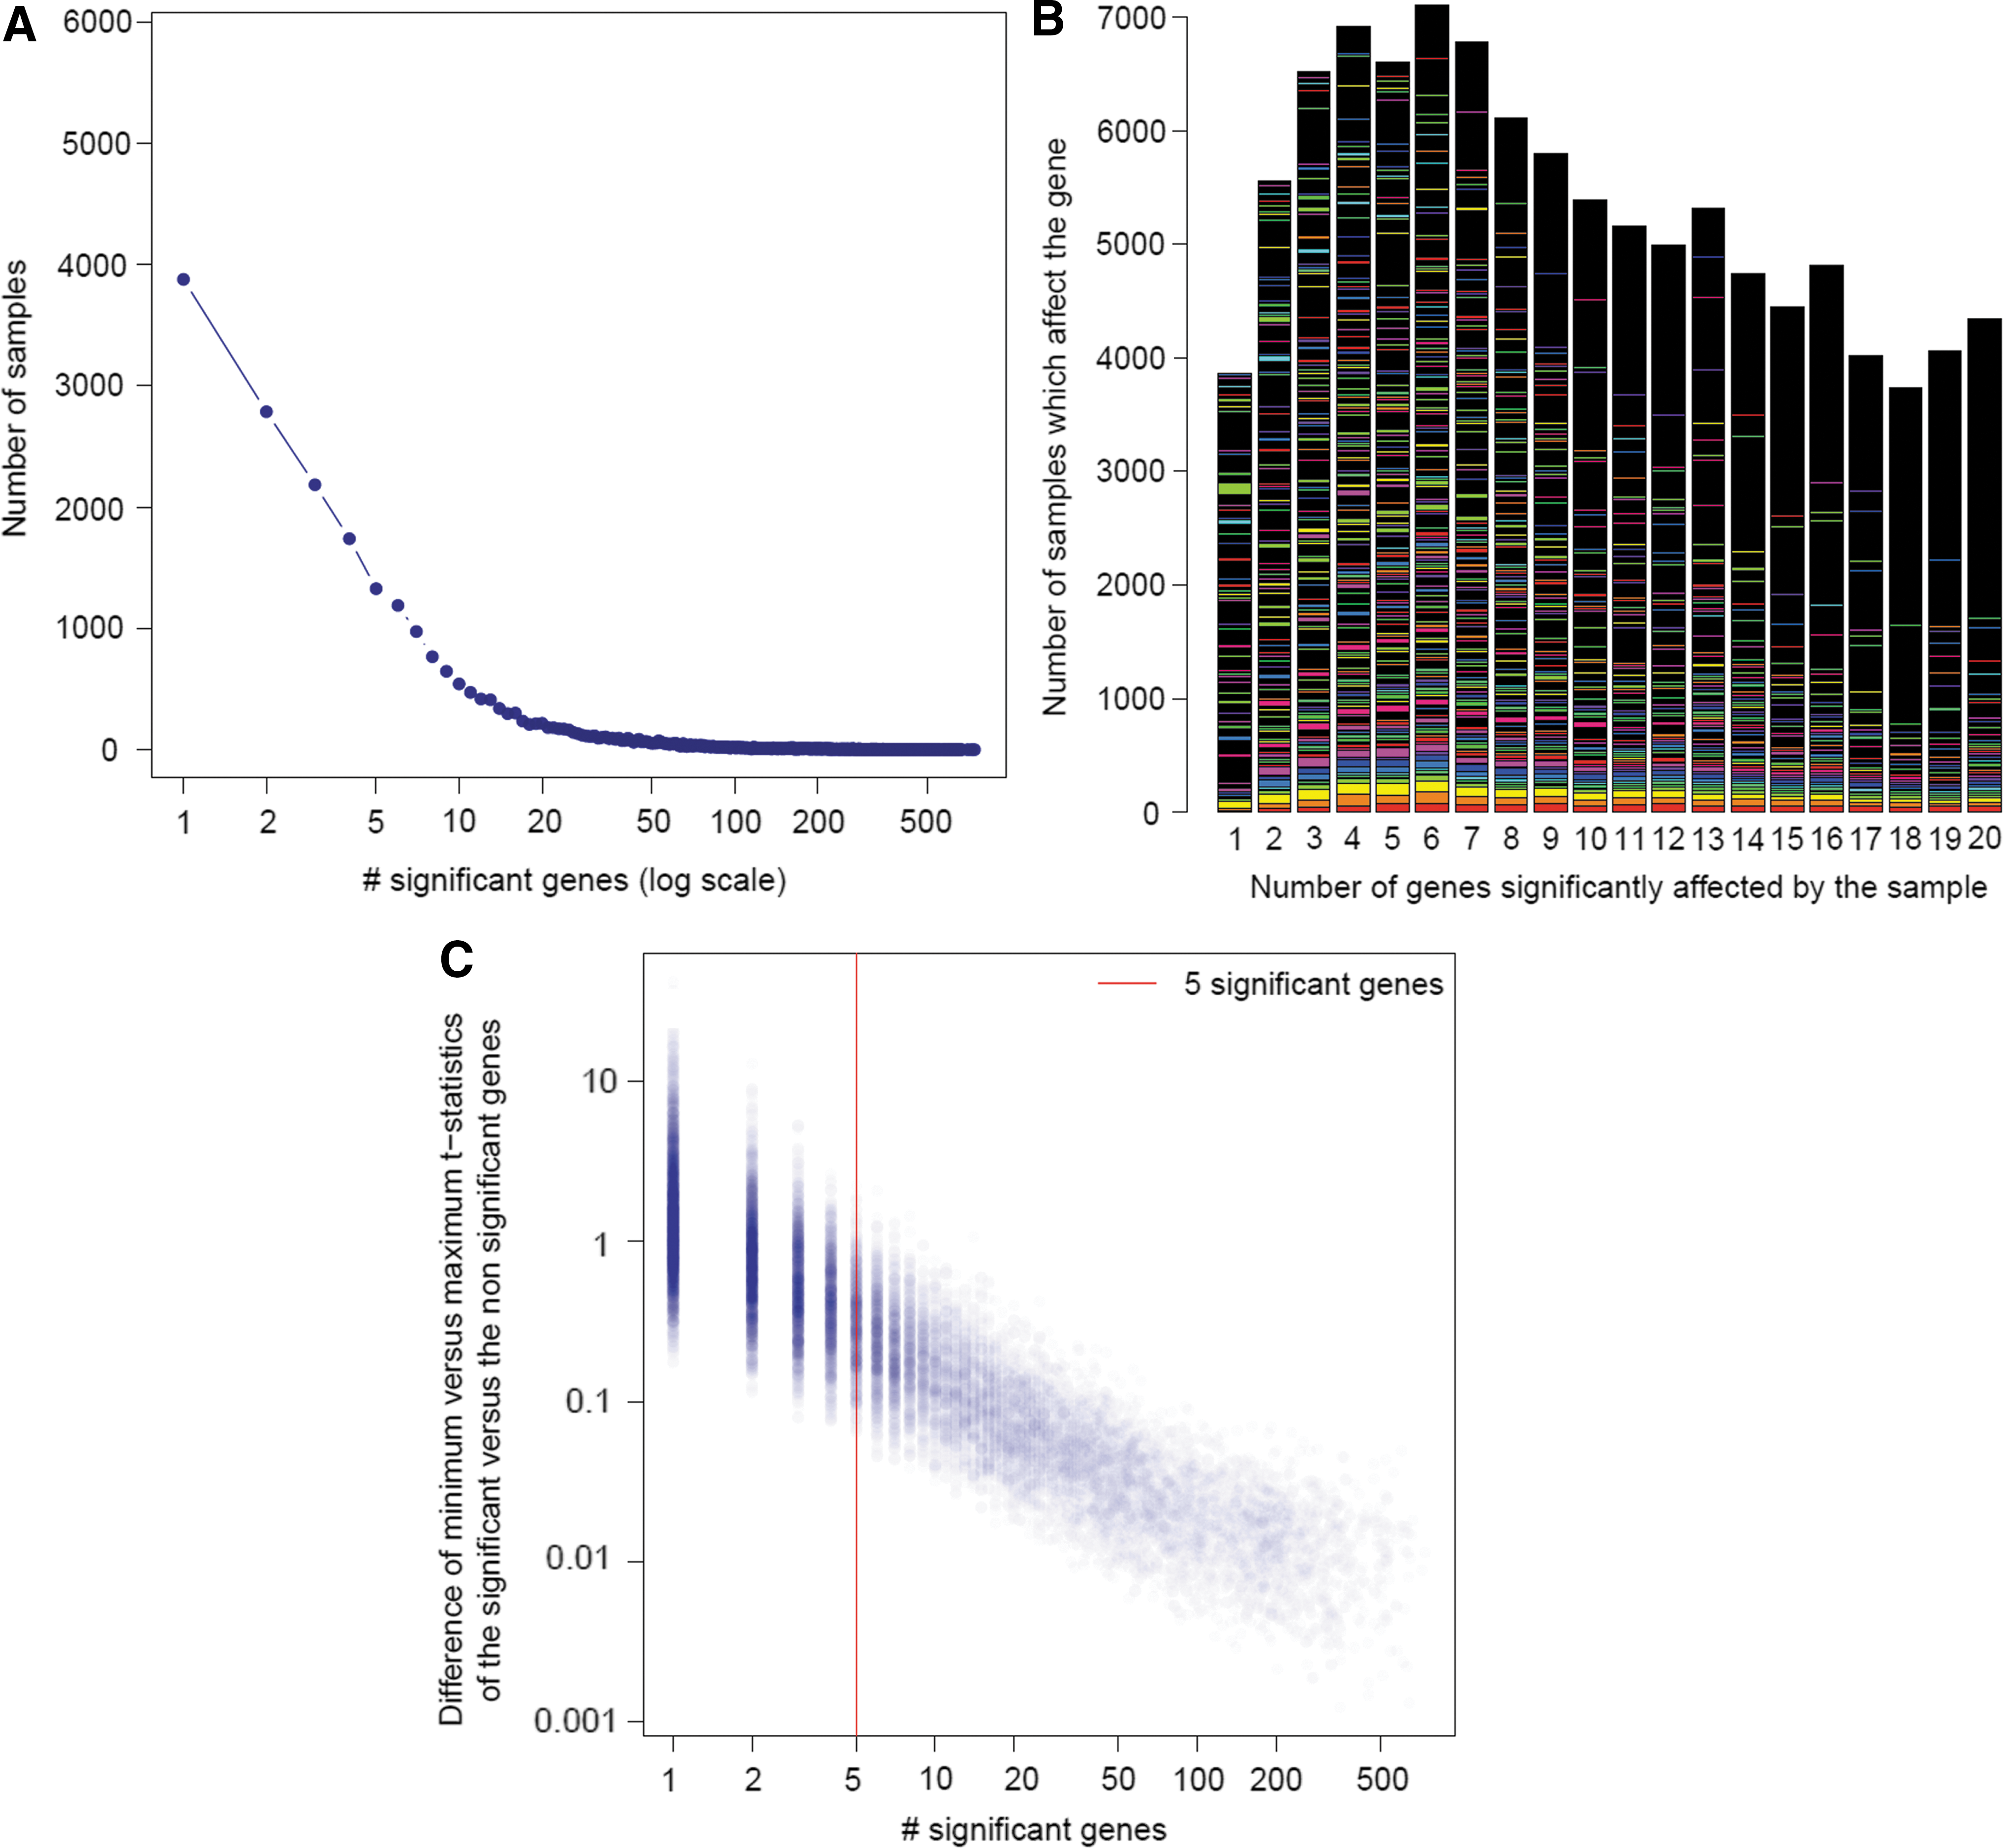
Number of significant genes
A total of 238,887,936 pairwise Zhang connection scores were computed, based on five settings, using (a) all genes, (b) the 5 most affected genes, (c) per treatment all significant affected genes at a 0.1% significance threshold, (d) per treatment all significant affected genes at a 0.05% significance threshold, or (e) per treatment all significant affected genes at a 0.01% significance threshold, in the query gene signature. The Zhang scores for these different conditions seemed to be normally distributed, and not centered around zero (Fig. 3A). When the number of genes present in the query gene signature decreased, the Zhang connection score distribution was flattened, as more compounds revealed transcriptional (anti) similarity with higher absolute Zhang scores. This was also illustrated when the Zhang connection scores for pairwise compound comparisons were plotted in function of different possible (di)similarity thresholds (Fig. 3B). Indeed, focusing on a subset of genes in the query led to a higher number of compound pairs that were picked up at higher Zhang connection score thresholds (Fig. 3B).

Effect of the gene signature length on the transcriptional similarity.
Likewise, the replicate similarity in each of the four controls decreased when all genes were used in the query gene signature (Fig. 4). The highest transcriptional reproducibility was obtained (across samples of the same positive control) when the query gene signature made use of the significant genes only, regardless of which of the four controls (Fig. 4). Nonetheless, there was still a big difference in reproducibility among the four controls, with estradiol (positive control with lowest signal) being the only control lacking good reproducibility among its replicates (Fig. 4). The Zhang connection score-based heatmaps also illustrated the loss of the symmetry of the connection score between two replicates, when a subset of genes was considered in the query sample (Fig. 4). Symmetry is, indeed, lost when both replicates affect a different number of differentially expressed genes.

Effect of the gene signature length on the transcriptional reproducibility. Heatmaps representing the Zhang connection similarity among replicates from the same control, plotted in columns (LY-294002 n = 88; Estradiol n = 66; Tanespimycin n = 89; Trichostatin n = 87), using all 973 genes, significant genes only at different significant thresholds (0.1; 0.05; 0.01) and the five most strongly affected genes plotted in rows. For ease of reading, the figure can be viewed online at

Despite the caveat of similarity loss, the clearest transcriptional connection (Fig. 3A) and highest reproducibility (Fig. 4) were obtained when the gene signature query was based on the significant genes only. However, the chance of obtaining a high connection score, using this gene signature query criterion, seemed to decrease as the promiscuity of compounds increased. The latter is illustrated by the funnel-shaped distribution of the differences between the Zhang score when only the five highest ranked genes or the significant genes at various significance thresholds are considered, versus all 973 genes (Fig. 5). All five distributions vary around zero in function of the number of significant genes, which is indicative of the promiscuity of compounds (Fig. 5).
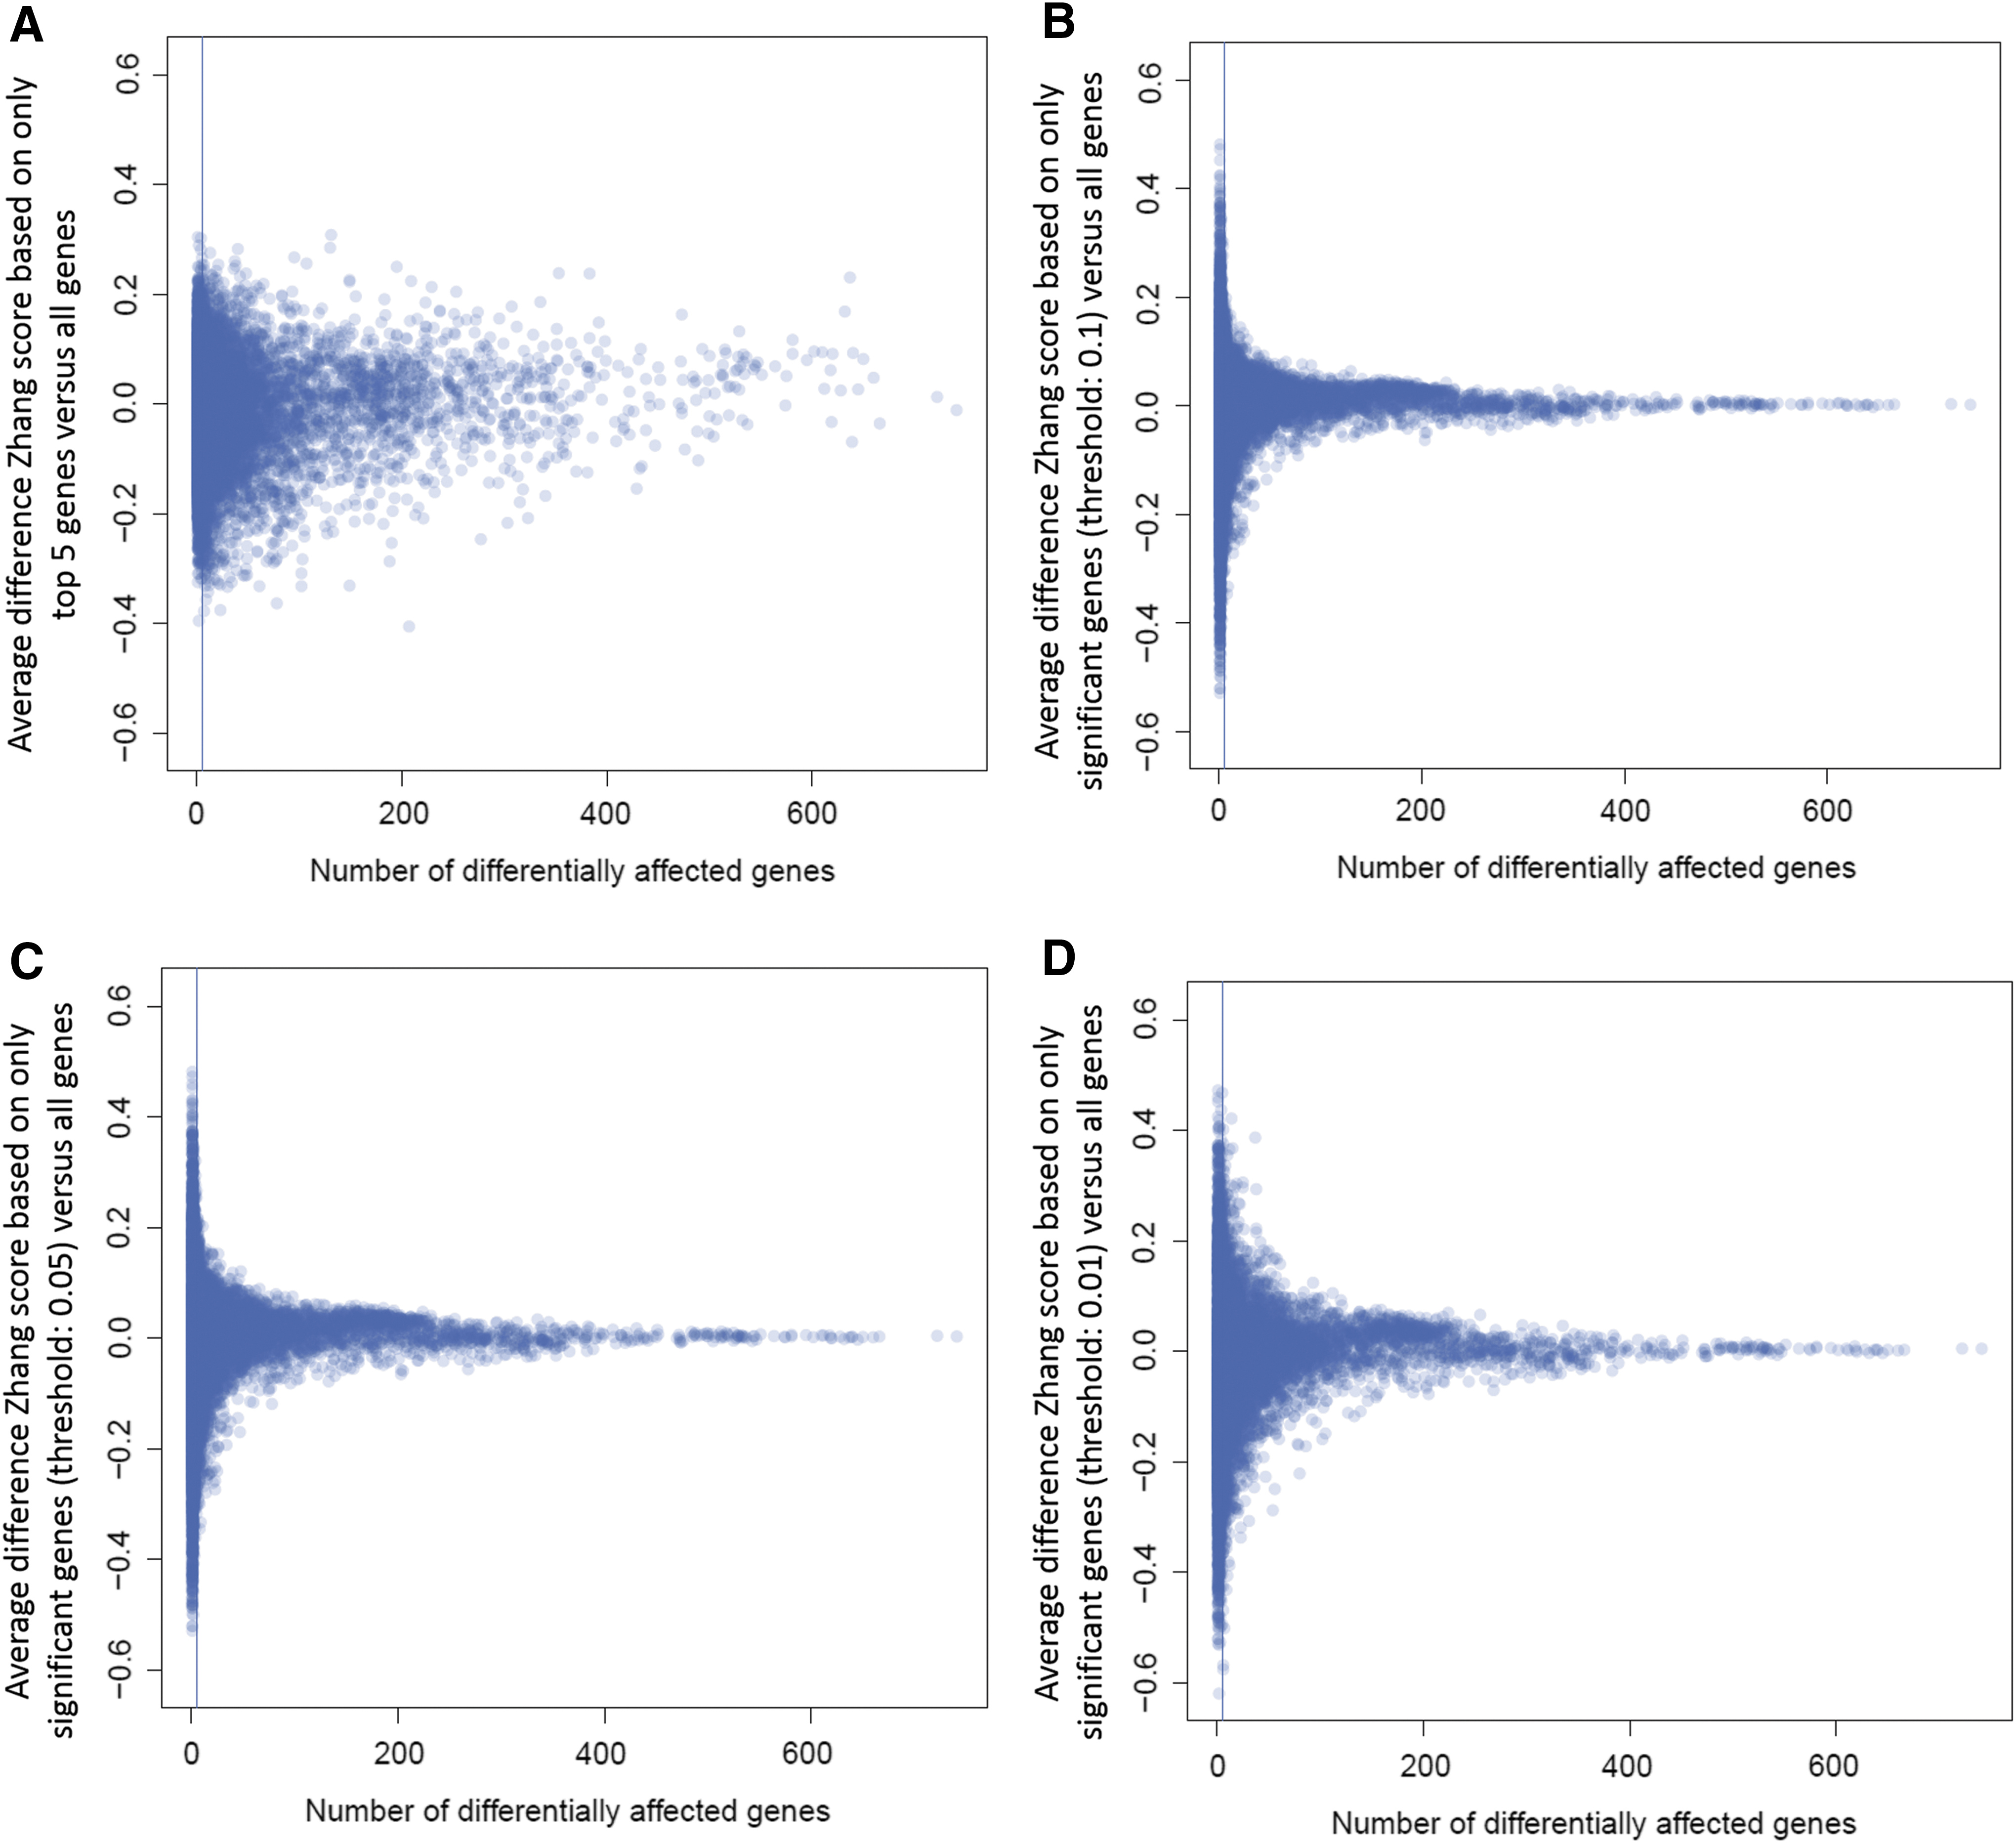
Effect of the gene signature length on the Zhang score difference.
Since the number of significant genes, present in the query gene signature, affected the magnitude of the Zhang connection score, there was a need to introduce confidence intervals for this similarity parameter. To this end, Zhang connection scores were computed, based on 1 × 10⁵ random gene signatures. When varying the number of m, the mean of the different random distributions varied, as expected, around zero (Fig. 6A). However, the standard deviation decreased exponentially when the number of genes in the query gene signature increased (Fig. 6B
). The function “1/√m” was fitted to estimate the standard deviation for a specific number of genes, yielding an intercept of 0.009 and a slope of 0.602 (Fig. 6B). Hence, the randomized Zhang connection score distribution has a mean of zero and a standard deviation of sdnGenes = 0.009 + 0.602.(1/√m). The confidence interval can now be rewritten as follows:
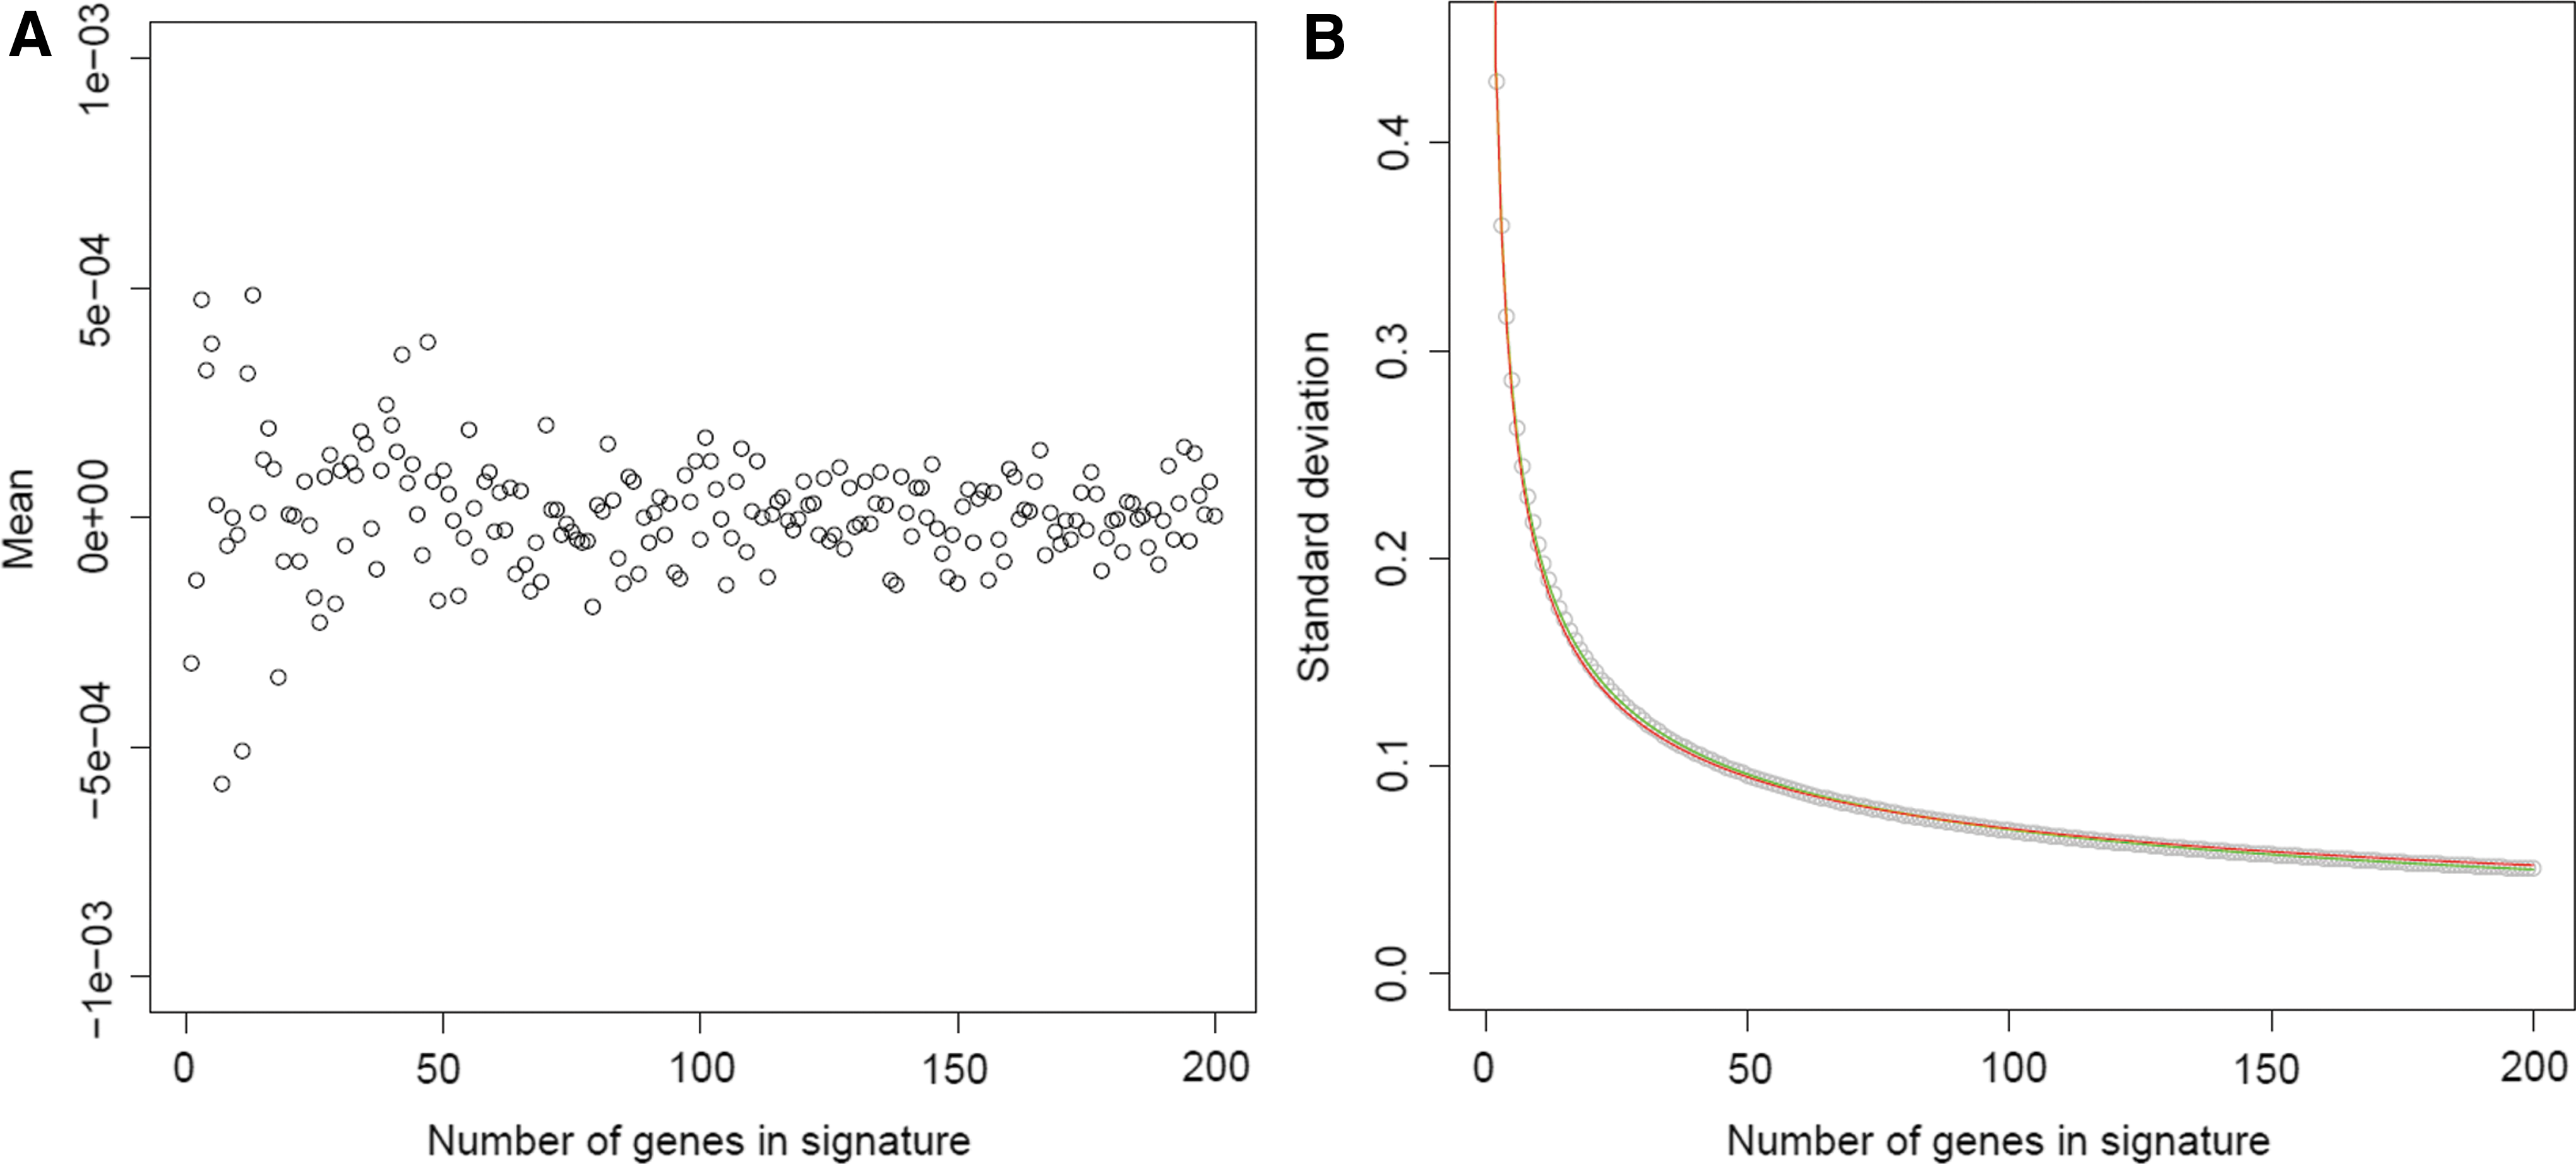
Mean and standard deviation fitting for random generated Zhang connection score distributions.
with the threshold set at 1/N when N is the number of considered compounds, controlling the expected number of false positive connections at 1. If zero falls inside the Zhang confidence interval, there would be not enough evidence to reject the H0 of nonsignificance, irrespective of the query gene signature size, while allowing a user-defined false positive rate. The radius or half width of the Zhang confidence intervals is tabulated for different gene signature widths (rows) and compound sample sizes (columns), when a false positive connection score of 1 is adopted (Table 1). The confidence intervals can easily be computed for all row x column conditions as the Zhang score ± the radius. The gray cells indicate experimental conditions in which a Zhang connection score will never attain significance, since the absolute Zhang connection score, which is limited to 1, must exceed the radius for this to happen.
Radius (i.e., Half Width CI) for Different Combinations of Gene Signature Lengths (i.e., Rows) and L1000 Profiled Compound Data Base Sizes (i.e., Columns) with a False Positive Connection Score Threshold (t) Set at 1
The computed Zhang connection score is significant when its value exceeds the radius for the specific experimental conditions.
NR3C1
The number of available L1000 profiled compounds, which were also screened in the NR3C1 assay (n = 114), is presented, along with the activity threshold in Figure 7A. The data were unbalanced with 87 compounds grouped in the inactive and 27 compounds grouped in the active NR3C1 compound class. The discriminative power (as expressed by the Kappa statistic) for diagonal linear discriminant analysis (DLDA), RF, and support vector machine (SVM) algorithms across the different test runs (using 10 different gene set sizes ranging from 2 to 35) is plotted for NR3C1 in Figure 7B. RF and DLDA performed equally well, irrespective of the number of gene features that were used in the models. The discriminative power for SVM dropped rapidly, once more than seven gene features were included. When considering the best Kappa statistic for the least number of gene features used, SVM slightly outperformed the other two machine learning algorithms (Fig. 7B). The mean balanced accuracy of the final SVM model across test sets using two gene features (i.e., DDIT4 and SERPINE1) was 0.81 ± 0.07 and the Kappa was 0.69 ± 0.15 across the test sets (i.e., “substantial” agreement according to Viera and Garrett 23 ). The compound class assignment for the entire data set, using SVM with DDIT4 and SERPINE1 as input features, is visualized in Figure 7C. All 114 compounds are plotted in function of their measured and predicted NR3C1 activity. Only 7 compounds were wrongly assigned by the SVM model (Fig. 7C). Finally, the actual expression values for DDIT4 and SERPINE1 are plotted in Figure 7D, in which each compound is colored, based on its observed NR3C1 activity. Compounds with higher upregulation of both genes tend to show higher NR3C1 activity (Fig. 7D).
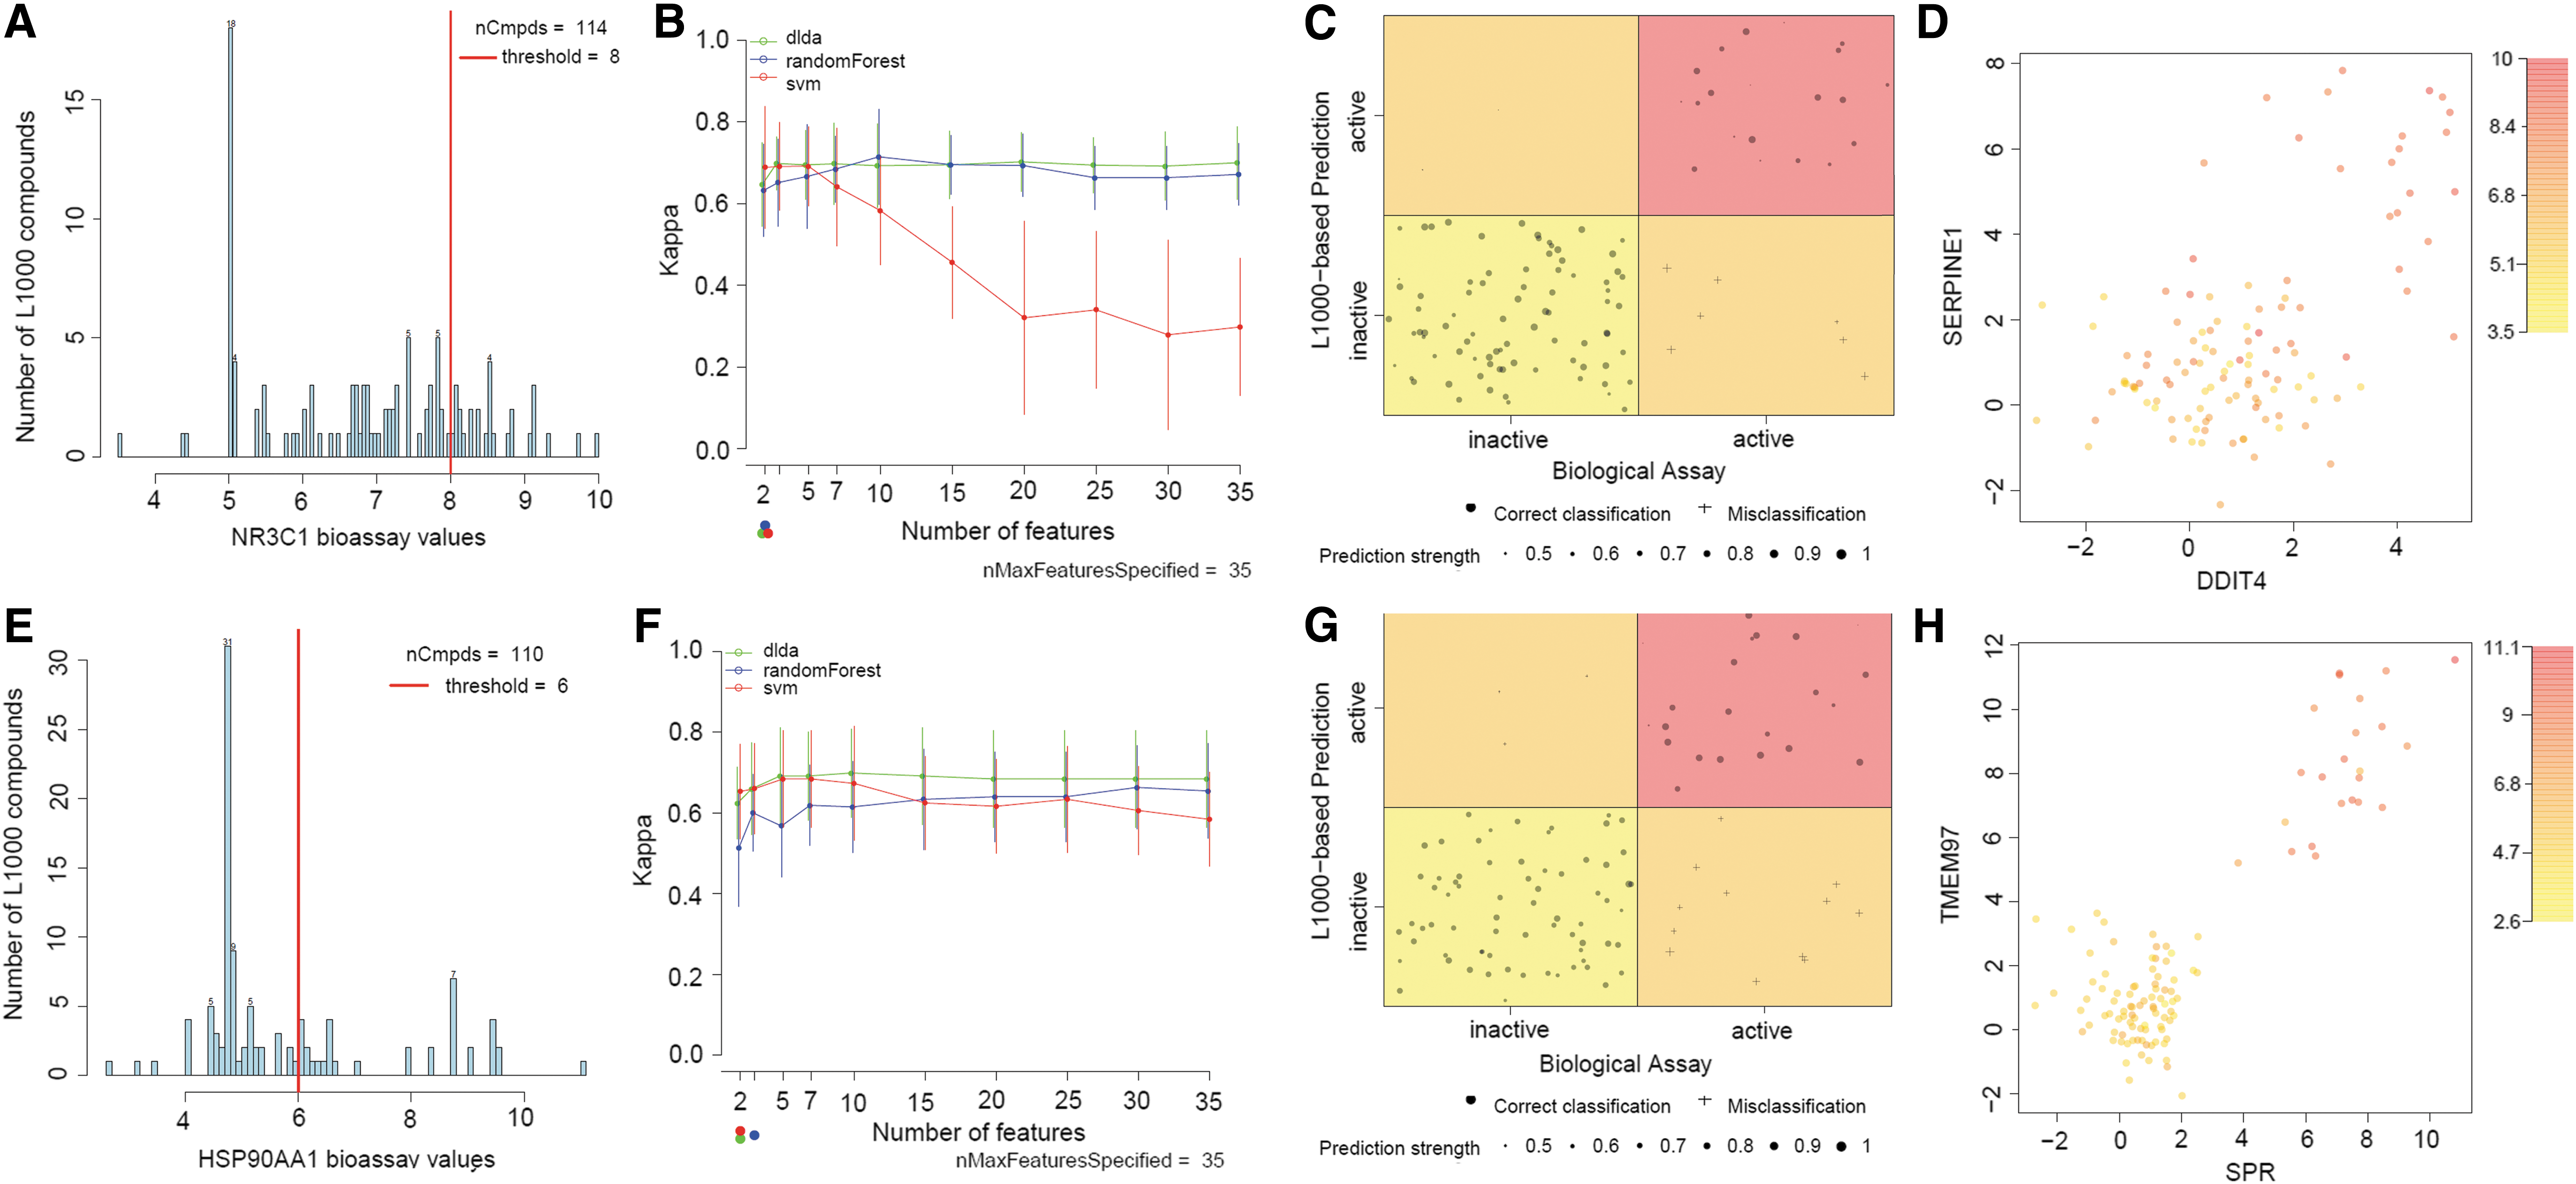
Machine learning-based target activity predictions for NR3C1 and HSP90.
HSP90
The number of available L1000 profiled compounds that were also screened in the HSP90 assay (n = 110) is presented along with the activity threshold in Figure 7E. The data were unbalanced with 75 compounds grouped in the inactive and 35 compounds grouped in the active NR3C1 compound class. The discriminative power (as expressed by the Kappa statistic) for DLDA, RF, and SVM across the different runs (using 10 different gene set sizes ranging from 2 to 35) is plotted for HSP90 in Figure 7F. Support Vector Machine and DLDA outperformed RF when a smaller number of gene features (less than 7) were picked. When considering the best Kappa statistic for the least number of gene features used, SVM performed better than DLDA and outperformed RF (Fig. 7F). The mean balanced accuracy of the final SVM model using two gene features (i.e., SPR and TMEM97) was 0.80 ± 0.06 with a Kappa value of 0.65 ± 0.12 across the test sets. The compound class assignment for the entire data set, using SVM with SPR and TMEM97 as input features is visualized in Figure 7G. All 110 compounds are plotted in function of their measured and predicted HSP90 activity. Only 15 compounds were wrongly assigned by the SVM model (Fig. 7G). Finally, the actual expression values for SPR and TMEM9 are plotted in Figure 7H, in which each compound is colored, based on its observed HSP90 activity. Compounds with higher upregulation of these genes tend to have higher HPS90 activity (Fig. 7H).
Discussion
Ever since the publication of CMap, 6 the LINCS library, and the commercialization of the L1000 platform, the use of high-throughput transcriptomics and query gene signatures has been successfully applied in the drug discovery and development process by a variety of research groups (For a review 24 ). In the last decade, new therapeutic targets have been found, 4,6,25,26 existing drugs have been repurposed or repositioned, 12,27,28 and side effects have been flagged. 11 To this end, a variety of similarity metrics have been proposed and their gene pattern matching success has been investigated by Cha et al. 13 The connectivity score proposed by Lamb 6 and the connection approach proposed by Zhang and Gant 14 seemed to be the most promising metrics. Unlike the connectivity score, 6 the Zhang connection score 14 has, however, the advantage of treating similarly upregulated and downregulated genes to the same effect (i.e., equal symmetric weight). Moreover, the Zhang connection score 14 combines the ranks of all genes present in the query signature, instead of retaining the rank differences across all genes that are regulated in the same direction, allocating weights that are proportional to the induced differential expression. In addition, the signed ranked based connection score 14 can be extended to an unordered gene signature, when information on the magnitude of the significance for the genes is not available.
The value and symmetry of the obtained connection scores largely depend on the number of genes that are present in the query gene signature. The connection symmetry between two compounds is kept when all genes are used for the query, although noise is added to the metric under these circumstances. Indeed, using all genes adversely affects the reproducibility of the connection score, as demonstrated for the replicates in each of the positive controls. Hence, despite the loss of connection symmetry, a query gene signature derived from a subset of genes will increase the transcriptional reproducibility and decrease existing noise. As a matter of fact, the connectivity score proposed by Lamb 6 incorporated this idea already and made use of a fixed number of upregulating and downregulating genes when constructing gene signatures. However, connection scores that are computed from a fixed number of genes, derived from a very specific or a promiscuous compound, are highly similar. The difference between both types of compounds can only be appreciated when a significance gene inclusion threshold is set. Given that most compounds in this data set affect only a few genes, it is even more important to correctly compute the connection score for specific, rather than promiscuous compounds. When setting such a significance gene entry threshold, promiscuous compounds are less likely to pick up high connections with other compounds. The proposed confidence interval and the flexibility to set a user-defined false positive rate can, however, amend this caveat. Hence, our simulations indicate that a Zhang connection score should always be interpreted in the context of its confidence interval, when making compound (di)similarity calls.
In addition to finding transcriptional (di)similarity among compounds, it was investigated if this L1000 data set could also be used in the context of machine learning. The latter was achieved by taking the activity status of less than 115 L1000 profiled compounds, tested in the NR3C1 and HSP90 assay, into account. Surprisingly, only four genes, SERPINE1, DDIT4, TMEM97, and SPR, were needed to reach a sufficient predictive power for both targets. The small number of predictive genes is most likely related to the fact that the 978 genes, measured on the L1000 platform, have been identified to capture most of the information contained in the entire transcriptome (
Given that L1000 can find compound connections and/or predict their activity on a variety of targets, it could be used to construct more biodiverse screening libraries. The obtained L1000 information could enable the construction of compound screening libraries composed of chemical matter that spans a maximum of diverse biological effects rather than diversity that aims to cover a large portion of the chemical space. In this context, Petrone et al. 37 have demonstrated that strategies, which optimize for target diversity, outperform chemically diverse screening decks both with respect to hit rate as well as the chemical diversity in identified compound scaffolds among the hits. Along the same lines, L1000 could be used to identify compounds that have never shown activity even though they have been tested in several different biological assays. This so-called dark chemical matter 38 has been shown to be much more selective when deorphanized as they interact with fewer targets, while their biological activity was shown to be similar as other compounds. 39 Given the advancements made in this article in combination with our strategic investment into generating L1000 profiles and target deconvolution strategies based on high content imaging, we are establishing the means to rapidly propose and test hypotheses for the likely mechanism underlying any biological activity that may be observed for Janssen's dark chemical matter. These capabilities provide the tools to unravel mechanistic insights into both the desired activities as well as any undesired activities 40 of the compounds we process through the Janssen drug discovery and development pipeline.
Footnotes
Disclosure Statement
No competing financial interests exist.