




Abstract
GPR119 drug discovery efforts in the pharmaceutical industry for the treatment of type 2 diabetes mellitus (T2DM) and obesity, were initiated based on its restricted distribution in pancreas and GI tract, and its possible role in glucose homeostasis. While a number of lead series have emerged, the pharmacological endpoints they provide have not been clear. In particular, many lead series have demonstrated loss of efficacy and significant toxic side effects. Thus, we sought to identify novel, potent, positive modulators of GPR119. In this study, we have successfully developed and optimized a high-throughput screening strategy to identify GPR119 modulators using a live cell assay format that utilizes a cyclic nucleotide-gated channel as a biosensor for cAMP production. Our high-throughput screening (HTS) approach is unique to that of previous HTS approaches targeting this receptor, as changes in cAMP were measured both in the presence and absence of an EC10 of the endogenous ligand, oleoylethanolamide, enabling detection of both agonists and potential allosteric modulators in a single assay. From these efforts, we have identified positive modulators of GPR119 with similar as well as unique scaffolds compared to existing compounds and similar as well as unique signaling properties. Our compounds will not only serve as novel molecular probes to better understand GPR119 pleiotropic signaling and the underlying physiological consequences of receptor activation, but are also well-suited for translation as potential therapeutic agents.
Introduction
Type 2 Diabetes Mellitus (T2DM) is a complex metabolic disorder characterized by chronic hyperglycemia due to insufficient insulin secretion together with the development of insulin resistance and hepatic glucose overproduction. 1 Loss of β-cell function in the setting of insulin resistance is also a characteristic feature that further exacerbates this disease. 2
The prevalence of T2DM is rising worldwide, with more than 371 million people currently affected, 3,4 T2DM comprises 90% of patients with diabetes around the world, 5 and is largely the result of excess body weight and physical inactivity. Although there are many pharmacotherapy options for the treatment of T2DM, most are limited in terms of their overall efficacy and side effect profile. Unfortunately, in most patients, current therapies fail to adequately provide long-term glycemic control as well as address β-cell function decline, leaving diabetics susceptible to develop life threatening and debilitating complications such as cardiovascular disease, blindness, kidney complications, amputations, and in some cases cancer. 6 The World Health Organization (WHO) projects that diabetes will be the 7th leading cause of death by 2030. 4
One important player that exhibits potential to achieve glycemic control, while also addressing increased body weight and β-cell failure, is the gut-derived peptide hormone called glucagon-like peptide-1 (GLP-1). 7 GLP-1 is an incretin hormone released postprandially from gut to potentiate glucose-stimulated insulin secretion (GSIS). A deficiency of GLP-1 can be observed in individuals with impaired glucose tolerance, which worsens progressively with evolution to T2DM. 8 Because GLP-1 deficiency occurs very early in the natural history of T2DM, it follows that GLP-1 replacement therapy is a logical choice to minimize further progression of the disease. Thus, incretin based therapies, comprising GLP-1 mimetics and dipeptidyl peptidase-4 (DPP-4) inhibitors, were introduced as novel therapeutics to treat T2DM in the mid-2000s. 9 –13 However, both of these classes of drugs are limited in terms of their clinical utility. DPP-4 inhibitors exhibit modest efficacy with their action dependent on endogenous GLP-1. Furthermore, DPP-4 is also believed to be involved in the degradation of other peptides such as substance P, gastrin-releasing peptide, and neuropeptide Y, and thus blocking its effects may have more unspecific effects compared to GLP-1 analogs. 14,15 On the contrary, the clinical utility of GLP-1 mimetics such as Exendin-4 (Exenatide, Byetta™, or Bydureon™) 16,17 is limited due to the need for injection and the risk of hypoglycemia when coadministered with oral antidiabetic agents such as sulfonylureas. 18 Thus, not only is there a critical need for novel therapeutic approaches for glycemic control, that can complement existing therapies that treat diabetes and obesity, but also the strategy to identify orally active agents capable of stimulating GLP-1 release remains an attractive option. 19
The GLP-1 receptor (GLP-1R) is a family B G protein-coupled receptor (GPCR) and a clinically well-validated target for T2DM. Nevertheless, identification of small molecule modulators has proved difficult and to date none has entered the clinic. Therefore, an alternative approach toward modulating the GLP-1 system is to target a more “druggable” receptor involved in regulating this system. Given the high success rate of drug development for drugs targeting family A GPCRs and the clinical validation of GLP-1 for drug discovery, G protein-coupled receptor 119 (GPR119), which modulates GLP-1 secretion, has emerged as a potential target for the treatment of T2DM and related metabolic disorders, as evidenced by the numerous patent applications in this field. 20,21
GPR119 tissue distribution analyses reveal pancreas and gastrointestinal tract as major sites of expression in both rodent and human tissues, with low expression also reported in rodent brain. 22 Pancreatic β-cells 23 and intestinal enteroendocrine L cells 24 have been reported as the major sites of expression within these tissues. Upon activation, GPR119 couples to Gαs protein and increases intracellular cyclic adenosine monophosphate (cAMP) levels. 22 –24 The resultant accumulation of cAMP enhances GSIS from islet β-cells and promotes the release of GLP-1, glucose-dependent insulinotropic polypeptide, and peptide YY from enteroendocrine cells in a glucose independent manner. 24,25 GPR119 activation has also been shown to increase gene expression of proglucagon, a biosynthetic precursor of GLP-1. 26 GPR119 activation may also provide favorable effects on food intake, body weight, and possibly β-islet cell preservation, 27 thus, making GPR119 an attractive target for the treatment of T2DM and related metabolic disorders.
Efforts in deorphanizing GPR119 uncovered two major classes of potential endogenous ligands: phospholipids such as oleyol-lysophosphatidylcholine and amide derivatives of fatty acids such as oleoylethanolamide (OEA). 28 Despite being less potent and selective compared to natural ligands identified for many other GPCRs, OEA remains to be recognized as GPR119 endogenous ligand. 22 Likewise, various synthetic compounds have also been identified that activate this receptor. 29 –33 Although both preclinical and early stage clinical data suggest that GPR119 agonists hold great promise as antidiabetic drugs, from a clinical perspective, synthetic GPR119 agonists have proven disappointing. 21
In this study, we used a cyclic nucleotide-gated channel (CNG) as a biosensor for cAMP production, in a live cell assay format, previously used successfully, 34 –36 for the development and optimization of a high-throughput screening (HTS) to search for modulators of hGPR119. Changes in cAMP have been measured in the presence and absence of an EC10 of the endogenous ligand OEA. This approach enables detection of both agonists and allosteric modulators in a single assay. From these efforts we have identified novel, potent, positive modulators of GPR119. The GPR119 synthetic agonists described in the literature exhibit divergent signaling properties to those of endogenous ligand, 37 which may not adequately reflect GPR119 signaling in a physiological setting. In this context, our set of compound hits comprise of GPR119 modulators that exhibit similar as well as unique chemical scaffold and signaling properties, not only have the potential to provide great therapeutic value but can also be used to better interrogate GPR119 pleiotropic signaling, physiological functions, as well as therapeutic value.
Materials and Methods
Cell Culture and Transfection
Unless otherwise stated, reagents were purchased from commercial sources. All media and serum were purchased from Gibco (Life Technologies, Grand Island, NY), and flasks from Falcon (BD Biosciences, San Jose, CA). The cAMP biosensor assay cell line was purchased from BD Biosciences, as human embryonic kidney (HEK) 293 cells stably expressing a CNG channel, namely HEK293-CNG, and was cultured in Dulbecco's modified Eagle medium containing 10% fetal bovine serum (FBS). hGPR119 (pcDNA3.1+) and human glucagon receptor (hGCGR; pcDNA3.1+) were purchased from UMR cDNA Resource Center. Transfections were performed using Fugene HD (Roche, Branford, CT) according to manufacturer's instructions. Selection antibiotics for maintenance of HEK293-CNG-hGPR119 stable cell line were G418 250 μg/mL (Gemini, West Sacramento, CA) to maintain expression of the CNG channel, and blasticidin 10 μg/mL to maintain hGPR119 expression. A HEK293-CNG-hGCGR cell line expressing both the CNG channel and the human glucagon receptor (GCGR) was developed in parallel for counter-screening purposes, and receptor expression was maintained using 1 μg/mL puromycin (Clontech, Mountain View, CA). All cells were maintained at 37°C with 5% CO2 in a humidified incubator and passaged by splitting at a ratio of 1:10 to ensure that confluency did not exceed 80%.
cAMP Accumulation
Changes in cAMP were measured using the Codex ACTOne™ Membrane Potential Dye Kit (Codex BioSolutions, Gaithersburg, MD) according to the manufacturer's protocol and read on a fluorescent imaging plate reader (FLIPRTETRA, Molecular Devices, Sunnyvale, CA). OEA and 3-Isobutyl-1-methylxanthine (IBMX) were purchased from Sigma-Aldrich (St. Louis, MO), glucagon from American Peptide (Sunnyvale, CA) and NECA, Ro 20-1724, and forskolin from Tocris Biosciences (Ellisville, MO). The CNG cAMP biosensor assay is depicted in Table 1.
Cyclic Nucleotide-Gated Channel Cyclic Adenosine Monophosphate Biosensor Assay
1. Cells are plated in OptiMEM +2% Charcoal Stripped FBS in BD Biosciences black clear bottom poly-d-lysine coated 384-well plate.
4. Generate compound plate during this step. Made in OptiMEM +2% Charcoal Stripped FBS + IBMX.
6. Final DMSO concentration in assay plate = 0.7%. Final IBMX concentration in assay plate = 100 μM.
8. The T30/T0 ratio is used to graph the concentration response of test compounds.
FBS, fetal bovine serum; DMSO, dimethyl sulfoxide; IBMX, 3-Isobutyl-1-methylxanthine; FLIPR, fluorescent imaging plate reader.
SDDL Library
At the time of testing, the Scripps Drug Discovery Library (SDDL) consisted of ∼617K unique compounds, representing a diversity of drug-like compound scaffolds targeted at traditional and nontraditional drug-discovery biology. Today the SDDL is approximately 645K in size. The SDDL has been curated from over 20 commercial and academic sources and contains more than 20,000 compounds unique to Scripps. 38 It is important to note that the SDDL is also unique compared to most other libraries, including the National Institutes of Health (NIH)'s Molecular Libraries Small Molecule Repository (MLSMR) compound library, with a structural overlap of only 14.8%. SDDL compounds are selected based on scaffold novelty, physical properties, and spatial connectivity. 39 In its current state, the SDDL consists of several focused sublibraries for screening popular drug-discovery target classes 40 (e.g., kinases/transferases, GPCRs, ion channels, nuclear receptors, hydrolases, and transporters), that exhibit diverse chemistries 41 (e.g., click-chemistry, PAINS-free, Fsp3 enriched, covalent inhibitors, and natural product collections) as well as desirable physical properties (“rule-of-five,” “rule-of-three,” polar surface area, etc.). 42
High-Throughput Screening Data Acquisition, Normalization, Representation, and Analysis
The HTS campaign was executed on the automated GNF/Kalypsys robotic platform at The Scripps Research Institute Molecular Screening Center (Jupiter, FL). The screen was performed using a protocol similar to that used for cAMP accumulation (see Supplementary Table S1; Supplementary Data are available online at
Data files from the FLIPR plate reader were uploaded into the Scripps institutional HTS database (Symyx Technologies, Santa Clara, CA). The data from the HTS primary campaign were normalized by dividing the fluorescence at T90 by the initial basal fluorescence at T0. Activity of each well was normalized using the following equation on a per plate basis:
For the primary assay, the Test well is defined as wells containing test compounds and OEA at EC10. The Low Control is defined as wells containing DMSO and OEA at EC10, while High Control refers to wells containing OEA at EC90. For GCGR agonist assay, the High Control refers to wells containing glucagon at EC100.
Data were normalized on a per plate basis and each assay plate underwent a quality control check. A value greater than 0.5 for Z′ was required before further processing. 43 During the primary screen, test compounds from the library were screened in singlicate at a final nominal concentration of 3.9 μM (final DMSO concentration of 0.39%). The hit-cutoff used to qualify active compounds was calculated on a per plate basis using the average percent activity plus three times the standard deviation (SD) for each plate.
For dose–response experiments, the average of triplicate well data was plotted against compound concentration. A four-parameter equation describing a sigmoidal dose–response curve was then fitted with adjustable baseline using Assay Explorer software (Symyx-MDL Information Systems).
A Venn diagram generator was used to cross compare both sets of data. The tool used for this analysis is freely available and can be found at
Cheminformatics
Shared scaffolds of active compound families from the confirmation screen and concentration-response curve (CRC) experiments were identified using a Maximum Common Substructure (MCS) hierarchical clustering 44 (ChemAxon LibraryMCS 5.10.2). The physical properties (i.e., molecular mass, topological polar surface area, chiral atoms, H-bond acceptors/donors, ring count, and rotatable bonds) of the compounds tested in dose–response format were calculated (ChemAxon Instant JChem 6.2.2).
Data Analysis
To monitor assay sensitivity and evaluate the robustness of the assay, signal to background (S:B) ratios and Z′ factor values were calculated using the equations previously described. 43 EC50 values for the controls were calculated by nonlinear regression analysis (sigmoidal dose–response; variable slope) using Prism software (GraphPad Software, Inc.).
Results
Assay Development
We have successfully established a 384-well plate format cell-based functional assay to monitor hGPR119 receptor activity using the ACT:One (Codex Biosystems, Gaithersburg, MD) live cell cAMP technology. See Table 1 for detailed protocol and Supplementary Figure S1 for a schematic illustrating the technology.
To demonstrate that changes in intracellular cAMP could also be detected in a HEK293-CNG cell line overexpressing hGPR119, a cDNA encoding the full-length hGPR119 was stably transfected into the parental HEK293-CNG cells. Taking advantage of the historical data demonstrating endogenous expression of adenosine A2B receptor (A2BR) in HEK293, 45 HEK293-CNG-hGPR119 cell line was evaluated for its ability to promote an increase in cAMP in response to NECA, a known Gs-coupled A2BR agonist, to ensure that the CNG channel was responsive. The experiment was performed in triplicate, and the average EC50 for NECA was calculated to be ∼50 nM (data not shown), a value consistent with that observed for other receptor expressing cell lines. 46 Next, we characterized the hGPR119 agonist-induced cAMP response in these cells. As described earlier, OEA is the most active endogenous ligand of GPR119 that has been shown to stimulate cAMP production in recombinant cell lines expressing GPR119. 22 We used OEA to determine if HEK293-CNG cells stably transfected with hGPR119 were responsive to GPR119 agonists. Data showed a concentration dependent increase in cAMP production upon HEK293-CNG-hGPR119 stimulation with OEA with an observed EC50 value of 2.41 μM, consistent with those reported in the literature, 33,47 however, no such response was observed in the HEK293-CNG parental cell line (Fig. 1A).
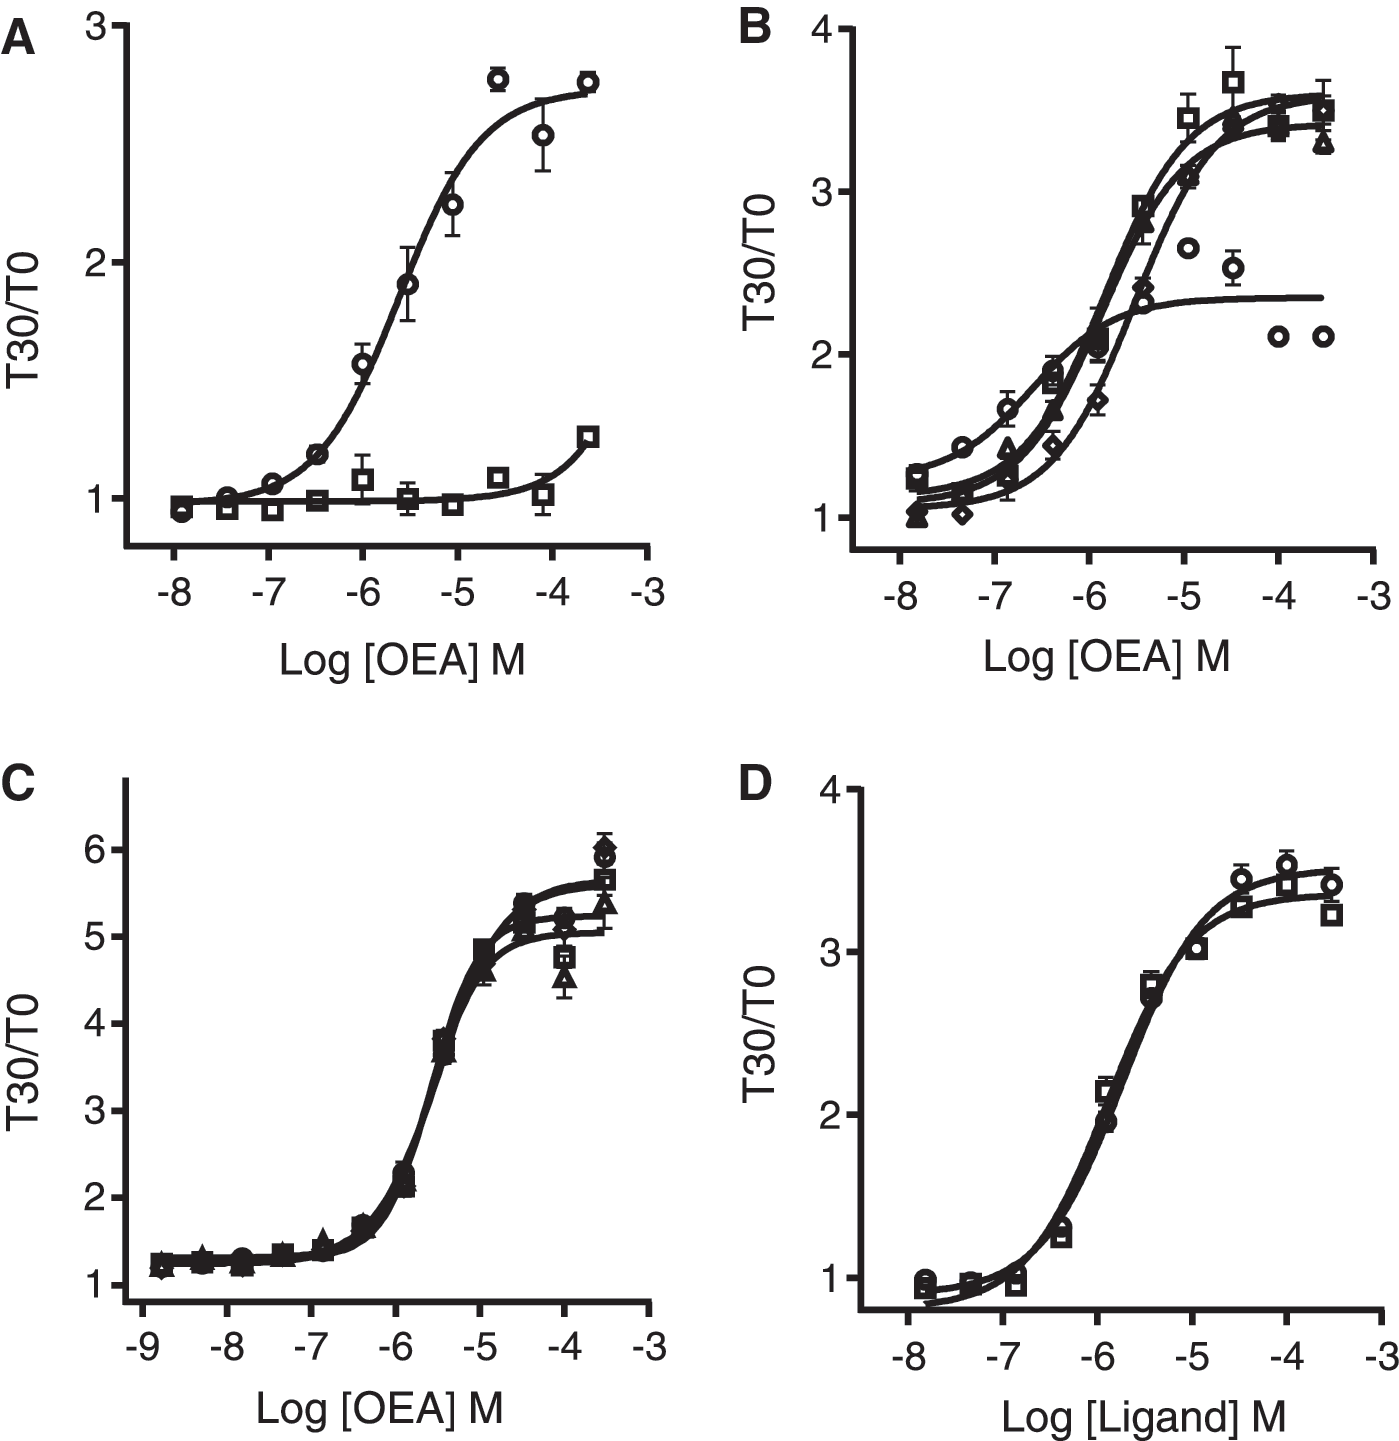
cAMP biosensor assay development.
Initially, cells were plated at a density of 14,000 cells/well as per manufacturer's instructions. This plating density provided a S:B ratio of 3.63 (data not shown), value suitable for HTS, however, for further assay optimization purposes, various cell densities were investigated (5,000, 10,000, 15,000, and 20,000 cells/well). The cell density of 10,000 cells/well resulted in a S:B of 3.82 and an OEA EC50 of 1.5 μM (Fig. 1B). Due to both favorable S:B ratio and resulting pharmacology, this cell density was identified to be optimal, thus allowing us to reduce the number of cells used without compromising the assay window.
Most compound libraries are plated in 100% DMSO, therefore we next tested the DMSO tolerance of the cells in the cAMP biosensor assay. Cells were incubated with increasing concentrations of OEA in the presence of varying concentrations of DMSO up to 1.2%. The GPR119 cAMP assay performance, both in terms of S:B and OEA EC50 values, is not significantly affected by DMSO concentrations up to 1.2% (Fig. 1C).
Plating 10,000 cells/well and using a final DMSO concentration of 0.7%, both OEA and PSN632408 stimulated cAMP accumulation in HEK293-CNG-hGPR119 cells with EC50 values of 1.86 and 1.29 μM, respectively (Fig. 1D), consistent with those reported in the literature. 22,33,47,48 It is thus established that this CNG cell line stably transfected with hGPR119 is suitable for screening purposes.
One Thousand Five Hundred Thirty-Six-Well Implementation of GPR119
One thousand five hundred thirty-six-well implementation of the assay was performed by assessing the effect of critical variables that affect the cAMP biosensor reaction (i.e., cell number, dye loading incubation time, secondary incubation time, and DMSO tolerance; see Supplementary Fig. S2). All of these parameters were addressed to achieve the appropriate sensitivity and separation between high and low controls. Once the optimal conditions were established, the assay was ready for validation at the robotic platform. Two sets of controls, N = 24 per set, were placed on every assay plate: a high control (OEA EC90) and a low control (DMSO + OEA EC10), both of them containing 0.39% final DMSO concentration. These controls were used to ensure hGPR119 activity, normalize the data, and monitor the data quality by measuring Z′ and S:B. Using these controls the GPR119 assay demonstrated robust screening statistics. All subsequent experiments were performed using the conditions listed in Supplementary Table S1.
The GPR119 primary assay and GCGR counterscreen assay were implemented at a final assay volume of 9 μL/well in 1536-well plates. The performance of the assay was validated by challenging it against a test library of small molecules with known pharmacological activities (library of pharmacologically active compounds [LOPAC]; Sigma Aldrich).
GPR119 uHTS Campaign
The GPR119 cAMP biosensor assay was run against the entire available SDDL, which included 617,346 compounds at the time. Details relative to each phase of the ultra-high-throughput screening (uHTS) campaigns are shown in Table 2. In brief, the first stage involved singlicate screening against hGPR119 at a final nominal test concentration of 3.9 μM (final DMSO concentration of 0.39%). Fluorescence was measured and the percent activation of each test compound was calculated on a per plate basis as described above. A mathematical algorithm, as previously described, 49 was used to determine nominally active compounds. An EC90 of OEA was used as a positive control (100% activation), and DMSO + OEA EC10 was used as a negative control (0% activation). For this primary assay, a plate by plate standard cutoff (negative control ±3 times the SD) was used to determine the active compounds. Any compound that exhibited a greater percentage of activation than the cutoff parameter for each plate individually was declared active. All primary HTS data were normalized to the OEA agonist control versus low control, and was used to produce a scatterplot to aid in visualization of the activity across the HTS campaign (Fig. 2A). The GPR119 assay demonstrated robust screening statistics with an average S:B ratio of 3.45 ± 0.47 and a Z′ of 0.69 ± 0.07 (n = 493 plates). The scatterplot of the replicate measurements yielded a correlation coefficient of r 2 = 0.92, indicating high reproducibility in hit identification (Fig. 2B).

Scatter plot analysis of the primary screen.
uHTS Campaign Summary
hGPR119, human G protein-coupled receptor 119; hGCGR, human glucagon receptor; % act, percentage of activity; EC50, effective concentration 50: 50% of maximal response; S:B, signal to background; uHTS, ultra-high-throughput screening.
The confirmation screen was run under the same conditions as the primary uHTS, except that plates were assessed in triplicate and results for each compound were reported as the average percentage activation of the three measurements, plus or minus the associated SD. For the confirmation assay, the average of the individual plate cutoffs from the primary assay was used as the hit cutoff. The cutoff for the counterscreen was determined using the average activity of all wells containing DMSO + OEA EC10 (negative control) plus or minus three times their SD.
For titration experiments, assay protocols were identical to those described above except that the compounds were prepared in 10 point, 1:3 serial dilutions starting at a nominal test concentration of 10 μM. Each compound concentration was assessed in triplicate.
Selection of Hits
The GPR119 modulators screening campaign is summarized in Table 2. From the primary screen, 6,365 compounds (i.e., 1.03% of the total library) were identified as active, that is, exhibiting a percent activation greater than the nominal hit cutoff of each individual plate. Of these, 6,360 were available from the SDDL for testing at the confirmation and counterscreen stages.
To confirm activity and to eliminate nonspecific compounds, the 6,360 active compounds were retested in triplicate at the same nominal concentration as the primary HTS in two different assays: (1) the original primary assay and (2) the hGCGR assay. This yielded 1,445 compounds (Fig. 3A) that confirmed activity against hGPR119 (i.e., their measured% activation was above the hGPR119 activity cutoff (22.39%) derived by calculating the average of all assay plate cutoffs (ave +3sd) from primary screening. The counterscreen found 3,464 compounds to be active. To facilitate compound selection for titration studies, a Venn diagram analysis was performed between both hGPR119 and hGCGR active compounds. Based on this analysis, there were 1,229 compounds that overlapped between the primary and counterscreen assays (Fig. 3B). Confirmed and selective compounds identified at this stage were prioritized for CRC studies (216 compounds) of which 215 compounds were available for further testing.

Comparison of GPR119 Confirmation and GCGR Counterscreen results.
The CRCs were determined via testing in triplicate using a 10-point threefold serial dilution format against both primary and counterscreen assays. From these results, compounds that yielded EC50 values below 10 μM in the hGPR119 assays were considered active. Under these criteria, 200 compounds demonstrated EC50 values <10 μM in hGPR119. Using the same criteria, none of the compounds was considered active in the hGCGR counterscreen assay.
Among the compounds identified as hits, several were found to be structurally similar to the known GPR119 agonists 50,51 (Fig. 4A). These compounds exhibited potencies comparable to their corresponding analogs (Fig. 4B).
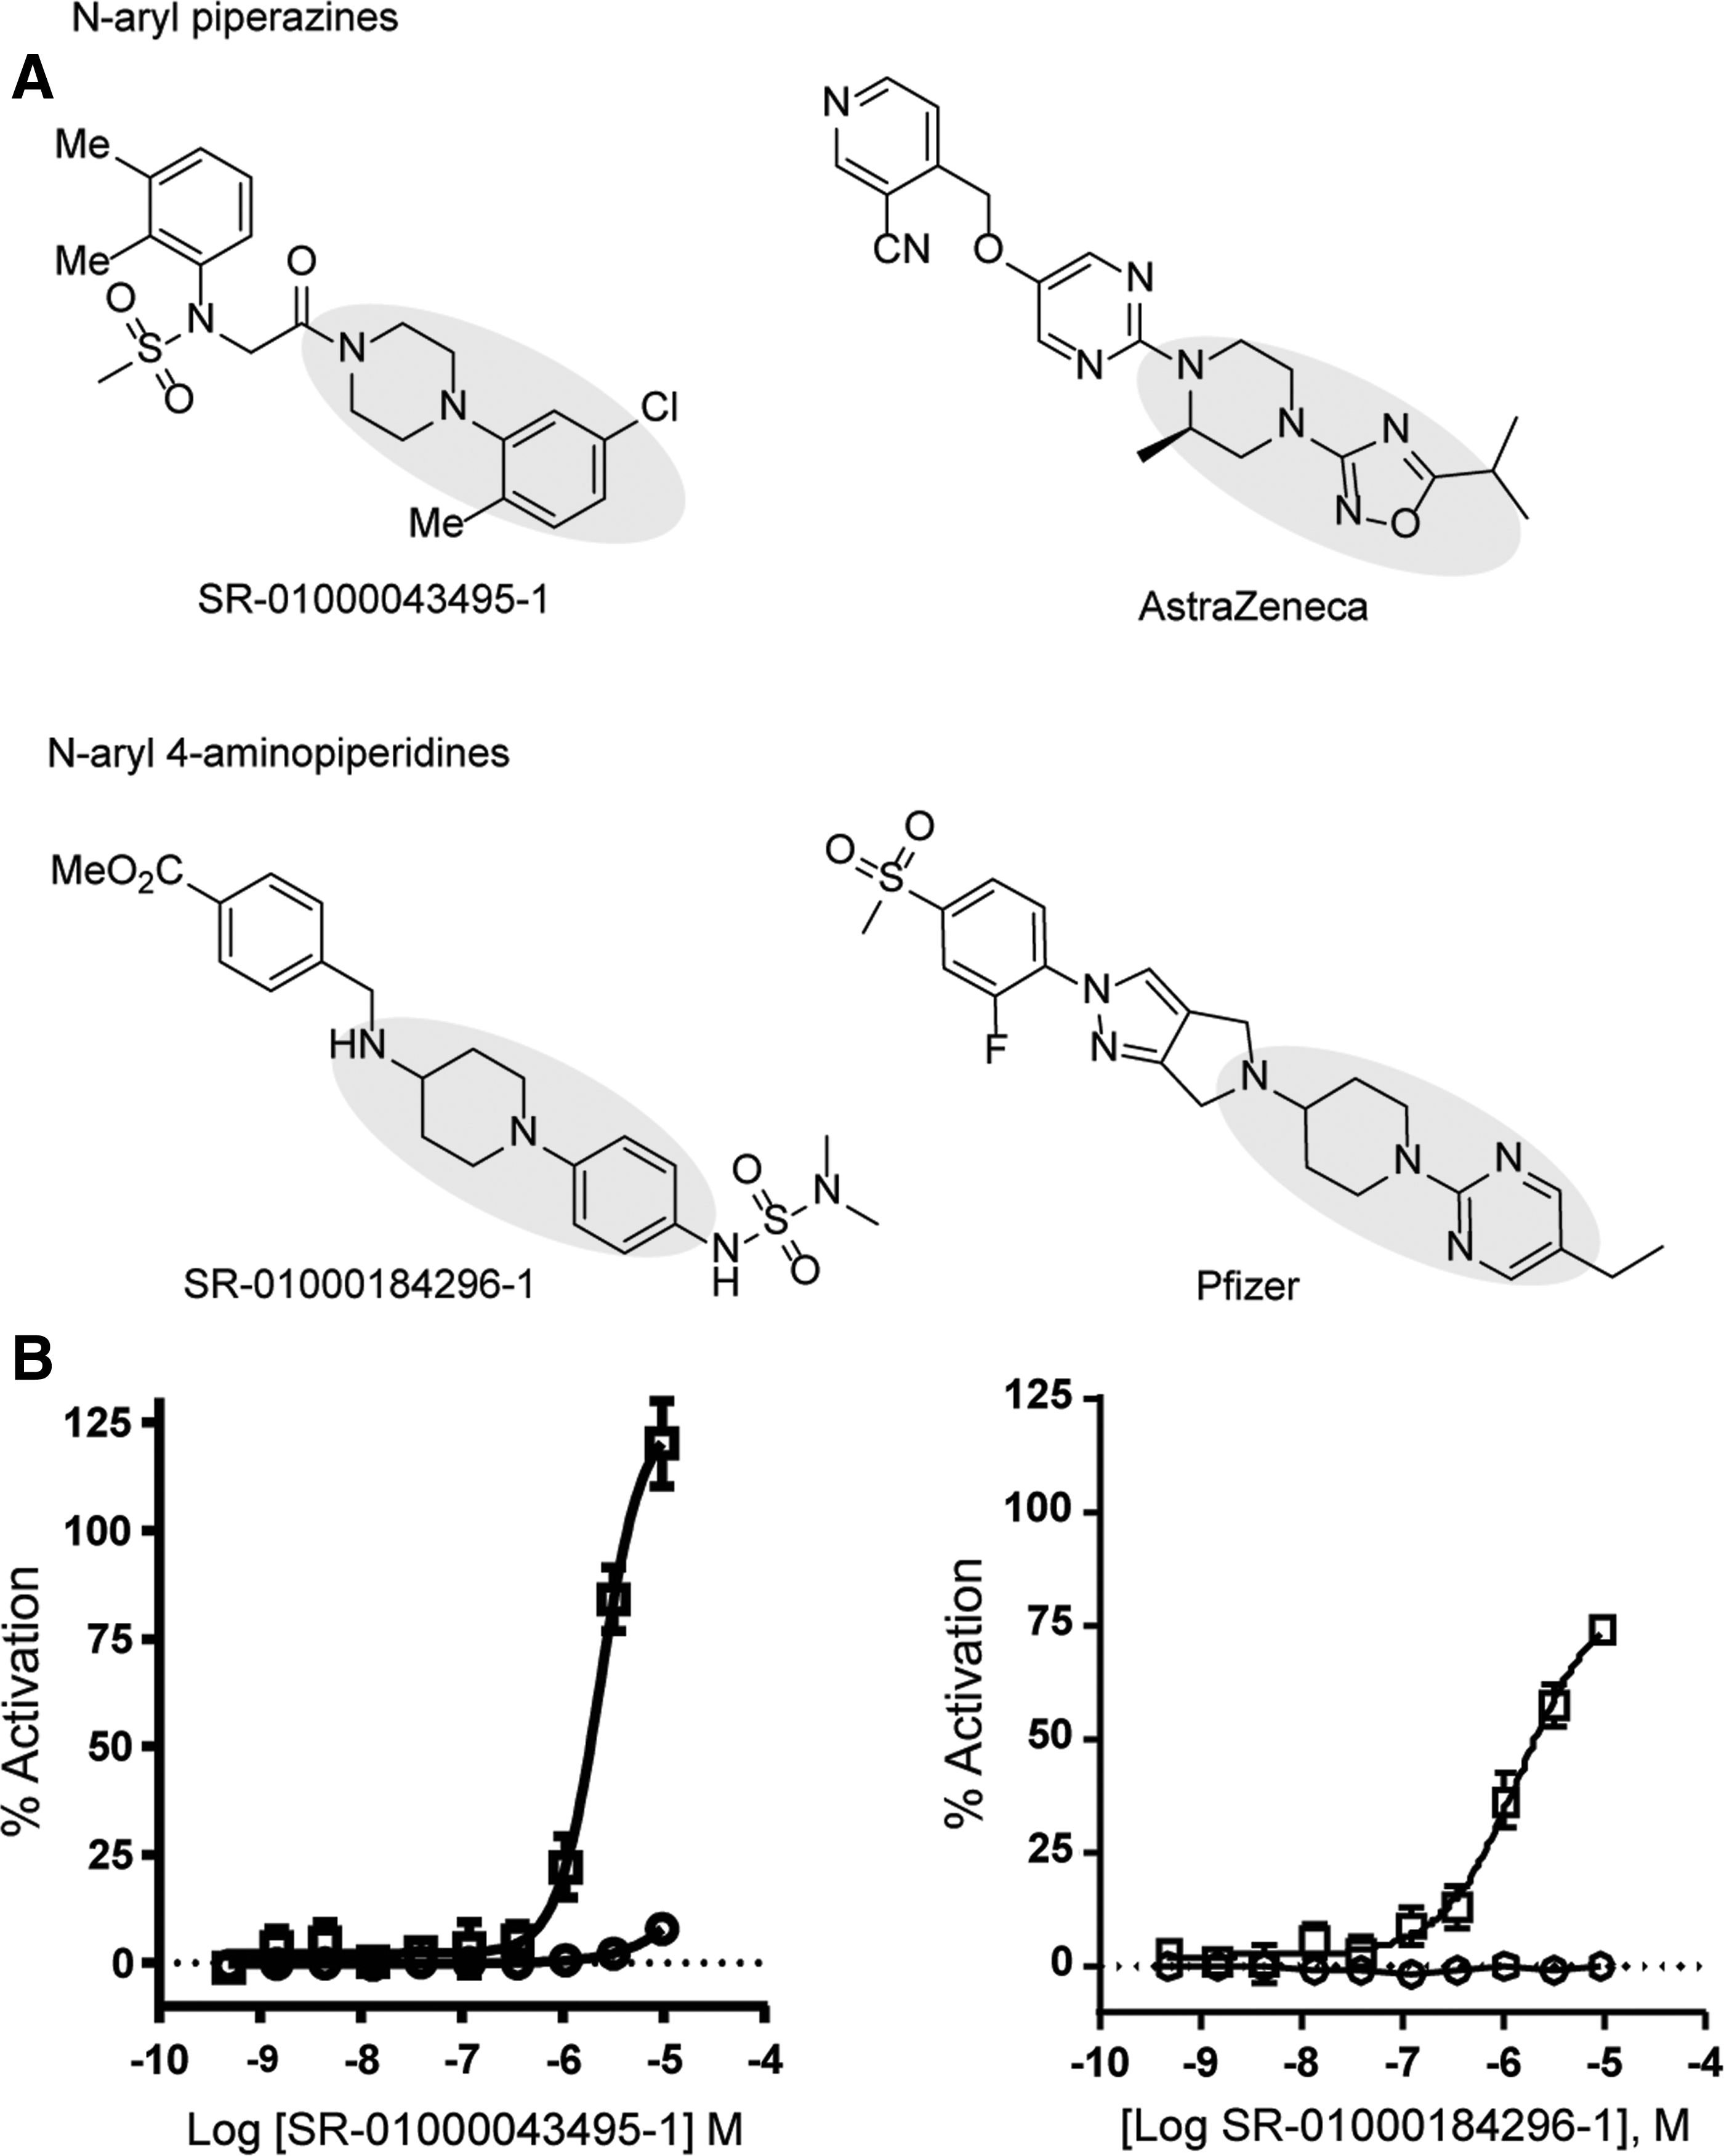
Hit confirmation.
We chose to pursue 20 hits based on their EC50 values and novelty of structure. These compounds were repurchased and tested again both as agonist and as allosteric modulators of hGPR119 (in latter case compounds were added along with the EC20 of OEA) using the CNG assay. All of these compounds stimulate cAMP as expected, with low micromolar potencies, many exhibited the typical pharmacology of a pure agonist (SR-01000315617-1; Fig. 5B), but interestingly, some of them exhibited a pharmacology consistent with a positive allosteric modulation (SR-00000004495-1; Fig. 5A), that is, activating the receptor only in the presence of the endogenous agonist, inducing an amplification of its effects. Further characterization of this potential allosteric modulator showed a concentration-dependent enhancement of OEA's potency, both in terms of its EC50 and Emax (Fig. 5C).
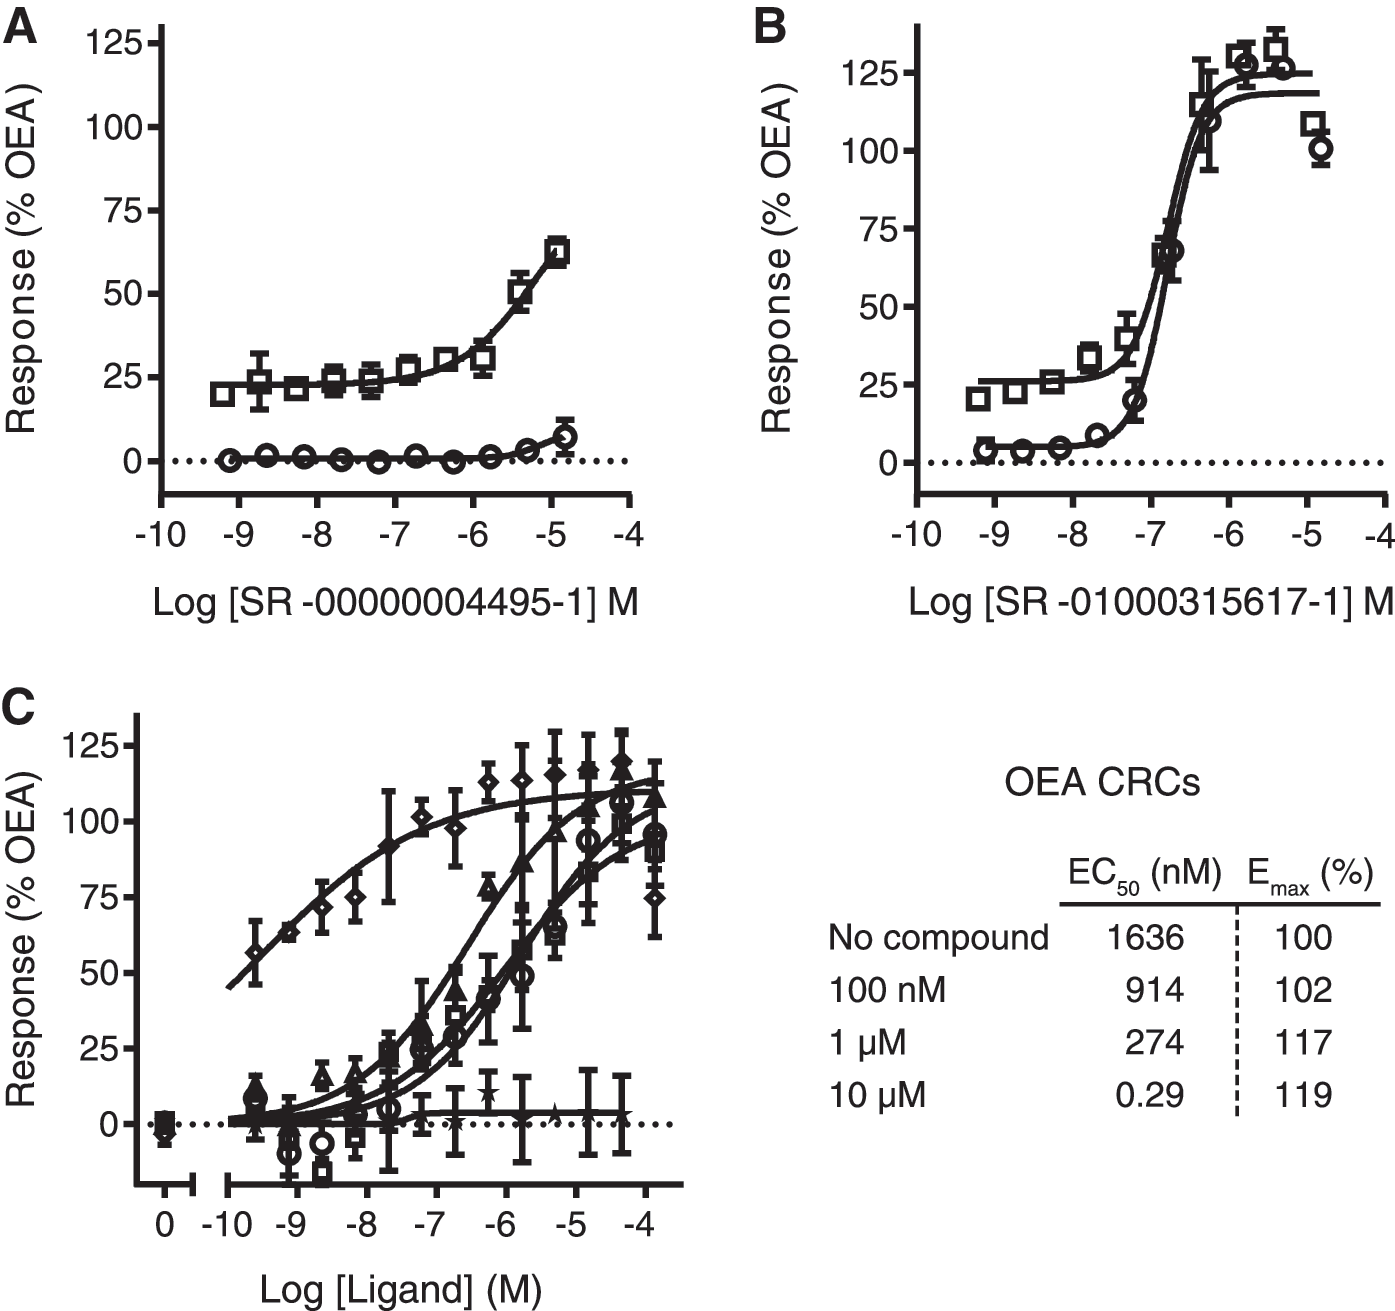
Hit in vitro characterization.
Discussion
GPR119, a GPCR primarily expressed in enteroendocrine L cells and in pancreatic β-cells, has become a promising drug target for T2DM treatment due to its role in regulating glucose homeostasis via modulation of incretin and insulin secretion. While a number of lead series have emerged, as illustrated by numerous patent filings, and also in published articles disclosing novel GPR119 small molecule agonists, 21,52 –54 the pharmacological endpoints they provide have not been clear. Several GPR119 agonists have entered clinical studies, but none has progressed beyond phase II. In particular, many lead series have demonstrated loss of efficacy and significant toxic side effects in clinical trials. 54 –58
Receptor radioligand binding competition assay formats that have been traditionally used for GPCR HTS and lead optimization applications have a strong bias toward detecting orthosteric (endogenous ligand-binding site) ligands. A cell-based functional assay, however, has the potential to identify a wider spectrum of ligands as it can detect any compound that disturbs receptor activity irrespective of its binding site. By definition, allosteric modulators bind to sites that are topographically distinct from the orthosteric ligand binding site to fine-tune receptor activity; for example, positive allosteric modulators (PAMs), augment the response of the receptor to its endogenous ligand. 59,60 These small molecules provide high selectivity, novel modes of efficacy and perhaps a reduced potential for unwanted side effects. Therefore, our HTS approach is likely to identify novel and structurally diverse GPR119 modulators that not only possess a wider spectrum of pharmacological properties but may also represent novel therapeutic agents to address the coexistence of T2DM and obesity.
GPR119 is a class A GPCR that couples to Gαs protein, thus its activation increases the intracellular activity of adenylate cyclase and subsequently cAMP levels. The methodology described here makes use of an ion channel whose opening-closing transition (gating) is sensitive to cAMP concentration. Because ion channels permeate ions at a high rate when they open, the activity of these proteins can therefore cause changes in the membrane voltage. When properly tuned, the activity of ion channels expressed in mammalian cell systems can be indirectly monitored with the use of membrane potential sensing dyes that provide a fluorescence signal. 61 This assay utilizes a stable HEK293 cell line coexpressing the receptor of interest and a modified CNG channel acting as a biosensor for cAMP. Changes in cAMP were measured with a combination of membrane potential dyes and a FLIPR.
To reduce the cost and increase the throughput, this assay was miniaturized and implemented in 1536-well plate format and run in an HTS campaign to identify modulators of the hGPR119. We and others have previously demonstrated success in using the HEK293-CNG cAMP biosensor approach to develop HTS-compatible assays for monitoring Gi- and Gs-coupled receptors (NPY-Y2 and GalR3, and TSH, respectively). 34 –36 The CNG assay format has proven to be robust and reproducible, thus, suitable for automated screening as attested by Z′ values consistently greater than 0.7 and S:B ratios around 4, with receptor pharmacology that was consistent with expectations. In addition, this format was also reliable for screening in PAM mode due to day to day and plate to plate stability of OEA EC10 and EC90.
Our goal to identify selective hGPR119 modulators was met; over 600,000 small molecules were tested and ultimately 200 selective and active compounds were identified for further follow-up. To help remove nonspecific compounds, a counterscreen assay was implemented using the GCGR stable cell line at the HTS secondary and tertiary stages. Because both assays used the same detection technology, the counterscreen was effective at facilitating the triage of fluorescence artifacts and removing nonspecific GPCR agonists and compounds that nonspecifically modulate cAMP from further consideration. For example, both forskolin (SR-01000075497) and a close analog, NKH477 (SR-01000597810), that directly activate adenylate cyclase, 62 were found active in both assays. Individual CRCs offered better insight into the selectivity of the compounds and their pharmacological profiles.
Thus, the HEK293 cell line stably expressing the hGPR119 receptor and a modified CNG channel has been used to develop a HTS-compatible, cell-based, cAMP biosensor assay to detect selective small molecule modulators of hGPR119. The performance of the assay was validated by challenging it against a test library of small molecules with known pharmacological activities (LOPAC; Sigma Aldrich). Furthermore, through HTS efforts and directed follow-up studies, we have identified several novel series of small molecule hGPR119 agonists that could be developed as potential therapeutic agents for the treatment of T2DM and obesity.
Footnotes
Acknowledgments
The authors sincerely thank Darinka Obradovich for technical assistance. This work was supported by a grant from the National Institute of Diabetes and Digestive and Kidney Diseases (DK088125 awarded to Dr. Patricia McDonald).
Disclosure Statement
No competing financial interests exist.