
Abstract
The nucleolus is a dynamic subnuclear compartment that has a number of different functions, but its primary role is to coordinate the production and assembly of ribosomes. For well over 100 years, pathologists have used changes in nucleolar number and size to stage diseases such as cancer. New information about the nucleolus' broader role within the cell is leading to the development of drugs which directly target its structure as therapies for disease. Traditionally, it has been difficult to develop high-throughput image analysis pipelines to measure nucleolar changes due to the broad range of morphologies observed. In this study, we describe a simple high-content image analysis algorithm using Harmony software (PerkinElmer), with a PhenoLOGIC™ machine-learning component, that can measure and classify three different nucleolar morphologies based on nucleolin and fibrillarin staining (“normal,” “peri-nucleolar rings” and “dispersed”). We have utilized this algorithm to determine the changes in these classes of nucleolar morphologies over time with drugs known to alter nucleolar structure. This approach could be further adapted to include other parameters required for the identification of new therapies that directly target the nucleolus.
Introduction
The nucleolus is a dynamic, nonmembrane bound compartment located within the nucleus of cells. It is now regarded as a multifunctional structure associated with roles in the cellular stress response and regulation of the cell cycle, as well as apoptosis and DNA repair and replication, 1 –3 in addition to its long-established role in the production and assembly of ribosomes. Nucleoli form around active nucleolar organizer regions (NORs), which contain the ribosomal RNA (rRNA) gene (rDNA) repeats that are undergoing transcription by RNA polymerase I (Pol I).
Nucleoli disassemble when rRNA synthesis is halted, which is observed during mitosis, under restricted nutrient/energy availability, and in response to stresses that perturb ribosomal subunit formation. 1,4 The number and size of nucleoli vary considerably among cell types and diseases. For example, in malignancy, there is a requirement for increased protein synthesis that leads to elevated ribosome biogenesis via the formation of larger and increased quantities of nucleoli per nucleus. 5 –7
The mammalian nucleolus is comprised of three distinct regions: the fibrillar center (FC); the dense fibrillar component (DFC); and the granular component (GC) (depicted in Fig. 1A). The FC contains the inactive/silenced rDNA genes while several Pol I transcription components are present; whereas transcription of the rDNA genes occurs at the border between the FC and DFC. The DFC encircles the FC and is enriched in pre-rRNA, early processing factors, and some ribosomal proteins. The GC component, which surrounds the FC/DFC structure, harbors the late rRNA processing factors and ribosomal proteins, which associate with the rRNA to form the 40S and 60S preribosomal subunits that in turn are exported from the nucleoplasm to the cytoplasm. Finally, at the periphery of the nucleolus lies the perinucleolar heterochromatin with the NORs.
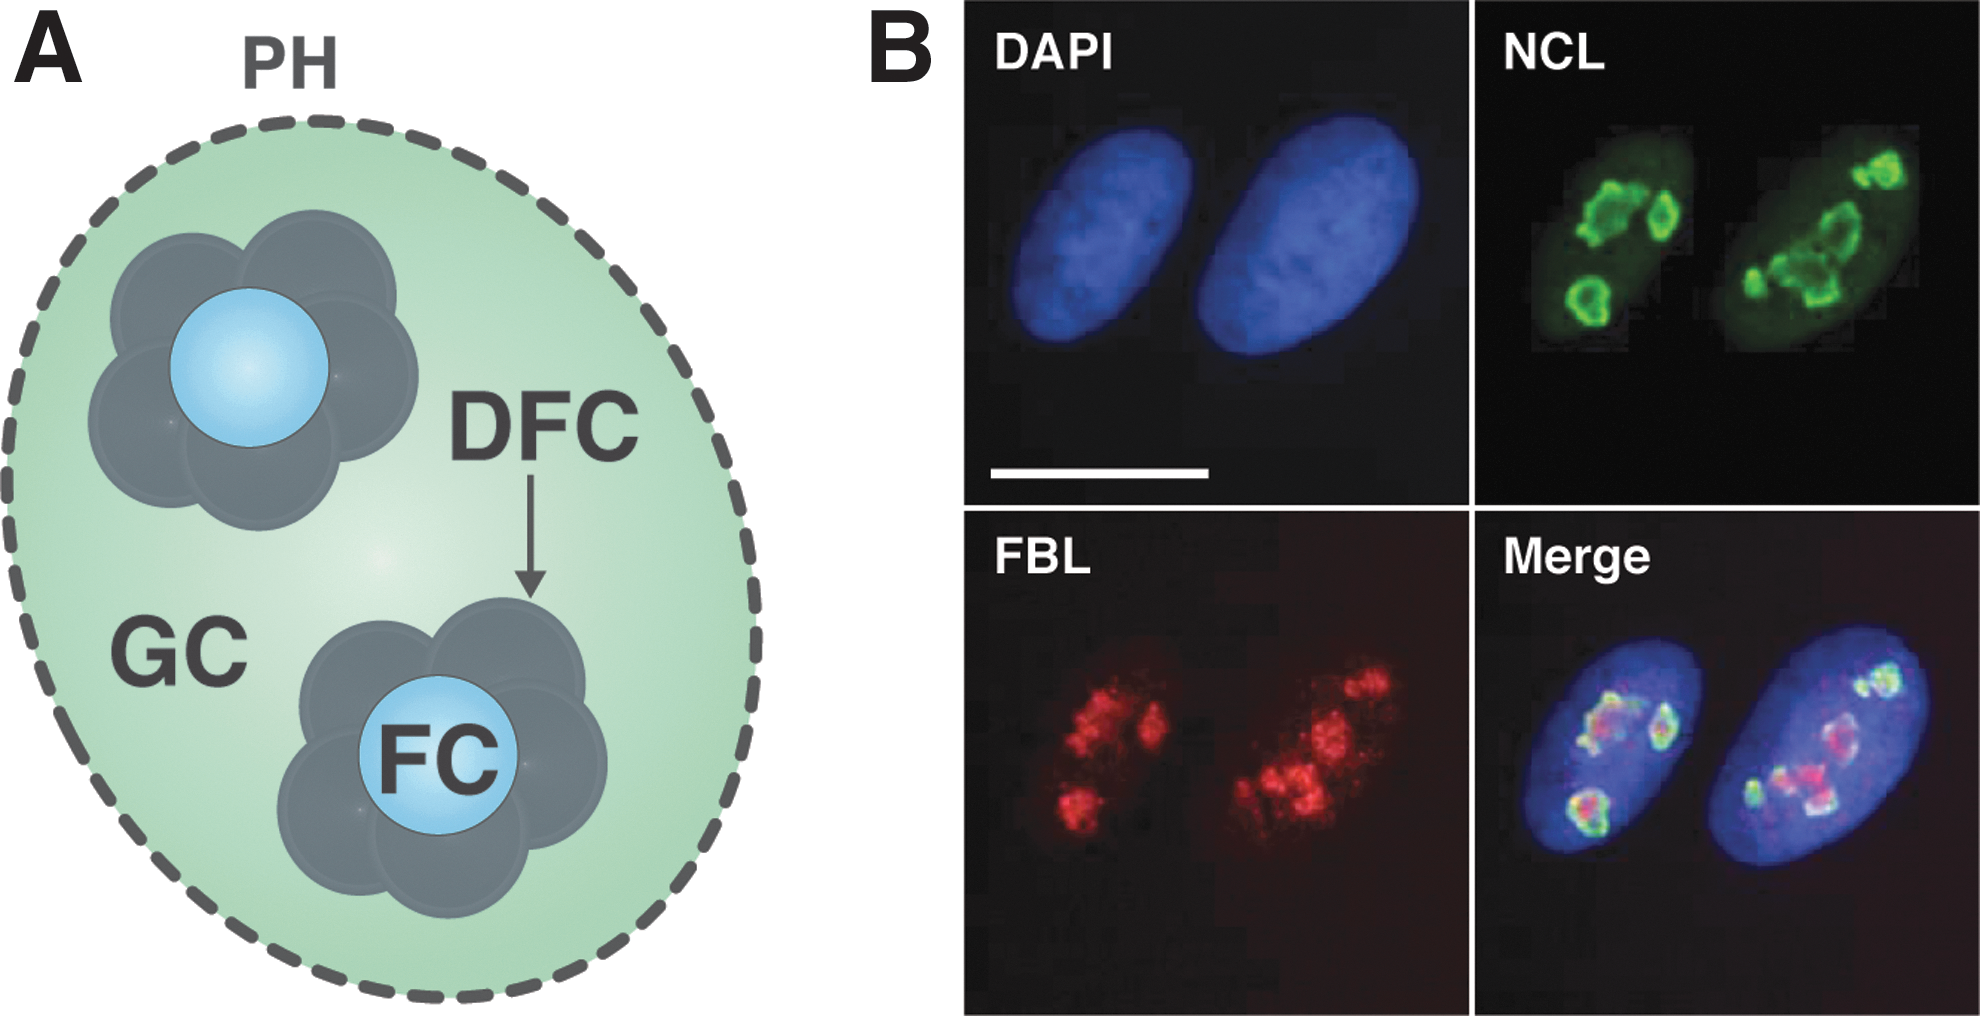
A schematic of the structure of a typical nucleolus and staining of NCL and FBL in A549 cells. Nucleoli, which are located within the nucleus of cells, are tripartite structures that are composed of a FC, DFC, and the GC, which is surrounded by PH
The nucleolus comprises close to 500 different proteins that are dynamically regulated in response to various cellular conditions. 8 A number of these nucleolar proteins are involved in the maintenance of nucleolar integrity and are thus located within specific regions of nucleolus. These proteins include, but are not limited to, UBTF, fibrillarin (FBL), UTP6, RPF1, NPM1, nucleolin (NCL), B23, and Nop56. FBL resides primarily in the DFC (reviewed by Dimario 9 ), while the localization of NCL is highly diverse, and dependent on the disease state or type of cell, where it has been reported to be within the nucleolus, nucleoplasm, cytoplasm, and even at the cell membrane (reviewed by Jia et al. 10 ). The staining pattern of what are considered two common markers used to demarcate the nucleoli, FBL and NCL, is illustrated under normal growth conditions in A549 cells, in Figure 1B.
As eluded to above, the nucleolus is a central hub within the cell for coordinating a cellular stress response, termed the “Nucleolar Surveillance Response or Nucleolar Stress Response” (NSR). The NSR occurs in response to multiple stressors that perturb ribosome production (e.g., viral infection, exposure to drugs or extreme temperature). Activation of the NSR leads to disruption and/or altered nucleolar morphology, which facilitates the release of ribosomal proteins, which are no longer being incorporated into ribosomes in the nucleoplasm. A subset of these ribosomal proteins (e.g., RPL5 and RPL11) are able to bind the E3-ubiquitin ligase MDM2, sequestering it from binding and mediating the degradation of p53. This leads to increased stabilization of the p53 protein within the cell, and consequently p53-driven cell cycle arrest, apoptosis, and/or senescence, depending on the cell type (reviewed in detail 4,11 ). Interestingly, there is also increasing evidence to suggest that the NSR can also elicit a p53-independent response under certain conditions. 12 –14 The NSR is thought to have evolved as a defensive mechanism initiated by cells in response to extreme and/or unexpected environmental forces, for example, changes in temperature, pH, oxygen levels, irradiation, that disrupt nucleolar function. The extent of the NSR depends on the severity and duration of the insult, ranging from mechanisms that preserve cellular function to those undergoing programmed cell death.
More recently, activation of the NSR using small molecule inhibitors has been utilized as a therapeutic strategy for the treatment of cancer. For example, treatment of a Myc-driven B cell lymphoma with the Pol I transcription inhibitor CX-5461 leads to changes in nucleolar morphology, and activation of the p53-dependent NSR, causing the cancer cells to undergo apoptosis which provides a survival advantage in vivo. 15 Other drugs that have been used in cancer therapy, for example, doxorubicin (DRB), 5-fluorouracil (5-FU), and camptothecin (CPT), are also known to cause nucleolar disruption that is likely to contribute, at least in part, to their therapeutic efficacy. 16,17
Detecting morphological changes (e.g., increased number and size) of nucleoli is used by pathologists to predict malignant transformation and enhanced growth characteristics of cells. 5 –7 However, these two parameters alone are not sufficient to be diagnostic for most cancers. It follows that a better understanding of nucleolar morphology in normal and tumor cells, and thus mechanisms to quantitatively measure those changes (e.g., by utilizing high-content imaging analysis approaches), has the potential to better predict malignant transformation and identify new therapies that can target the nucleolus and treat cancer.
Many imaging analysis tools to date have been developed to quantitatively assess phenotypic changes in cells in high content; these analysis programs include open source packages such as CellProfiler 18 ImageJ/FIJI/OpenHiCAMM, 19 –21 HCS-Analyzer 22 as well as commercially available image acquisition/analysis software such as Harmony™ (PerkinElmer), HCS Studio™ Cell (Cellomics/ThermoFisher), and IN Cell Investigator™ (GE Life Sciences). While numerous stressors are known to mediate changes in nucleolar morphology, 23 traditionally, it has been extremely difficult to develop high-content image analysis algorithms which can quantitatively assess the sheer range of these changes, such that they can be applied to predict malignant transformation. In a recent study, high-content imaging analysis utilizing a simple output of nucleolar morphology (e.g., counted the number of nucleoli) was performed using CellProfiler as a readout for a high-throughput RNAi screen conducted in MCF10A breast epithelial cells (which have on average two nucleoli per nucleus). 24 In this study, the authors were screening for candidates that, when depleted, led to a “one-nucleolus” phenotype. In a disease context, however, nucleoli can have varied morphologies (e.g., different nucleolar number, shape, and staining patterns are observed in malignant cells). Adding complexity to this issue is that in a high-throughput screening context, where cells are manipulated with biological or chemical agents, further changes in nucleolar characteristics (e.g., morphology and activity) can occur rather than just simply altered size and number per cell. 16,17 The challenge is therefore to develop mechanisms and algorithms that are able to capture and systematically categorize the enormous complexity of nucleolar morphology that occurs during malignancy or in response to cellular manipulation.
In this study, using drugs known to alter nucleolar morphology and/or function, we have developed a high-content imaging-based algorithm to identify three distinct nucleolar morphologies and classify the response of individual cells based on these parameters. This method is easily adapted for high-throughput phenotypic screens to enable biologists to identify and calculate different types of nucleolar disruption and/or changes in morphology. It could also be correlated with a particular cellular response (e.g., cell cycle arrest, apoptosis) and thus is a useful extension of the current approach, which purely assesses nucleolar number or size.
Materials and Methods
Antibodies, Buffers, and Reagents
DAPI (4′,6-diamidino-2-phenylindole, D9542), Triton™ X-100 (X100), Tween® 20 (P1379), bovine serum albumin (BSA, A7906), DRB (D1515), Actinomycin D (ACTD, A9415), Leptomycin B (LMB, L2913), MG132 (C2211), α-Amanitin (A2263), 5-Fluorouracil (5-FU, F6627), and dimethyl sulfoxide (DMSO, D4540) were all obtained from Sigma-Aldrich® (Castle Hill, Australia). CPT (S1288) and Etoposide (ETO, S1225) were purchased from Selleck Chemicals (Houston) and CX-5461 (SYN-3031) was obtained from SYNkinase (Parkville, Australia). α-FBL (Ab4566) and α-NCL (Ab22758) antibodies were purchased from Abcam (Melbourne, Australia). Goat-α-mouse IgG Alexa Fluor® 488 (A21235) and goat-α-rabbit IgG Alexa Fluor 647 (A11008) secondary antibodies, along with Dulbecco's phosphate-buffered saline (dPBS, 14190144; Gibco), were procured from ThermoFisher Scientific (Scoresby, Australia). Paraformaldehyde (PFA, 16% EM grade, 15700) was obtained from Electron Microscopy Sciences (Hatfield). All compounds used for treatment of cells, apart from LMB (70% methanol), α-Amanitin (H2O), and CX-5461 (50 mM NaH2PO4, pH 4.5), were solubilized in DMSO and stored at −20°C in aliquots before use.
Cell Culture
Unless otherwise stated, cell culture reagents were purchased from ThermoFisher Scientific. Human lung adenocarcinoma cells (A549) obtained from ATCC® (CCL-185) were cultured in growth media containing DMEM/F12 with HEPES (#11330032), supplemented with 10% fetal bovine serum (#F9423; Sigma-Aldrich) and 2 mM GlutaMAX™ (#35050061). To subculture cells, media was aspirated and cell monolayers washed once with dPBS, and then detached using Trypsin-EDTA (0.25%, #25200114), followed by neutralization with growth media. Quantitation of cell number was determined using the Beckman Coulter® Z2™ Coulter Counter® cell and particle counter (Lane Cove, Australia).
Immunofluorescence Analysis
A549 cells (prepared in growth media at 18,750 cells/mL) were seeded into CellCarrier Ultra 384-well optical microplates (#6057300; PerkinElmer) at a volume of 40 μL/well (corresponding to a density of 750 cells/well) using the BioTek® EL406 washer/dispenser (Winooski). Cells were incubated for 24 h at 37°C with 5% CO2 in the Liconic STX110 microplate incubator (Mauren, Liechtenstein). Media was aspirated off the wells and replaced with A549 growth media containing drug (or vehicle) prepared freshly at the following concentrations: 500 nM DRB, 5 nM ACTD, 10 ng/mL LMB, 10 μM MG132, 50 nM CPT, 50 μM ETO, 2.5 μM α-Amanitin, 50 μM 5-FU, and 1 μM CX-5461. After treatment, cells were incubated at 37°C with 5% CO2 for between 3 and 24 h. Using the BioTek EL406 robot, media was aspirated from the microplates, and cells were fixed with 25 μL/well 4% (v/v) PFA (prepared freshly in dPBS) for 10 min at room temperature. After fixation, cells were washed once with 50 μL/well dPBS, and subsequently stained with 25 μL/well of a 0.1% TTX-100 solution prepared in dPBS (containing 5 ng/mL DAPI) for 10 min at room temperature. Microplates were then washed twice with 50 μL/well dPBS containing 0.05% Tween 20, and then treated for 30 min at room temperature with 25 μL/well of a 1% BSA (in dPBS) solution with antibodies α-FBL (4 μg/mL) and α-NCL (1.6 μg/mL). Microplates were then washed as described above and treated for a further 30 min at room temperature with 25 μL/well of a 1% BSA (in dPBS) solution containing goat α-mouse IgG Alexa Fluor 647 (2.8 μg/mL) and goat α-rabbit IgG Alexa Fluor 488 (2.8 μg/mL) antibodies. Plates were again washed as described above; the final wash aspirated and 50 μL/well fresh dPBS added before imaging.
Image Acquisition
Images were acquired on the PerkinElmer Opera Phenix™ High-Content Screening System using Harmony® Software (Version 4.5). Images were captured in confocal mode with a 63 × water (NA 1.15) objective and the binning parameter set at 2. Individual channel parameters were set as follows (all at a height of 2 μm): DAPI (nuclei), 200 ms exposure at 100% laser power; Alexa Fluor 488 (NCL), 80 ms exposure at 50% laser power; Alexa Fluor 647 (FBL), and 100 ms exposure at 100% power. The channel sequence settings were selected to separate the DAPI and Alexa Fluor 488 channels at the time of imaging. A total of 36 fields per well for each of the above channels were acquired for analysis.
High-Content Image Analysis and Classification of Nucleolar Morphology Using a Harmony/PhenoLOGIC Machine-Learning Algorithm
Images were analyzed using the PerkinElmer Harmony 4.5 software with the PhenoLOGIC™ machine learning module. An in-depth step-by-step description of how we approached nucleolar identification and classification using this software, and its application using a large-scale dataset are described in further detail in the Results and Discussion section, with the analysis sequences used in the image training described in Table 1.
Method for Phenotypic Classification of Nucleoli Using Harmony and PhenoLOGIC Software
DAPI, 4′,6-diamidino-2-phenylindole; FBL, Fibrillarin; NCL, nucleolin.
Statistical Analysis of Data (Postnucleolar Morphological Classification)
To obtain a robust idea of how our algorithm performed across different compound treatments, we summarized data from four technical replicate wells with 36 fields per well (at 63 × imaging in the center of the well), with the goal to obtain enough images to analyze > ∼500 nuclei per treatment per experiment. To account for biological and systematic variability between experiments, we considered data from three independent “biological” experiments. To robustly quantify changes in nucleolar morphology following compound treatment, we adopted the following two stage analysis procedure, the full details of which are included in the form of raw count data and the relevant analysis R script in the Supplementary Data (Supplementary Data are available online at
where the shape and scale parameters are expressed in terms of the distribution's arithmetic mean and variance
and assume the following linear model
Here, x
1 denotes the treatment type (vehicle, drug), x
2, the nucleolar morphology type (normal, rings, dispersed); the
The coefficient
Results and Discussion
In our study, we describe a high-content imaging-based method using Perkin Elmer Harmony software with the PhenoLOGIC machine learning module to identify, classify, and quantitate three distinct nucleolar morphologies. We then applied this approach to analyze the effect of a number of different drugs that are known to cause changes to nucleolar morphology and/or activation of the nucleolar surveillance response.
Due to the complexities associated with quantifying changes in nucleolar morphology (e.g., number, size, intensity, and subcellular localization), we utilized the PhenoLOGIC machine learning module of Harmony. When using this module, the operator can select cells from images corresponding to the desired phenotype to “train” the software (learning by example); the software then identifies the specific properties responsible for the largest variability in the data across the sampled cells (from the many that are reported in an analysis sequence), and these properties are combined into a linear classifier to separate the different classes of cells. 28,29
For this study, we captured two-dimensional images of nuclear staining (DAPI) and immunostaining in confocal mode for two nucleolar markers FBL and NCL over multiple fields using a 63 × objective in a 384-well optical microplate format. Using the intensity and STAR morphology (Symmetry, Threshold compactness, Axial, or Radial) properties of both FBL and NCL staining, the SER textural features (Spot, Hole, Edge, Ridge, Valley, Saddle) of NCL staining, and then subsequently using PhenoLOGIC, we were able to categorize three distinct nucleolar phenotypes within the human lung adenocarcinoma (A549) cells with drug treatment: Normal (Class A); those with a perinucleolar ring morphology (Rings, Class B); and those in which the nucleoli completely disperses into the nucleoplasm (Dispersed, Class C). For training the software, we treated A549 cells with various drugs, in which we had observed the three different morphologies (Fig. 2). We used solvent treated cells (e.g., DMSO, methanol, H2O, and NaH2PO4) to train for detection of Class A. To train for Class B, we treated cells with LMB. LMB inactivates CRM1/exportin 1 by covalent modification of the protein, leading to inhibition of nuclear export. 30 In addition, LMB has been implicated as an activator of the NSR (reviewed in Boulon et al. 23 ) and causes enhanced p53 stabilization. 17,31 While CRM1 is closely associated with nucleolar function, gross disruption of the nucleolar structure has not been observed with LMB treatment. 32,33 Intriguingly, we observed that treatment of A549 cells with LMB leads to a distinct perinucleolar ring structure (Fig. 2). Finally, we trained the algorithm to detect Class C by treating cells with ACTD, an antibiotic compound which has long been used in the treatment of several different types of cancer and acts by intercalating with DNA at the transcription initiation/elongation complex, thus preventing RNA polymerase transcription from occurring. 34 Furthermore, it has been reported that ACTD mediates nucleolar disruption/release of ribosomal proteins into the nucleoplasm, as well as induces stabilization of p53. 23,35
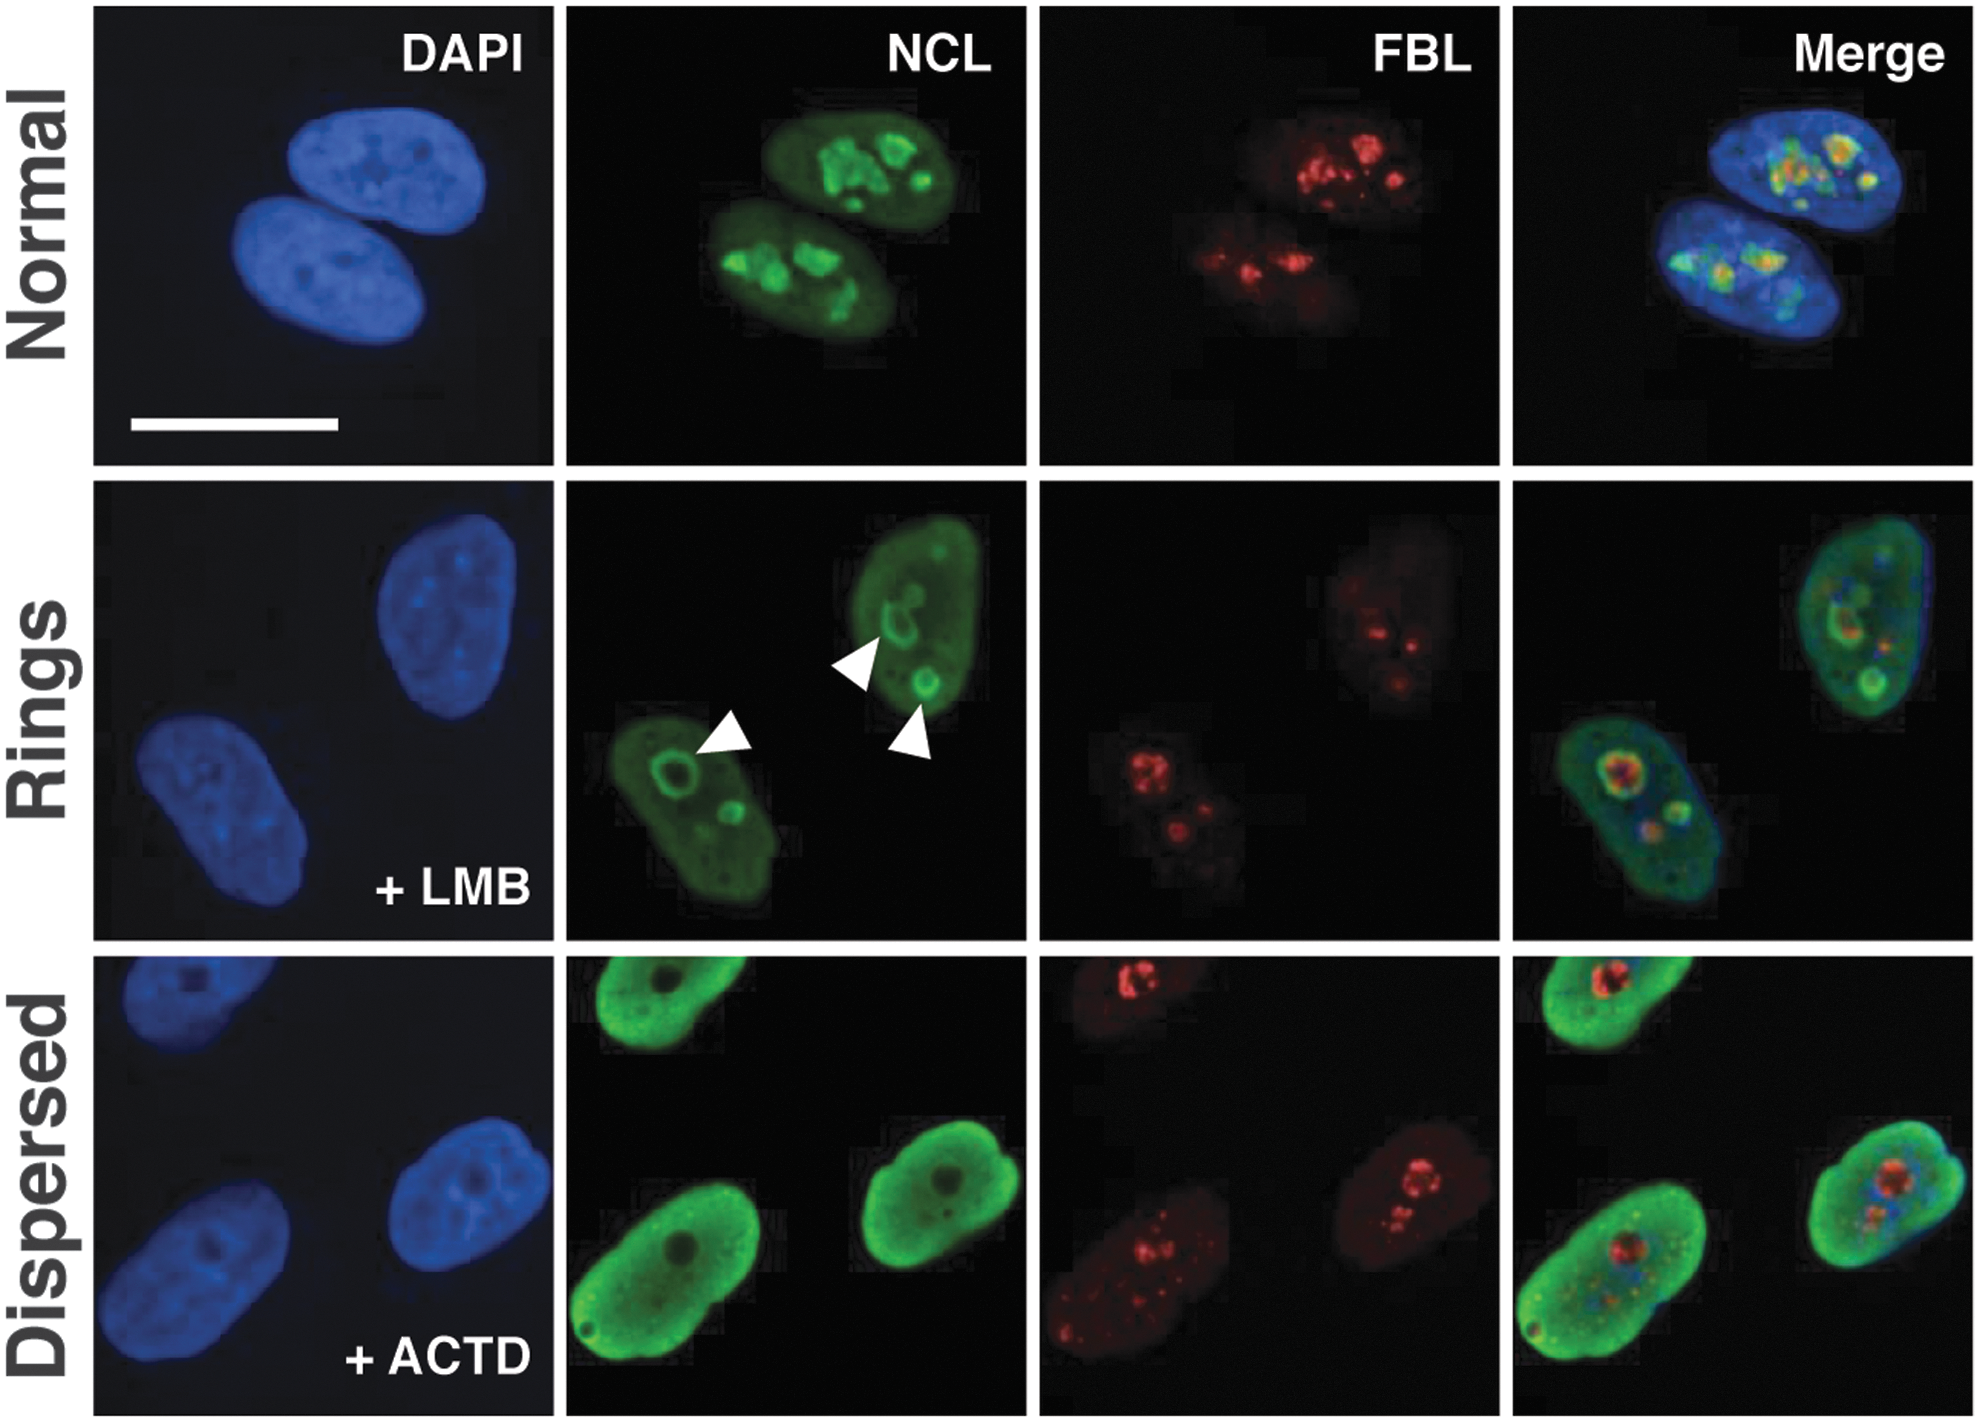
Detecting three different classes of nucleolar morphology using NCL and FBL staining. To train the Harmony software to detect three different nucleolar phenotypes, A549 cells were treated with vehicle compounds (e.g., DMSO, H2O, MeOH, Na2HPO4–DMSO image depicted in this figure) to detect “Normal” nucleoli, LMB, which led to many of the cells displaying a perinucleolar ring phenotype with NCL staining (denoted by the arrow heads) and FBL staining localized within the center of these structures (“Rings”) or ACTD, which led to the dispersion of the NCL staining into the nucleus, as well as condensed FBL staining (“Dispersed”). Images taken using the PerkinElmer Opera Phenix with a 63 × objective. Scale bar represents 20 μm. ACTD, Actinomycin D; DMSO, dimethyl sulfoxide; LMB, Leptomycin B.
Using images from each of the treatments described above, we developed an image analysis pipeline in Harmony and PhenoLOGIC, which is visually demonstrated in Figure 3 and described in step-wise detail in Table 1. We began by inputting the specific images for analysis (Step 1), and then adding a building block to our algorithm to segment the nuclei (DAPI staining) (Step 2). We then removed border objects from the images being analyzed to give a population of whole (valid) nuclei (Step 3). To obtain detailed NCL and FBL phenotypic profiles, we then added a building block to report the mean and median intensity properties of both FBL and NCL staining (Steps 4 and 6) and further generated a ratio of the intensity median/mean of each stain for each cell (Steps 5 and 7). The STAR morphology properties for both NCL (Step 8) and FBL (Step 9) staining were then incorporated into the analysis pipeline. Finally, as NCL staining was more robust with drug treatment, we performed SER textural analysis based on an array of SER features (and normalized to regional intensity) (Step 10). The specific features used in the overall algorithm are listed in Table 1. From there, we used the PhenoLOGIC module of the software, along with the intensity/morphology/textural information already captured within the algorithm, to classify the nucleoli identified in each valid nucleus as either Class A, B, or C (Step 11, Table 1). To do this, we used ∼100–130 cells across multiple images to train for the classification of each Class. The PhenoLOGIC linear classifier is based on the linear model X = −Offset + Linear Coefficient 1*Property 1 + Linear Coefficient 2*Property 2 (and so on), where the best number of properties and the ranked relevance of each property on the classification result was automatically determined by PhenoLOGIC (these properties are ranked in order of relevance for classification for every permutation: A versus B, A versus C, and B versus C; Table 2). In summary, when comparing Class A (Normal) with Class B (Rings), changes in four of the SER texture properties observed for NCL staining, the FBL intensity median/mean ratio, as well as three NCL and two FBL morphological properties were the most important features to distinguish between these two phenotypes. When comparing A (Normal) versus C (Dispersed), variations in NCL and FBL morphology as well as the FBL intensity median/mean ratio were the most important properties. And finally, when discriminating between B (Rings) and C (Dispersed), changes in NCL SER textural and morphology properties, as well as FBL morphology and intensity median/mean, were the most relevant features.
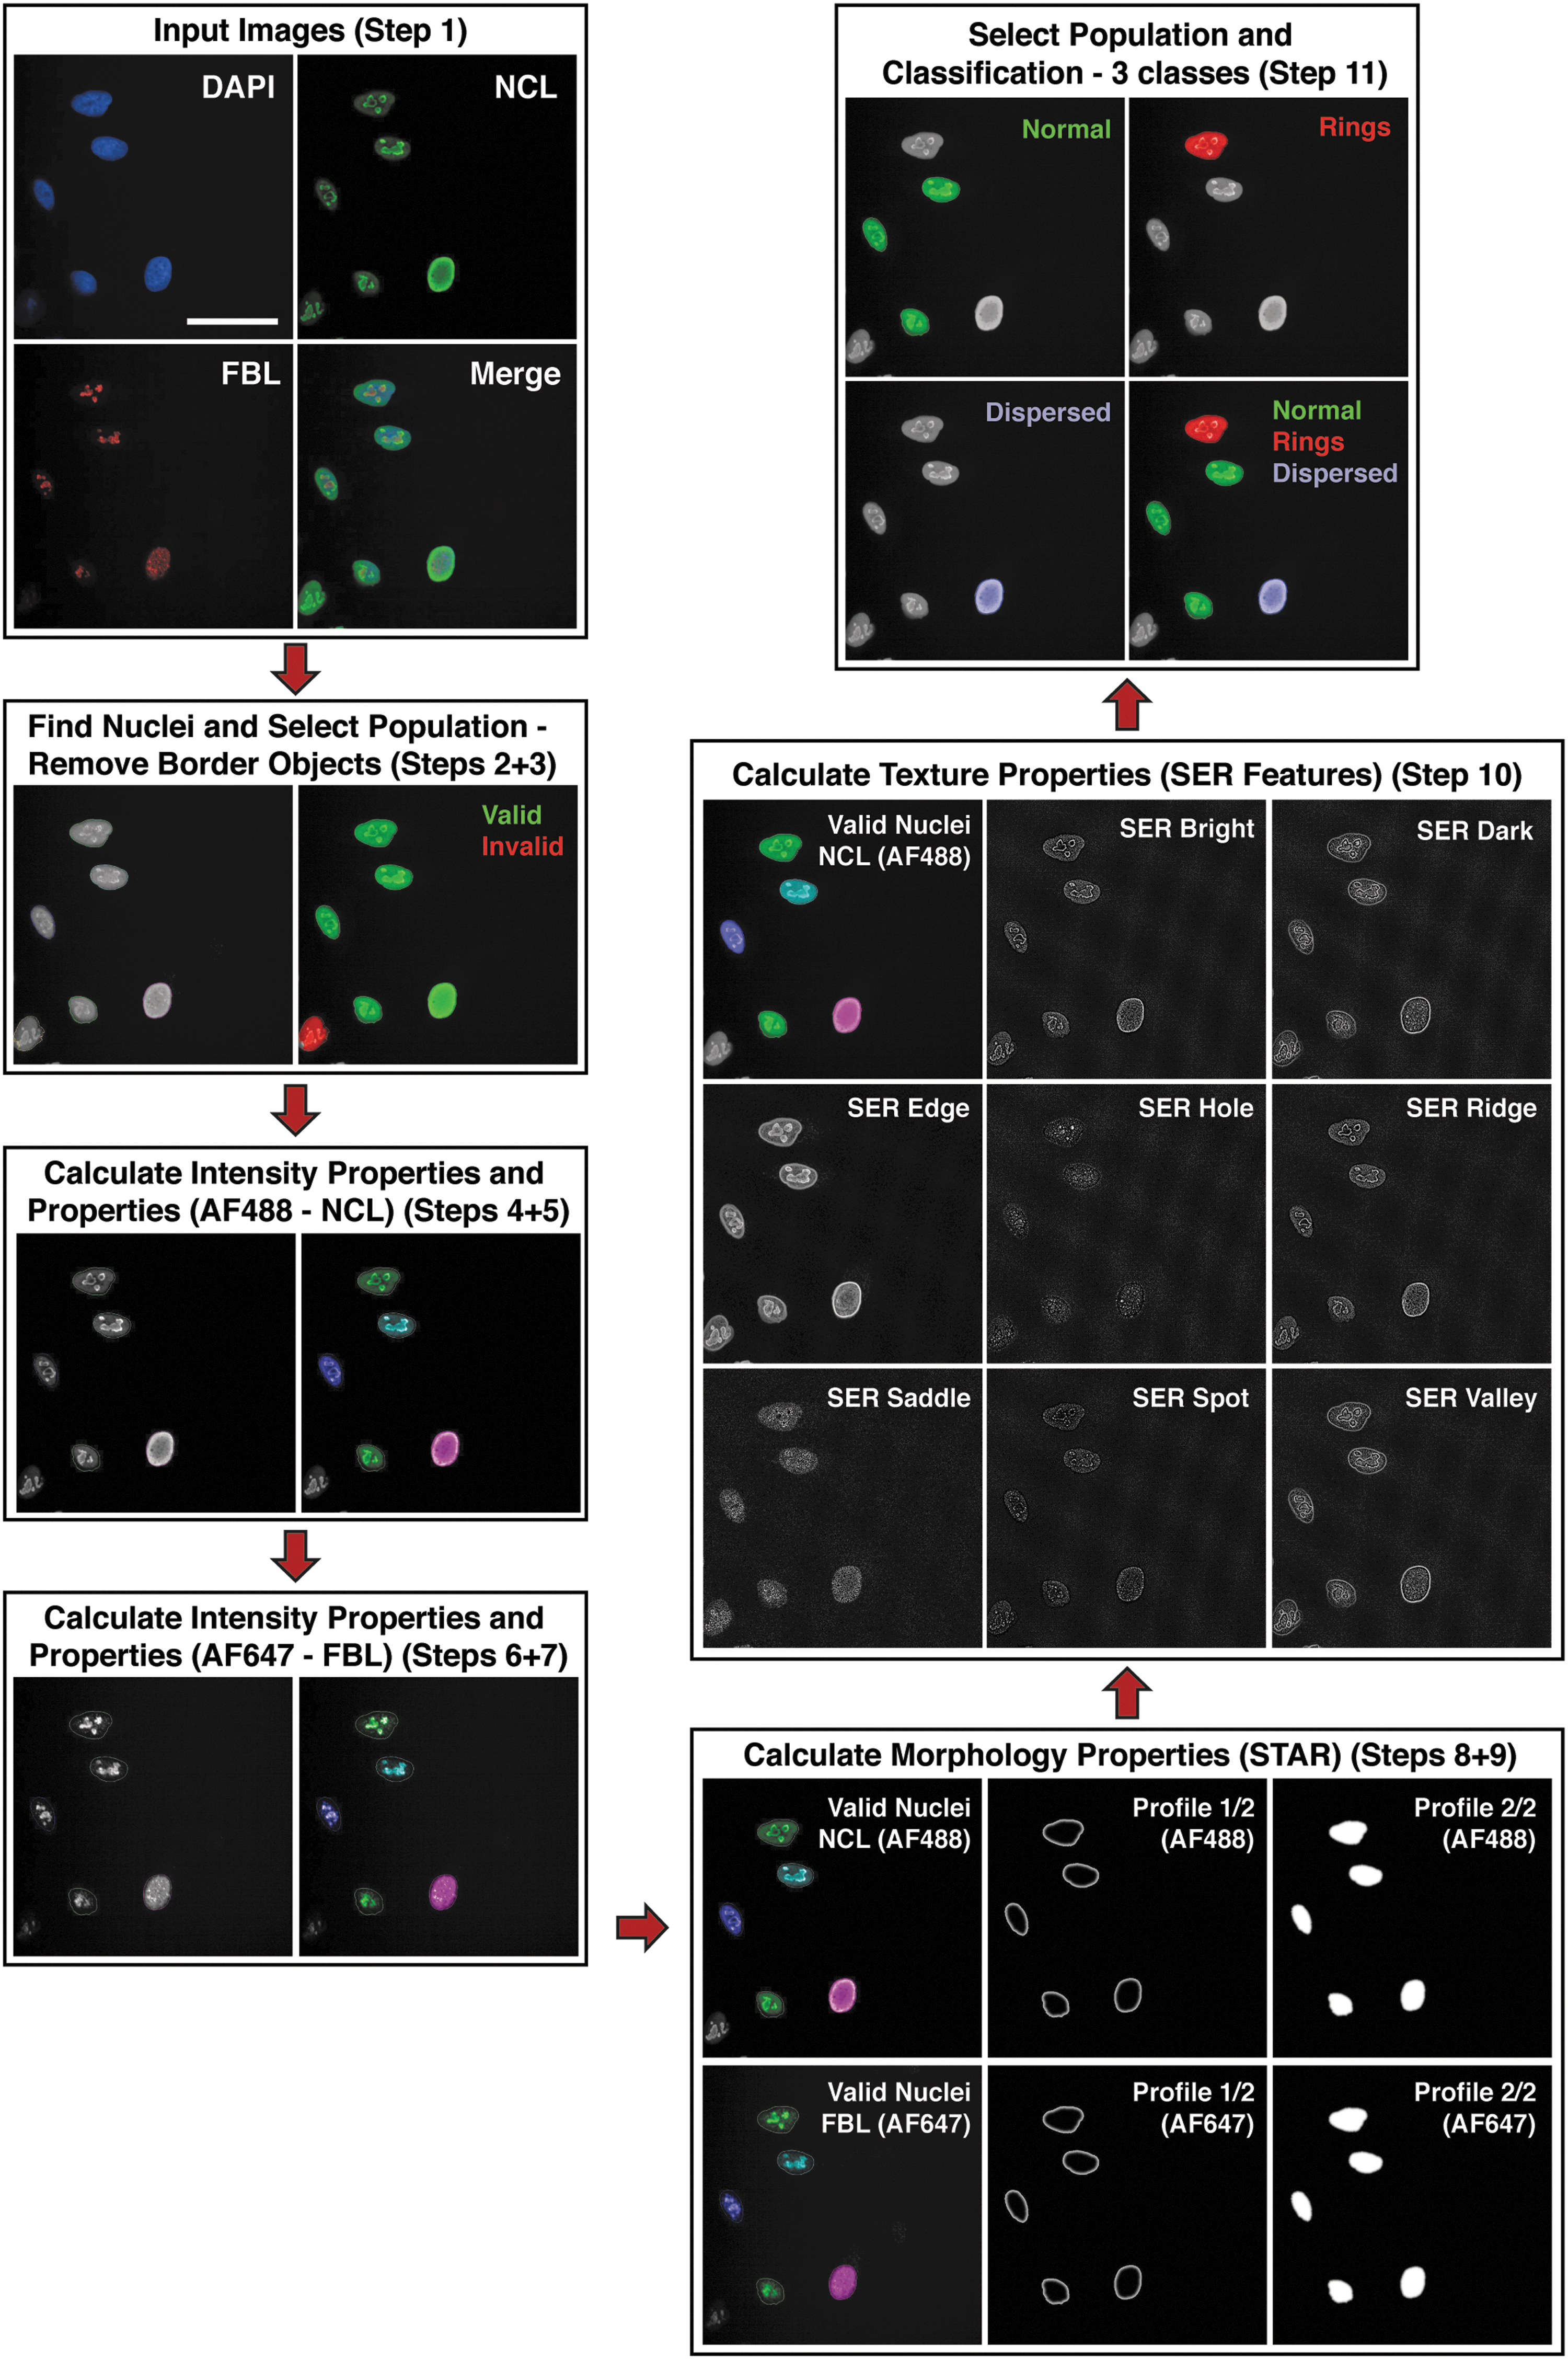
Phenotypic classification of nucleolar morphology using Harmony and PhenoLOGIC software. The specific steps used to create this algorithm are detailed in Table 1. In brief, images taken using the Opera Phenix were input into the Harmony software, the whole nucleus of each cell identified, and border objects excluded (Valid Nuclei) from the analysis. Then, the intensity properties and ratio of intensity median/mean for both NCL and FBL staining of each valid nucleus was measured. From there, the morphology properties of FBL/NCL staining within each valid nucleus was measured using the STAR (Symmetry, Threshold compactness, Profile) method, as well as the SER (Spot, Hole, Edge, Ridge, Valley, Saddle, Bright, Dark) textural properties of NCL staining. Once all of these data were collected, the software was then trained by the user in a “learn-by-example” manner to detect the three classes (Normal, Rings, Dispersed) of nucleoli (across images similar to those depicted in Fig. 2). The algorithm was able to detect the three different classes of nucleoli within images. Images were acquired using the PerkinElmer Opera Phenix with a 63 × objective, and images taken from Harmony software at the different steps in the algorithm are shown. Scale bar represents 50 μm.
PhenoLOGIC Selected Nucleolar Properties Used for Linear Classification (Ordered by Relevance)
Next, the classifier value of each cell in the training image was calculated based on those automatically chosen properties and shown in the linear classifier scatter plot (Fig. 4) to determine how well two populations of cells with different nucleolar morphology could be distinguished. The “Goodness” of separation is reported on the top of each scatter plot (and the value for each is listed in Table 2). This “Goodness” value is based on the distance of the training sets from the classifier line. While it does not provide a statistical inference, it allows the user to understand how well the algorithm is separating two different classes, and generally speaking, the larger the “Goodness” value, the better the separation. Performing this analysis, we determined that when comparing Class A (Normal) with Class B (Rings), we achieved a “Goodness” value of 1.71 (Fig. 4A), when comparing Class A with Class C (Dispersed), a value of 3.59 (Fig. 4B) and Class B (Rings) with Class C (Dispersed) gave a value of 2.52 (Fig. 4C). Thus, this analysis was effective to separate each of the three classes of nucleoli.

Classification of nucleoli: linear classifier scatter plots. Within the Harmony software, the linear classifier is calculated using the formula described in the Materials and Methods section. This analysis was performed between “Normal” and “Rings”
We then tested our image analysis pipeline with PhenoLOGIC nucleolar classification across a larger image dataset. We treated A549 cells with various drugs that are known to either (i) lead to changes in nucleolar morphology, or (ii) induce the NSR, and (iii) lead to increased p53 stabilization. 15 –17,35,36 We treated cells with 5-FU (a pyrimidine analog, which interferes with DNA synthesis and is used in cancer treatment 37 ), ACTD, CPT (an alkaloid compound which selectively inhibits DNA Topoisomerase (Top) I and causes DNA damage 38,39 ), DRB (a cytotoxic anthracycline used in cancer therapy which intercalates with DNA inhibits DNA Top2 α and causes DNA damage 40,41 ), and ETO (an inhibitor of DNA synthesis used in cancer therapy which also targets Top2 42 ). We also included treatment with MG132 (a synthetic peptide aldehyde which is a potent but reversible proteasome inhibitor 43 ), α-Amanitin (a mushroom toxin which inhibits RNA Polymerase II transcription 44,45 ), CX-5461 (a highly selective Pol I transcription inhibitor 15,46 ), and LMB. From our experience, nucleolar disruption can be a highly dynamic process, with changes in morphology occurring within hours after being treated with drugs that are known to cause this phenomenon. Furthermore, there is evidence supporting the notion that loss of nucleolar integrity occurs rapidly after the cellular insult, activating the NSR and subsequently causing impairments in rRNA synthesis and, all of which, most importantly, precedes apoptosis. 47 Therefore, we performed our treatments over a short time course (3, 6, and 24 h) before cells begin to undergo cell death, to specifically identify drugs that directly cause nucleolar disruption (as opposed to drugs which are causing cell death and/or apoptosis—indirectly mediating changes in nucleolar morphology, thus confounding the results). In addition, the concentrations of the compounds tested in this analysis were selected on the basis that the drug was able to activate/stabilize p53 at each of these time points as an indicator of cellular stress (unpublished observations).
After treatment and subsequent processing of the microplates, the images that were acquired were subjected to the analysis pipeline, which calculated the ratio of the three classes (as a percentage of the total number of nuclei analyzed for each individual treatment and time point) (Fig. 5A–C). These data were then subjected to further statistical analysis (as outlined in the Materials and Methods section). We obtained robust estimates of vehicle-normalized changes in nucleolar morphology following drug treatment at different time points (see Materials and Methods section for further detail); resulting in the capture of log-transformed normalized ratios for ring-like versus normal nucleoli and dispersed versus normal, respectively. Values greater than (less than) zero indicate an increase (decrease) in nucleoli of an aberrant (ring/dispersed) morphology relative to normal and then relative to the vehicle control. From our analysis, we reveal some intriguing findings. For example, compared to their respective vehicle controls, treatment of cells with the Pol I transcription inhibitors ACTD and CX-5461 mediated an increase in the percentage of dispersed nucleoli. Interestingly, the ratios did not change over time with ACTD treatment, but they did with CX-5461 treatment, specifically the number of dispersed nucleoli decreased and the number of perinucleolar rings increased. Alternatively, LMB treatment dramatically increased the percentage of perinucleolar ring structures, which was elevated at 3 h and sustained for 24 h. The ring morphology identified in this study could signify an intermediate state between the normal and dispersed nucleoli, and requires further investigation. For some compounds (e.g., 5-FU, CPT, DRB, ETO, and MG132), we observed little to no change in the ratio of ring/dispersed nucleoli compared to the normal phenotype. While these drugs are reported in the literature to cause either elevated p53 and/or nucleolar disruption (as discussed above), there are a number of possibilities as to why this was not observed in A549 cells. For example, the reported responses to these stressors could be cell type, concentration, or time point specific, or the nucleolar disruption not observable using FBL/NCL staining (i.e., other components of the nucleoli may be affected). Furthermore, a number of these drugs are classified as DNA-damaging agents (e.g., 5-FU, DRB, ETO, and CPT), which could induce p53 accumulation/activity independent of complete nucleolar disruption, 17 and may go some way to explain why changes in nucleolar morphology were not observed when treating with these compounds.

Classification of nucleoli in A549 cells after treatment with drugs known to induce nucleolar disruption. In total, experiments involving three biological replicates, each with four technical replicates, were performed; A549 cells were treated for between 3 and 24 h with either vehicle or drug, and immunofluorescence analysis performed to detect NCL and FBL staining. After imaging using the Opera Phenix at 63 × , images were analyzed using the pipeline described in Figure 3 and Table 1. A representative experiment, demonstrating the percentage of each nucleolar class for the drugs dissolved in DMSO
In this study, we have demonstrated that a high-content imaging and a “learn by example” approach (utilizing morphology and textural features of two common nucleolar markers, NCL and FBL) is able to successfully classify three distinct nucleolar morphologies present in A549 cells. The relevant nucleolar SER texture properties and morphology properties for linear classification and the linear classifier formula used by PhenoLOGIC module described in the current study provide useful information for the development of other nucleolar imaging analysis tools/software. Given the availability of other stains that would identify other components of the nucleoli (as described above), and that other information coupled to the nucleolar morphology (e.g., cell cycle/apoptosis markers) may be of interest to researchers, the approach outlined in this study could be easily adapted and tailored to encompass different cell types and these other parameters in a high-throughput assay (up to a total of six different classes). In addition, given that the development of new therapeutics to treat diseases such as cancer are of major interest, in particular, finding therapies which directly target the nucleolus and mediate nucleolar disruption in cancer cells, algorithms such as this one will enable researchers to specifically measure the effect of these therapies on more complex nucleolar morphologies. For example, to conduct a screen to identify drugs which specifically mediate nucleolar disruption leading to cell death/apoptosis, one approach would be to integrate multiple time points (e.g., <24 h and 48+ h) measuring nucleolar disruption early and cell viability at the later time point, thus enabling the triage of drugs from a screen that explicitly induce nucleolar disruption and lead to cell death. Finally, as pathologists utilize changes in nucleolar number and size in the diagnosis and staging of cancer, this approach could also be adapted for clinical utilization in a diagnostic pipeline–either as a measure of response of patient cells in vitro to specific therapies or in the measurement of disease biomarkers and/or predictors of disease progression or outcome.
Footnotes
Acknowledgments
The authors thank the Biomolecular Resource Facility (incorporating the Australian Cancer Research Foundation-funded ANU Centre for Therapeutic Discovery) located within the John Curtin School of Medical Research for the use of equipment and software to perform these studies, and the Captain Courageous Foundation (
Disclosure Statement
R.D.H. is a Chief Scientific Advisor of Pimera, Inc., San Diego, CA. All other authors have no disclosures to report.