
Abstract
Three-dimensional (3D) cell culture systems more closely mimic the in vivo cellular microenvironment than traditional two-dimensional cell culture methods, making them a valuable tool in drug screening assays. However, 3D environments often make analysis of cellular responses more difficult, so most high-throughput (HT) 3D assays have been limited to measurements of cell viability. Yet, many other cell functions contribute to disease and are important pharmacological targets. Therefore, there is a need for new technologies that enable HT measurements of a wider range of cell functions for drug screening. Here, we have adapted a hydrogel system that enables cells to be cultured in a 3D environment and allows for the simultaneous detection of matrix metalloproteinase (MMP) and metabolic activities. This system was then characterized for utility in HT screening approaches. MMPs are critical regulators of tissue homeostasis and are upregulated in many diseases, such as arthritis and cancer. The developed assay achieved Z′-factor values above 0.9 and 0.5 for enzymatic and cellular assays, respectively, intraplate coefficients of variation (%CV) below 10% and 12%, respectively, and signal measurement was unaffected by dimethyl sulfoxide, a common solvent of therapeutic compounds. Human MMP-1, -2, and -9 resulted in a significant increase in signal intensity. Encapsulation of several cell types produced robust signals above background noise and within the linear range of the assay. Multiple drugs that are known to alter MMP activity were utilized in a range of concentrations with a fibrosarcoma cell line to demonstrate the feasibility of the assay for HT applications. This assay combines 3D cellular encapsulation and MMP activity detection in HT format, which makes it suitable for drug screening and development applications.
Introduction
Over the past several decades, mounting evidence has demonstrated that three-dimensional (3D) in vitro culture systems more closely mimic the in vivo cellular microenvironment than culture on traditional two-dimensional (2D) tissue culture plastic. 3D culture provides environmental cues similar to the in vivo environment that are absent in 2D cultures, such as soluble gradients and 3D cell–cell and cell–matrix adhesion cues. 1 –3 Such differences between 3D and 2D cultures have significant effects on cell behavior and function. For example, human mesenchymal stem cells differentiate to osteoblasts when cultured on top of stiff gels (2D), but differentiate to chondrocytes when cultured within the same stiff gel (3D). 4 3D culture can also restore the differentiation state of chondrocytes after 2D culture. 5 Fibroblasts in 3D matrices are more spindle shaped and migrate faster compared with 2D matrices. 6 Using 3D cell spheroid models, researchers have been able to recapitulate in vivo treatment resistance observed in several cancers, including breast, colon, and pancreatic cancer, in an experimentally accessible in vitro setting. 7 –9
Because of the advantages of 3D culture systems, there is great interest in adapting these systems for high-throughput (HT) approaches. However, optimizing 3D systems for HT has been hampered by increased cost, complexity, time and effort, and the incompatibility of many standard biological assays with both 3D culturing and HT approaches. 10 Thus, current 3D HT platforms assess a limited number of cell functions, namely, cell viability and migration (see review 10 ). However, many other cell functions also contribute to disease progression and are targets for therapy. Here, we have developed a 3D culture system that includes a “built-in” biological assay, in which no further processing is needed to measure cellular matrix metalloproteinase (MMP) activity. 11
In humans, MMPs are a family of 23 proteolytic enzymes that cleave extracellular matrix (ECM) proteins as well as other bioactive molecules, including surface receptors and cytokines. 12,13 MMPs play key roles in morphogenesis and wound healing, and in diseases such as chronic tissue ulcers and arthritis. 12,14 MMPs are also critical regulators of several “hallmarks of cancer,” including migration, invasion, and angiogenesis, processes that are inherently 3D phenomena. 15 Elevated expression of many MMPs is associated with metastasis and poor prognosis. 15 MMP activity is regulated at multiple levels, including expression, secretion, proenzyme cleavage, and the action of endogenous inhibitors (i.e., tissue inhibitors of metalloproteinases). Therefore, activity-based measurements, such as cleavage of fluorescent reporters or zymography, are critical, as mRNA and protein expression assays are not sufficient to capture and integrate these multiple layers of regulation.
Despite the overwhelming evidence supporting the critical role of MMPs in cancer progress, direct pharmacological inhibition of MMP enzymatic activity has yet to yield clinical success. This failure has been attributed to several factors, including the broad-spectrum nature of the inhibitors and off-target effects due to the pleiotropic role of MMPs in normal tissue function. To overcome these limitations, an alternative strategy to reduce MMP activity would be to target the upstream cellular signaling pathways regulating MMP activity. In addition, small molecules developed to target other cell functions, such as cell viability, are not routinely screened for their effect on MMP activity due to the lack of compatible assays. However, a previous study has shown that several RAF/MEK kinase inhibitors increased MMP activity and cell migration. 16 Therefore, there is a need for new technologies to perform HT measurement of MMP activity. To address this need, a previously developed 3D hydrogel system functionalized with an MMP-degradable sensor to enable facile measurement of MMP activity was miniaturized and optimized for HT applications. 11
The 3D hydrogel system utilizes poly(ethylene glycol) (PEG) hydrogels functionalized with a degradable type I collagen-derived fluorogenic peptide sensor to measure MMP activity. 11 PEG is a synthetic polymer that can be crosslinked to form a biocompatible hydrogel and has similar water content to in vivo tissue. 11,17 By being able to precisely tune the chemical and mechanical attributes of the hydrogel, the system can be optimized to more closely recapitulate the in vivo microenvironment of interest. In addition, PEG hydrogel polymerization is often photoinitiated, enabling quick, user-controlled hydrogel formation, making it more amenable to HT approaches than traditional ECM hydrogels (i.e., collagen or reconstituted basement membrane), which are slower and temperature sensitive. Therefore, utilizing PEG hydrogels enables the automation of cell encapsulation with robotic liquid handlers, as demonstrated by others. 18
In this work, the 3D MMP hydrogel assay was miniaturized and scaled up to facilitate drug screening applications. The reproducibility and robustness of the HT assay were determined using a bacterial collagenase type I enzyme and a fibrosarcoma cell line (HT1080). The assay was validated with commercially available human MMPs and encapsulation of several different cell types. Finally, to demonstrate the ability of the system to measure the effect of small-molecule drugs on cellular MMP activity and for future HT applications, the HT1080 cell line was treated with several drugs over a range of concentrations.
Materials and Methods
Fluorescent MMP-Degradable Peptide Synthesis
The fluorescent MMP-degradable peptide [GGPQG↓IWGQK(Dde)AdOO_C] was synthesized using Fmoc solid-phase peptide synthesis (Liberty Blue™ Peptide Synthesizer; CEM, Matthews, NC) with a Rink Amide MBHA resin (EMD Millipore, Burlington, MA) as described elsewhere, 11 with the following modifications: Fmoc-8-amino-3,6-dioxaoctanoic acid (AdOO; Chem-Impex International, Wood Dale, IL) was used as the small hydrophilic spacer between cysteine and MMP degradable peptide to increase the hydrophilicity of the peptide over the previously used aminohexyl spacer. Dabcyl succinimidyl ester (Anaspec, Fremont, CA) and fluorescein NHS ester (Thermo Scientific™, Pittsburgh, PA) coupling was performed as described, 11 with a shortened resin cleavage time of 2.5 h. The peptide was purified using high-performance liquid chromatography (LaChrom Elite; Hitachi, Schaumburg, IL). The molecular weight of the peptide was verified using matrix assisted, laser desorption-ionization, time-of-flight (MALDI-TOF) mass spectrometry (UltrafleXtreme™; Bruker, Billerica, MA).
PEG-NB Functionalization and Hydrogel Precursors
Eight-arm PEG amine (MW 40,000 Da, hexaglycerol core; JenKem, Beijing, China) was functionalized with norbornene (NB) end groups as previously described. 19 End group functionalization was verified by 1 H NMR to be >90%. The photoinitiator lithium phenyl 2,4,6 trimethylbenzoylphosphinate (LAP) was synthesized as described elsewhere. 20 The crosslinker MMP-degradable peptide (KCGPQG↓IWGQCK) and the cell adhesion peptide (CRGDS) were purchased from American Peptide Company, Inc. (Sunnyvale, CA) and GenScript® USA, Inc. (Piscataway, NJ), respectively.
Cell Culture
Adipose-derived human mesenchymal stem cells (hMSCs; Lonza, Allendale, NJ) were cultured in low-glucose Dulbecco's modified Eagle's medium (DMEM; Life Technologies™, Carlsbad, CA) supplemented with 10% fetal bovine serum (FBS; Seradigm, Radnor, PA) and 1 ng/mL human fibroblast growth factor (PeproTech®, Rocky Hill, NJ) and used within four passages after thawing. Primary cervical fibroblasts (CFs) were provided by Dr. Douglas Kniss (Columbus, OH) from nonmalignant hysterectomy samples from premenopausal women. The Biomedical Institutional Review Board at The Ohio State University approved tissue collections and following informed consents were obtained.
21
CFs were cultured in phenol red-free high-glucose DMEM (Life Technologies) with 10% FBS and used within two passages after thawing. Fibrosarcoma cells (HT1080) (American Type Culture Collection [ATCC®], Manassas, VA; RRID: CVCL_0317) were cultured in 1640 RPMI media (Life Technologies) supplemented with 10% FBS and used within 20 passages after thawing. All media were supplemented with 2 mM
Charcoal Stripping and Heat Inactivation of FBS
FBS was first heat inactivated at 55°C for 30 min. In a separate beaker, 0.25% weight/volume (w/v) (total serum volume to be processed) activated charcoal (Sigma Aldrich, Burlington, MA) and 0.025% w/v dextran (Sigma-Aldrich) were added. One to two milliliters of FBS was added to the activated charcoal/dextran and stirred until a homogeneous mixture formed. The rest of the serum volume was then added and stirred for 30 min at 55°C. The serum was centrifuged at 3,000 rpm for 20 min at 4°C, and the supernatant was transferred to another vessel. The charcoal-dextran addition and incubation steps were repeated, but at 37°C. The serum was centrifuged at 3,000 rpm for 20 min at 4°C and the supernatant was sterilized by passing through 0.45 μm and then 0.2 μm filters.
HT Assay Procedure
A hydrogel precursor solution consisting of 20 mM eight-arm 40 kDa PEG-NB, 17.8 mM NaOH, 12.75 mM crosslinker MMP-degradable peptide, 1 mM CRGDS, 2 mM LAP, and 0.25 mM fluorescent MMP-degradable peptide in phosphate-buffered saline (PBS; Life Technologies) was briefly vortexed. Because the MMP-degradable crosslinker peptide is solubilized in an HCl solution, in experiments where the amount of crosslinker was varied, the amount of NaOH was adjusted to achieve a final pH of 7. Low, medium, and highly crosslinked gels corresponded to thiol:ene ratios of 0.5, 0.7, and 0.9, and used 8.75, 12.75, and 16.75 mM crosslinker peptides and 12.2, 17.8, and 23.4 mM NaOH, respectively.
For cell encapsulation experiments, a thiol:ene ratio of 0.7 was used and a concentrated cell suspension in PBS was added to the hydrogel precursor solution to achieve a final cell seeding density of 3 × 10 6 cells/mL, unless otherwise noted. For hydrogels without cells, an equivalent volume of PBS was used in lieu of suspended cells. Ten microliters of the hydrogel precursor solution was pipetted into black, round-bottomed, 96-well plates (BrandTech® Scientific, Inc., Essex, CT) using a single- or multichannel pipette. Hydrogel polymerization was photoinitiated by exposure to 365 nm ultraviolet (UV) light (UVP, model UVL-56, Cambridge, United Kingdom) at 4 mW/cm 2 for 3 min. After polymerization, 150 μL of assay media was added to each sample well. PBS was added to the outermost and empty wells, and the moat between wells to reduce sample evaporation.
For drug screening assays, encapsulated cells were treated with sorafenib (SOR; Selleck Chemicals, Houston, TX), paclitaxel (PAC; Invitrogen™, Grand Island, NY), or gemcitabine (GEM; Selleck Chemicals) in a range of concentrations (0.01–50 μM), or dimethyl sulfoxide (DMSO) as a vehicle control. For all assays, plates were incubated (at 37°C and 5% CO2) for 24 h. Resazurin, 1:10 v/v (alamarBlue™; Life Technologies), was added to the wells containing encapsulated cells 6 h before the final fluorescence well scan reading. A protocol and a video illustrating the HT assay procedure can be found in this publication. 22
Fluorescence Measurements
Fluorescence measurements were conducted using the SPECTRA Max M2 microplate reader (Molecular Devices, San Jose, CA) at 494 nm/521 nm (excitation/emission) for the fluorogenic peptide and 560 nm/590 nm for the metabolic reagent, alamarBlue. An area scan was performed using the opaque 96-well plate setting with a 3 × 3 matrix, and the average of each matrix was calculated. 22
Enzymatic Hydrogel Degradation
Fluorescent functionalized hydrogels were made utilizing 20 mM eight-arm 40 kDa PEG-NB, 17.8 mM NaOH, 12.75 mM crosslinker MMP-degradable peptide, 1 mM CRGDS, 2 mM LAP, and 0.25 mM fluorescent MMP-degradable peptide in PBS. A stock concentration of 10 mg/mL collagenase type I enzyme (Life Technologies) was made by reconstituting in PBS, and further dilutions were made as indicated. MMP-1, -2, and -9 (EMD Millipore) were activated following the manufacturer's protocols and used at a final concentration of 1 μg/mL. One hundred fifty microliters of assay buffer with or without MMP-1, -2, or -9 was added to each well. Assay buffer consisted of 50 mM Tris-HCl (Sigma-Aldrich), 10 mM CaCl2 (Fisher Scientific™, Pittsburgh, PA), 150 mM NaCl (Fisher Scientific), 0.5% v/v sodium azide (Fisher Scientific), and 0.05% v/v Triton-X100 (Sigma-Aldrich). For MMP inhibition, 20 μM of the broad-spectrum MMP inhibitor GM6001 (Abcam, Cambridge, MA) or an equivalent volume of DMSO vehicle control was added.
Statistical Analysis
Each HT assay was completed three independent times with three replicates per condition. All other experiments were repeated at least three independent times. Data were analyzed by GraphPad Prism 7 software (GraphPad Software, Inc., San Diego, CA) using one-way ANOVA with Tukey multiple comparisons post-test, with a significance level set at p < 0.05.
Results and Discussion
HT Assay Development
Three-dimensional microenvironments can be synthetically generated to more closely mimic the in vivo tumor microenvironment, making them a valuable tool in drug screening assays. 1,10,17 However, 3D culture often makes analysis of cellular responses to drug treatment more difficult; hence, most 3D drug screening assays have been limited to measurements of cell viability. However, many other cell functions contribute to disease. For example, MMP activity is upregulated during tumor progression and this increased MMP activity can promote cancer cell invasion and migration. 23,24 Therefore, there is a need for new technologies that enable HT measurements of a wider range of cell functions.
To begin to address this need, we have adapted and characterized a hydrogel culture system that enables the culturing of single cells in a 3D microenvironment and detection of MMP activity simultaneously. Previously, we developed a low-throughput 3D fluorescent hydrogel system for measuring global MMP activity. 11 Briefly, this system measures MMP proteolysis through the use of quenched fluorescent MMP-degradable peptides covalently incorporated into a PEG hydrogel network during polymerization. Cleavage of the peptide sensor by cell-secreted MMPs resulted in increased fluorescence that was directly detected using a standard microplate reader. To adapt this system for HT screening, the MMP sensor hydrogel system was miniaturized to a 96-well format. First, a hydrogel precursor solution, consisting of a PEG eight-arm macromer, an MMP-degradable peptide crosslinker, a cell adhesion peptide (CRGDS), photoinitiator, and the fluorescent MMP-degradable peptide, was combined with a concentrated cell suspension in PBS. The cell/hydrogel precursor solution was then pipetted into each well, and hydrogel polymerization was photoinitiated by exposure to long wavelength UV light (365 nm, 4 mW/cm 2 for 3 min). Photoinitiated polymerization is a well-established technique for cell encapsulation that does not significantly affect cell viability. 11,18,25,26 Cell culture media were added, and the encapsulated cells were incubated (37°C, 5% CO2) for 24 h.
As an internal control for differences in cell number, cell metabolic activity was measured using resazurin, a nonfluorescent dye that is converted into a fluorescent molecule by a reduction reaction in metabolically active cells. The excitation and emission spectrum of resazurin is sufficiently separated from the fluorogenic MMP sensor spectrum, enabling measurement of both MMP activity and metabolic activity in the same well. Resazurin was added to the wells 6 h before the final plate read at 24 h. Fluorescence intensity was measured using a microplate reader with an area well scan. A schematic of the process is illustrated in Figure 1, and a protocol is summarized in Table 1. The 96-well format eliminated several steps from the previous 24-well protocol, reducing the time needed per well by ∼50%. Furthermore, the total hydrogel volume needed per well was reduced by 80% (50–10 μL) compared with the previous 24-well format. This miniaturization also increased the number of possible conditions tested per plate from 12 conditions in duplicate utilizing the 24-well plate to 20 conditions in triplicate utilizing the 96-well plate.
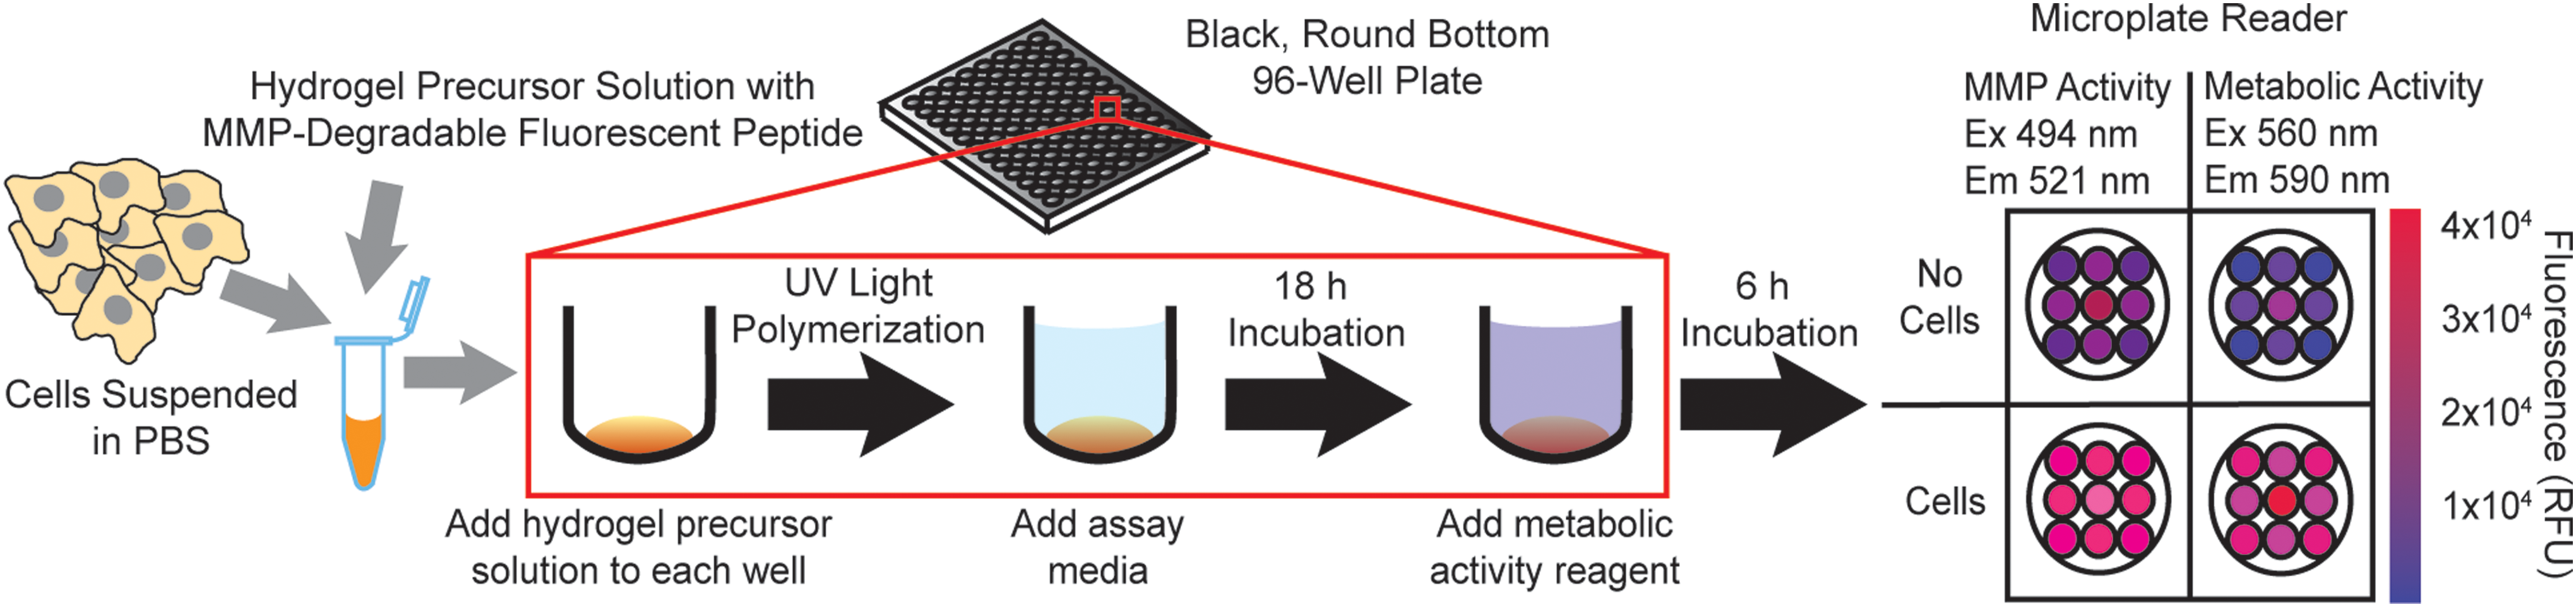
A schematic of the high-throughput assay process. First, hydrogel precursor solution components are mixed with cells suspended in PBS or an equal volume of PBS with no cells as a control. Then, precursor solution is pipetted into black, round-bottomed, 96-well plates and polymerized with exposure to UV light for 3 min. Next, assay media with the desired treatment or enzyme of interest are added, and plates are incubated for 18 h (37°C, 5% CO2). The metabolic activity reagent resazurin is then added, and plates are incubated for an additional 6 h. MMP and metabolic activities are measured using a fluorescent microplate reader with a well scan protocol at the indicated excitation/emission wavelengths. MMP, matrix metalloproteinase; PBS, phosphate-buffered saline; UV, ultraviolet. Color images are available online.
High-Throughput Assay Protocol
LAP, lithium phenyl 2,4,6 trimethylbenzoylphosphinate; MMP, matrix metalloproteinase; NB, norbornene; PBS, phosphate-buffered saline; UV, ultraviolet.
For consistent fluorescence measurements using a plate reader, it is essential that the hydrogels are centered within the culture well. The importance of centering and having a reproducible geometrical hydrogel shape has also been observed by others. 18 However, centering the gels proved to be difficult and highly variable using standard flat-bottomed 96-well plates, due to the liquid precursor solution being drawn up the side of the well by surface tension and the resulting hydrogels not evenly covering the bottom of the well. In the system developed by Leight et al., 11 the hydrogel shape and centered position were determined by the use of silicone gaskets acting as a mold, whereas the 96-well system relies on surface tension for maintaining hydrogel shape until the polymerization process is complete. In flat-bottomed plates, the hydrogel precursor solution incompletely covered the bottom of the well and formed a meniscus with the side wall in 46% ± 7.3% (mean ± SD, n = 3) of the wells. This caused irregularly shaped hydrogels that were not centered within the well, which increased the variability of the fluorescent measurements. Fluorescent measurements of functionalized hydrogels in flat-bottomed plates incubated for 24 h with collagenase type I enzyme concentrations (0–1,000 μg/mL) had high coefficients of variation (%CV) (the ratio of the standard deviation [SD] to the mean) between triplicates (Fig. 2A). To overcome this variability, round-bottomed 96-well plates were used, where the curvature of the well centered the hydrogel by facilitating the placement of the dispensing tip in the center of the well.
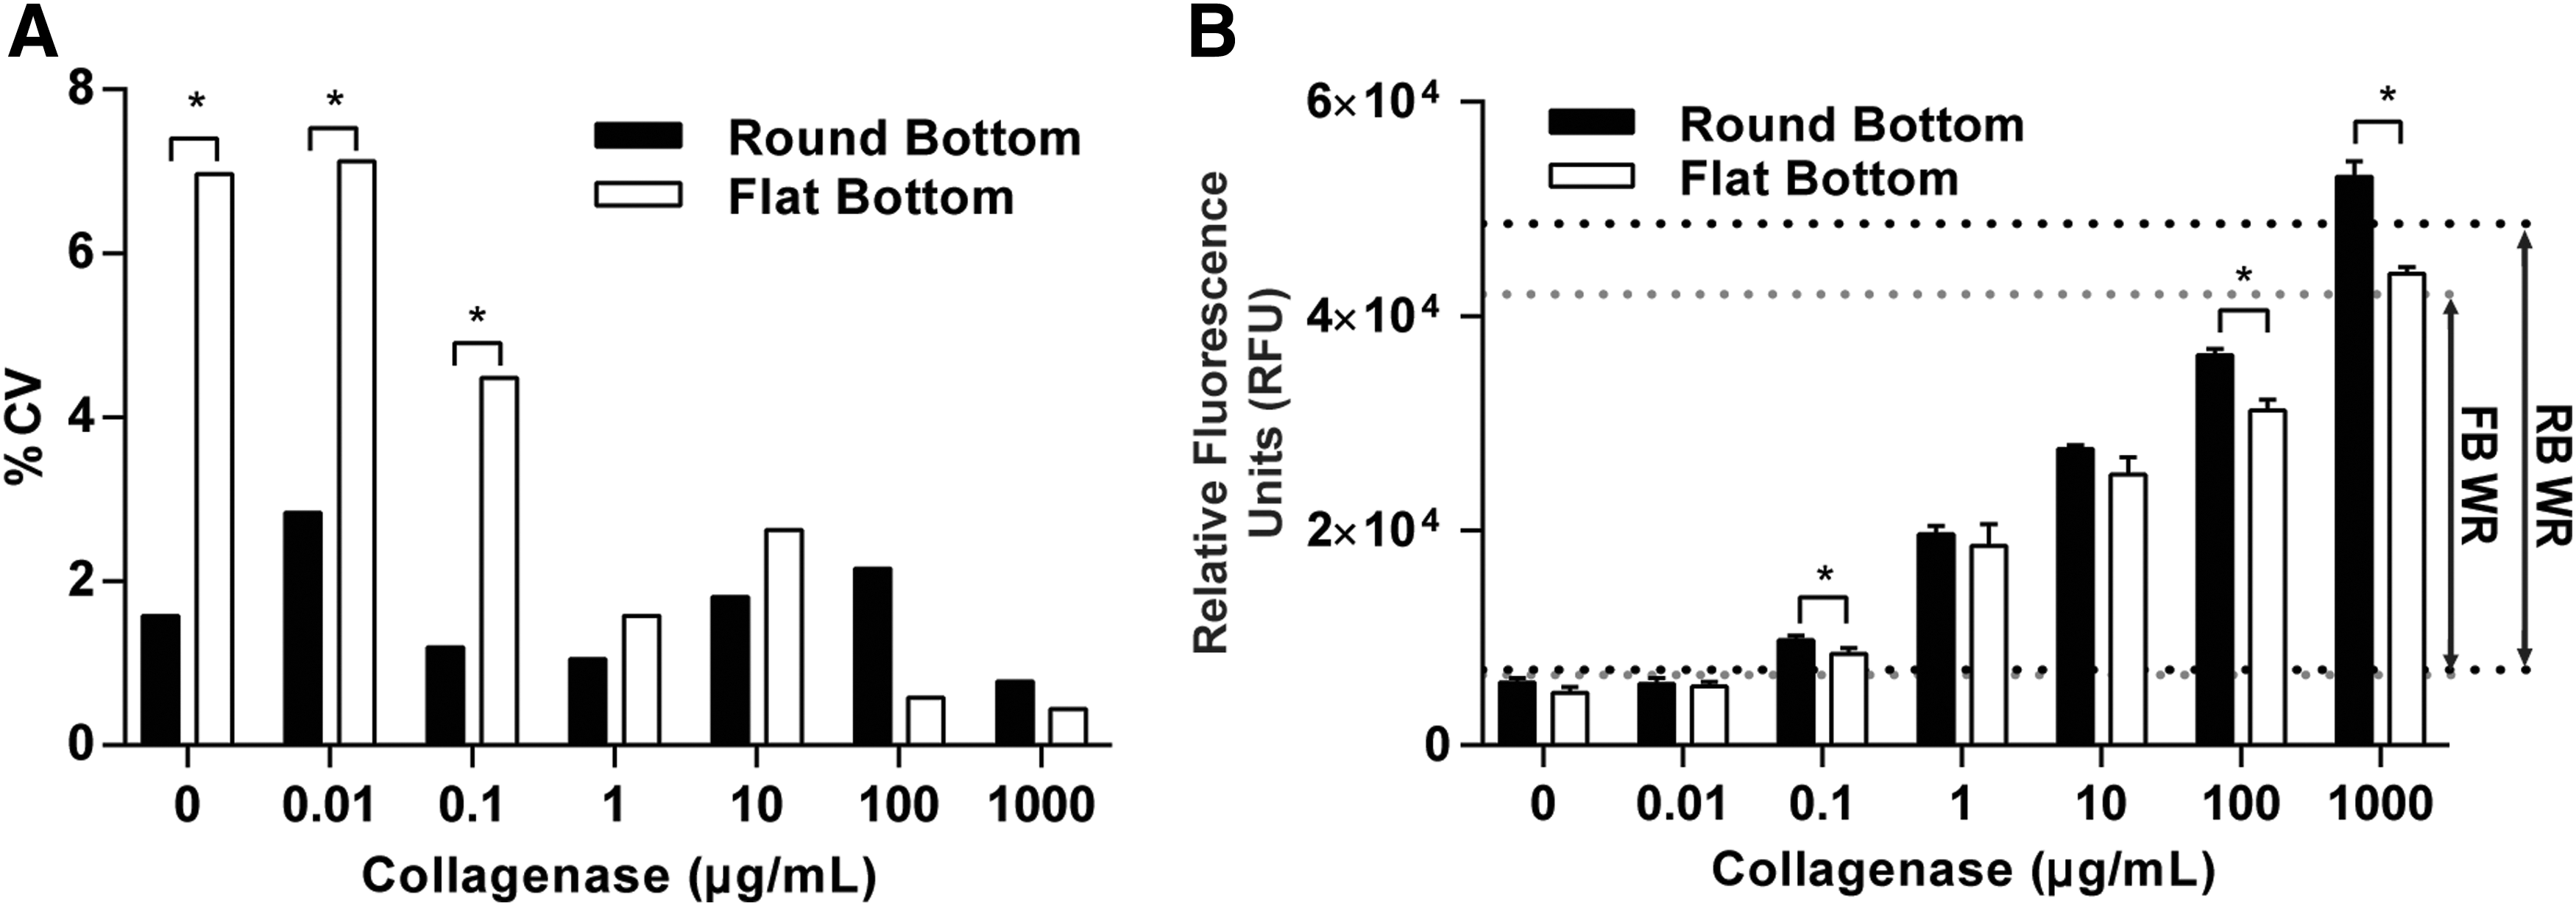
Effect of plate geometry on fluorescent measurements.
Hydrogels in round-bottomed plates were observed to have a uniform shape. This uniformity was reflected by a reduction in the %CV for fluorescent measurements of hydrogels exposed to collagenase concentrations at or below 10 μg/mL, compared with the flat-bottomed plates, and more consistent readings across all concentrations (Fig. 2A). Low variability between triplicates is a critical factor in the development of HT assays and can affect the working range and sensitivity of the assay. The working range is defined as 3 SDs above the minimum detected signal (background), while the maximum limit of the working range is 3 SDs below the maximum detected signal. Because conditions in round-bottomed plates had a lower %CV, the working range in the round-bottomed plates was 15% larger than the flat-bottomed plates (Fig. 2B). Therefore, black round-bottomed 96-well plates were utilized for all subsequent assays due to the ease of pipetting consistently centered gels, the increased working range of detection, and reduced overall variability between triplicates. It is worth noting that the curvature of the wells in round-bottomed plates would also aid in future use of automated liquid handlers. Round-bottomed plates would decrease the amount of time spent calibrating placement of the dispensing tip in the center of wells and offer an alternative solution for automated liquid handlers that are not equipped with self-calibrating features.
HT Assay Characterization
To characterize the assay and determine its suitability for HT applications, the detection limits and signal range were determined. Hydrogels were incubated in a range of collagenase type I enzyme concentrations (0–2,000 μg/mL) at 37°C for 24 h to establish the dynamic range (maximum and minimum detected intensities) of the fluorescent sensor-functionalized hydrogels. The upper limit of detection was observed with collagenase concentrations at or above 1,000 μg/mL, while background noise levels were established by negative control hydrogels with no collagenase (Fig. 3A). From this dynamic range, the working range was calculated to be between ≈0.02 and ≈575 μg/mL of collagenase (Fig. 3A). This large working range over four orders of magnitude gives this HT assay the flexibility to detect a wide range of MMP concentrations, which is important since different cell types can produce varying concentrations of MMPs.

Assay characterization: detection limits, stiffness, and DMSO tolerances.
Mechanical properties of the cellular microenvironment have been shown to regulate a number of cell functions, including cell morphology, migration, and MMP activity. 11,18,27 The mechanical properties of synthetic hydrogels, including PEG, can be precisely tuned by varying the crosslinking density (i.e., the ratio of thiol groups in the crosslinking peptide to the NB groups on the PEG macromer [thiols:enes]), 18 or the structure of the polymer building blocks (i.e., the number or length of macromer arms) to recapitulate in vivo tissue properties without affecting ligand density. However, changing the underlying structure of the hydrogel may affect the porosity and diffusion of molecules within the hydrogel. Therefore, to determine if changes in mechanical properties of the hydrogel affect the measurement of enzyme activity, the crosslinking density was varied with three thiol:ene ratios (0.5, 0.7, and 0.9) corresponding to low, medium, and high stiffness, respectively and the hydrogels were exposed to a range of collagenase type I enzyme concentrations (0–2,000 μg/mL) (Fig. 3B). No significant difference between the three ratios for each collagenase concentration from 0.01 to 2,000 μg/mL, indicating that varying the mechanical properties of the hydrogel did not affect the performance of the assay.
An important attribute of HT assays is their tolerance to DMSO, a common organic solvent used for reconstituting therapeutic compounds. High concentrations of DMSO have been observed to affect signal detection methods and enzyme kinetics. 28 To investigate the effect of DMSO in this assay, we incubated the hydrogels with a range of concentrations of DMSO (0%–2% v/v) with or without collagenase, or with encapsulated cells (HT1080). This range of DMSO concentrations was selected due to most cellular applications limiting DMSO to 1% of the total volume to avoid cellular toxicity, which has been observed with higher concentrations. There was no significant difference between signals with or without collagenase for any of the DMSO concentrations (Fig. 3C). Similarly, there was no significant difference between signals of encapsulated cells for MMP activity (Fig. 3C). Moreover, metabolic activity was not significantly different than control at DMSO concentrations of 1.5% (v/v) or less (Fig. 3D). Therefore, this assay can be utilized to measure the effects of a wide variety of chemotherapeutic agents on cellular MMP and metabolic activity without DMSO affecting signal detection.
To determine the assay robustness and reproducibility, standard plate uniformity tests were performed to determine the variability across multiple plates and multiple days. Uniformity tests were also used to determine the separation of each signal level (Z′-factor) and the suitability of the assay for HT applications. The uniformity test determines spatial intraplate and interplate uniformity and variability within the same day and across different days of experimentation. The uniformity tests were performed with collagenase enzyme or with HT1080 cells by producing high, medium (med) (approximately half the intensity of high), and low (background) fluorescence signals arranged in an interleaved format, as described elsewhere. 29,30
For the uniformity test with the collagenase enzyme, functionalized hydrogels were incubated with 1,000, 10, and 0 μg/mL collagenase type I enzyme, for 24 h (37°C, 5% CO2) (Fig. 5A). For the encapsulated cell uniformity test, cells were treated with the broad-spectrum MMP inhibitor GM6001 to identify conditions that produce high, med, and low signals. HT1080 cells were encapsulated in the functionalized hydrogels at 3 × 10 6 cells/mL, and incubated for 24 h with GM6001 over a range of concentrations from 0.01 to 500 μM (Fig. 4A). The highest signal was observed in the control cells treated with DMSO vehicle control. From the dose/response curve (Fig. 4A), the concentration of GM6001 that resulted in 50% inhibition (IC50) of MMP activity was determined to be 0.29 μM. MMP activity was completely inhibited, with a fluorescence signal similar to background, with concentrations greater than 5 μM of GM6001. At concentrations greater than 100 μM of GM6001, metabolic activity was significantly reduced (Fig. 4B). Therefore, a concentration of 10 μM was used to produce the low signal in the uniformity tests. The Hillslope was calculated to be 1.1, and this value was used to calculate the interplate and interday fold shifts for the uniformity tests (Table 2).
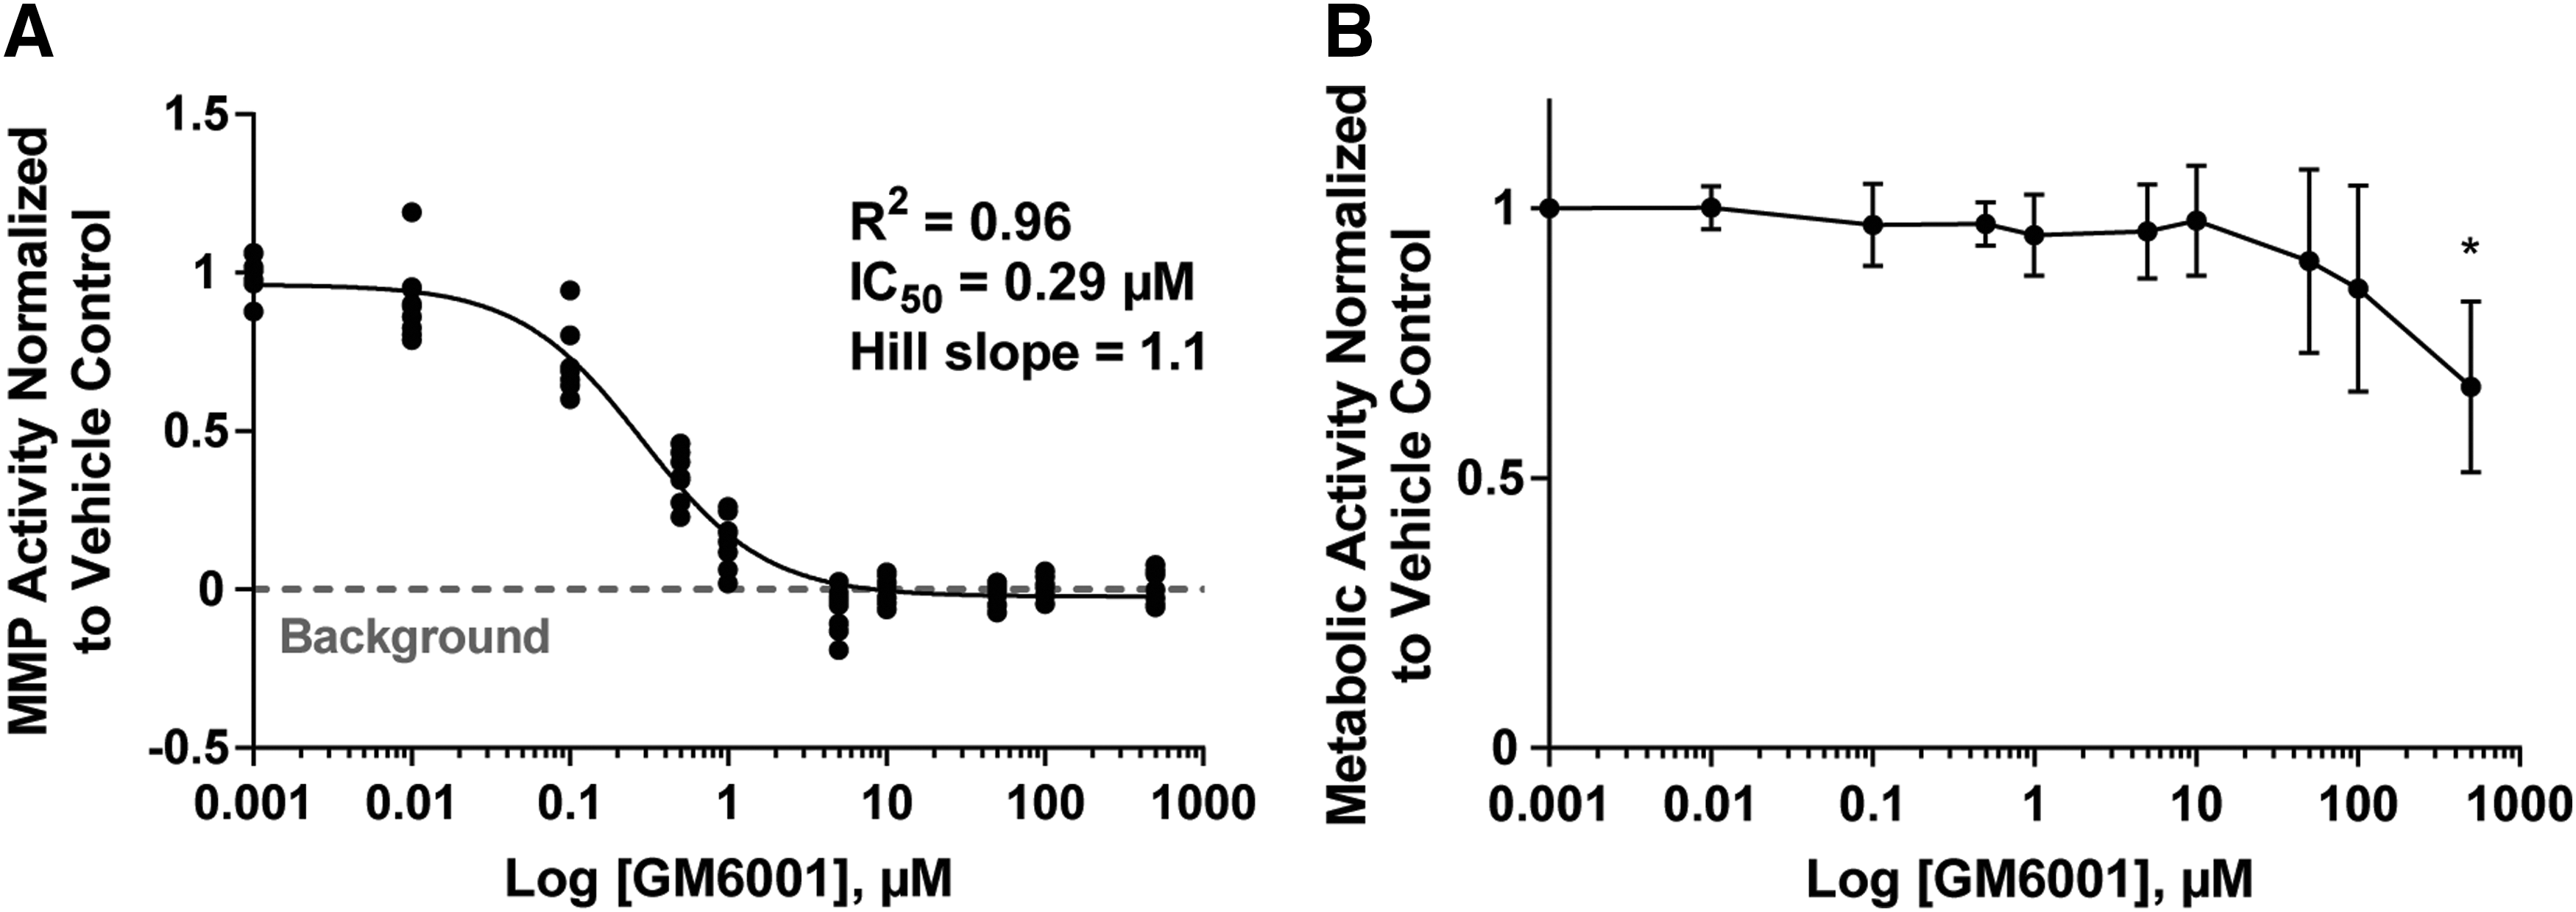
MMP and metabolic activity of fibrosarcoma cells in response to MMP inhibitor (GM6001).

Plate uniformity with collagenase enzyme and HT1080 cells.
High Throughput Assay Robustness, Reproducibility and Performance
Three black round bottom 96-well plates were used each day for three consecutive days in an interleaved signal manner. For low, med, and high signals in the enzymatic uniformity test, our functionalized hydrogels were incubated for 24 h (37°C, 5% CO2) in 0, 10 and 1000 μg/mL collagenase type I enzyme, respectively. n = 32 for each signal level in each plate for a total of nine plates. For low, med, and high signals in the cellular uniformity test, HT1080 cells (3 x 10 6 cells/mL) were encapsulated in the functionalized hydrogels and incubated for 24 h (37°C, 5% CO2) in 10 μM, 0.4 μM and DMSO control of broad spectrum MMP inhibitor GM6001, respectively. n = 32 for each signal level in each plate for a total of nine plates.
n is number of replicates per concentration to be used in the application assay (triplicates here).
CV, coefficient of variation; SD, standard deviation; Med, medium; Min, minimum; Max, maximum.
To test the uniformity of assay for measuring cell-secreted enzymes, HT1080 cells were encapsulated in the functionalized hydrogels at 3 × 10 6 cells/mL, and incubated for 24 h (37°C, 5% CO2) with a broad-spectrum MMP inhibitor (GM6001) at 0.4 and 10 μM, or DMSO control (Fig. 5B). The uniformity tests were performed on three different days (day A, B, and C) utilizing three separate plates each day (Fig. 5A, B). Each plate was incubated for 24 h with a total of 32 wells for each signal level, as described previously. 29,30 Variability in average signal level, even in the DMSO-treated control, was observed to be higher between days with the encapsulated cells compared with the enzyme uniformity test (Supplementary Fig. S1). Cell-based assays often have higher variability 31 similar to the results observed here, and can be more sensitive to batch-to-batch variability. 29 Therefore, the results of the uniformity test were normalized to the average high signal level per day to give a relative decrease in MMP activity due to the MMP inhibitor, which resulted in a similar decrease in signal across days (Fig. 5B).
To assess the HT assay performance, both the Z′-factor and %CV of all the plates were calculated (Fig. 5C, D). Unlike signal-to-background or signal-to-noise ratios, Z′-factor calculations account for the variability in controls and samples and are therefore a more accurate indicator of the measurement quality of an assay. 32 The Z′-factor is a ratio between the working range and dynamic range to determine the overlap between signal bands of the positive and negative controls. Z′-factor values closer to 1 indicate large separation between signal bands and values closer to zero indicate little separation between signal bands. Values below zero indicate the assay is unsuitable for screening applications due to overlapping signal bands. 32
Based on previous values reported in the literature, we chose a Z′-factor value of 0.5 or greater as the acceptance threshold for the enzymatic assay and 0.4 or greater for the cellular assay. 28 –30,32 The Z′-factor was calculated from the high signal control, produced by collagenase enzyme and HT1080 cells. The Z′-factor values for the high signals for the nine plates incubated with collagenase enzyme were above 0.9 and the %CV of all three signal levels were below 10% (Fig. 5C). The Z′-factor values for the high signals for the nine plates with encapsulated cells were above 0.5 and the %CV of all three signal levels were below 12% (Fig. 5D). The Z′ factor and %CV indicate that the variability of this assay is suitable and within the acceptable range for HT applications. 29,30,32
Uniformity test results include edge effect, drift, Z′-factor, %CVhigh, %CVmed, %CVlow, and interplate and interday fold shifts of the med signals, and are summarized in Table 2 for both enzymatic and cellular assays. The spatial intraplate uniformity, evaluated by calculating the edge effect and drift within the same plate, achieved values that ranged from 16% to 22% and from 3% to 8%, respectively, for the enzymatic assay and from 7% to 28% and from 3% to 7%, respectively, for the cellular assay. 29,30 Within the uniformity test, the edge effects were more than 20% for some plates, with a mean ± SD of 19.5% ± 1.74% for the enzymatic assay and 17.8% ± 7.77% for the cellular assay. Therefore, wells on the edges of the plate (36 wells total) were not used for further studies. Eliminating the edge wells reduces the edge effect to 14.95 ± 5.12 for the enzymatic assay and to 13.47 ± 4.70 for the cellular assay. Other methods, such as sealing membranes, could also be used to reduce the edge effect further. 33
Z′-factor values for the high signals were above 0.5, with a Z′-factor range from 0.91 to 0.94 for the enzymatic assay and from 0.57 to 0.81 for the cellular assay, indicating that the assays' measurement quality is within excellent range. The range of %CV for the high, med, and low (background) signals was from 1.1% to 2.0%, from 4.3% to 4.9%, and from 6.9% to 8.3%, respectively, for the enzymatic assay, and from 2.6% to 4.4%, from 2.0% to 5.9%, and from 7.5% to 11.9%, respectively, for the cellular assay, all of which are below the acceptance threshold of 15% and 20%, respectively. 29,30 For the enzymatic assay, the interplate and interday fold shifts were all below the acceptance threshold of 2 (ranging from 1.0 to 1.6 and from 1.1 to 1.7, respectively). For the cellular assay, the interplate and interday fold shifts ranged from 1.0 to 1.1 and from 1.1 to 1.5, respectively. The metrics described above indicate that this HT 3D MMP activity assay is reproducible and robust, making it well suited for screening applications.
Assay Validation with Human MMPs and Encapsulated Cells
Bacterial collagenase was used in the characterization studies as a model enzyme due to its ease of use, requiring no activation step, and low cost. Collagenase is also often used for digestion assays since it is known to degrade ECM components such as type I collagen, from which the fluorescent MMP-degradable peptide and the crosslinker MMP-degradable peptide sequences (GPQG↓IWGQ) were derived, as given in Refs. 34 –36
To validate the ability of assay to detect MMP activity, we utilized commercially available purified human MMPs. The fluorescent MMP-degradable peptide sequence has been characterized for specificity elsewhere and was found to be cleaved by MMP-1, -2, -3, -7, -8, and -9. 36 –38 Here, MMP-1, -2, and -9 were used for validation in the HT MMP assay. After enzyme activation, the functionalized hydrogels were incubated for 24 h (37°C, 5% CO2) with each MMP and a broad-spectrum MMP inhibitor (GM6001) or DMSO vehicle control. Fluorescence intensity of conditions incubated with MMPs was significantly higher than the controls containing no MMPs, and all conditions treated with GM6001 were significantly lower than those not treated with the inhibitor. Furthermore, treatment with GM6001 completely abrogated the increase in fluorescence induced by treatment with each MMP (Fig. 6). The cleavage of the utilized fluorescent MMP-degradable peptide sequence here with MMP-1, -2, and -9 is consistent with what has been reported in literature, 36 –38 and validates the detection of a variety of MMPs by the degradation of the fluorescent MMP-degradable peptide. The measured fluorescent intensity of the peptide incubated with human MMPs was greater than the background noise and within the working range of the assay (Fig. 6). These results demonstrate that human MMPs produce signals that are detectable in the HT MMP assay.
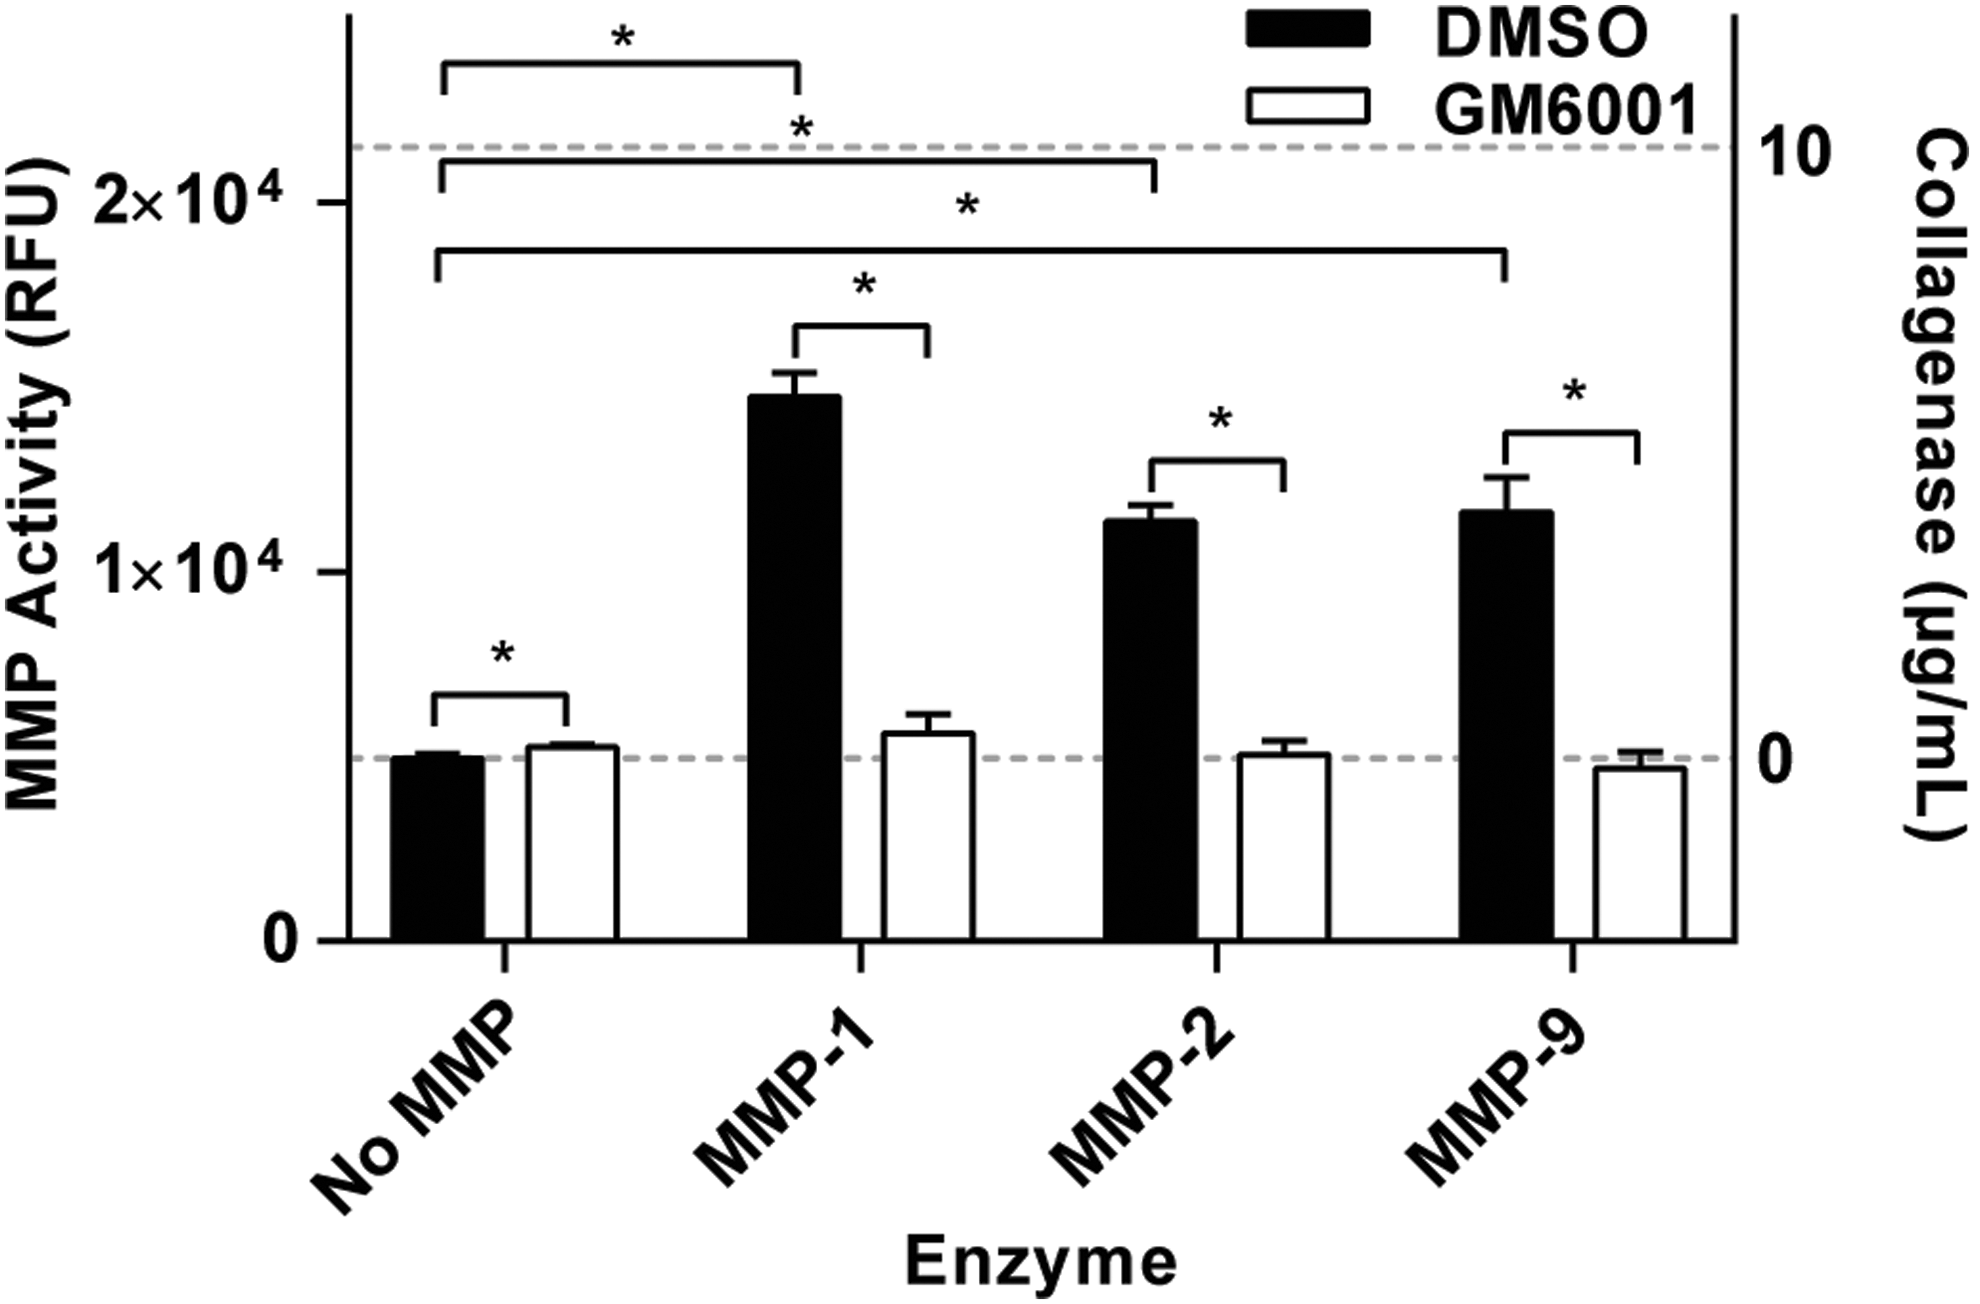
Functionalized hydrogel degradation with human MMPs. Fluorescent intensity of the functionalized hydrogels incubated with human MMP-1, -2, and -9 for 24 h, with the broad-spectrum MMP inhibitor GM6001 or DMSO vehicle control. Background and medium fluorescence intensities are represented with 0 and 10 μg/mL of collagenase, respectively, and are plotted on the right Y axis of the graph, represented by dashed lines. n = 3 ± SD, *p < 0.05.
The assay was then characterized for measurement of MMP activity produced by encapsulated cells. Primary cells are often more sensitive to in vitro culture conditions than immortalized cell lines, and therefore, two primary cell types, hMSCs and human cervical fibroblasts (CFs), and one immortalized cell line, HT1080, were chosen to highlight the range of cell types compatible with this assay. hMSCs are nontumorigenic primary stem cells that play an important role in tissue regeneration and can be derived from a variety of tissues, including bone marrow and adipose tissue. hMSCs are highly motile through ECM and basement membranes and are known to express a number of MMPs, including MMP-2. 39 hMSCs have also been observed to degrade PEG hydrogels crosslinked with the same peptide sequence used here, and to cleave a similar fluorescent MMP-degradable peptide to the one utilized in this work. 11,26,40 CFs are nontumorigenic primary cells derived from human patients undergoing a hysterectomy. Cervical tissue is highly fibrous and undergoes extensive remodeling processes associated with pregnancy and birth, involving MMP-2 and -9 production. 41 Finally, HT1080 cells, an immortalized, highly metastatic fibrosarcoma cell line, has been observed to produce a high level of MMP activity. 23,42
To determine the seeding densities that are within the linear range of the assay and produce a signal greater than background noise, hMSCs, CFs, and HT1080 cells were encapsulated over a range of densities (0.25–7 × 10 6 cells/mL), and MMP activity and metabolic activity were measured (Fig. 7A). The background noise was measured from control hydrogels without cells and is represented with a dashed line (Fig. 7A). For hMSCs, CFs, and HT1080 cells, the minimum seeding density, which produced a detectable signal greater than the background noise of the assay, was 0.5 × 10 6 cells/mL. The MMP activity increased linearly with increasing the cell seeding density above 0.5 × 10 6 cells/mL. The endpoint of the assay is also important to determine if the selected seeding density is within the linear range of the assay. For example, encapsulating HT1080 cells at a seeding density of 2 × 10 6 cells/mL, the MMP activity signal was observed to increase linearly until 48 h (the last time point measured) (Fig. 8). However, the MMP activity signal began to plateau at 24 h for HT1080 cells seeded at 6 × 10 6 cells/mL.

Effect of seeding density on MMP activity measurements for several cell types.

Time course of HT1080 cells. Measurement of MMP activity for HT1080 cells encapsulated in two seeding densities (2 and 6 × 10 6 cells/mL) and incubated for 48 h. n = 3 ± SD.
Metabolic activity was also proportional to the number of encapsulated cells within the range of cell seeding densities tested (Fig. 7B). Previously, metabolic activity has been used as an internal control to determine MMP activity on a “per cell” basis. 11 Normalizing MMP activity to metabolic activity resulted in no change across seeding density at densities greater than 0.5 × 10 6 cells/mL (Fig. 7C). This is important to define the appropriate seeding densities for the assay, which are the densities that are above the minimal detectable density (0.5 × 10 6 cells/mL) yet are also within the linear portion of the normalization curve (Fig. 7C). For the cell types tested here, seeding densities between 2 and 6 × 10 6 cells/mL would be appropriate. Each condition was plated in triplicate and repeated for n = 3 experiments. As illustrated here (Fig. 7C), the appropriate cell density required to be within the linear range of the assay can vary by cell type, and therefore, to have a signal within the linear range of the assay, cell type, cell seeding density, and time point of the final measurement need to be determined experimentally.
Effect of Drug Treatment on MMP Activity of the Fibrosarcoma Cell Line HT1080
To determine the feasibility of the newly developed assay for drug screening applications and to observe the effects of chemotherapeutics on MMP activity, we treated HT1080 cells with several drugs over a range of concentrations. While HT1080 cells have been previously shown to express high levels of MMPs, it is not known how drug treatment affects MMP activity in fibrosarcoma cells.
Here, several clinically used drugs with different mechanisms of action were chosen to investigate their effect on MMP activity. SOR, which has been used in clinical trials to treat fibrosarcoma, 43 is a small-molecule multikinase inhibitor that arrests cancer cell growth, invasion, and migration. 44 SOR targets RAS/RAF kinases 45 and therefore may have an effect on the HT1080 cell line, which is known to have an N-RAS mutation. 46,47 SOR has also been found to decrease the expression of MMPs in hepatocellular carcinoma cells. 44,48 PAC inhibits mitosis through depolymerization of microtubules and has been shown to decrease HT1080 tumor growth in mice. 49 –51 In human melanoma cells, PAC has previously been found to decrease the secretion of MMP-2 and -9. 52 GEM is a fluorinated nucleoside analogue that replaces deoxycytidine to arrest DNA replication and induce apoptosis. 53 However, in contrast to the increased MMP activity observed with SOR and PAC, no significant changes in MMP-2 expression levels were observed in pancreatic cell lines treated with GEM. 54 PAC and GEM have been used in the clinic to treat soft tissue sarcomas. 55
HT1080 cells were encapsulated in functionalized hydrogels at a density of 3 × 10 6 cells/mL and treated with SOR, PAC, GEM or DMSO vehicle control, over a range of concentrations (0.01–50 μM) for 24 h, for a total of 25 conditions and 75 wells. To replicate the same number of wells in the previous 24-well plate format, it would have required three plates and two additional hours for the experimental setup. Overall MMP activity was not significantly different than the vehicle controls throughout the range of concentrations used for each drug (Fig. 9A).
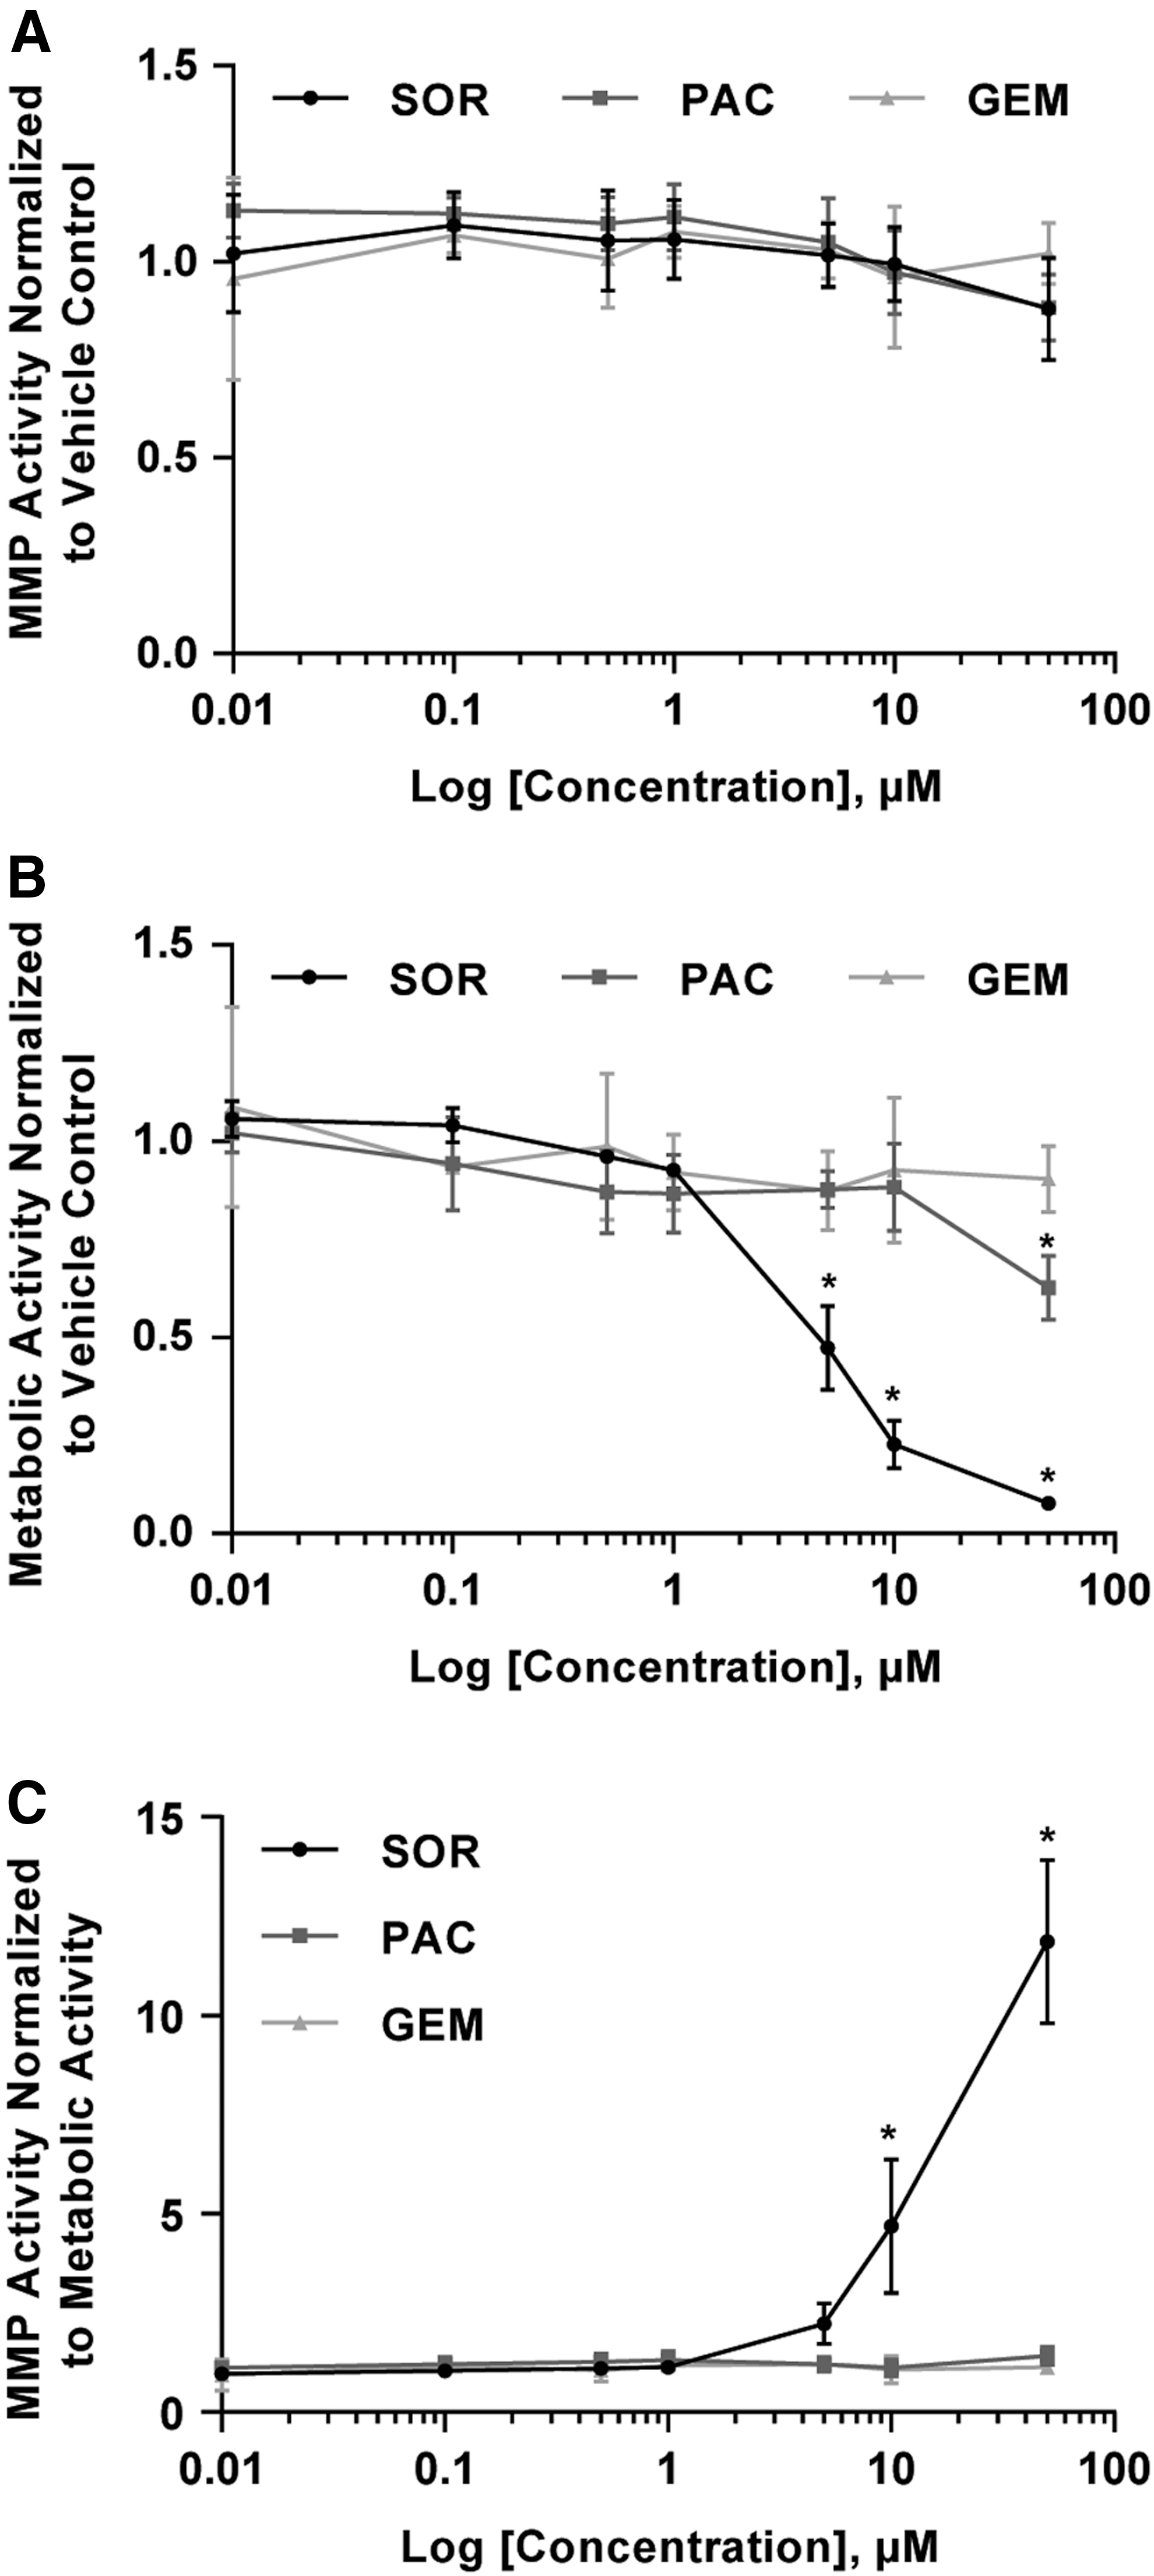
Effect of drug treatment on MMP activity of the fibrosarcoma cell line. HT1080 cells were encapsulated and treated with a range of concentrations (0.01–50 μM) of each drug and incubated for 24 h. Resazurin was added 6 h before the 24-h read.
Drug treatment can also affect cell viability and cell number, therefore a metabolic activity assay was performed simultaneously in the same wells with the MMP activity assay. Metabolic activity, while not a direct measurement of cell number or cell viability, is commonly measured in drug screening assays as an overall indicator of cellular health as these assays are easy to use and inexpensive. Tetrazolium salt assays MTT and MTS are the most common metabolic activity assays used to detect cellular viability, cytotoxicity, and proliferation in HT drug screenings. 56,57 Here, resazurin, which fluoresces when oxidized by cellular mitochondria, was chosen to measure metabolic activity because the excitation (560 nm) and emission wavelengths (590 nm) are sufficiently separated from the fluorescein signal of the MMP sensor to enable measurement of both MMP activity and metabolic activity within the same well using a standard plate reader. 11,16 In addition, previous work with pancreatic cancer cells and a panel of chemotherapeutics has demonstrated that resazurin produces comparable results to viability staining using calcein AM with no significant difference in the 50% inhibition concentration (IC50) between both methods. 31 Metabolic activity of HT1080 cells was significantly reduced compared with vehicle controls with SOR at 5, 10, and 50 μM and PAC at 50 μM (Fig. 9B). No significant effect on metabolic activity was observed with GEM. For SOR treatment, metabolic activity was reduced in a dose-dependent manner, and a similar trend is observed with PAC treatment for concentrations above 10 μM.
To control for changes in cell viability with drug treatment and determine cellular MMP activity on a “per cell” basis, the MMP activity of each sample was normalized to its metabolic activity (Fig. 9C). HT1080 cells treated with high concentrations of SOR (10 and 50 μM) had significantly higher MMP activity per cell compared with vehicle controls, but not cells treated with PAC or GEM. Although the metabolic activity was significantly less than vehicle control at 5 μM of SOR (Fig. 9B), MMP activity was not significantly different than vehicle control on a per cell basis (Fig. 9C). Similarly, with PAC treatment at 50 μM, metabolic activity was significantly less than vehicle control (Fig. 9B), but there was no significant difference in MMP activity on a per cell basis (Fig. 9C). In previous studies with melanoma cells, utilizing a similar fluorescent MMP-degradable hydrogel system, conditions in which drug treatment upregulated MMP activity also increased 3D cell migration. 16 Further investigation will be needed to determine if the increased MMP activity with SOR treatment observed here also regulates fibrosarcoma cell invasion and migration, cell functions critical to tumor progression and metastasis.
The system developed here measures global MMP activity and metabolic activity simultaneously in response to variety of compounds. To follow up on promising leads, these measurements could be complemented by further studies, such as cell viability experiments or to explore the mechanisms of action by which the drugs affect MMP or metabolic activity. A metabolic activity reagent (resazurin) was utilized here as an overall cell health indicator, other assays could be used to directly measure cellular viability such as live/dead staining assays with calcein AM and ethidium homodimer. MMP activity is regulated at multiple levels (i.e., expression, secretion, proenzyme cleavage, and endogenous inhibitors), and future explorations could be targeted at determining which of these levels are modulated to affect final MMP activity.
In conclusion, MMPs are critical regulators of cancer progression, and assays that can measure MMP activity will be critical in the development of new therapeutic strategies. While MMP activity detection systems such as gelatin zymography are well established and widely used, these systems have not been compatible with HT approaches. Therefore, developing an MMP activity detection system that is suitable for HT and combines simplicity, adaptability, and ease of access to other researchers will be valuable. To this end, a 3D low-throughput MMP activity assay was miniaturized to a 96-well plate format and characterized for reproducibility and robustness. The assay was validated with human MMPs and several cell types. A fibrosarcoma cell line was treated with several chemotherapeutic drugs in a range of concentrations to demonstrate the ability of this assay to measure MMP activity in response to drug treatment. Interestingly, it was found that SOR increased MMP activity per cell in a dose-dependent manner.
While a specific fluorescent metalloproteinase-degradable peptide was used here, the assay and methodology are not sensor specific and would be amenable to the incorporation of other fluorescent reporter molecules. The use of other degradable substrates would enable the detection of proteolytic subgroups beyond MMPs, such as serine, threonine, or cysteine proteases. In addition, although the system was demonstrated here for single-cell encapsulation, the system could likely also be adapted for the encapsulation of 3D spheroids, such as those produced by the hanging-drop method or with low-attachment plates.
Footnotes
Acknowledgments
The authors acknowledge the Ohio Cancer Research (OCR), OH, USA, for funding this work as well as King Saud University (KSU), Riyadh, KSA, for sponsoring the first author. Molecular weight of the fluorescent peptide sensor was measured using MALDI-TOF mass spectrometry with assistance from the Campus Chemical Instrument Center Mass Spectrometry and Proteomics Facility at The Ohio State University.
Disclosure Statement
No competing financial interests exist.
Supplementary Material
Supplementary Figure S1