
Abstract
In vascular systems, macrophages can engulf circulating oxidized (ox) low-density lipoprotein (LDL), leading to the accumulation of intracellular lipid droplets, which forms foam cells. Macrophage-derived foam cells are an important therapeutic target for atherosclerosis. However, quantifying intracellular lipid droplets in macrophages is difficult. The purpose of this study was to use high-content screening (HCS) and fluorescence staining to analyze and quantify accumulation of intracellular lipid droplets in macrophages. A murine macrophage cell line RAW 264.7 was seeded in a 96-well black plate and treated with ox-LDL. After fixation, the cells were stained with the lipophilic and nuclear fluorescent dyes briefly. The number and mean fluorescence intensity of the intracellular lipid droplets in the macrophages were detected by an HCS reader. Using HCS to quantify lipid droplets in macrophages could be applied for antiatherogenic drug discovery, and its sensitivity is much higher than that of oil red O staining.
Introduction
Macrophage foam cells are an indicator of atherosclerosis and are thus a possible therapeutic target for treating it. 1 Macrophages engulf circulating oxidized (ox) low-density lipoprotein (LDL) in the intima of blood vessels. This subsequently leads to lipid droplet accumulation in intracellular spaces. 2 Such lipid-laden macrophages are defined as foam cells and have been demonstrated to contribute to the formation of fatty streaks and atherosclerotic plaques in the early progress of atherosclerosis. 3,4
Oil red O staining is a classic method to quantify intracytoplasmic lipid storage in adipocytes, and it involves extracting the amount of dye and measuring the absorbance at 510 nm. 5 Recently, several oil red O staining protocols have been developed to detect adipose lipid accumulation through image analysis of intracellular lipid droplets. 6,7 In addition, oil red O staining has been applied to quantify foam cell formation in cultured macrophages. 8
High-content screening (HCS) is an automated cell-based quantitative technology used to collect cellular imaging under automated microscopy, to process huge data from these images and to analyze the results with integrated software. 9 HCS combining with fluorescent staining has been applied for analysis of intracellular lipid droplets. 10,11 To improve the analysis of oil red O staining, HCS was applied to detect and quantify lipid droplet accumulation in macrophage foam cell formation, which is induced by ox-LDL in a murine macrophage cell line RAW 264.7. The aim of current study was to use the HCS platform to analyze and quantify lipid droplet formation in macrophages. Lipophilic and nuclear fluorescent dyes were used to label intracellular lipid droplets and nuclei, respectively.
Materials and Methods
Preparation of ox-LDL
Human LDL (Millipore, Temecula, CA) was diluted to 0.5 mg/mL with phosphate-buffered saline (PBS; 137 mM NaCl, 2.7 mM KCl, 8 mM Na2HPO4, and 1.5 mM KH2PO4; pH 7.4) and oxidized with 10 μM CuSO4 (Sigma-Aldrich, St. Louis, MO) in a 15 mL centrifuge tube at 37°C and gently shake (80 rpm) for 24 h. After oxidation, add 10 μL of 100 mM ethylenediaminetetraacetic acid (Sigma-Aldrich) to 1 mL of the diluted LDL solution. Use the prepared ox-LDL immediately.
Seeding of Macrophages and Treatment of ox-LDL
The murine macrophage cell line, RAW 264.7 (American Type Culture Collection, Manassas, VA), was maintained in Dulbecco's Modified Eagle Medium (Invitrogen Life Technologies, Carlsbad, CA) containing 10% fetal bovine serum (Invitrogen), 100 U/mL of penicillin (Invitrogen), and 100 μg/mL of streptomycin (Invitrogen) at 37°C in a humidified incubator with 5% carbon dioxide (CO2). Seed 3,000–10,000 cells per well (total volume 100 μL) in a 96-well black plate (PerkinElmer, Norwalk, CT). In the laminar flow hood, add 40–100 μg/mL ox-LDL (and other candidates) to each well and incubate at 37°C with 5% CO2 for 24 h.
Fixation and Fluorescent Staining
After treatment, remove the medium and wash the cells with 200 μL of PBS per well one to three times. Ensure that the top of the tips do not touch the cells to avoid loss of cells. Then, fix the cells in each well with 100 μL of 4% paraformaldehyde (Electron Microscopy Sciences, Fort Washington, PA) for 20–30 min in a lightproof environment. After fixation, wash the cells with 200 μL of PBS once per well. Stain the cells with the lipophilic fluorescent dye AdipoRed (1:500; Lonza, Walkersville, MD) and the nuclear fluorescent dye Hoechst 33342 (1:1,000; Thermo Fisher Scientific, San Jose, CA) in PBS (total volume: 100 μL for each well) for 10–20 min. After staining, remove the solution and wash the cells with 200 μL of PBS per well twice. Finally, add 100 μL of PBS per well and store the plate at 4°C.
High-Content Screening
The experimental procedure involves cell seeding, drug treatment (with or without ox-LDL), fixation, fluorescent staining, and HCS (Fig. 1). Wipe the bottom of the plates before the loading and analysis processes. The sample was analyzed by a Thermo Scientific Cellomics® ArrayScan® VTI HCS Reader (Thermo Fisher Scientific, Pittsburgh, PA). First, choose 40 × magnification in “Image Acquisition,” enter 36 in “Max Fields For Well” of “Scan Limits,” choose “SpotDetector.V3” in “Assay Algorithm,” choose 2 for “#Channels” in “Assay,” and set “Channel Specific Parameters” for the lipophilic and nuclear fluorescent dyes as shown in Figure 2 (Step 1). The number of “Max Fields For Well” in “Scan Limits” is based on experimental requirements. Then, choose the type of black plates used in “Current Plate,” autofocus the image of stained cells, determine the exposure time in “Exposure,” and input the maximum or minimum values in “Object Selection Parameters (Protocol)” as shown in Figure 2 (Step 2). If there is no option for the black plate used, set up and calibrate the size and height of the bottom of the plate according to the operation manual. Finally, name the plate, choose the wells for scanning, and start to scan as shown in Figure 2 (Step 3).
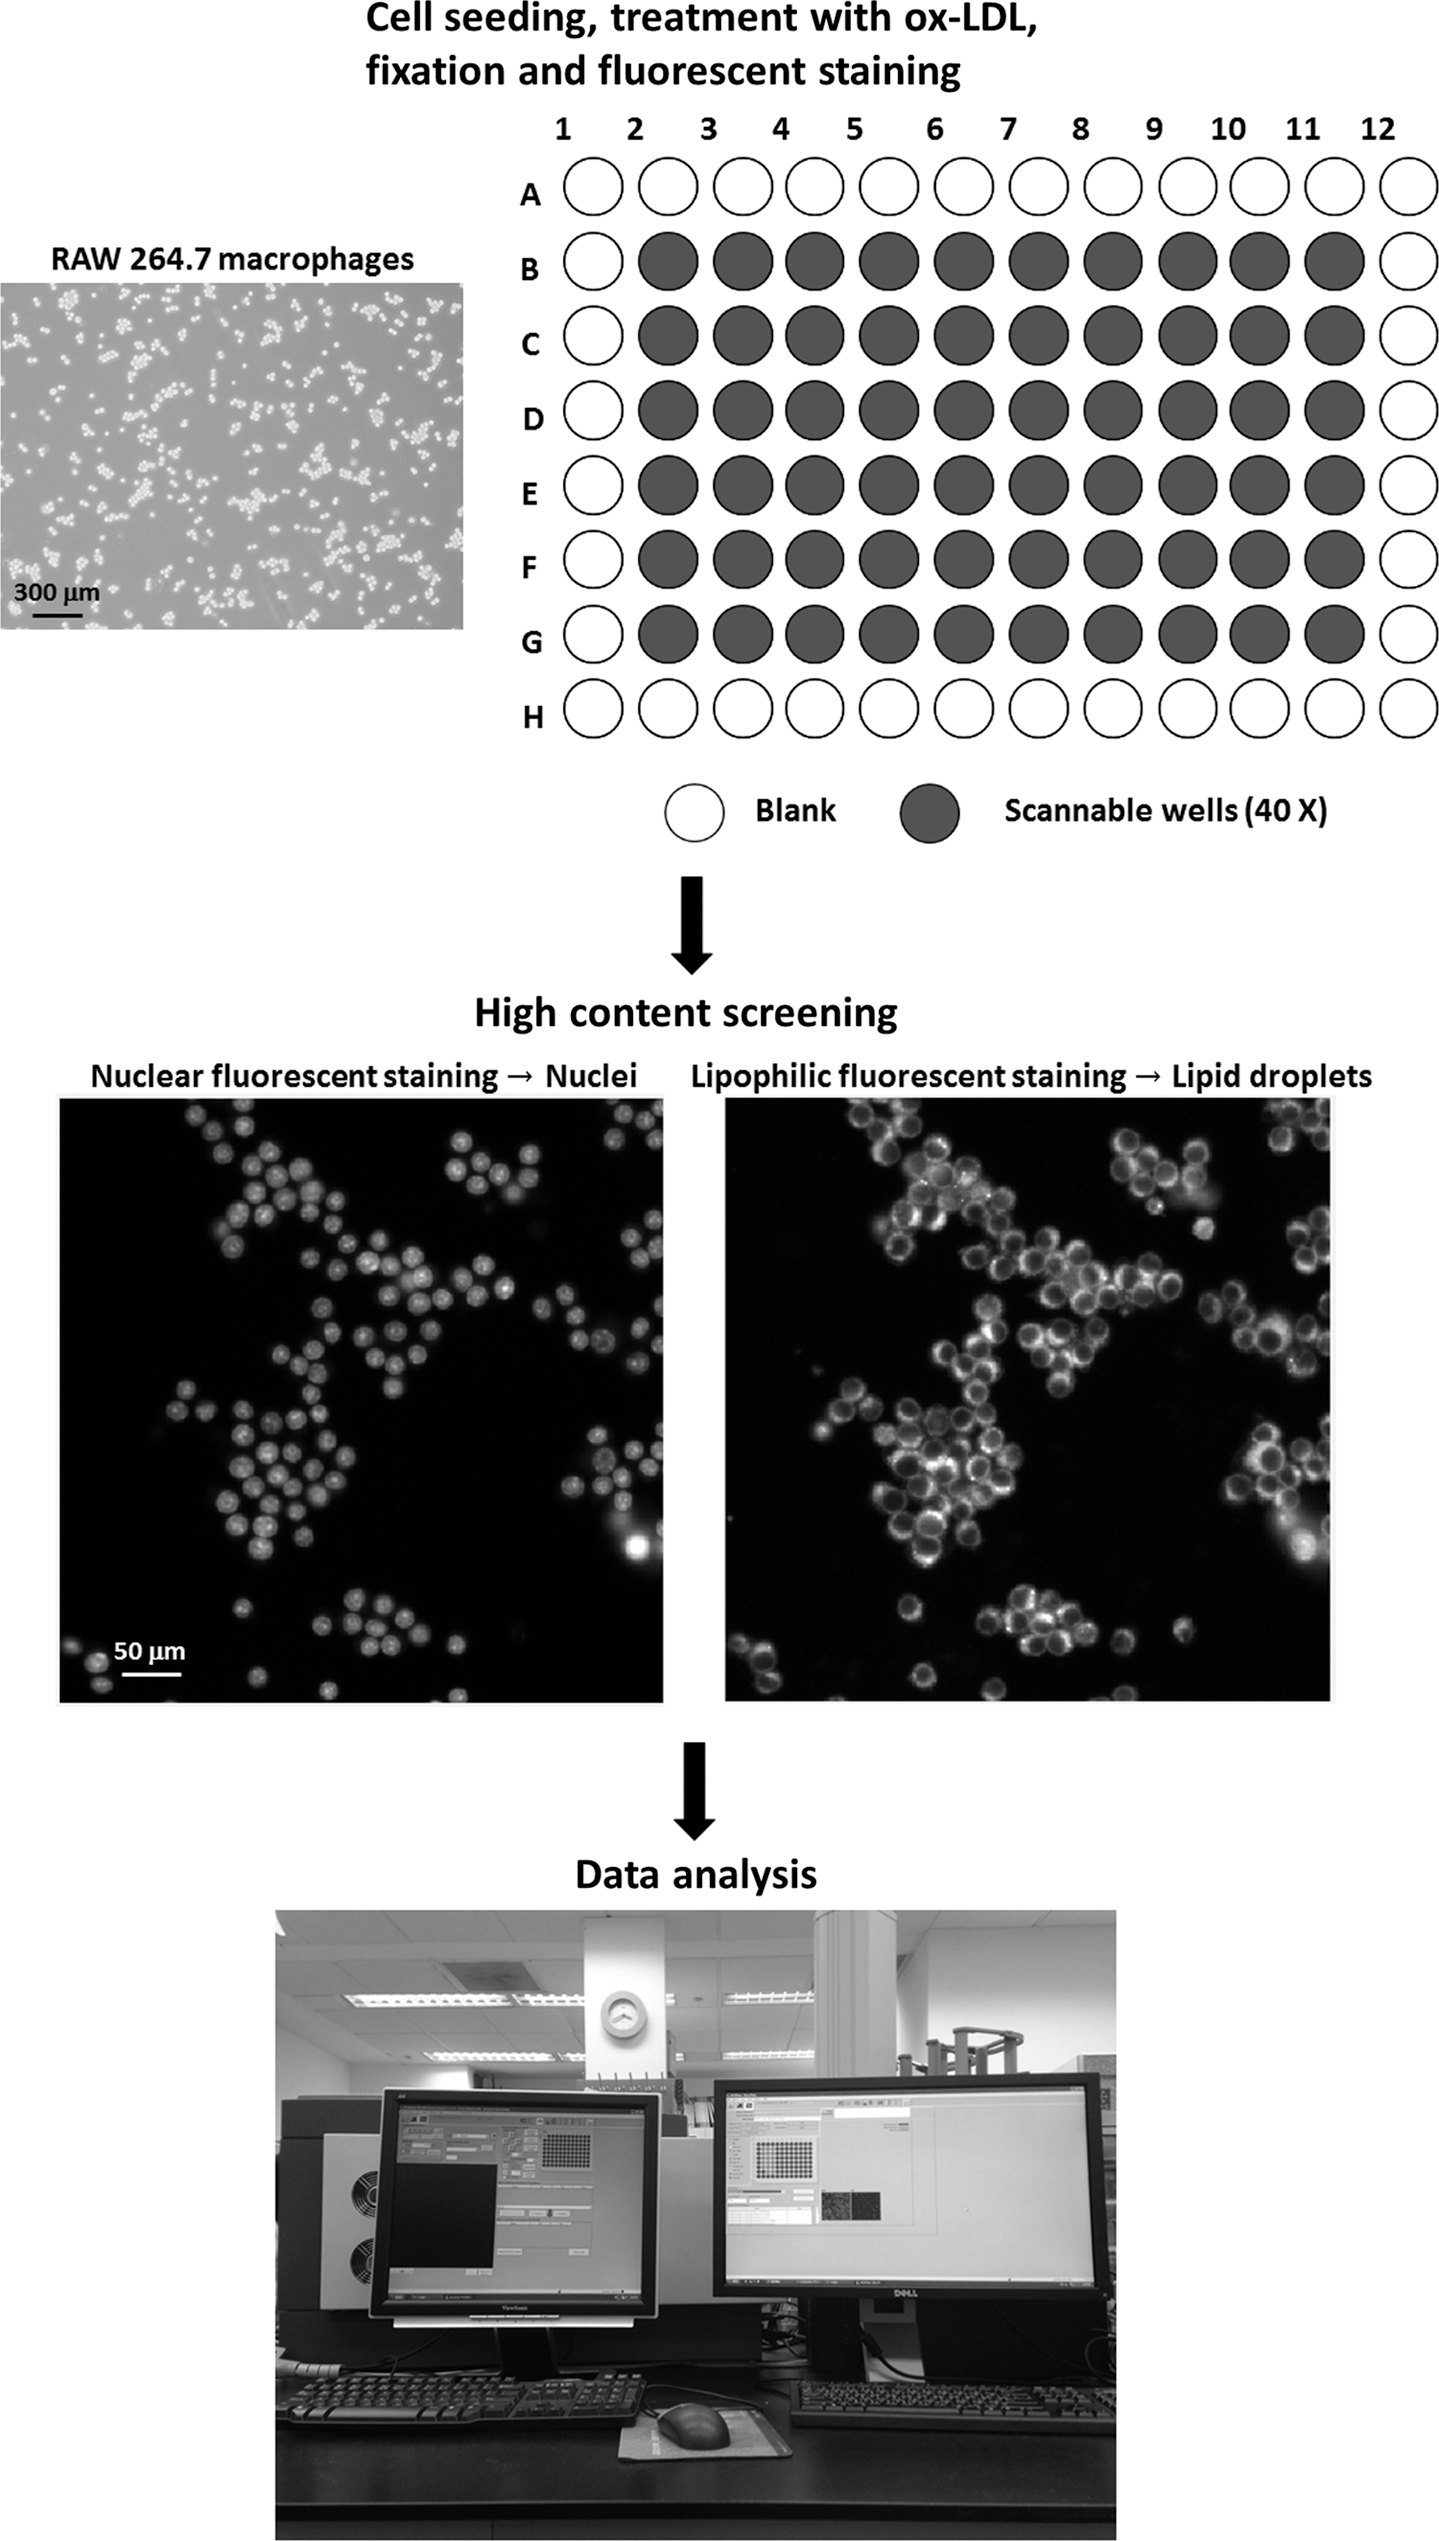
HCS procedure for intracellular lipid droplets in macrophages. First, cell seeding and treatment with ox-LDL or other compounds are performed in 96-well black plates on the basis of individual experimental requirements. Under 40 × magnification, the outside wells of a 96-well black plate (A1–A12, B1–G1, B12–G12, and H1–H12) may not be detected by an HCS reader. The duration of fixation and staining is ∼1 h. The included scale bar equals 300 μm. Second, the samples in black plates were scanned by an HCS reader. Finally, the data are calculated immediately after the HCS process. HCS, high-content screening; ox-LDL, oxidized low-density lipoprotein.
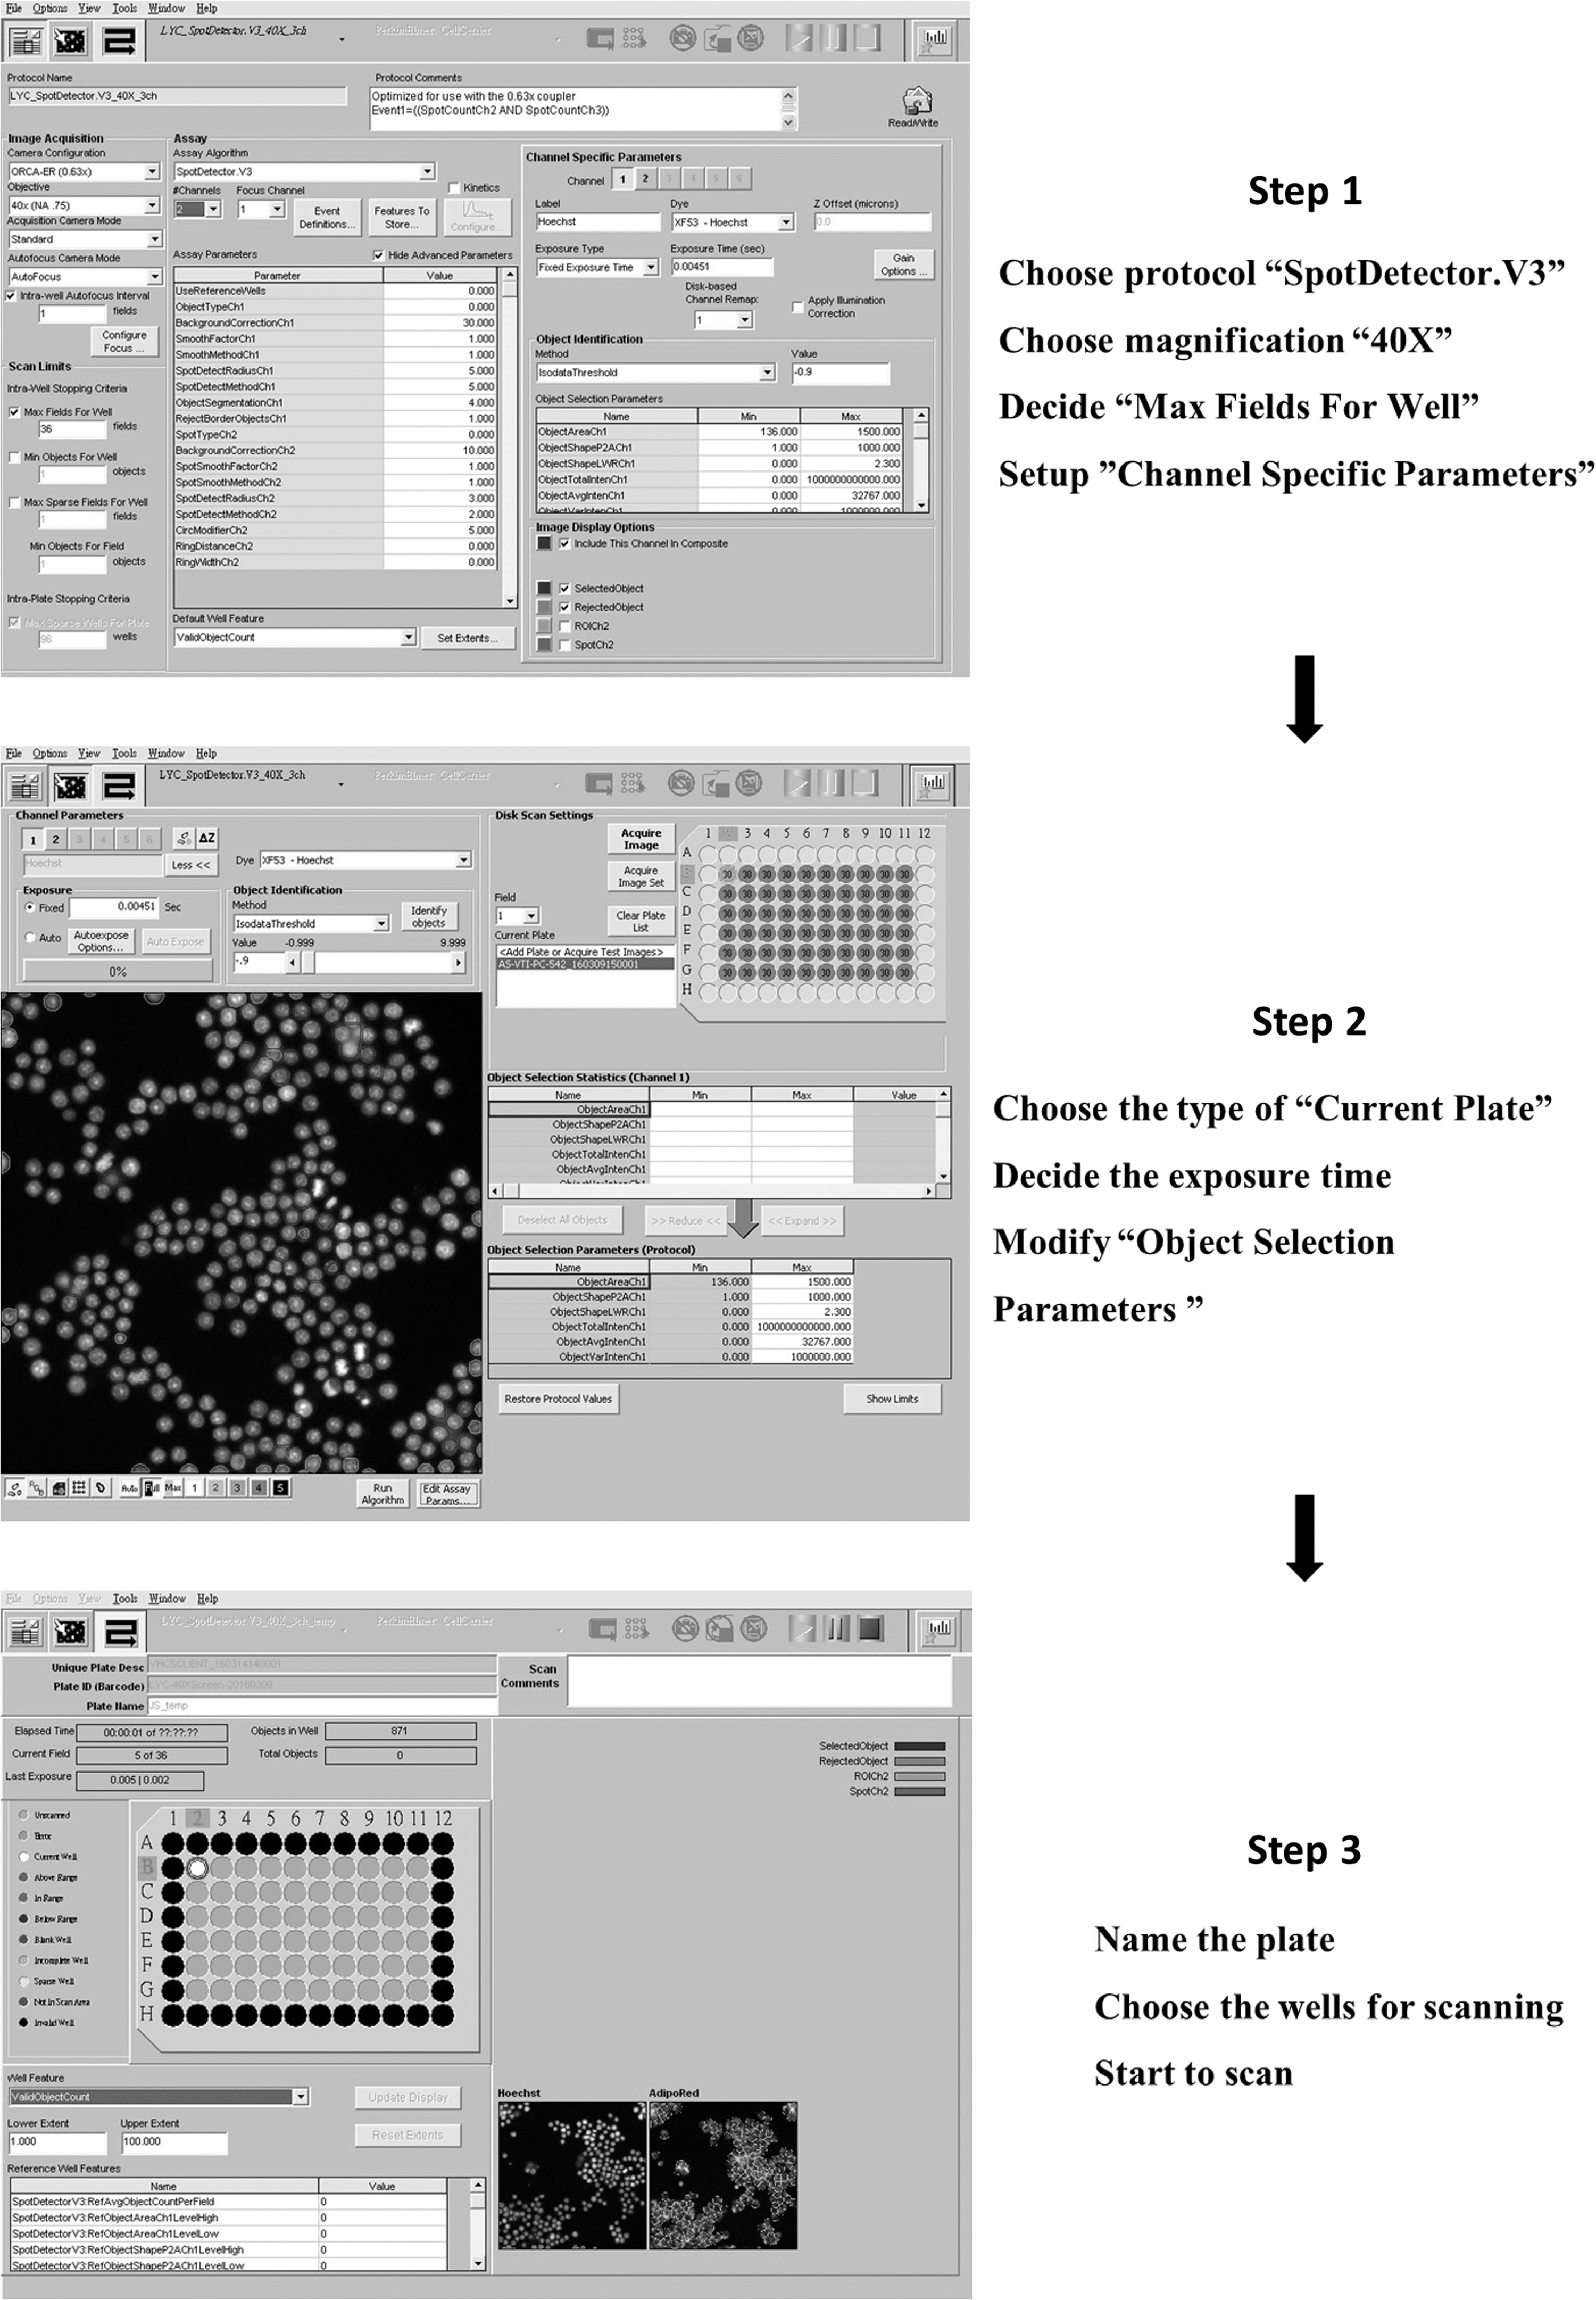
HCS procedure. Step 1: Select the assay algorithm, magnification ratio, number of scanning fields in each well, fluorescent channels, and channel-specific parameters. Step 2: Choose the type of loaded plates, determine the exposure time, check the staining, and modify the object selection parameters. Step 3: Name the plate and choose the wells for scanning.
Statistical Analysis
All data are presented as the mean ± standard deviation. The statistical significance of differences (p < 0.05) between groups was analyzed using Student's t-test.
Results
Defining the nuclei and lipid droplets of macrophages is the key step in the HCS analysis of foam cell formation, particularly the lipophilic fluorescent dye-labeled lipid droplets (spots). In our protocol, we suggest that the minimum values of the spot average intensity (SpotAvgInten) must be estimated precisely to avoid background interference. Furthermore, optimizing the values of the spot area (SpotArea) and object area (ObjectArea) are crucial to exclude any nonlipid droplet binding and abnormal selection of nuclei, respectively. The referenced parameters and exposure time of the nuclear and lipophilic fluorescent dyes are shown in Figures 3 and 4, respectively. Channel-specific parameters can be set before or after performing HCS. The values should be modified in each experiment to ensure an appropriate calibration of object selection.

Channel-specific parameters for nuclear fluorescent staining. Nuclear fluorescent staining was used to label nuclei for object selection in HCS analysis. The selected ObjectArea is used to exclude the incorrect objects.
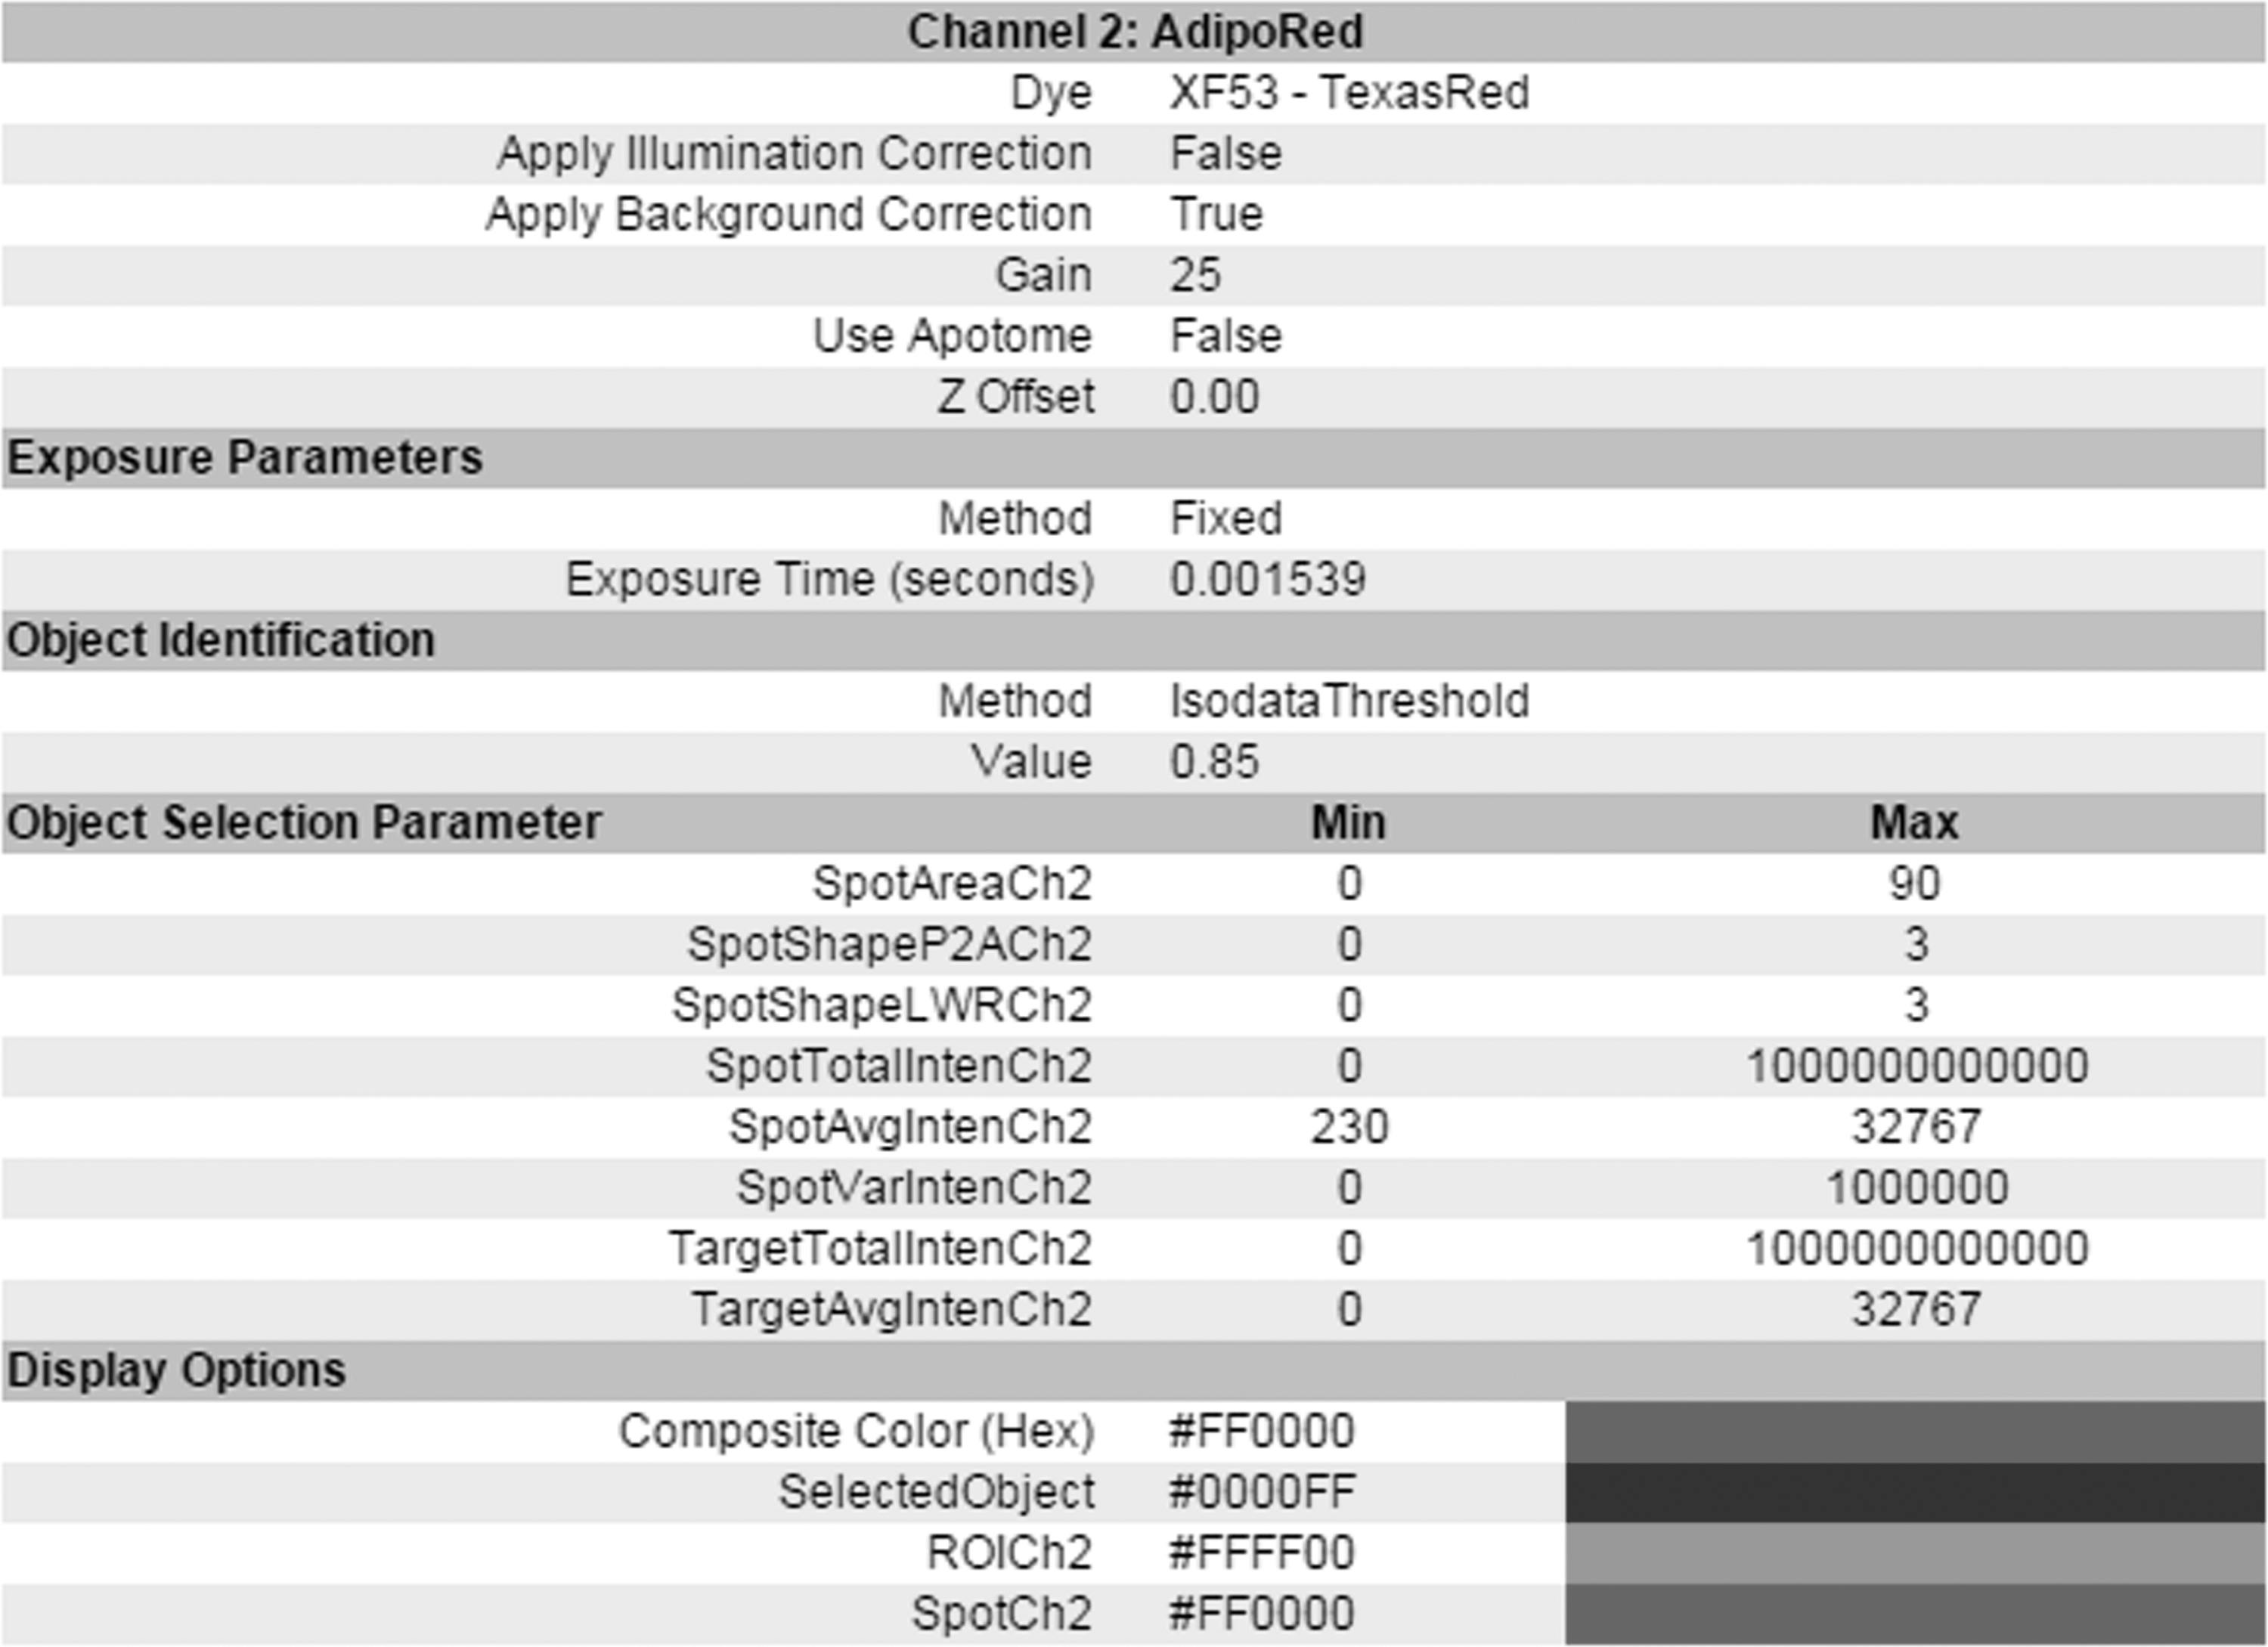
Channel-specific parameters for lipophilic fluorescent staining. Lipophilic fluorescent staining was used to label intracellular lipid droplets for spot selection in HCS analysis. The SpotAvgInten was applied to avoid interference from background. The selected SpotArea is used to exclude the binding of nonlipid droplet.
The current protocol uses ox-LDL to induce macrophage foam cell formation. The selection of object and spot are adopted to quantify nuclear fluorescent staining (nucleus; Fig. 5A) and lipophilic fluorescent staining (lipid droplet; Fig. 5B) in HCS analysis. The results of HCS showed that treatment with 40 μg/mL of ox-LDL for 24 h induced accumulation of intracellular lipid droplets (Fig. 4). The quantified results also revealed that ox-LDL significantly increased the number of lipid droplets (Fig. 6A) and enhanced the mean fluorescence intensity of the lipid droplets (Fig. 6B) in each cell, compared with the control group. The results indicate that the HCS platform could be used to estimate ox-LDL-induced lipid droplet formation.
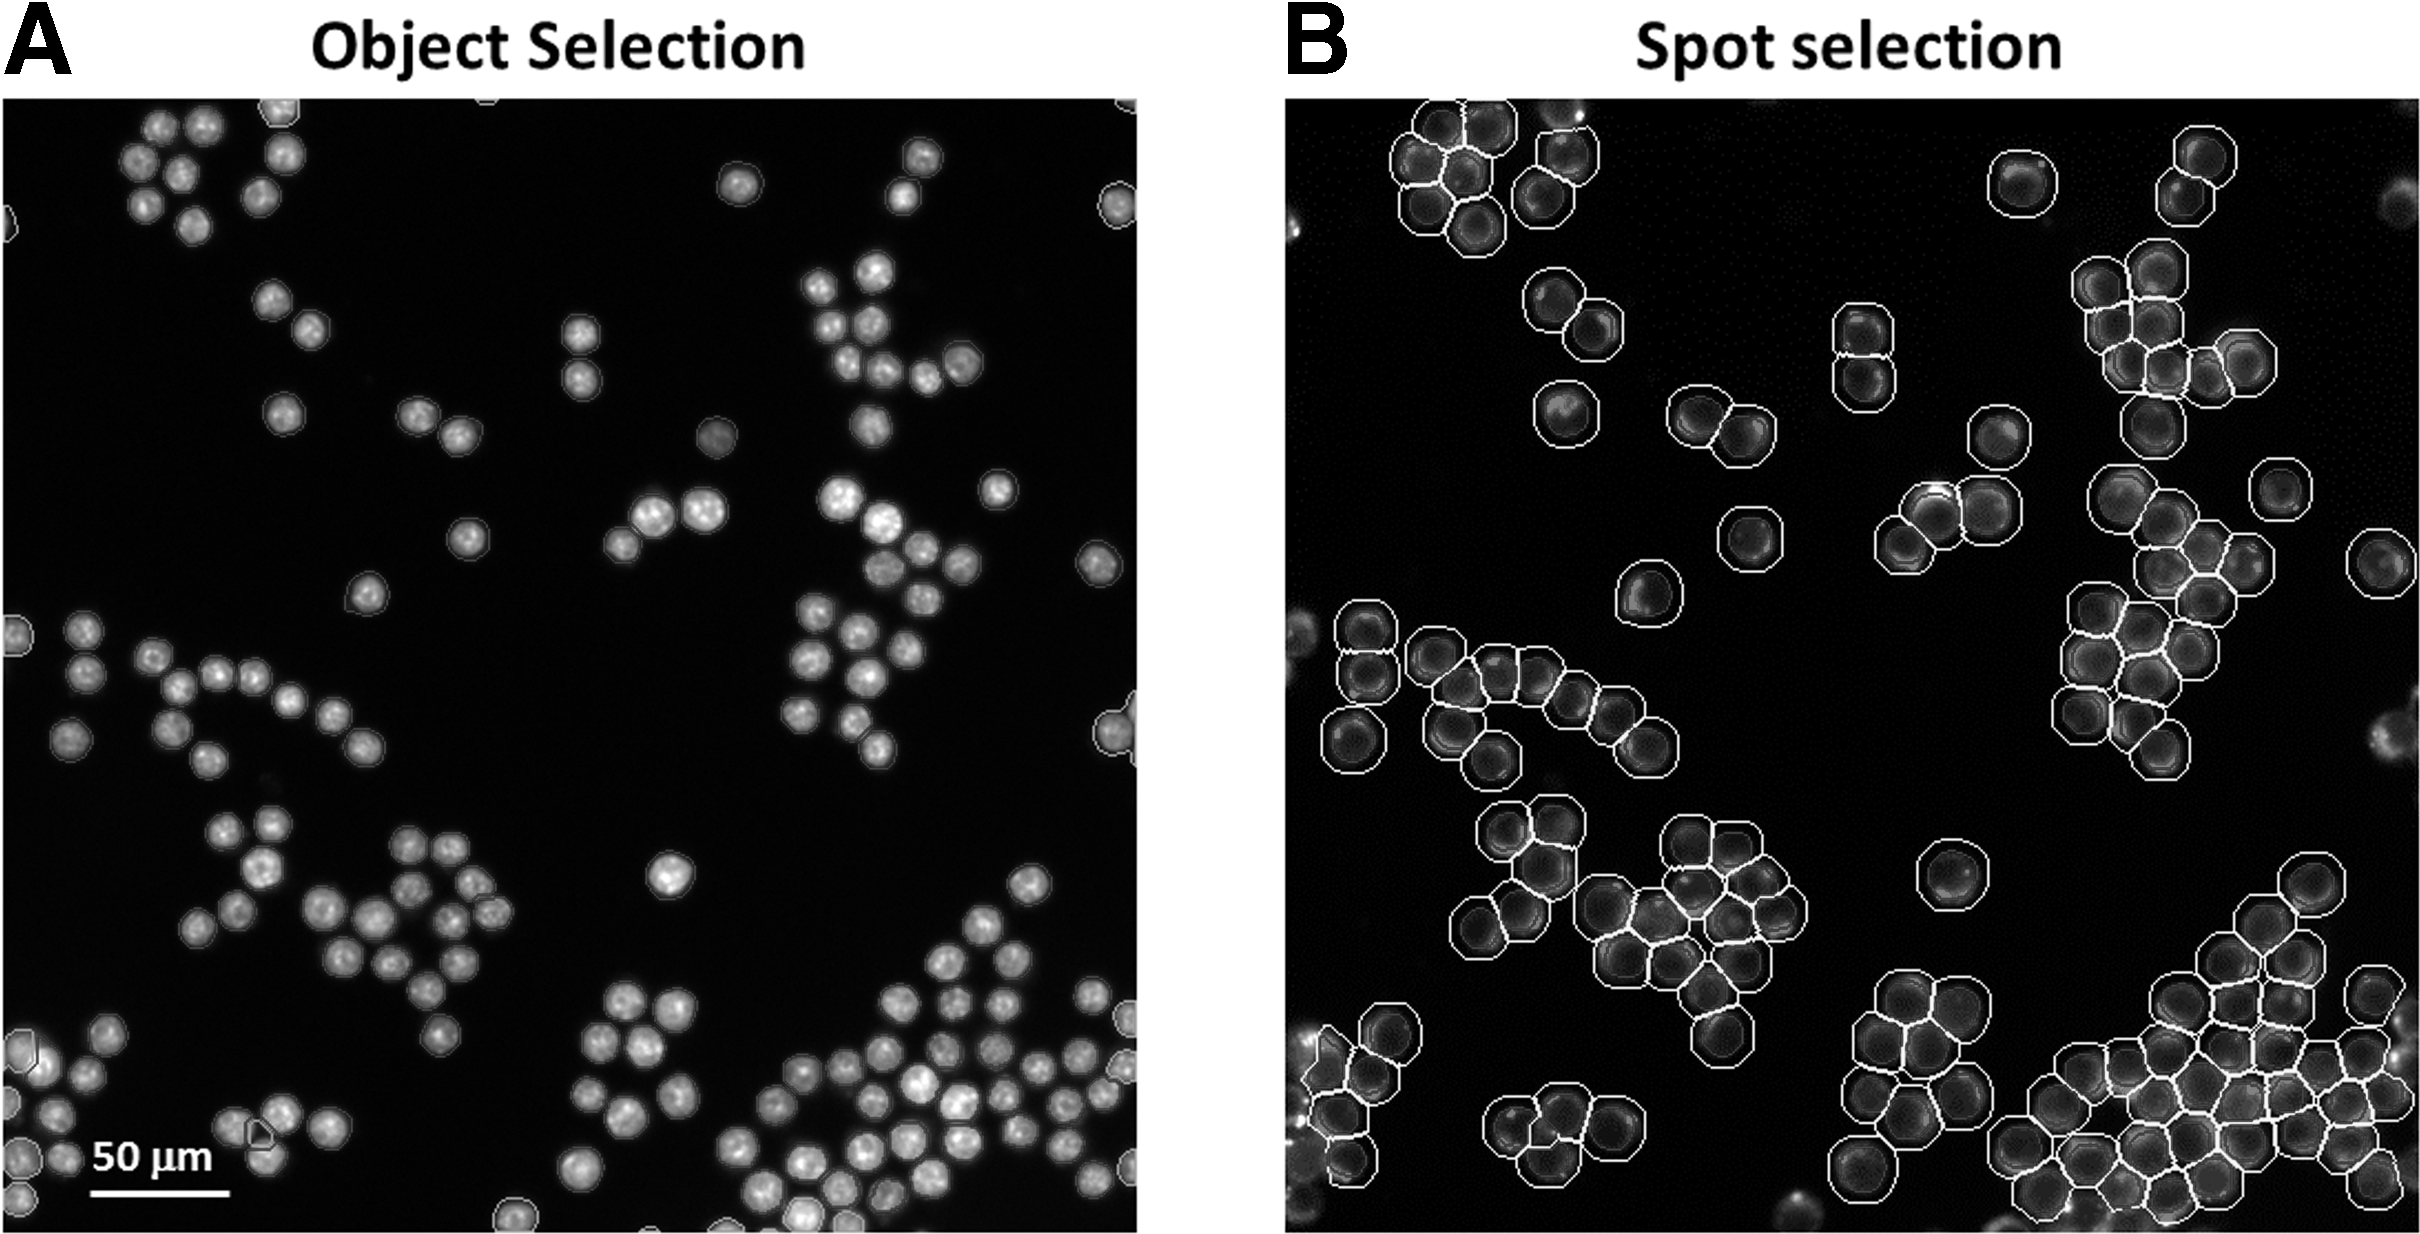
Selection of nuclei and lipid droplets in macrophages.

Treatment with ox-LDL increased the average number of and mean fluorescence intensity (per cell) in the macrophages. Raw 264.7 macrophages were seeded (6,000 cells per well) in a 96-well black plate and treated with 40 μg/mL of ox-LDL for 24 h. The intracellular lipid droplets were analyzed using HCS.
Discussion
This study quantified lipid droplet formation in ox-LDL-induced macrophage foam cells on the basis of procedures outlined in a previously published article. 12 The protocol is easy to perform, and it facilitates quickly determining lipid droplet formation in cultured macrophage or monocytic cell line. With HCS, the image of each well was the same position (X, Y) and processed in the same condition. The results of both the amount and mean fluorescence intensity of intracellular lipid droplets (per cell) were used to determine macrophage foam cell formation by computing pixel density and area. The images of HCS could be also visualized and edited by image software. The experimental procedure required <2 h (per 96-well plate), including fixation, fluorescent staining, cell imaging, and data collection. In our method, we found that stability of fixed cells was better than that of live cells during HCS. Additional time may be required to accommodate the size and height of the bottom of the black plate before experiment. However, the 96-well black plates used for the cell culture must be suitable for 40 × magnification in HCS. If the plates are unsuitable, it is very difficult to detect 40 × magnified images. Moreover, the effect of ox-LDL on lipid droplet formation should be confirmed in several repeated experiments before a large-scale drug screening process is performed. The selection of intracellular lipid droplets in macrophages should be adequately defined in each HCS analysis.
The current protocol enables an easy method to quantify the density of ox-LDL-mediated foam cell formation. In our platform, “Selected Object Count” from the nuclear fluorescent dye-labeled nuclei indicates the number of cells remaining in each well after treatment with ox-LDL. We measure the cell viability without using an additional 3-(4,5-cimethylthiazol-2-yl)-2,5-diphenyl tetrazolium bromide assay because the cell length and the cell width are also collected to reflect the change in cell shape, which could be used to evaluate the activation of macrophages in response to ox-LDL or other chemical compounds.
However, the efficiency of inducing of lipid droplet formation in macrophages depends on various experimental designs and different factors such as exposed duration, dosage, and different kinds of LDL. For instance, different labels or even different batches of commercial LDL may have variously stimulatory effects on lipid droplet formation. We also found that a higher cell density of macrophages also reduces the efficiency of lipid droplet formation in response to ox-LDL and increases the difficulty of object selection. Therefore, optimizing the efficiency of inducing ability is necessary before applying HCS.
Although oil red O staining is a well-established means of quantifying neutral lipid accumulation in adipocytes, 7 it involves several problems that must be resolved when it is applied to macrophages. First, cultured macrophages typically are nonadherent to the culture dishes. When they were exposed to organic solvent (e.g., 2-propanol), subsequent washing would further engender a loss of treated cells. It is difficult to quantify the number of cells remaining in each well after oil red O staining. Moreover, using nonfluorescent dye is difficult to distinguish subtle changes of lipid accumulation. When lipophilic and nuclear fluorescent dyes were used in the outlined method, the sensitivity of detecting the changes of cell imaging was markedly increased. A nuclear fluorescent dye was applied as an internal control as well as to exclude the interference factor (cell loss) in each well.
Recently, the stimulatory effect of YC-1 on lipid droplet formation in macrophages was demonstrated using both oil red O and HCS with lipophilic fluorescent staining. 12 The results of HCS were similar to those of oil red O staining, but this combined method provided more information about the lipid droplets in each cell. In the outlined protocol, people can evaluate the overall outcome or individual result of macrophage foam cell formation, depending on the number of fields in each well used for screening during the HCS analysis.
Several fluorescent dyes have been applied to the quantification of macrophage foam cell formation. For example, 1,1′-dioctadecyl-3,3,3′3′-tetra-methylindocyanide percholorate (DiI) has been used to label LDL and analyze Dil-ox-LDL uptake in macrophages. 8 Bodipy 493/503 also been applied to detect intracellular lipid droplets in macrophage foam cell formation after ox-LDL treatment, 13 as well as AdipoRed. 12,14 Nevertheless, the use of Dil to label LDL requires ultracentrifugation to remove unbound dyes. Using lipophilic fluorescent staining is a more convenient and easier choice for analyzing lipid droplet formation in macrophages. In the outlined protocol, measuring the red fluorescence from lipid droplets prevents the contamination of the blue fluorescence from nuclei. Furthermore, combining HCS and fluorescent staining provides a considerably high quality and efficient results for measuring intracellular lipid droplets in macrophages. The fluorescent dyes used in the outlined method have been considered to be replaceable by Nile red and DAPI, respectively; however, in such a case, the Channel-specific parameters should be appropriately reset. In addition, if the cell imaging of HCS is clear and focused, erroneous selection of nucleus and lipid droplets could be overcome and corrected in the analysis procedure. Oil red O staining could be applied for the confirmation of the results of HCS if necessary. 12
Macrophage foam cells are a novel target for drug design and clinical treatment in atherosclerosis and other cardiovascular diseases. Numerous candidates have been screened to inhibit lipid droplet formation by using oil red O staining. Peroxisome proliferator-activated receptor α and γ agonists were reported to inhibit foam cell formation in mouse macrophages, 15 as well as the cytokine interleukin 33, the hormone intermedin, and the organic compounds resveratrol. 16 –18 Hydrogen sulfide and puerarin were also determined to reduce intracellular lipid droplets in human THP-1 macrophages. 19,20 In the current study, the applied protocol provides a novel method to quantify macrophage foam cell formation. The protocol should be suitable for future drug testing and screening to estimate effects on lipid droplet formation in macrophages, as well as adipocytes and hepatocytes. The protocol can also be considered for use in evaluating the induction of lipid droplet formation through factors such as LDL, ox-LDL, or lipopolysaccharides.
The proposed protocol in current study was developed to screen macrophage foam cell formation by quantifying lipid droplets. However, intracellular lipid droplets have a three-dimensional distribution in macrophages. A part of lipid droplets above the nucleus are undetectable when using inverted fluorescence microscopy in a traditional HCS reader. HCS combined with confocal microscopy should be applied in discovery of antiatherogenic drugs to evaluate the accuracy of quantifying lipid droplets.
HCS is the powerful and useful method to evaluate and quantify accumulation of lipid droplets per macrophages. The HCS platform could be used to estimate the antiatherogenic effect of other candidates through inhibition of ox-LDL-induced lipid droplet formation.
Footnotes
Acknowledgments
RAW 264.7 macrophage cell lines were offered by Prof. Shwu-Fen Chang. We thank the staff members of the Second Core Lab, Department of Medical Research, National Taiwan University Hospital for their technical support. In addition, we especially appreciate the assistance of the National RNAi Core Facility (Academia Sinica, Taipei, Republic of China) with the ArrayScan HCS experiments. This work was supported by the Taiwan National Science Council grant NSC102-2314-B-002-112-MY3.
Disclosure Statement
The authors declare no competing financial interests.