
Abstract
The central nervous system has been identified as an anatomical reservoir for HIV due the difficulties in delivering therapeutic agents into the brain and this complication results in HIV-associated neurocognitive disorder that persists in infected patients. The brain regions that are potentially exposed to tissue deficits due to HIV have been reported in previous reports; therefore, it is important to determine the drugs that can enter and localize in brain regions that are known to be susceptible to HIV neurodegeneration. Sprague-Dawley rats received intraperitoneal doses of zidovudine and lamivudine (50 mg kg−1). Mass spectrometry methods were used to determine the pharmacokinetics, of zidovudine and lamivudine, in the brain using liquid chromatography tandem mass spectrometry and mass spectrometry imaging (MSI), respectively. Zidovudine and lamivudine displayed complementary pharmacokinetic curves indicating a rapid absorption and blood–brain barrier penetration of both drugs reaching C max at 0.5 h after single dose. MSI of coronal brain sections showed that zidovudine and lamivudine are mostly distributed in corpus callosum, globus pallidus, striatum, and the neocortex region. Mass spectrometry techniques were used to demonstrate that zidovudine and lamivudine drugs are able to reach and localize in brain regions that are targets of HIV neurodegeneration in the brain.
Introduction
Despite advancements in antiretroviral therapy (ART) over the past few decades, the incidence of HIV-associated neurocognitive disorder (HAND) persists in between 30% and 50% of infected patients. 1 Chiang et al., reported that ∼35% of HIV-infected patients present with neurocognitive deficits at the time of death. 2 The brain areas of neurodegeneration associated with HIV/AIDS was determined using tensor-based morphometry in conjunction with MRI and showed severe atrophy in the primary and association sensorimotor areas. Atrophy was primarily observed in the cortical white matter and is considered a marker of HIV cognitive impairment. 2 Monitoring of CD4+ T-lymphocyte depletion and the rise in CD14+/CD16+ monocytes is associated with HIV dementia in central nervous system (CNS) and has an important role in deducing that HIV pathogenesis does indeed induce neurological disorders. 3 Severe atrophy in front parietal and striatal areas may underlie early cognitive dysfunction in patients living with HIV/AIDS and may signal the imminent onset of the AIDS dementia complex, 2 especially since the CNS has been considered an anatomical HIV reservoir due to the difficulties associated with the delivery of therapeutic drugs into the brain. Therefore, there are several studies that have evaluated the penetration of ART drugs into CNS, focusing on monitoring drug levels in the cerebrospinal fluid (CSF) as an indication to whether or not ART drugs would inhibit HIV in brain. 4 –6 However, these studies may not be a true reflection of drug levels in the brain, since the histology of this organ is complex and CSF in the brain and CSF out of the brain are seen as two different components, and therefore not necessarily an indicator of brain drug concentrations. HIV has the ability to localize in specific areas in the brain and the drugs need to be present in these areas to effectively inhibit the viral replication. 7 –9
This combination of zidovudine (AZT) and lamivudine (3TC) is clinically available as Combivir and is a combination of two nucleoside analog reverse transcriptase inhibitors. 10 The AZT and 3TC cocktail is currently used as a twice-daily pill in the treatment of HIV-positive pregnant women, infants, and children. 10,11 Foudraine NA conducted a study showing that both AZT and 3TC are effective in decreasing the HIV-1-RNA concentrations in CSF. 4 AZT has higher CNS concentrations with a CNS penetration effectiveness (CPE) score of 4 and 3TC with CPE score of 2, respectively. 6
During drug development studies, a preliminary requirement is to understand the drug pharmacokinetics and localization patterns of drugs in target organs such as the brain. Currently, there are no validated liquid chromatography tandem mass spectrometry (LC-MS/MS) methods for the quantification AZT and 3TC in the brain tissues. There is also no information regarding the distribution and localization of AZT and 3TC in the brain. Therefore, the aims of this study are to develop a validated method for the quantitation of AZT and 3TC in the brain and to also determine the potential of the AZT and 3TC combination for the treatment of HAND by investigating its distribution patterns in the brain. The use of mass spectrometry imaging (MSI) in conjunction with LC-MS/MS by our group 7 –9,12 will provide an insight into the ability of Combivir to penetrate through the blood–brain barrier (BBB), to determine if this combination can effectively target areas that are known to undergo neurodegeneration.
Experimental
Materials and Reagents
AZT, 3TC, and emtricitabine (FTC) were purchased from DLD scientific (Durban, South Africa). LC-MS grade methanol (MeOH) and acetonitrile (ACN) were purchased from Sigma-Aldrich (Munich, Germany). Analytical grade formic acid (FA) was purchased from Merck Millipore (Merck, South Africa). α-Cyano-4-hydroxycinnamic acid (HCCA), ≥99% purity, was purchased from Bruker. A Milli-Q purification system (Bedford, MA) was used for the preparation of ultrapure water. Solid-phase extraction (SPE) cartridges, Supel™—Select HLB SPE (30 mg, 1 mL), Discovery® DSC-PS/DVB SPE Hybrid SPE (30 mg, 1 mL), were purchased from Supelco-Sigma (St. Louis, MO). All other chemicals used in this study were of analytical grade.
Animals
Ethical clearance for use of animals in the study was granted by the Animal Research Ethics Committee (AREC) of the University of KwaZulu-Natal (UKZN) (Ref: AREC: 007/017D). Female Sprague-Dawley (SD) rats weighing 120 ± 20 g were obtained from the Biomedical Resource Unit, UKZN, Durban, South Africa. Animals used for the study were grouped and housed under standard conditions, in an air-conditioned room with a 12-h light/12-h dark cycle and ad libitum access to food and water.
Drug Administration and Sample Collection
AZT and 3TC were prepared in a 10% (v/v) aqueous solution of dimethyl sulfoxide (DMSO). Female Sprague-Dawley rats were administered 50 mg kg −1 13 –16 each of AZT and 3TC through intraperitoneal (i.p.) injection. There were no observed physical/behavioral abnormalities with drug administration. Animals were anesthetized by isoflurane overdose at 0.25, 0.5, 1, 2, 4, 6, 8, and 24 h posttreatment (n = 3 per time point) and 3 animals were used for control; the total number of animals used in this study was 51. The cardiac puncture technique was used to draw the blood directly from the rat's heart. Blood samples (1,000 μL from each animal) were immediately collected into K3-EDTA-coated tubes and centrifuged at 10,000 g for 10 min. Plasma was prepared and stored at −80°C until analysis. Rat brain tissues were surgically removed following animal termination, the tissue was rinsed in saline to remove residual blood, snap frozen in liquid nitrogen, and stored at −80°C.
Biological Samples
Blank plasma and brain samples were obtained from untreated Sprague-Dawley rats. The brain samples were weighed and cut into smaller portions using a surgical scalpel blade and then homogenized in ultrapure water (3 mL g −1 tissue). All brain homogenates and plasma samples were stored at −80°C until analysis.
LC-MS/MS Method
LC Thermo Scientific Dionex UltiMate 3000 instrument equipped with a binary solvent delivery system and an auto-sampler (Dionex Softron GmbH, Germany) was used to perform a chromatographic separation using Ascentis Express F5 analytical column with L × I.D of 5 cm × 2.1 mm, a particle size of 2.7 μm, and pore size of 90 Å. The analytes and internal standards (ISs) were eluted using a gradient mobile phase system comprising mobile phase A (H2O + 0.1% v/v FA) and mobile phase B (MeOH +0.1% v/v FA). The gradient method started from 20% mobile phase B increased to 95% over 2 min and then held for 1 min before being returned to the initial composition over 1.5 min. The equilibration time was 1.5 min. The mobile phase flow rate was 0.30 mL min −1. AZT and 3TC method validation have already been conducted in previous studies. 17 –20
MS analysis was conducted on an AmaZon Speed Ion Trap mass spectrometer coupled to an electrospray ionization (ESI) ion source (Bruker Daltonics, Bremen, Germany). The MS was operated using the following source parameters shown in Table 1.
Optimized Source-Dependent Parameters
The multiple reaction monitoring settings used are shown in Table 2.
Multiple Reaction Monitoring Transitions and Instrument Parameters
AZT, zidovudine; FTC, emtricitabine; IS, internal standard; 3TC, lamivudine.
Sample Preparation for LC-MS/MS Analysis
During sample preparation, 100 μL of the biological sample was spiked with 100 μL of IS to yield a final concentration of 250 ng mL −1 and vortexed for 1 min, after which 800 μL of ACN (for brain homogenates) or MeOH (for plasma homogenate) was added to extract the target analytes, while inducing the precipitation of proteins. The mixture was then vortex mixed for 1 min, followed by centrifugation at 13,000 g for 15 min at 4°C. The supernatants were run through an SPE cartridge C18–100 mg (Sigma-Aldrich) suitable for each biological sample. The eluent was then collected into autosampler vials and vortex mixed briefly, before injecting into the LC-MS/MS system. Following the same sample preparation procedure, the calibration curves were constructed in each biological matrix.
Tissue Preparation for Matrix-Assisted Laser Desorption/Ionization-MSI
The frozen rat brain tissues from three different animals (n = 3) were split in two hemisphere and then one hemisphere was mounted on a specimen disc using optimal cutting temperature compound and then coronal sectioned (12 μm thick) at a—1.13 mm anterior bregma 21,22 using a Leica Microsystems CM1100 (Wetzlar, Germany) cryostat set at −20°C. The sections were then thaw-mounted onto indium titanium oxide-coated slides (Bruker Daltonics). The slides were stored in the biofreezer (−80°C) before analysis. The slides were dried under vacuum (desiccator) for 30 min to avoid the accumulation of moisture from the biofreezer. Dry slides were then scanned using a flatbed scanner (HP LaserJet 3055, China). Matrix-assisted laser desorption/ionization (MALDI) matrix was prepared by dissolving 7 mg/mL HCCA in 15% H2O, 85% ACN, and 0.1% FA composition, and then sonicated for 10 min.
The ImagePrep (Bruker Daltonics) station was operated under controlled conditions (filled with only nitrogen gas). MALDI matrix was deposited using sensor-controlled vibrational vaporization by the ImagePrep instrument (Bruker Daltonics) according to the manufacturer's protocol. The spray generator in the ImagePrep was filled with matrix, which then creates matrix aerosol by vibrating the metal sheet and produces an average droplet size of ∼20 μm. These droplets were uniformly deposited onto slides with brain sections. The standard ImagePrep method (HCCA peptides and small molecules) used had five phases, each phase consists of cycles that have three steps, nebulizing, incubating, and drying conditions. All five phases were sensor controlled based on matrix thickness, which was measured based on voltage. Phase 1 had 15 cycles with final voltage difference of 0.2 V, phase 2 with 10 cycles with final voltage difference of 0.07 V, phase 3 with 12 cycles with final voltage difference of 0.07 V, phase 4 with 30 cycles with final voltage difference of 0.2 V, and finally, phase 5 had 64 cycles with final voltage difference of 0.6 V. This method was applied in all slides analyzed to ensure reproducibility. The slides were then dried in a desiccator for 30 min and the matrix density range was determined to be 80–110 μg cm −2, before MSI analysis.
MSI Analysis
All MSI experiments were conducted on an AutoFlex Smartbeam III MALDI-TOF/TOF MS system (Bruker Daltonics) equipped with a Smartbeam Nd:YAG laser (355 nm). MS data were gathered in positive ionization mode with the mass spectra recorded within the mass range of m/z 100 → 500. The instrument was calibrated by spotting AZT and 3TC standards on a ground steel MALDI target plate following the HCCA dried droplet sample preparation protocol (Bruker Daltonics). This method was optimized using 500 laser shots per raster spot from each position, with a laser frequency of 200 Hz and a digitization rate of 0.5 GS s−1. The optimum laser power was set at 65% for all analyses. MSI images were acquired using a raster width of 100 μm (spatial resolution). Three serial brain sections were analyzed from the same animal monitoring AZT and 3TC precursor ions m/z 268.035 and 230.070.
Data Analysis
LC-MS/MS data were analyzed using Bruker Data Analysis 4.0 SP 5 and Quant Analysis 2.1 (Bruker Daltonics). Raw data from FlexImaging 4.1 software (Bruker Daltonics) were exported as an imzML file to msIQuant (version 2.0.1.14) 23 to further analyze MSI data. Total ion current (TIC) normalization was used in all MSI images to reduce any potential systematic error that may have occurred during sample treatment and actual MALDI-MSI analysis. Pharmacokinetic data were determined using Stata 13 (StataCorp, TX).
Results
In Vivo Pharmacokinetic Application
Different gradient compositions were tested for the optimum chromatographic retention of AZT, 3TC (analytes), and FTC as the IS. The mass spectrometry conditions were validated to achieve sensitive and reproducible results. The results of the mass transitions of the samples optimized and chromatograms are shown in Supplementary Figures S1 to S3. The precursor and product ions were obtained for AZT, 3TC, and FTC (IS) using positive ESI scan as follows; m/z (268.2 → 127.1), (230.2 → 112.1), and (248.2 → 130.1), respectively.
Female Sprague-Dawley rats were single dosed with 50 mg kg −1 of AZT and 3TC through i.p. administration. The plasma and brain samples were collected at the following time points: 0.25, 0.5, 1, 2, 4, 6, 8, and 24 h postdrug administration (n = 3 per time point). The LC-MS/MS method described was used to quantify AZT and 3TC in plasma and brain homogenate samples. The mean concentration-time profile and pharmacokinetic properties are represented in Figures 1, 2 and Table 3, respectively.

Plasma concentrations of AZT and 3TC following a 50 mg kg−1 i.p. dose of each ART drug (data are presented as mean ± standard deviation, n = 3). ART, antiretroviral therapy; AZT, zidovudine; 3TC, lamivudine.
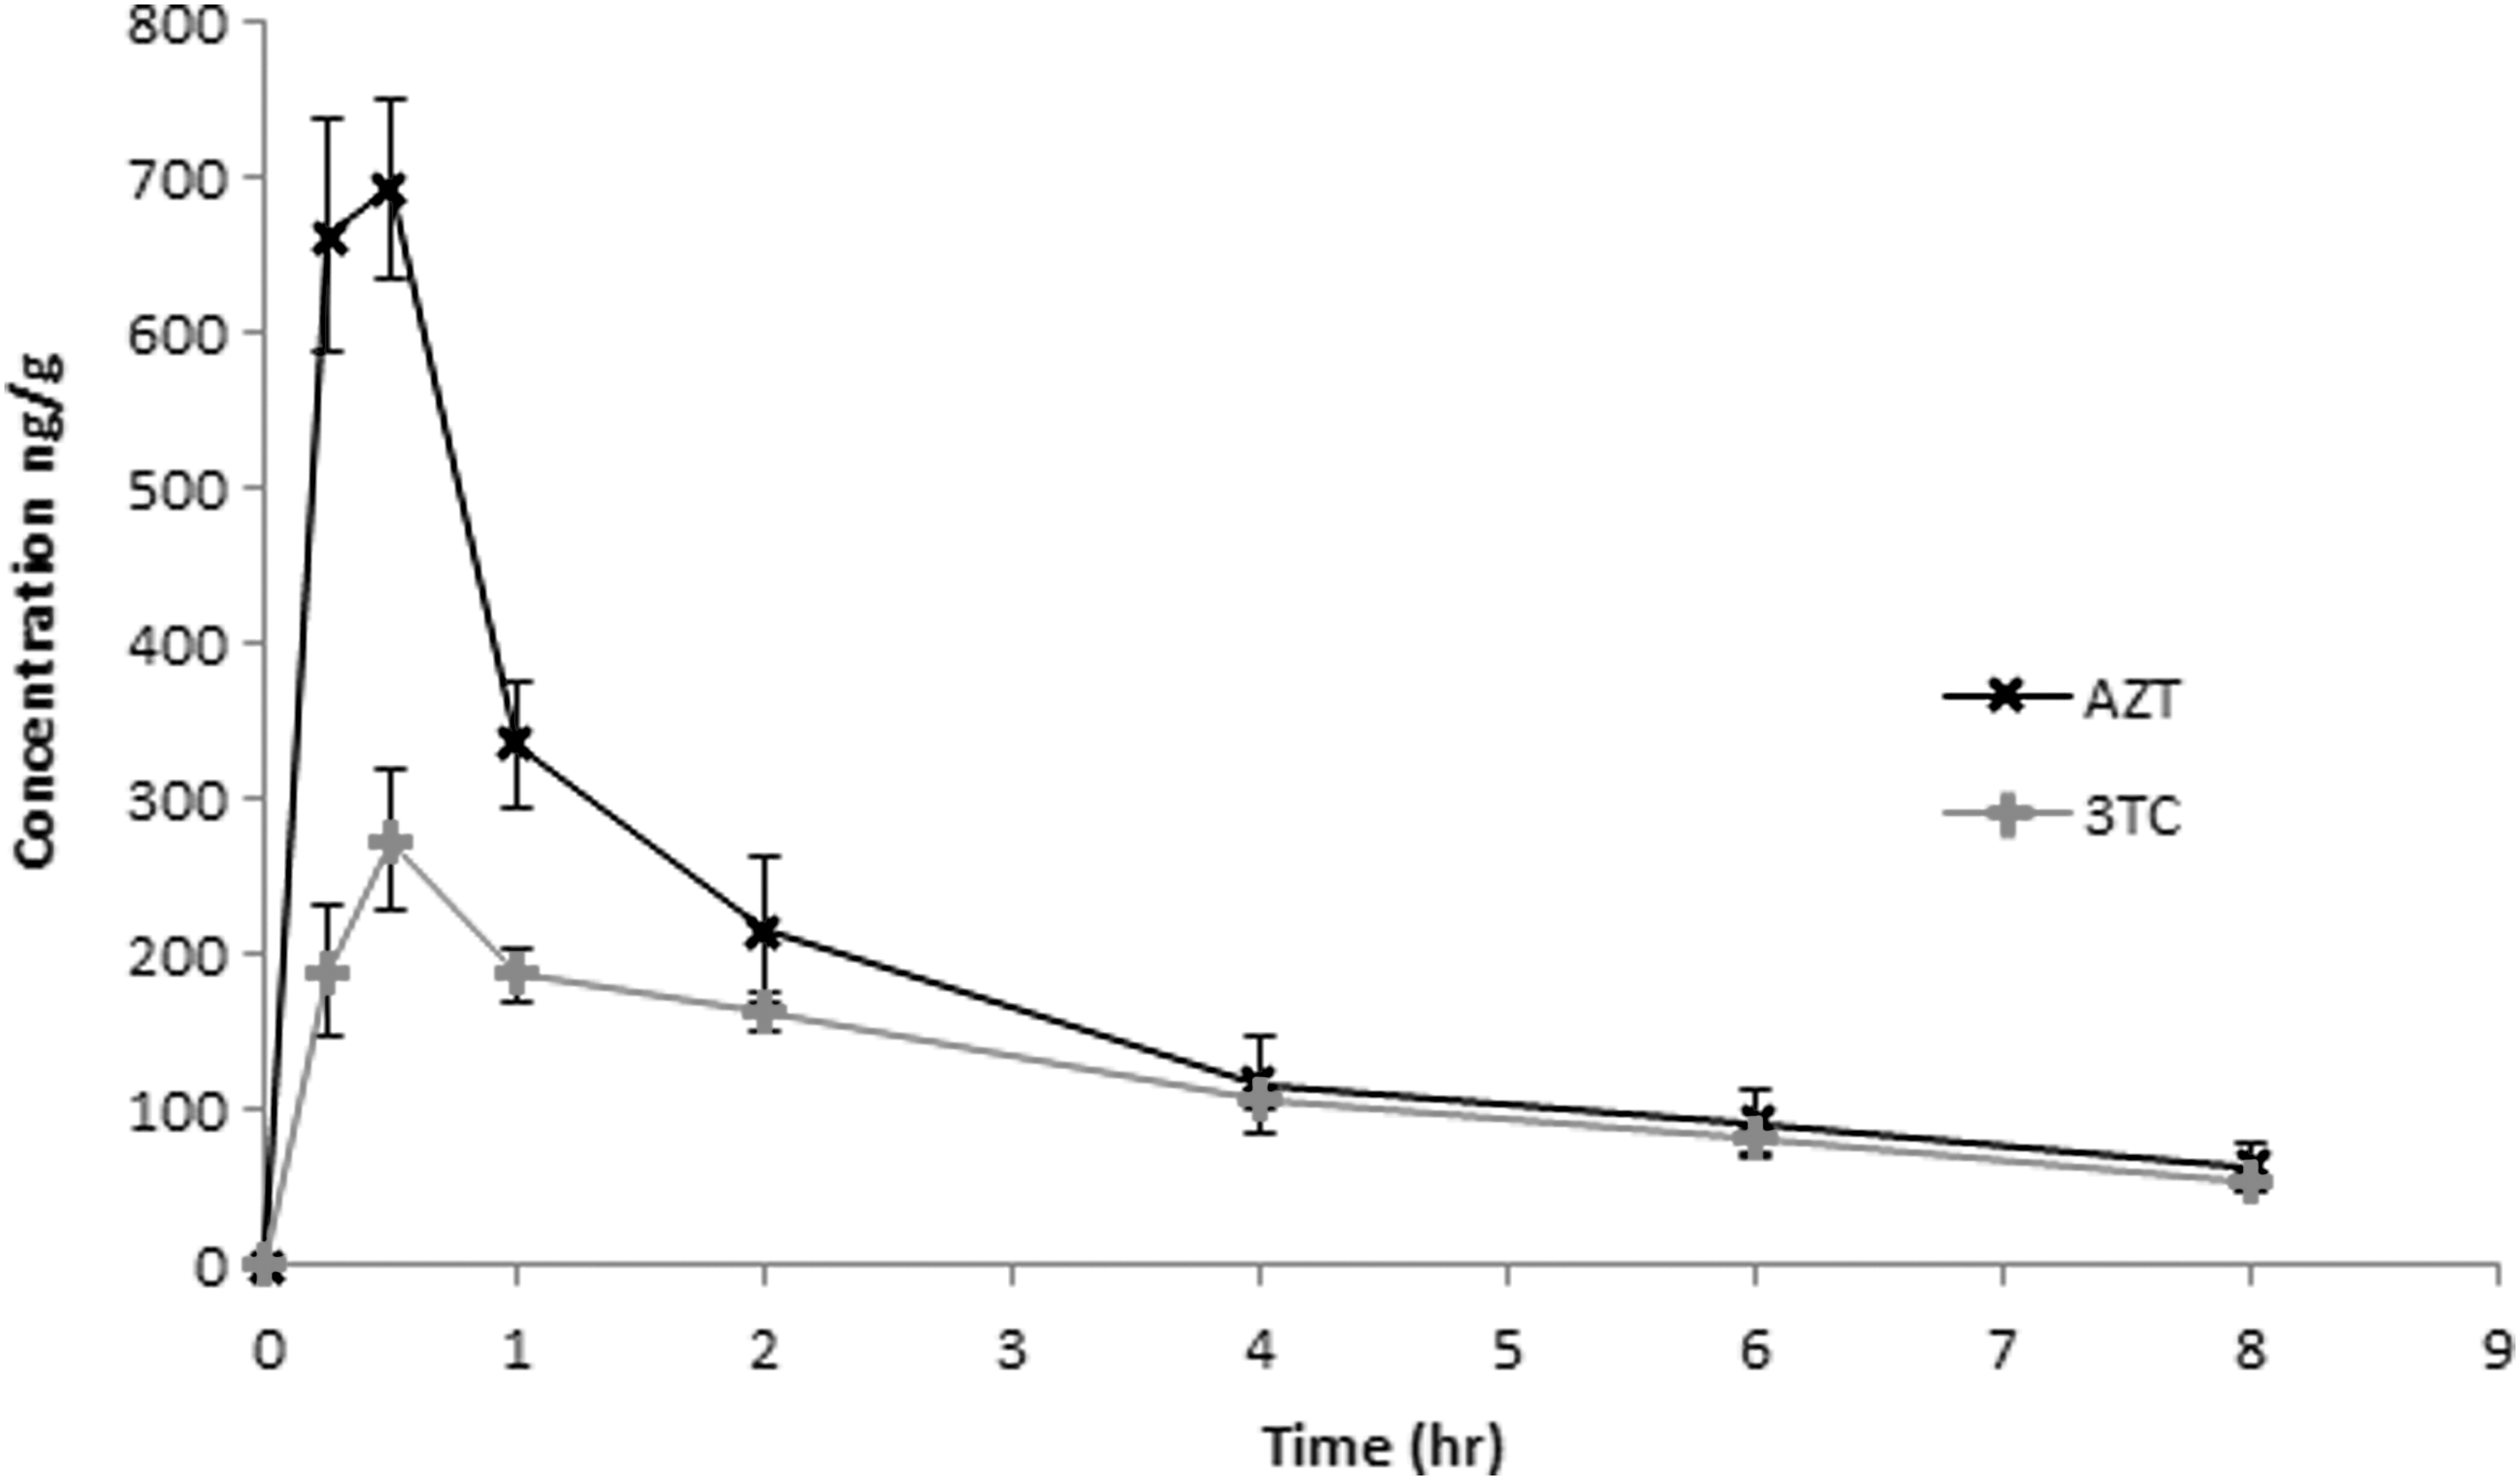
Brain concentrations of AZT and 3TC following a 50 mg kg−1 i.p. dose of each ART drug (data are presented as mean ± standard deviation, n = 3).
Pharmacokinetic Parameters of AZT and 3TC Following a Single i.p. Dose of 50 mg kg− 1 (Data Are Represented as Mean ± Standard Deviation)
Pharmacokinetic data measured over a 24-h period, sampling was done at 0.25, 0.5, 1.0, 2.0, 4.0, 6.0, 8.0, and 24.0 h postdose.
AUC, area under the curve.
Mass Spectrometry Imaging
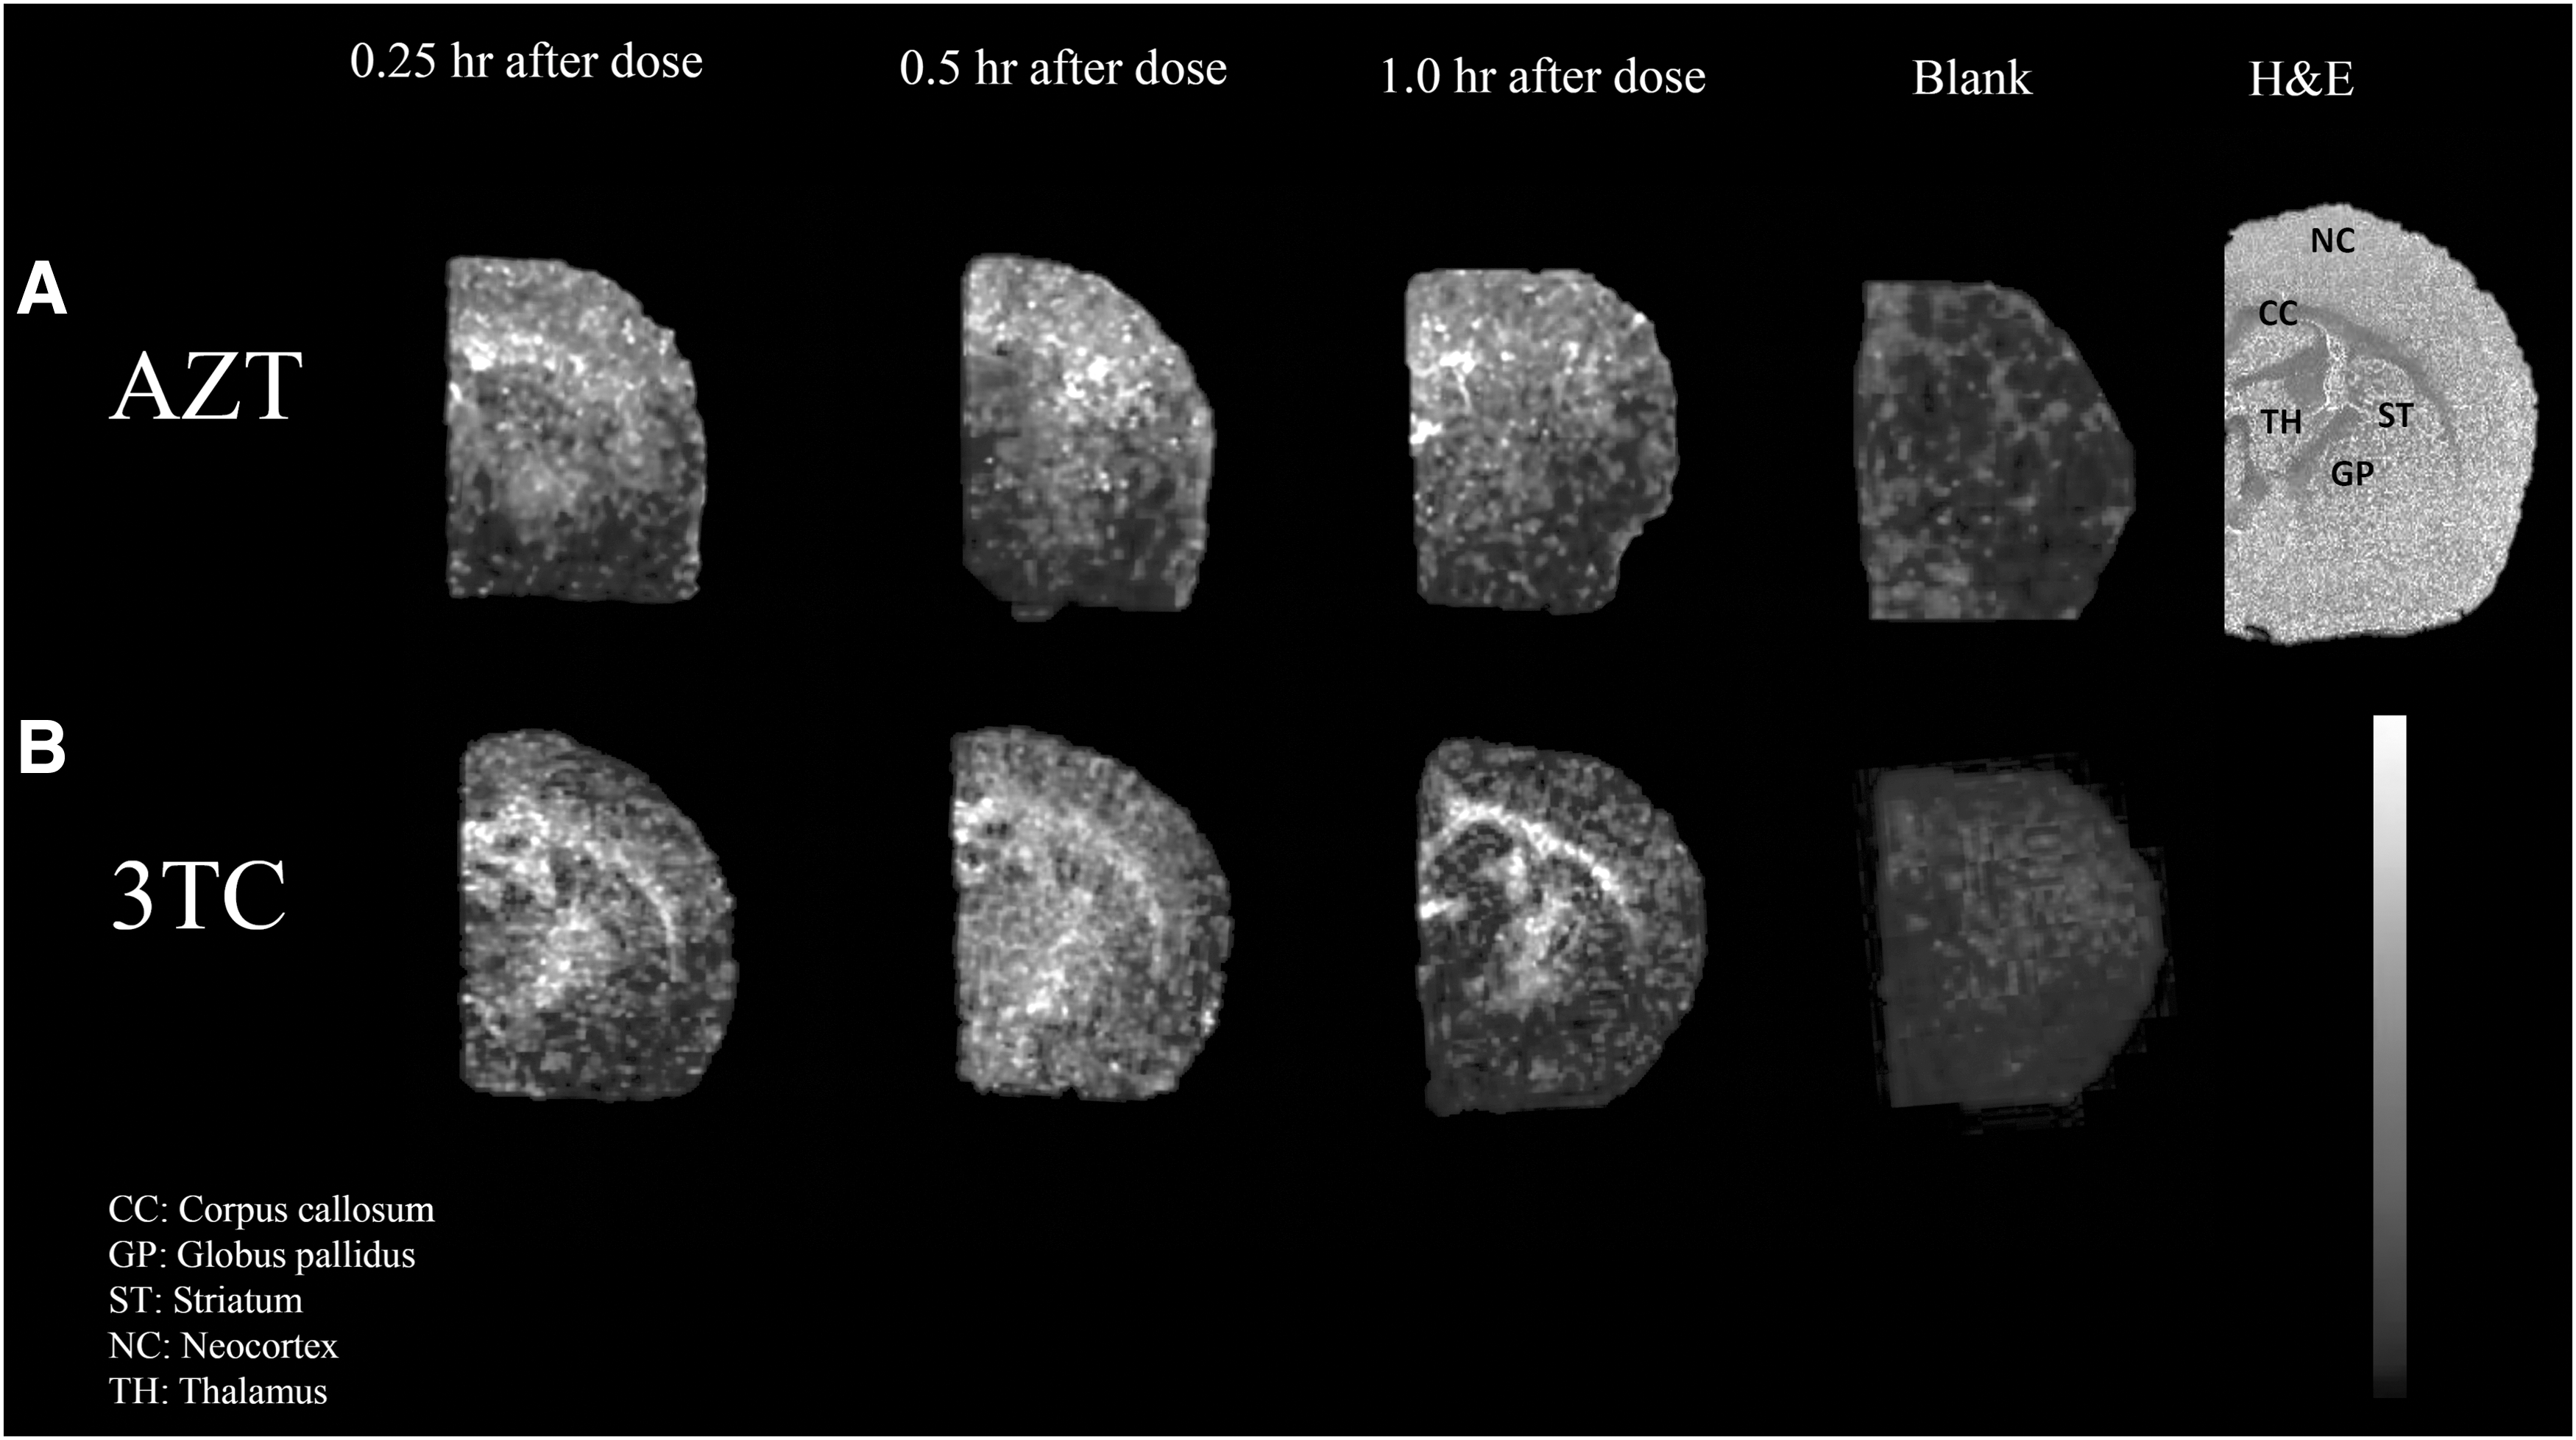
The reproducibility of MALDI MSI method developed for AZT and 3TC was confirmed after running the standards spotted on both the ground steel target and tissue sections. The precursor ions of AZT and 3TC were m/z 268.035 and 230.070, respectively. These precursor ions were monitored to visualize AZT and 3TC in brain tissue samples using the reflectron positive ionization mode as shown in Figure 3. These ions were monitored to understand the penetration and localization pattern of these two antiretroviral (ARV) HIV drugs in the rodent brain after 50 mg kg −1 i.p. dose of each drug. AZT and 3TC were detected with high ion intensity observed between 0.25, 0.5, and 1.0 h after single dose. The MSI images indicate that these ARVs can penetrate through the BBB, rapidly increasing in concentration from 0.25 h reaching C max at 0.5 h after single dose, before being gradually eliminated from the brain with low signal intensity displayed at 8 h.
AZT
Discussion
AZT and 3TC were administered i.p. with the aim of targeting HIV in plasma and in the brain. The pharmacokinetic parameters of AZT and 3TC were measured in both plasma and brain homogenate ( Figs. 1 and 2 , respectively). The plasma pharmacokinetic parameters after i.p. single administration of AZT and 3TC showed a plasma C max of 55,976 and 25,846 ng mL−1, respectively, with a time to peak concentration (T max) of 0.25 h in plasma and an area under the curve (AUC0-t) of 43,971 and 22,172 ng h mL−1, respectively, as shown in Table 3 and Figure 1. These values were well above the IC50 of AZT and 3TC, which are between 3.0–13.0 and 2.3–91.7 ng mL −1, respectively. 17,24,25 These findings can be compared to previous reports that showed a C max in plasma of 35,450 ng mL−1 of AZT and T max of 2 h with an AUC0-t of 58,740 ng h mL−1 after oral dose of 10 mg kg−1. 26 The CNS penetration of these drugs was explained by a previous study conducted by Elbirt et al., 1 wherein their findings showed that AZT has a good partition coefficient in cerebral tissue. Other studies have reported that penetration of AZT into the CSF is excellent even at low doses, which promoted to use this drug to treat and protect patients from HIV-related neurological diseases. 9,23,27 The studies also focused on 3TC, where it was specified that movement across the blood-CSF barrier was examined in an isolated choroid plexus model, which showed low CSF accumulation of 3TC when compared to AZT. 28 The brain pharmacokinetic parameters after i.p. single administration of AZT and 3TC showed a plasma C max of 692 and 272 ng mL−1, respectively; these C max values were found to be reported above for HIV MICs, IC50 of 3.0–13.0 and 2.3–91.7 ng mL −1 respectively, with a time to peak concentration (T max) of 0.5 h in brain and an AUC0-t of 1,428 and 967 ng h mL−1, respectively, as shown in Table 3 and Figure 2.
Chiang et al., 2 observed a 10%–15% selective pattern of brain deficits, using tensor-based morphometry, due to HIV/AIDS. The associated atrophy was identified in the white matter and the subcortical gray matter (putamen, globus pallidus, and thalamus, which are included in the white matter mask), medial and basal frontal lobes, and specific white matter tracts (corpus callosum, cingulum, and the posterior limb of the internal capsule). The report by Chiang et al. also added that brain atrophy was most severe (∼15%–20% loss) in the primary and association sensorimotor areas; however, the temporal lobes were relatively spared. 2 In this study, we were interested in determining if the AZT and 3TC combination could localize in these brain regions that are known to cause neurodegeneration. Figures 3 and 4 show MSI image of coronal brain sections of AZT- and 3TC-treated animals. AZT and 3TC showed localization in the corpus callosum and associated subcortical white matter, hippocampal formation, globus pallidus, striatum, thalamus, corticofugal pathways, and neocortex. The AZT and 3TC drug localization patterns indicate that the brain may be protected from severe tissue loss that was visualized in the white matter region if patients are treated with combivir. 2 The effectiveness of ARVs against CNS-HIV is dependent on the ability of the drug to reach HIV-infected target cells in the brain such as macrophages and microglia. 27 Studies also mentioned that HIV-infected children treated with AZT showed much greater improvements in neurobehavioral and adults who were treated with higher AZT dose were found to have greater neuropsychological improvements. 23,28,29 These results shows that, based on the AZT and 3TC brain localization, this combination can be considered for treatment patients who are HIV positive with the aim of protecting against on HAND; however, supplementation with a drug that is able to localize in the neocortex is advised as this will provide added protection.
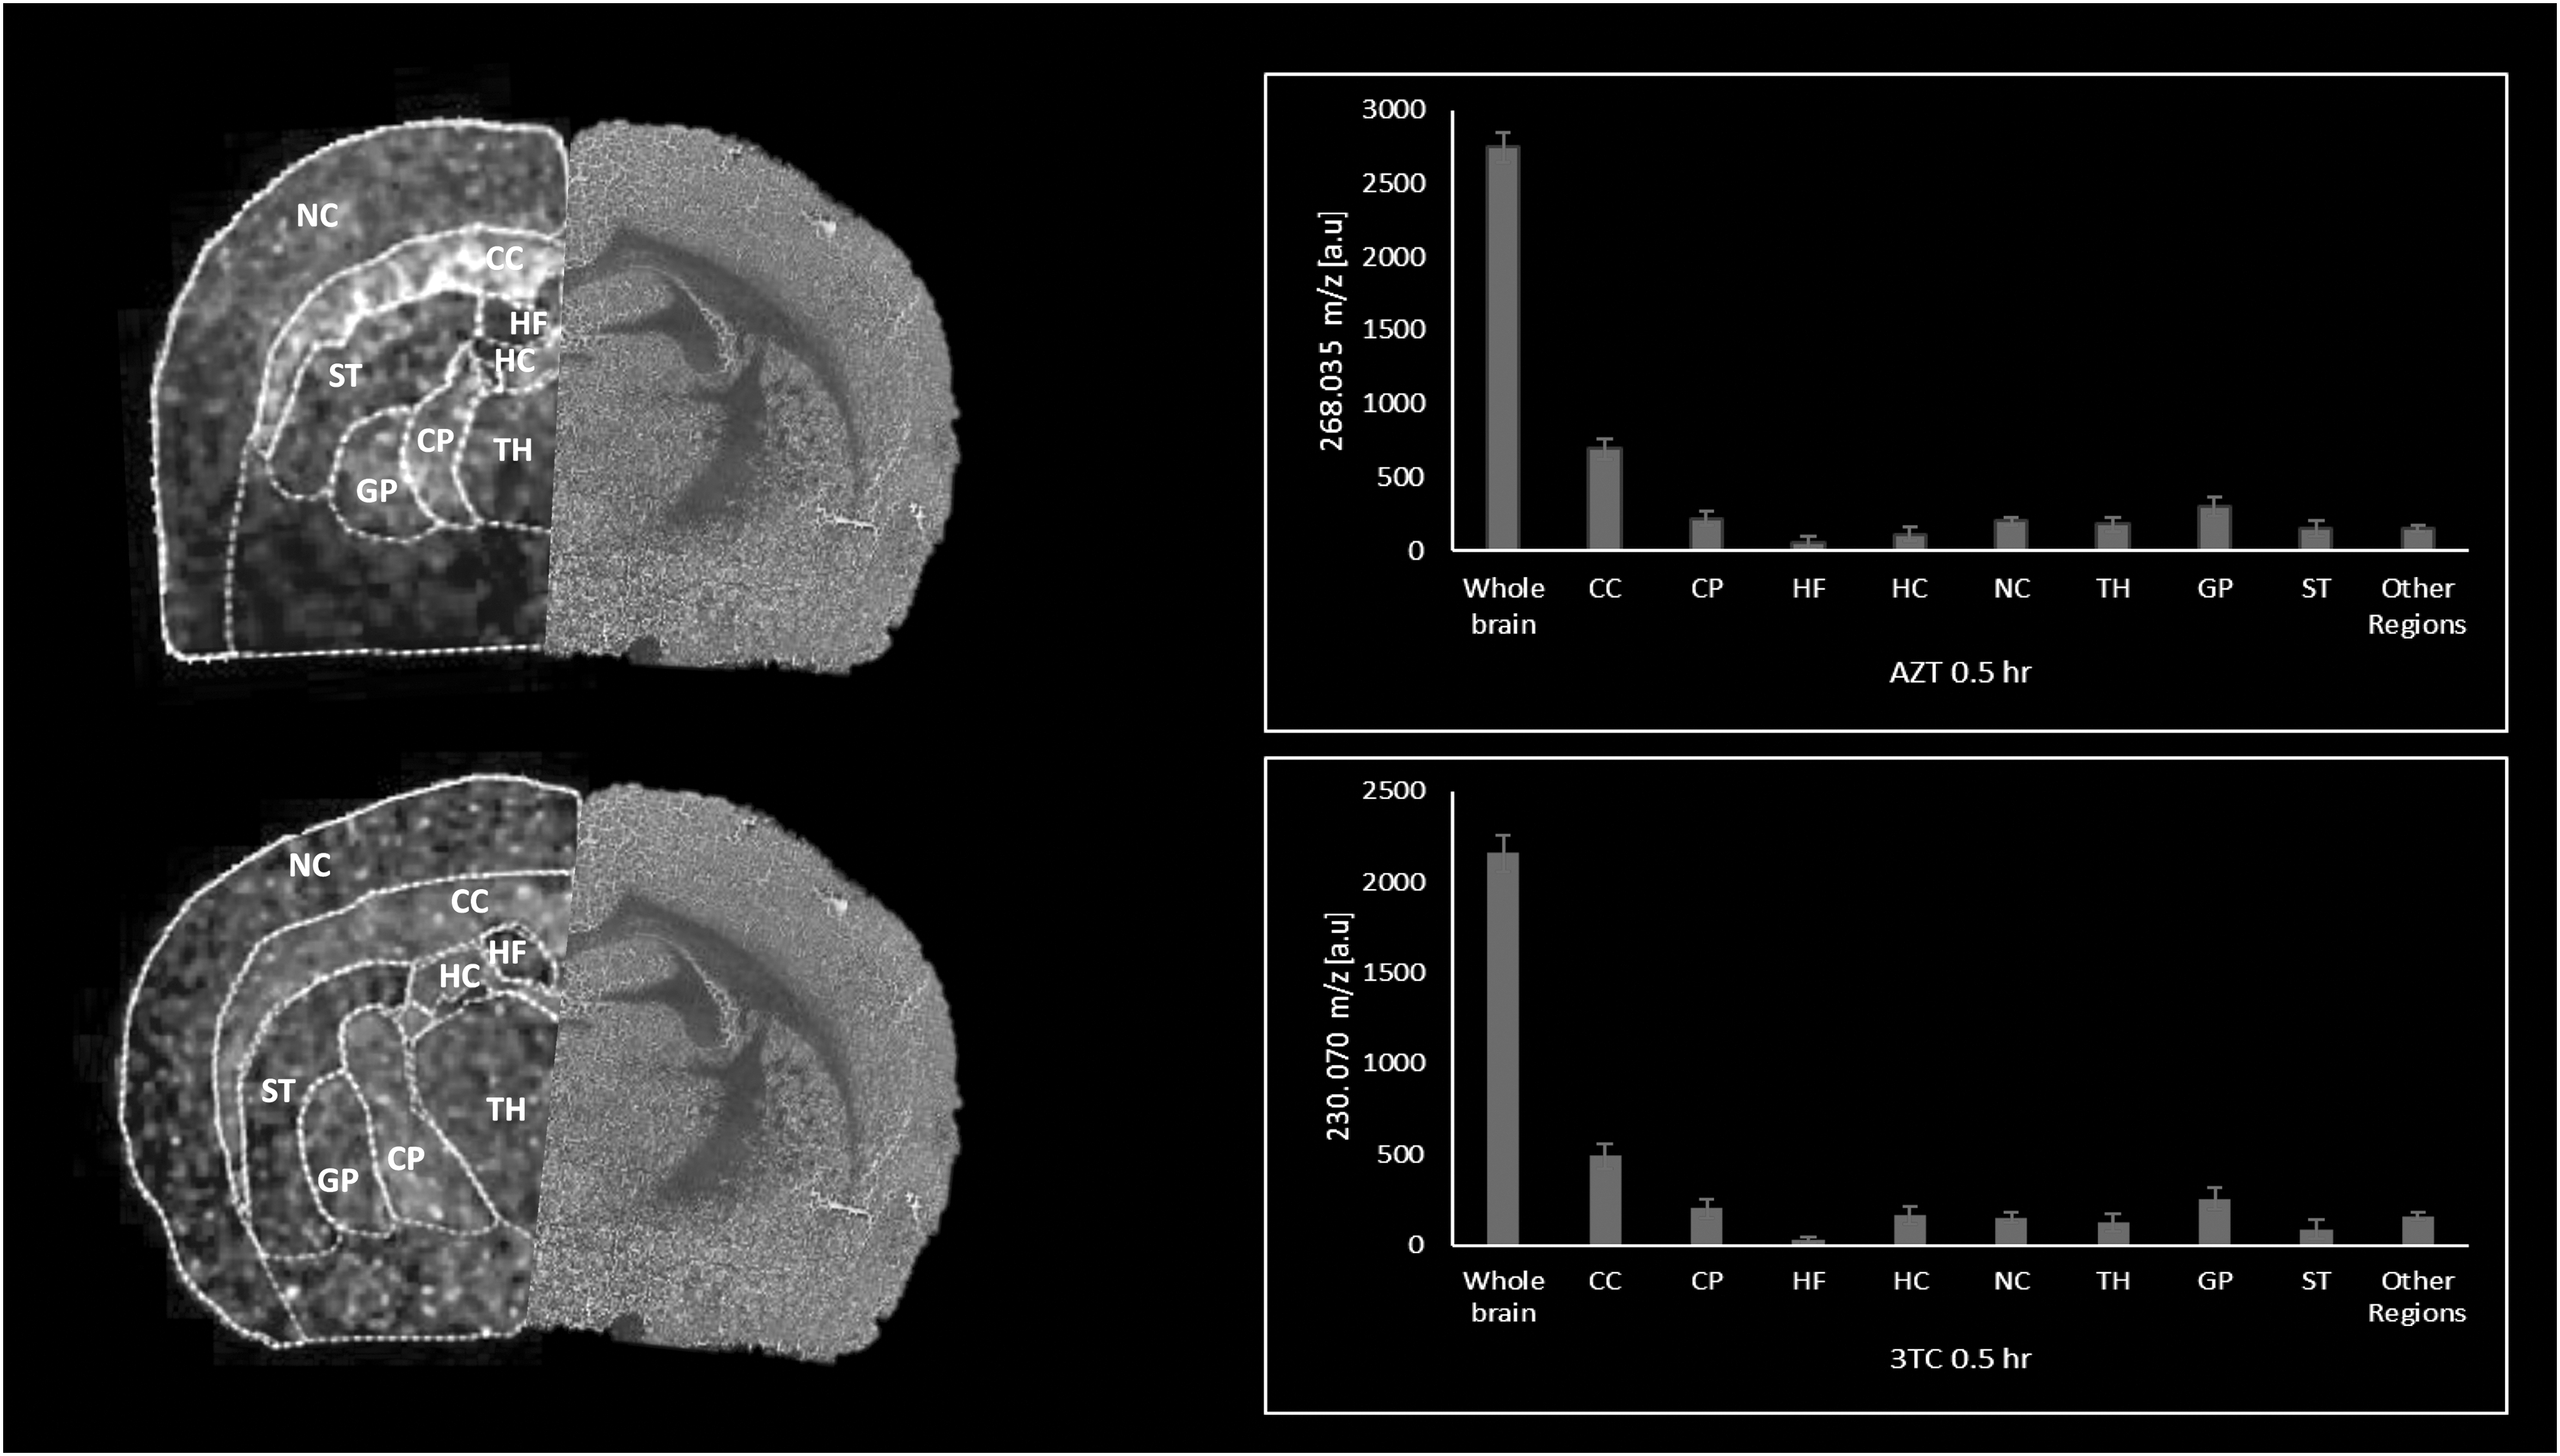
Ion distribution images of AZT and 3TC in brain section using MALDI-imaging dataset. ROIs were used to estimate drug ion abundance in each brain compartment compared to the whole brain tissue. AZT and 3TC were present in large amounts in the corpus callosum (CC), globus pallidus (GP), neocortex (NC), thalamus (TH), striatum (ST), and CP (corticofugal pathways). AZT and 3TC were moderate in HF (hippocampal formation) and fimbria of the hippocampus (HC). AZT was found to be in low concentrations in the basal forebrain region. MALDI, matrix-assisted laser desorption/ionization.
Conclusions
LC-MS/MS and MSI were used to demonstrate that AZT and 3TC drugs penetrate well in CNS and localize in brain regions that are known to be susceptible to HIV neurodegeneration. This study reveals that HIV-infected patients who have symptoms of neurocognitive disorder could be treated with the AZT and 3TC cocktail since both of these ARTs have good CNS penetration and are able to localize in some of the areas known to undergo neurodegeneration, which may offer protection in the brain. However, it is strongly recommended that another anti-HIV, which is able to localize in the cortical regions of the brain, be identified and co-administered to offer increased protection of the CNS.
Footnotes
Acknowledgments
The authors wish to acknowledge Biomedical Research Unit located in University of KwaZulu-Natal, technical team for the support during animal experiments.
Disclosure Statement
No competing financial interests exist.
Funding Information
The authors wish to thank National Research Foundation (NRF, SA), Aspen Pharmacare, South African Medical Research Council (SAMRC) and the University of KwaZulu-Natal (Durban, South Africa), for financial support.
Supplementary Material
Supplementary Data
Supplementary Figure S1
Supplementary Figure S2
Supplementary Figure S3
Supplementary Figure S4
Supplementary Figure S5
Supplementary Figure S6
Supplementary Figure S7
Supplementary Figure S8
Supplementary Figure S9
Supplementary Figure S10
Supplementary Table S1
Supplementary Table S2
Supplementary Table S3
Supplementary Table S4