
Abstract
The Rab27 subfamily consists of Rab27a/b isoforms that have similar but not identical functions. Those functions include the regulation of trafficking, docking, and fusion of various lysosome-related organelles and secretory granules; such as melanosomes in melanocytes and lytic granules in cytotoxic T lymphocytes. Rab27a/b exert their specific and versatile functions by interacting with 11 effector proteins, preferentially in their GTP-bound state. In recent years, a number of studies have identified roles for Rab27 proteins and their effectors in cancer cell invasion and metastasis, immune response, inflammation, and allergic responses. These findings suggest that Rab27–effector protein interaction inhibitors could contribute to the development of effective strategies to treat these diseases. To facilitate inhibitor identification, in this study we developed a fluorescence resonance energy transfer-based protein–protein interaction assay that reports Rab27–effector interactions. Green fluorescent protein (GFP)-mouse (m) synaptotagmin-like protein (Slp)1 and GFP-mSlp2 (N-terminus Rab27-binding domains) recombinant proteins were used as donor fluorophores, whereas mCherry-human (h) Rab27a/b recombinant proteins were used as acceptor fluorophores. The in vitro binding affinity of mSlp2 to Rab27 was found to be higher compared with mSlp1 and was evidenced by the effective concentration 50 value differences (mSlp2-hRab27b = 0.15 μM < mSlp2-hRab27a = 0.2 μM < mSlp1-hRab27a = 0.32 μM < mSlp1-hRab27b = 0.33 μM). The specificity of the assay was assessed using unlabeled rat (r) Rab27a and hRab27b recombinant proteins as typical competitive inhibitors for Rab27–effector interactions and was evidenced by the inhibitory concentration 50 value differences. Accordingly, this in vitro assay can be employed in identification of candidate inhibitors of Rab27–effector interactions.
Introduction
Rab27a/b small GTPases play an essential role in the regulation of exocytosis of various secretory vesicles or granules in the cell by interacting with their cognate effectors, preferentially in their GTP-bound state, thereby exerting their specific functions. 1 –3 The current literature suggests that Rab27a/b proteins control cancer cell invasion and proliferation in different tumors. 4 –10 Accordingly, the interaction of Rab27a/b with their effectors might play a considerable role in cancer pathogenesis and by inhibition of those interactions, the subsequent signaling pathways that might regulate cancer cell invasion and proliferation can be blocked.
For these reasons, the focus of this study was to identify candidate inhibitors of Rab27–effector interactions to block the cancer-regulating intracellular signaling pathways. Although, a lot of research and efforts have been performed in this area, the identification of Rab27 inhibitors is still an early and promising approach for the treatment of cancer. Therefore, there is a necessity to develop and design in vitro and cellular assays to determine the Rab27–effector interactions which can be used further for testing the effects of the candidate inhibitors of these interactions. For instance, one of the early approaches to test the effects of the candidate Rab27 inhibitors was based on the use of the already established cellular melanosome clustering assay. 11 In another study, the identification of Rab27–effector interaction inhibitors was based on developing a time-resolved fluorescence resonance energy transfer (FRET) assay using two libraries of small-molecule inhibitors, resulting in discovery of neutrophil exocytosis inhibitors (Nexinhibs). 12 However, in vitro FRET assays are as important as FRET assays performed under physiological conditions as effective concentration 50 (EC50) values of the interacting components and the inhibitory concentration 50 (IC50) values of the candidate inhibitors can be determined accurately using in vitro FRET-based assays.
There are 11 Rab27 effectors in human and mouse. 13,14 These effector proteins can be subclassified structurally into three major groups. The Slp family 15 and rabphilin3-a 16,17 represents the first group. Five distinct Slp proteins: Slp1, Slp2-a, Slp3-a, Slp4-a/b, and Slp5 have been identified in mammals. 18 –20 The second group of Rab27 effector proteins comprises the Slp homolog lacking C2 domain (Slac2) family (Slac2-a, Slac2-b, and Slac2-c) 15,21 –26 and Noc2. 16,17 Munc13-4 only represents the third group of Rab27 effector proteins as the Rab27-binding domain (RBD) differs from that of Slp and Slac2 families. 27 –29 Additionally, Coronin 3 has been identified recently as a Rab27-GDP-binding partner, and found to have distinct regulatiory functions of insulin secretory membrane endocytosis, promoting F-actin assembly in pancreaticβ cells. 30 –32
Rab27 and its effectors are key regulators of various intracellular secretory functions, therefore any defect in those functions is often associated with diseases. Griscelli syndrome (GS) is the most well-documented Rab27-related disease. 33 Mutations within the MYO5A gene encoding myosin-Va motor protein causes GS type I 34 and is manifested by albinism and neurological, but no immunological defects. 35 This type of GS is the human equivalent to the dilute mouse model. 36 Whereas, mutations in the gene encoding Rab27a leads to GS type II, causing albinism, immune deficiency and some neurological defects. 37 –39 GS type II is similar to the ashen mouse model. 40 Mutations within the MLPH gene encoding melanophilin/Slac2-a effector protein causes GS type III and is manifested by only albinism without any neurological or immunological defects. 41,42 GS type III is the human equivalent to the leaden mouse model. 22
Two of Rab27 effectors (Slp1 and Slp2) were chosen to be produced and tested in terms of binding to Rab27, as the three-dimensional structure of the interface of interaction between Slp2 and Rab27a has been identified, 43 and both Slp1/Slp2-a effectors are structurally related. 18
To achieve this goal, the principle of the FRET was exploited and used to establish and develop a protein–protein interaction assay. By definition, the FRET involves excitation of a donor fluorophore; this is followed by nonradiative energy transfer from the donor to the acceptor fluorophore; the excitation wave length of the acceptor should be within the emission wave length of the donor. 44,45 Furthermore, better selection of the donor and acceptor fluorophores is a key determinant of the FRET assay efficacy and specificity. Fluorescent proteins, organic dyes, and quantum dots represent the main fluorophore classes that can be used in FRET assays. The main advantage of the fluorescent proteins over organic dyes and quantum dots is that the fluorescent proteins are easily genetically engineered and attached to the interacting components without involving chemical labeling or antibodies. 46,47 In addition, using of the fluorescent proteins ensures that both the fluorophore and the host protein are found in a 1:1 ratio and more consistent results could be obtained, whereas upon chemical labeling of the interacting proteins, a uniform chemical labeling cannot always be assured, 48 which affects the consistency and accuracy of the results.
FRET-based assays have been used for many years for determining protein–protein interactions in cells using fluorescent recombinant proteins. 49 In addition, many protein–protein interactions have been determined in vitro using FRET-based techniques, for example excitation of Cy3-labeled Annexin A2 (donor), a Ca2+ and phospholipid-binding protein and its binding protein Cy5-labeled S100A10 (acceptor) at 488 nm resulted in producing significant FRET signals at 670 nm, thereby determining the binding affinity. 50
To establish a FRET-based protein–protein interaction assay, green fluorescent protein (GFP)-Rab27 effector proteins (mouse synaptotagmin-like protein [mSlp]1 and mSlp2) were used as donor fluorophores, whereas mCherry-hRab27a/b recombinant proteins were used as acceptor fluorophores. The excitation–emission spectra of these fluorophores overlap, thus they were appropriate and efficient FRET fluorophores as described below. In this study, the enhanced GFP protein (F64L, S65T GFP variant) was used instead of the wild-type GFP as the fluorescence intensity of this GFP variant is 30-fold higher than the wild-type GFP and these mutations increase protein expression, folding, and solubility in bacteria over the wild type. 51,52 Remarkably, the excitation–emission spectra analysis of the enhanced GFP protein demonstrated that maximum excitation and emission occur at 470–475 nm and 509 nm, respectively, with an additional shoulder at 550 nm. 53
In the current FRET-based assay experiments, mCherry protein was used as an acceptor fluorophore due to its high photostability and fluorescence intensity advantages over many acceptor fluorophores. 54 Furthermore, excitation of mCherry at 450–625 nm (maximum at 575 nm) resulted in an emission at 575–700 nm (maximum at 610 nm). 55 Accordingly, it was supposed that FRET could occur upon excitation of mCherry at 562.5–577.5 nm. GFP emission spectrum overlaps with mCherry excitation spectrum at the shoulder of GFP emission spectrum as the excitation wave length of mCherry is within this range. Therefore, GFP-fused effector proteins were used as donor fluorophores (GFP-mSlp1and GFP-mSlp2) and mCherry-hRab27a/b recombinant proteins were used as acceptor fluorophores (Fig. 1).
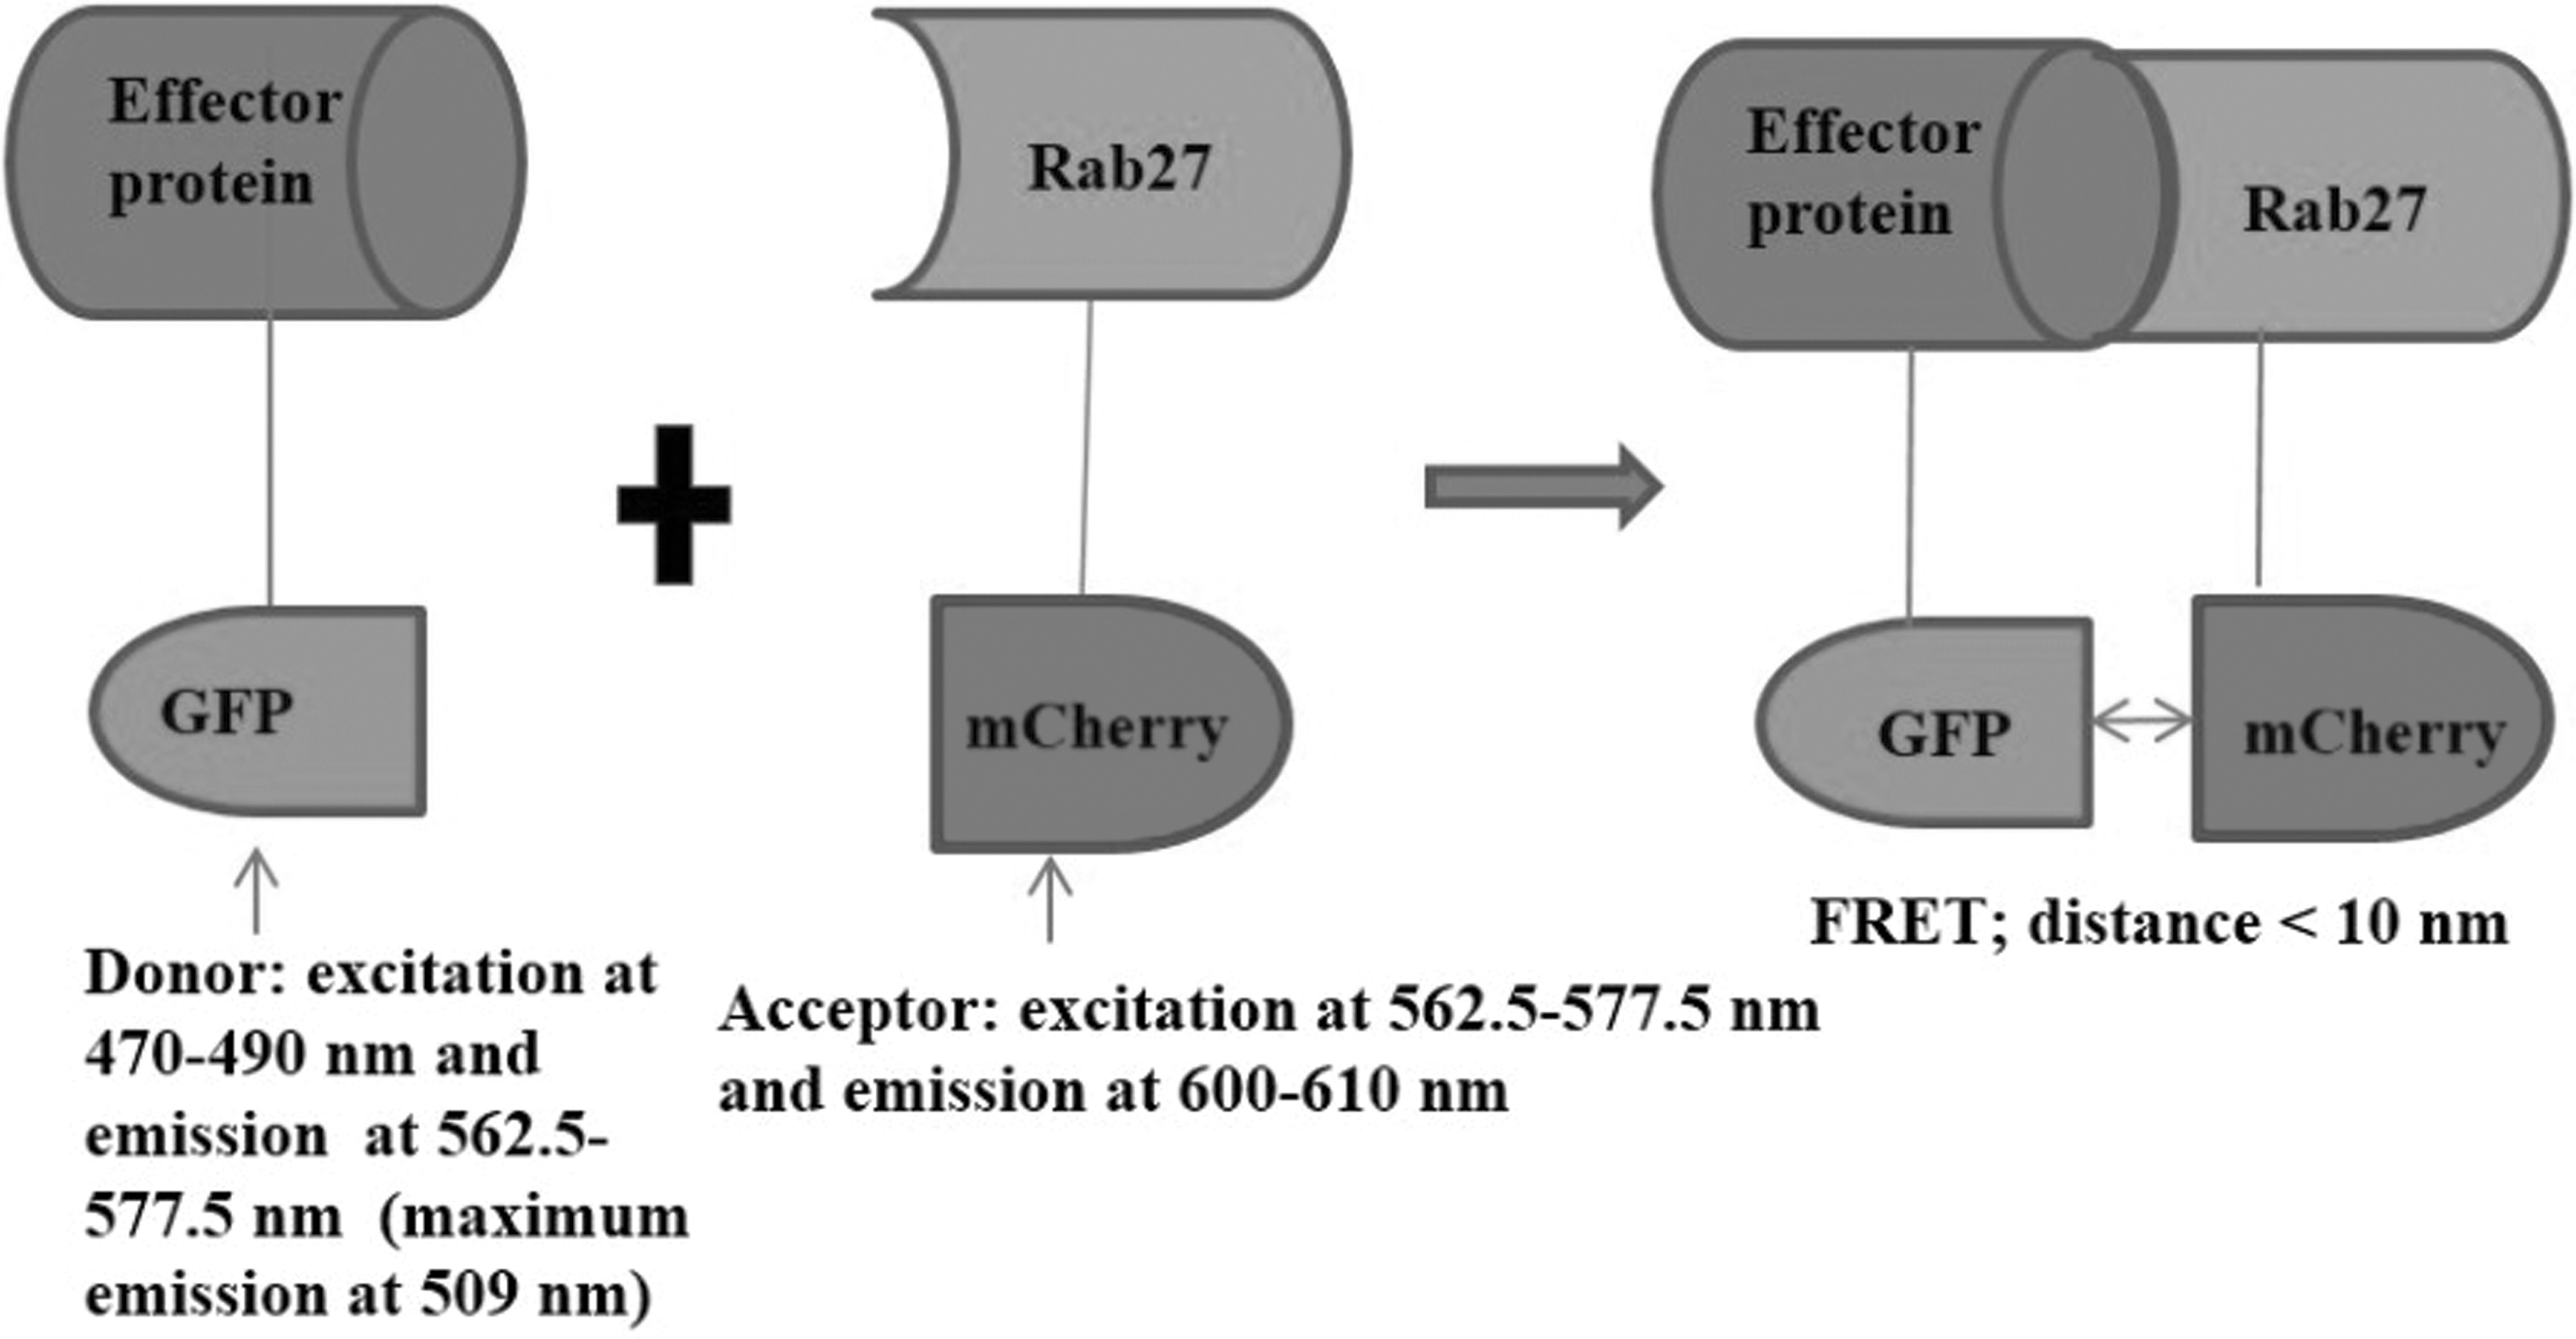
A schematic representation of the FRET-based protein–protein interaction assay. Upon binding of GFP-effector protein and mCherry-Rab27, a complex will be formed (GFP-effector protein-mCherry-Rab27 complex). Then, upon excitation of the donor fluorophore GFP-effector protein at 470–490 nm, emission of light occurs at 562.5–577.5 nm, this excites the acceptor fluorophore (mCherry-Rab27) (if the binding components come close to each other and the distance between them is <10 nm) at this wave length which in turn emits light at 600–610 nm, indicating FRET occurrence. FRET, fluorescence resonance energy transfer; GFP, green fluorescent protein.
The premier aims of this study were to validate and optimize the conditions of the FRET-based protein–protein interaction assay. These involved choosing the appropriate fluorescence microplate reader, optimizing the concentration of GTP, incubation time, and fixing the concentration of the acceptor protein. Accordingly, this assay was used to determine the binding affinity of mSlp1 and mSlp2 effector proteins to Rab27a/b (by determining the EC50 of binding). In addition, to confirm the specificity of the assay, unlabeled Rab27a/b was used as a typical competitive inhibitor for Rab27–effector protein interaction. This provides the basis for identifying and testing the effects of the candidate inhibitors of Rab27–effector protein interactions in the future, including the small molecule and peptide inhibitors by comparing the IC50 values of those candidate inhibitors.
Materials and Methods
Generation of plasmid constructs
For production of mCherry-hRab27b-expressing vector, which allows the synthesis of fragment of hRab27b fused at the C-terminus of mCherry, hRab27b-(1–218; T23N) coding sequence was PCR amplified using a pEGFP-hRab27b-(1–218; T23N) mammalian expression vector to incorporate NotI restriction sites into the 5′ and 3′ ends of hRab27b. A Quikchange site-directed mutagenesis was performed using the pETDuet-1-mCherry-hRab27a vector to incorporate a NotI restriction site into the 5′ end of hRab27a; this vector originally contained a NotI restriction site at the 3′ end of hRab27a. The digested PCR product (hRab27b 1–218; T23N) was then subcloned into the digested pETDuet-1-mCherry-hRab27a vector to produce pETDuet-1-mCherry-hRab27b-(1–218; T23N) vector. A Quikchange site-directed mutagenesis was performed using the pETDuet-1-mCherry-hRab27b-(1–218; T23N) vector to remove the T23N mutation and produce a wild hRab27b.
To produce a C-terminus truncated hRab27b-(1–200), a Quikchange site-directed mutagenesis was performed using the pETDuet-1-mCherry-hRab27b-(1–218) vector as a template by inserting a stop codon after amino acid (aa) 200 of hRab27b. pETDuet-1-GFP-mSlp1-(1–116) vector was generated by site-directed mutagenesis of the pETDuet-GFP-mSlp1-(1–116)-mCherry-hRab27a vector.
In addition, the pETDuet-1-GFP-mSlp2-(3–80) vector was generated by PCR amplification of GFP-mSlp2-(3–80) cDNA using the pENTR-EGFP-mSlp2-(3–80) vector (the generation steps of this vector can be given upon request). BamHI and NotI restriction enzyme sites were introduced into the 5′ and 3′ ends of GFP-mSlp2-(3–80) cDNA, respectively. The digested GFP-mSlp2-(3–80) was then subcloned into the digested pETDuet-1 vector (Novagen) using the 5′ BamHI and 3′ NotI restriction sites.
The pETDuet-1-GFP vector was generated using the pETDuet-1-GFP-mSlp1-(1–116) vector (mentioned before) as a template to perform a site-directed mutagenesis. pET-14b-rat (r) Rab27a-(1–221), 56 pET-15b-hRab27b-(1–218), 57 and pET-14b-hRab5a-(1–216) 21,58,59 were used to produce unlabeled rRab27a-(1–221), hRab27b-(1–218), and hRab5a-(1–216) proteins.
A diagnostic restriction endonuclease digestion using appropriate restriction enzymes was performed for each construct, followed by performing 1% agarose gel electrophores, then visualized using a Gel Doc (Syngene).
Sequences fidelity of clones were confirmed by DNA sequencing performed by Source BioScience (Nottingham, United Kingdom). All the PCR primers used in this study were synthesized by Sigma-Aldrich and primer sequences are available upon request.
Preparation of recombinant proteins
Small-scale protein induction was performed to optimize the protein induction conditions; such as the incubation time, temperature, and the optimum isopropyl β-
Subsequently, bacterial cells were harvested and cell pellets stored at −80°C to be used for subsequent protein purification. The induced cell pellets were resuspended in ice-cold lysis buffer: 50 mM Tris-HCl pH 7.5, 150 mM sodium chloride, 5 mM magnesium chloride, 1 mM β-mercaptoethanol (BME; Sigma), and one protease inhibitor cocktail tablet/10 mL (Roche). The cell lysates were further lysed mechanically at 35 kilo-pound-force per square inch using high-pressure cell disruptor (CONSTANT SYSTEMS Ltd.), followed by centrifugation (using SW 41 Ti Rotor; Beckman Coulter) at 100,000 g for 1 h at 4°C. The supernatant was then adjusted to 500 mM sodium chloride and purified using the immobilized metal affinity chromatography system. In this system, the supernatant was mixed with a thoroughly washed nickel sepharose beads in the dialysis buffer (50 mM Tris-HCl pH 7.5, 500 mM sodium chloride, 5 mM magnesium chloride, and 1 mM BME) and incubated at 4°C for 2–16 h.
The supernatantnickel sepharose beads mixture was then centrifuged at 2,000 rpm for 3 min at 4°C and washed with dialysis buffer; this was repeated at least three times. The supernatant nickel sepharose beads mixture was then resuspended in a sufficient volume of dialysis buffer, poured into a poly-prep chromatography column (Bio-Rad). The column was then washed several times with dialysis buffer to discard the nonspecifically bound proteins to the nickel column; the flow-through was collected and kept to be analyzed later. Subsequently, increasing concentrations of imidazole (20, 50, 100, 200, and 250 mM) in dialysis buffer at pH 8 were used to displace protein from binding to nickel beads (the flow-through using 20 mM imidazole was discarded to remove low-affinity-bound proteins).
The eluates were then collected and the presence of proteins was tested using Coomassie protein assay reagent (ThermoScientific). The successful protein eluates were then dialyzed using 12–14 or 3.5 kDa molecular weight cutoff visking dialysis tubing (Medicellmembranes) in a 2 L dialysis buffer at 4°C for 16–18 h. To purify Rab proteins, 0.21 g GDP (Alfa Aesar) was added to the dialysis buffer to keep them in the GDP-bound inactive state as they possess intrinsic GTPase activity; that is, stabilizing them. 59 A further dialysis step was then performed using a new 2 L dialysis buffer for 4 h under the same conditions. The purified protein was then collected from the dialysis tube and quantified using the NanoDrop 2000 spectrophotometer as described later.
Protein separation
To separate proteins, 10% (v/v) sodium dodecyl sulphate/polyacrylamide gel electrophoresis (SDS-PAGE) was used. Gels were casted using the Mini-PROTEAN Tetra Cell (Bio-Rad) system and placed in the Mini-PROTEAN Tetra Cell tank (Bio-Rad). Protein samples were loaded into 10% (v/v) SDS-PAGE gel and electrophoresed at 40 mA per gel until complete separation of the molecular weight standards; BLUeye Prestained Protein Ladder (Geneflow) was used as a molecular weight standard. This was followed by either transferring into polyvinylidene difluoride (PVDF) membrane for western blot analysis or staining with Instant Blue Protein Stain (Expedeon) to be visualized later.
Western blot analysis
To transfer proteins, immobilon-P PVDF transfer membrane (0.45 μm) was used. After transfer completion, the membrane was then blocked with 1 × phosphate-buffered saline (PBS), 0.1% Tween-20, and 5% skimmed milk for 1 h at room temperature. This was followed by incubation with primary antibody using 1 × PBS and 0.1% Tween-20 for 16 h at 4°C. The membrane was then washed 3 × with 1 × PBS and 0.1% Tween-20. Subsequently, the membrane was incubated with the appropriate secondary antibody in 1 × PBS and 0.1% Tween-20 for 1 h at room temperature. The washing steps for the primary antibody were repeated.
Antibodies
Primary antibodies: goat anti-mCherry (Sicgen), mouse anti-poly-histidine (Sigma-Aldrich) and goat anti-GFP (Sicgen) were used at 1:1,000 dilutions for immunoblot. Secondary antibodies were used at the following dilutions: donkey anti-goat IR800 (Licor); 1:30,000 and donkey anti-mouse IR680 (Licor); 1:10,000.
Imaging
The Licor Odyssey instrument was used to visualize SDS-PAGE gels and PVDF membranes. Image Studio Ver 3.1 software was used to acquire images.
Determination of protein concentrations
Protein concentrations were measured using the Thermo Scientific NanoDrop 2000 spectrophotometer. The absorbance measurements for the purified proteins were performed at 280 nm using the molecular weight and extinction coefficient of the quantified proteins, which were measured using the expasy online tool for protein molecular weight determination.*
Mass spectrometry analysis
Proteomic analysis of mCherry-hRab27b recombinant protein using mass spectrometry was performed by Dr. David Tooth (Center for Biomolecular Sciences, University of Nottingham).
Sequence alignments
CLC Sequence Viewer 7.7.1 was used to generate protein amino acid sequence alignments. In addition, the blastx tool in the National Center for Biotechnology Information site † was used to translate nucleotide sequences into the corresponding protein amino acid sequences to be compared with protein databases.
In vitro FRET-based protein–protein interaction assay
GFP-mSlp1-(1–116) and GFP-mSlp2-(3–80) recombinant proteins were used as donor fluorophores, whereas mCherry-hRab27a/b recombinant proteins were used as acceptor fluorophores. A 96-well microplate (Thermo Fisher Scientific; clear, flat bottom) was used to incubate the reaction mixture (the donor and the acceptor fluorophores) using 1 × dilution buffer (50 mM Tris-HCl pH 7.5, 150 mM sodium chloride, 1 mM dithiothreitol, and 1% bovine serum albumin [BSA]) and 3 mM GTP in a total reaction volume of 100 μL at room temperature for 2 h. In addition, another set of reactions containing the donor and acceptor fluorophores as individual components was incubated using the same conditions and the FRET was calculated as described below.
To quench the effect of GTP and BSA fluorescence on the FRET signals, another set of reactions was incubated using the same reaction conditions without using any fluorophore. Samples were excited at 470–490 nm (excitation wave length of the donor fluorophore; GFP-Rab27 effector protein) and the emission of light was measured at 600–610 nm (the emission wave length of the acceptor fluorophore; mCherry-hRab27a/b). The control software was used to interface with the CLARIOstar (BMG Labtech) microplate reader and the MARS Data Analysis Software was used to acquire the data.
The corrected fluorescence was calculated in arbitrary units by subtracting the sum of the fluorescence emission of the individual components of the mixture (GFP and mCherry alone) from that for the reacting components (when present in the same reaction mixture). In addition, the fluorescence of the whole 96-well plate was normalized against the fluorescence of BSA and GTP by subtracting the fluorescence of the buffer and GTP mixture from each well.
Statistical analysis
Statistical data analysis was performed using Microsoft excel-2016 and GraphPad Prism-7. Unpaired t-test and both one- and two-way analysis of variance were used to test significant differences where indicated. The nonlinear regression was used to generate dose/response sigmoid curves and EC50 values were calculated accordingly. IC50 values were calculated by setting the bottom and top constraints to constant values of 0.0 and 100.0, respectively, unless otherwise indicated. Statistical differences were determined as follows: ns p > 0.05 was considered as nonsignificant, *p ≤ 0.05, **p ≤ 0.01, ***p ≤ 0.001, and ****p ≤ 0.0001.
Results
Slp1 and Slp2 have different binding affinities to Rab27
Rab27 and effector proteins (Slp1 and Slp2) were fused to the C-terminus of mCherry and GFP proteins, respectively, in these FRET-based assay experiments (Figs. 2 –6).

Production of 6 × Histidine-mCherry-hRab27b-(1–218) and the 6 × Histidine-mCherry-hRab27b-(1–200) recombinant proteins. Rosetta Escherichia coli-competent cells were transformed with the appropriate vectors and protein production was induced using 0.5 mM IPTG for 3 h at 37°C. Then proteins are collected and purified as described in the section “Materials and Methods”. Abundant protein bands (the arrows indicate bands) were detected at the predicted molecular weight for the 6 × Histidine-mCherry-hRab27b-(1–218) (55.3 kDa) and the 6 × Histidine-mCherry-hRab27b-(1–200) (55.28 kDa) recombinant proteins using an instant blue-stained 10% SDS-PAGE gel. SDS-PAGE, sodium dodecyl sulfate/polyacrylamide gel electrophoresis; IPTG, isopropyl β-
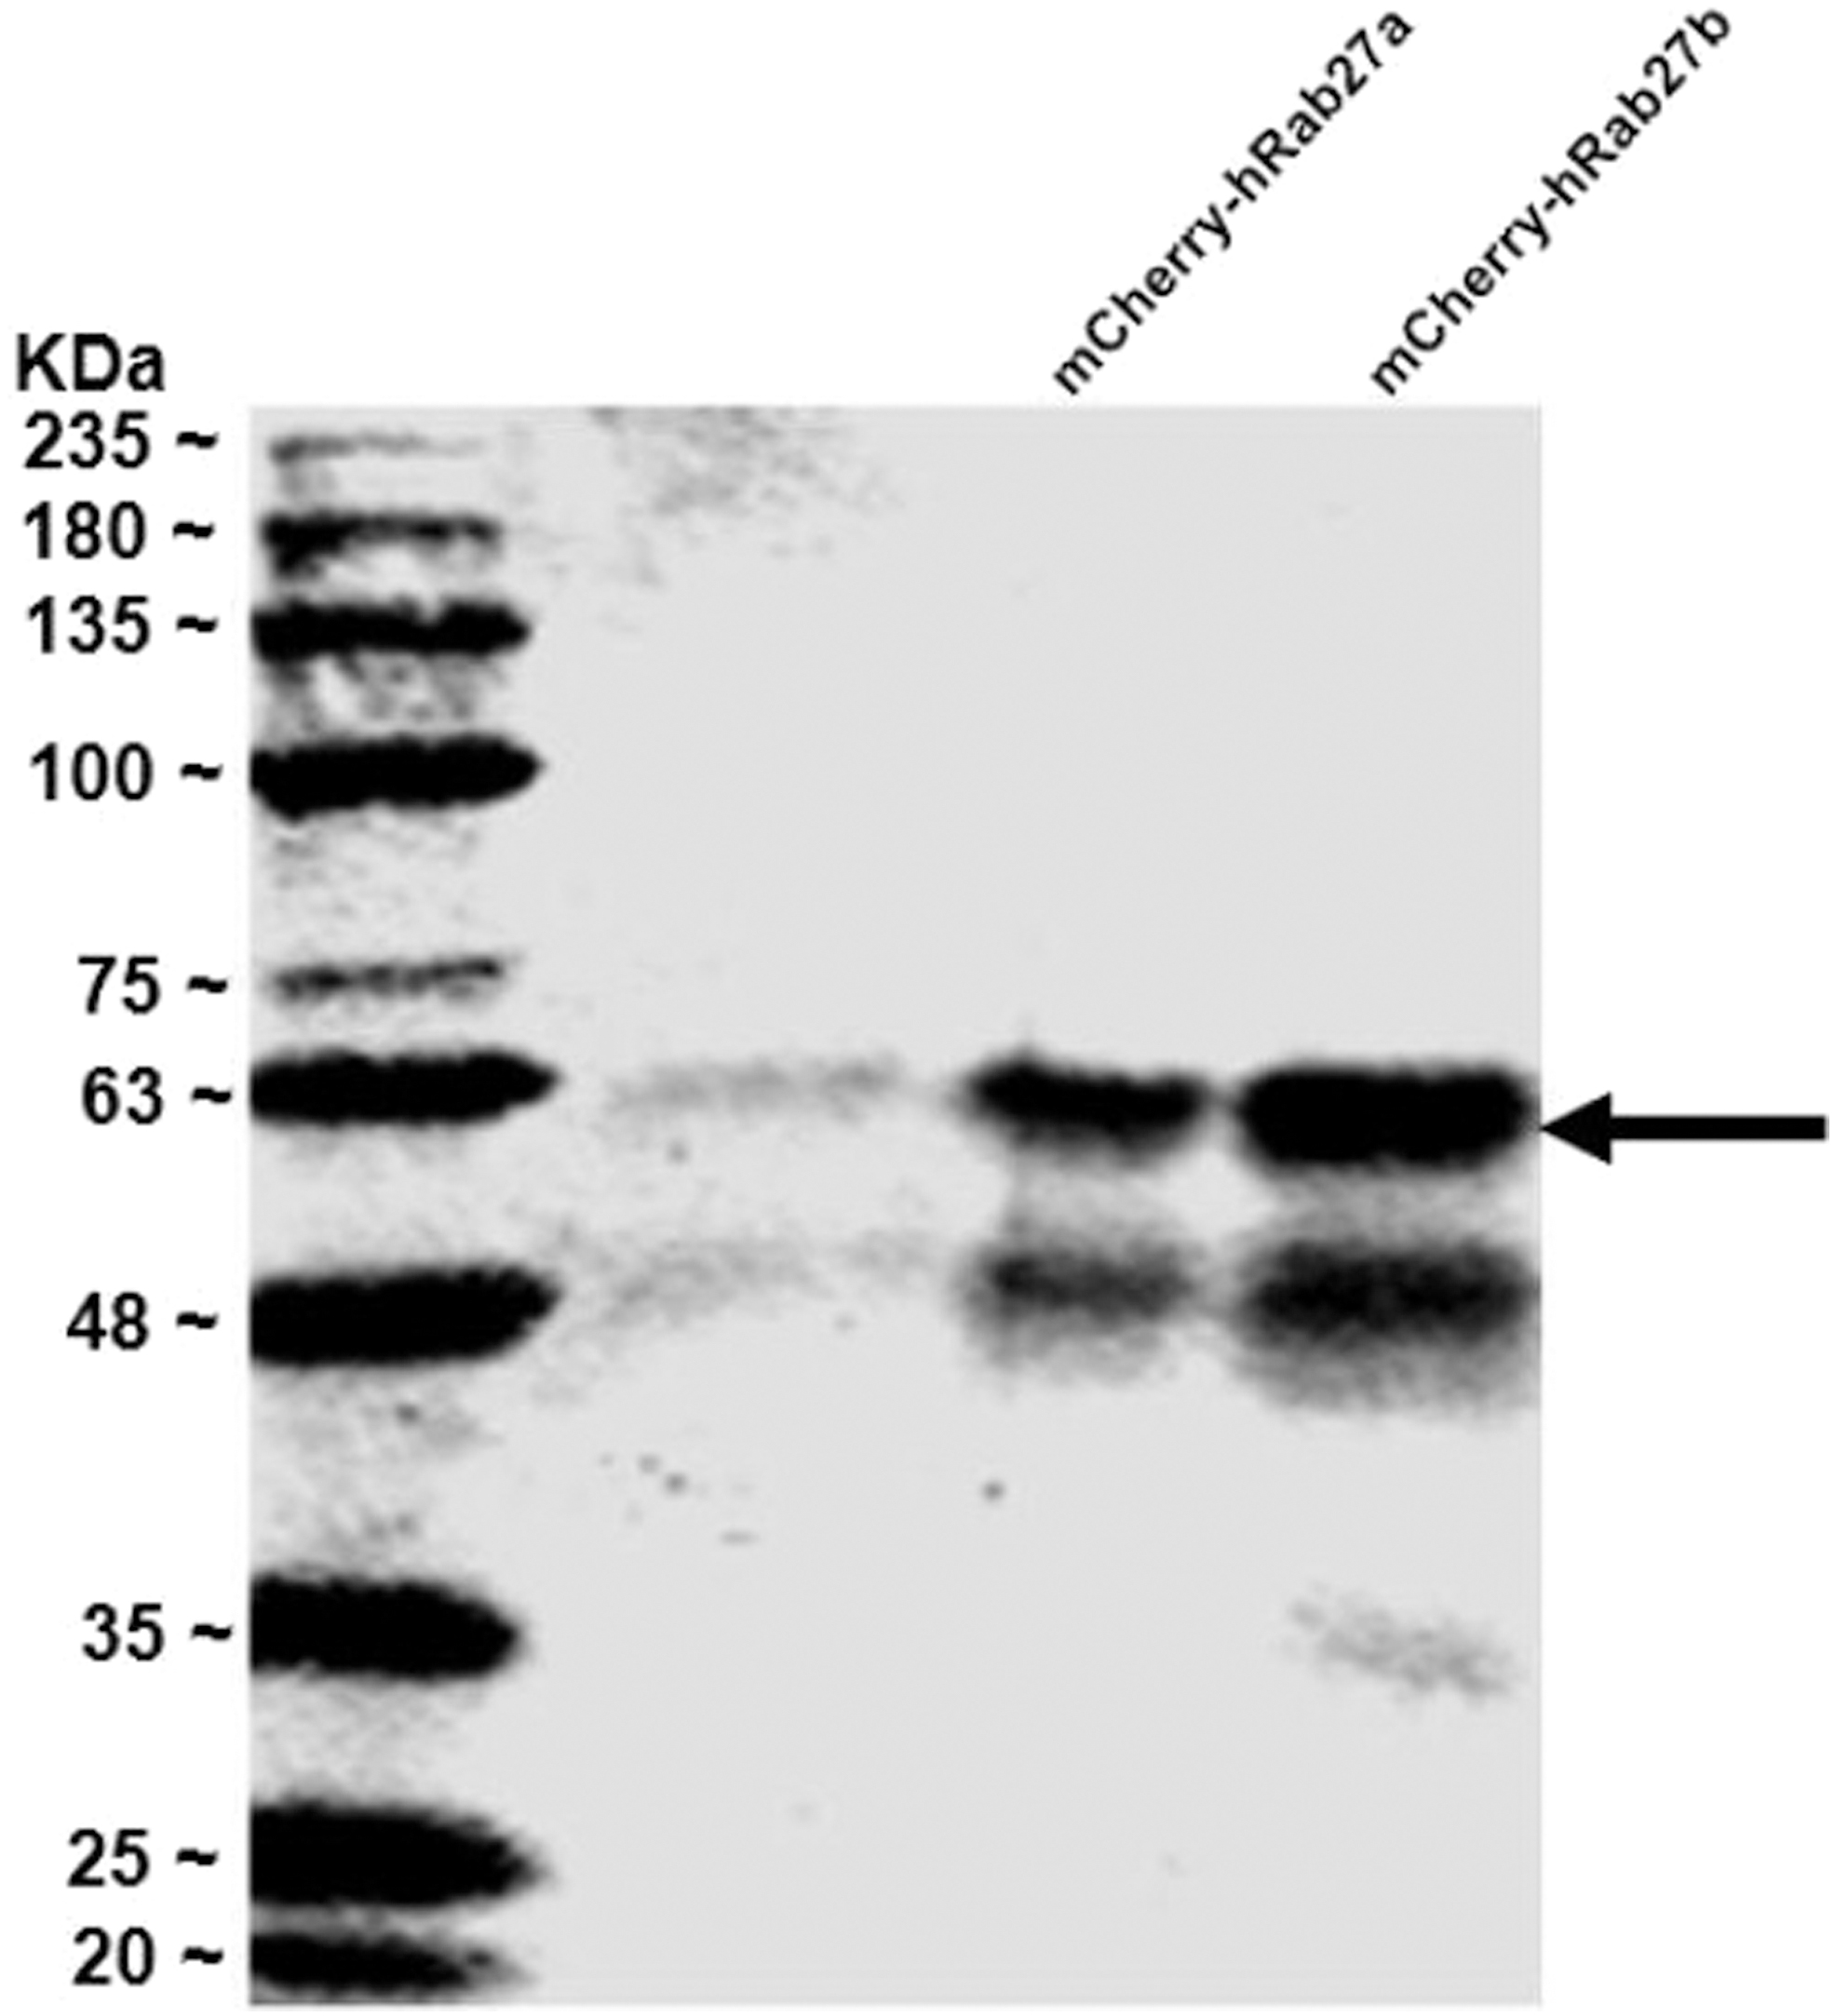
Western blot analysis profile of 6 × Histidine-mCherry-hRab27a and 6 × Histidine-mCherry-hRab27b recombinant proteins. The 6 × Histidine-mCherry-hRab27a and 6 × Histidine-mCherry-hRab27b recombinant proteins were loaded into 10% SDS-PAGE gel, transferred into PVDF membrane, and immunoblotted with anti-mCherry antibody. Abundant protein bands (the arrow indicated bands) were detected at the predicted molecular weights for the transferred proteins (55.3 kDa). PVDF, polyvinylidene difluoride. Reproduced from Al-Saad et al. (in press). 60
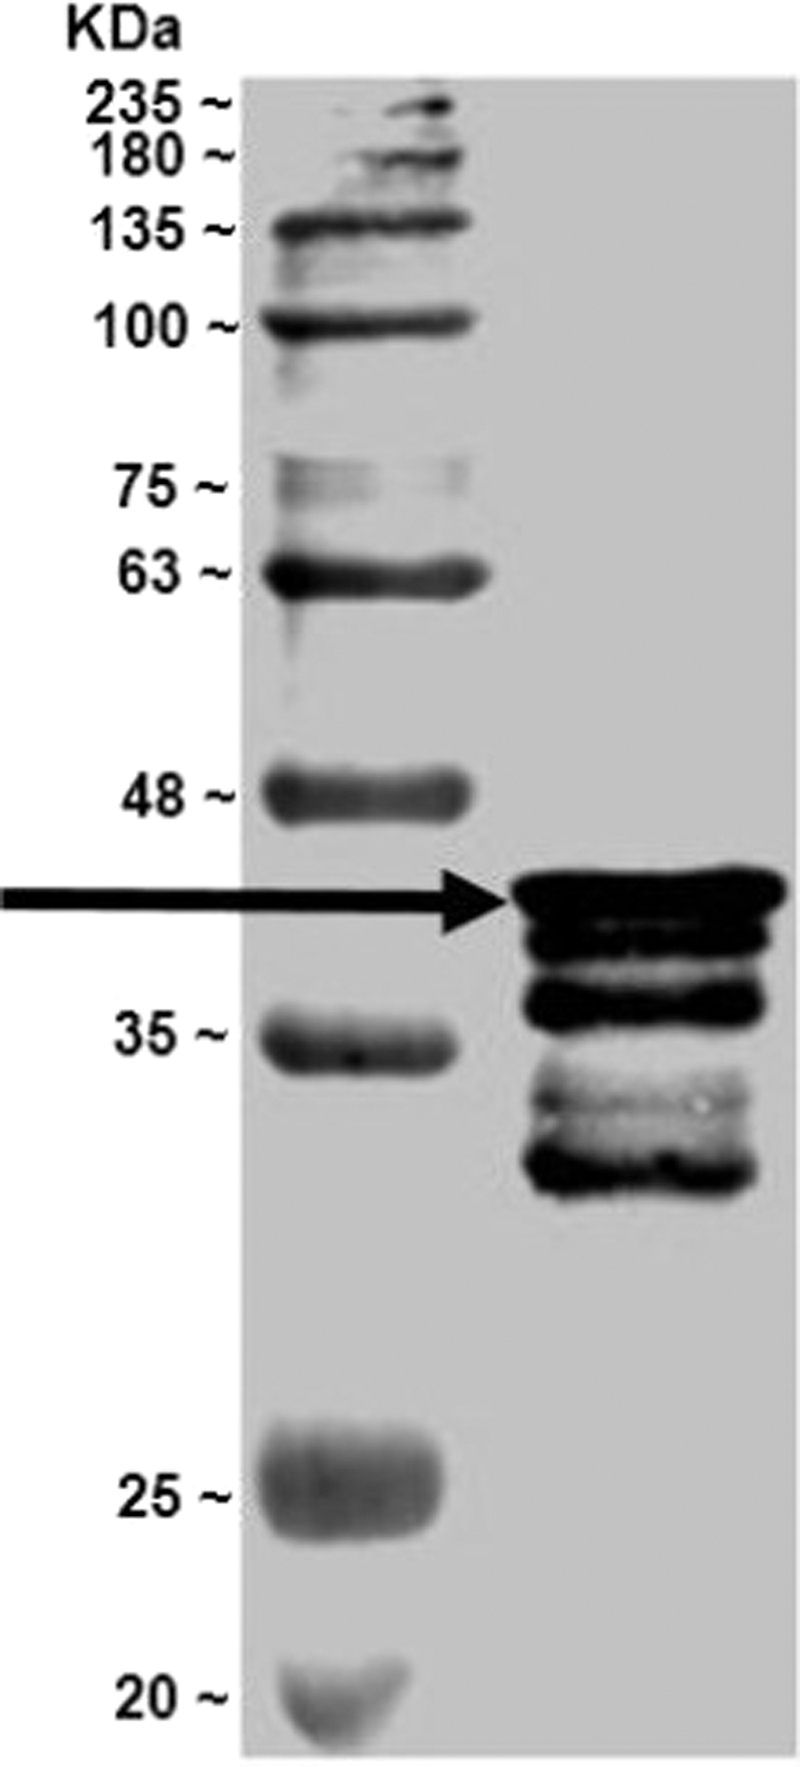
Western blot analysis profile of the 6 × Histidine-GFP-mSlp1-(1–116) recombinant protein. 6 × Histidine-GFP-mSlp1-(1–116) recombinant protein was loaded into 10% SDS-PAGE gel, transferred into PVDF membrane and immunoblotted with anti-GFP antibody. Abundant protein band (the arrow indicated band) was detected at the predicted molecular weight for the transferred protein (43.97 kDa). mslp, mouse synaptotagmin-like protein. Reproduced from Al-Saad et al. (in press). 60

Western blot analysis profile of the 6 × Histidine-GFP-mSlp2-(3–80) recombinant protein. 6 × Histidine-GFP-mSlp2-(3–80) recombinant protein was loaded into 10% SDS-PAGE gel, transferred into PVDF membrane and immunoblotted with anti-GFP antibody. Abundant protein band (the arrow indicated band) was detected at the predicted molecular weight for the transferred protein (41.33 kDa). Reproduced from Al-Saad et al. (in press). 60

Production of 6 × Histidine-GFP protein. Rosetta E. coli competent cells were transformed with the appropriate vector and protein production was induced using 0.5 mM IPTG for 3 h at 37°C. Then protein is collected and purified as described in section “Materials and Methods”. An abundant protein band (the arrow indicated band) was detected at the predicted molecular weight for the 6 × Histidine-GFP protein (30.034 kDa) using an instant blue-stained 10% SDS-PAGE gel. These results were confirmed by western blot analysis (data not shown). Reproduced from Al-Saad et al. (in press). 60
Preliminary studies using GFP-mSlp1-(1–116) (N-terminus Rab27-binding domain) and mCherry-hRab27b were performed to test the possibility of FRET occurrence (data not shown). As negative control reactions, the occurrence of FRET was tested using [GFP and mCherry-hRab27b] and [GFP-mSlp1 and mCherry] reaction mixtures.
Overall, the findings of these experiments demonstrated that specific and significant FRET signals were detected as a result of direct binding between Rab27b and mSlp1 rather than binding of these interacting components to mCherry or GFP proteins. This provided the basis for determining the Rab27-effector-binding affinity using mSlp1 and mSlp2 effectors in the subsequent experiments.
To optimize the conditions of the FRET-based protein–protein interaction assay, different reaction conditions were used to determine the binding between mCherry-hRab27b and GFP-mSlp1. Thus, different incubation times (0, 1, 2, and 4 h) and GTP concentrations (0, 1, 3, and 9 mM) were used for testing the binding between these interacting components.
Overall, the findings of these experiments demonstrated that the interaction between hRab27b and mSlp1 of the GTP-loaded reactions was higher compared with the GTP-unloaded reactions (Fig. 7). Consistent with these findings, it was found that Slp1, Slp2, and Slp4 showed little or no interaction with the GDP-bound form mutants Rab27aT23N and Rab27bN133I using the yeast two-hybrid assay. 21
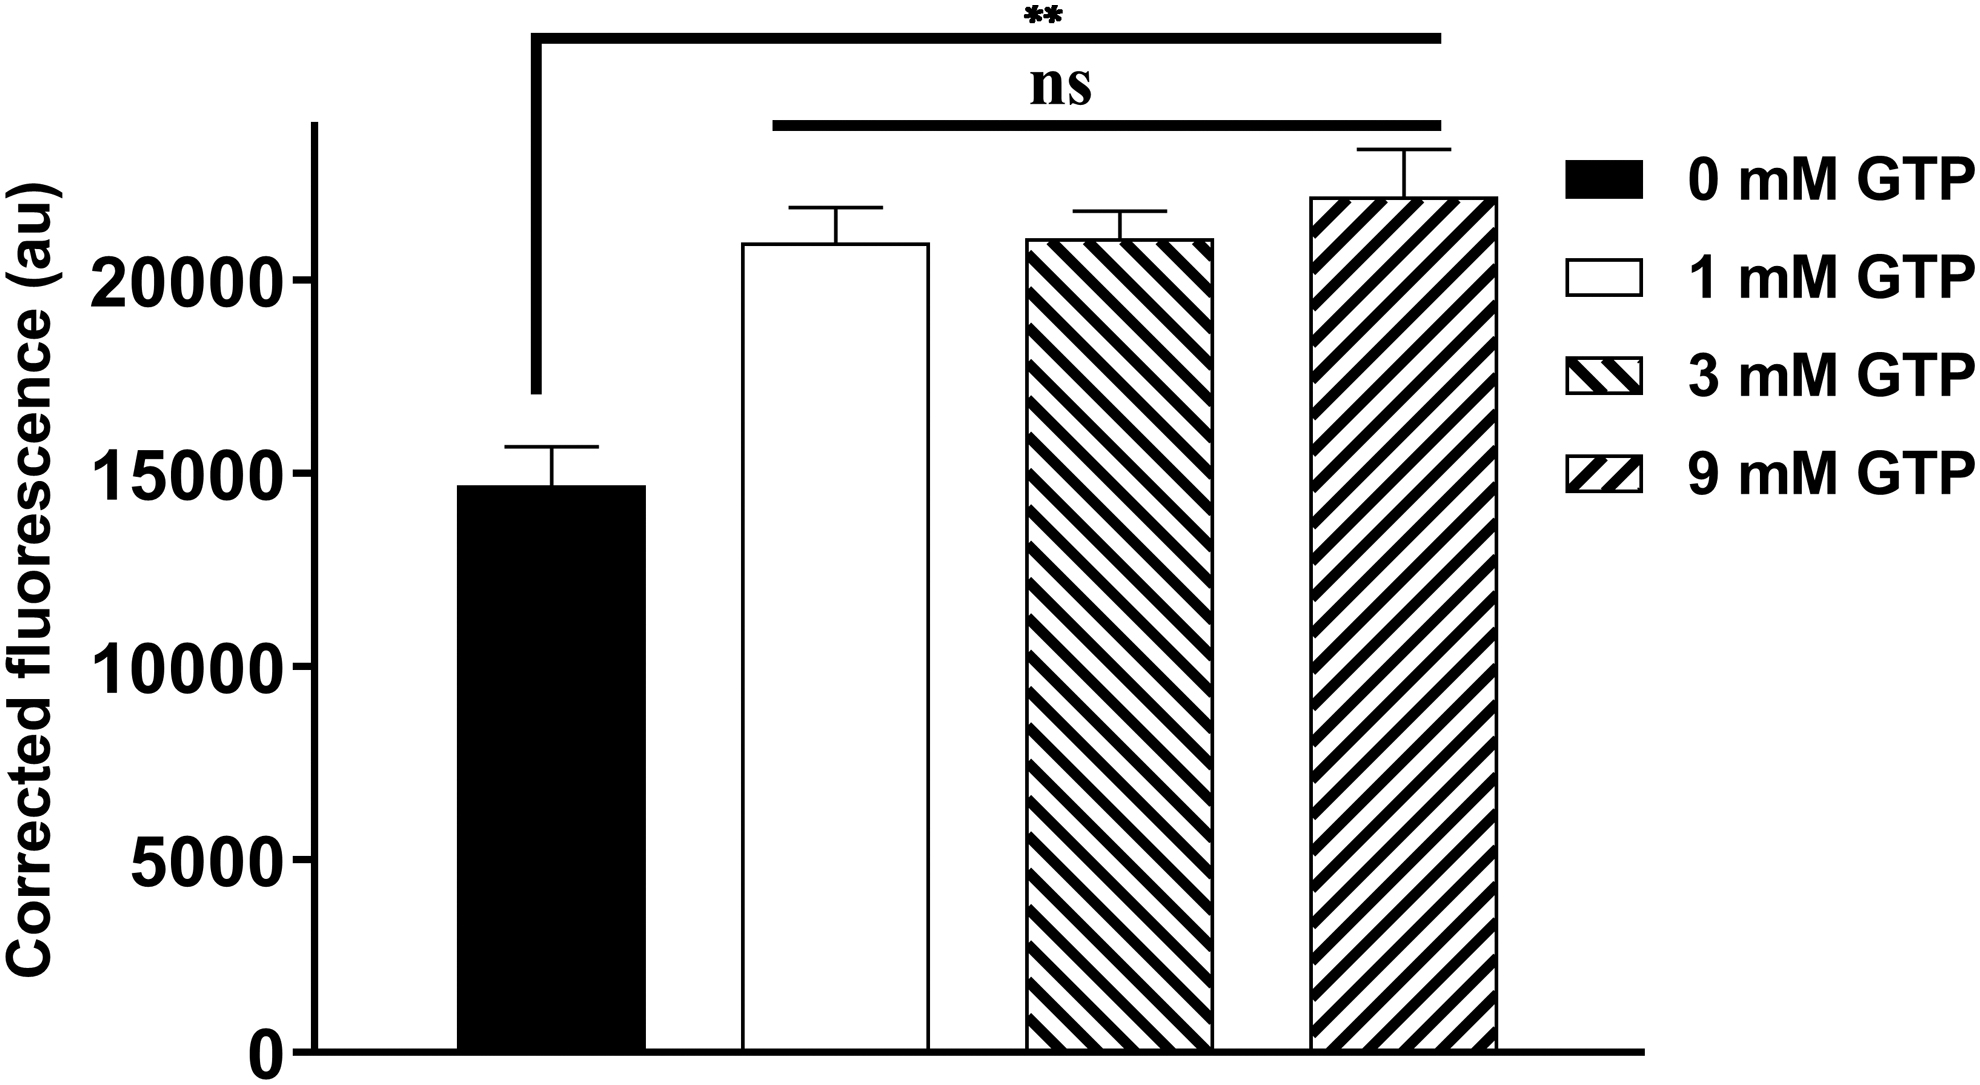
Effect of GTP concentration on the binding between GFP-mSlp1 and mCherry-hRab27b after 2 h incubation. Different GTP concentrations (0, 1, 3, and 9 mM) were used to test the binding between 0.35 μM GFP-mSlp1 and 0.15 μM mCherry-hRab27b after 2 h incubation. The corrected fluorescence was used as an indirect read-out for the bound fraction. Data points represent mean ± SEM of three independent experiments performed in quadruplicates. One-way ANOVA: ns p > 0.05; **p ≤ 0.01. ANOVA, analysis of variance; SEM, standard error of the mean.
In addition, the use of different GTP concentrations (1, 3, and 9 mM) did not affect the interaction between hRab27b and mSlp1 as the corrected fluorescence was not significantly different for these GTP concentrations.
Subsequently, we investigated whether the incubation time was a factor in the determination of FRET interaction between hRab27b and mSlp1. At all time points examined, the interaction using 3 mM GTP was consistent. Furthermore, 2- and 4-h incubation were comparable to each other in terms of obtaining maximum interaction (Fig. 8). Accordingly, 2-h incubation time at room temperature and 3 mM GTP were used in the subsequent binding affinity experiments.
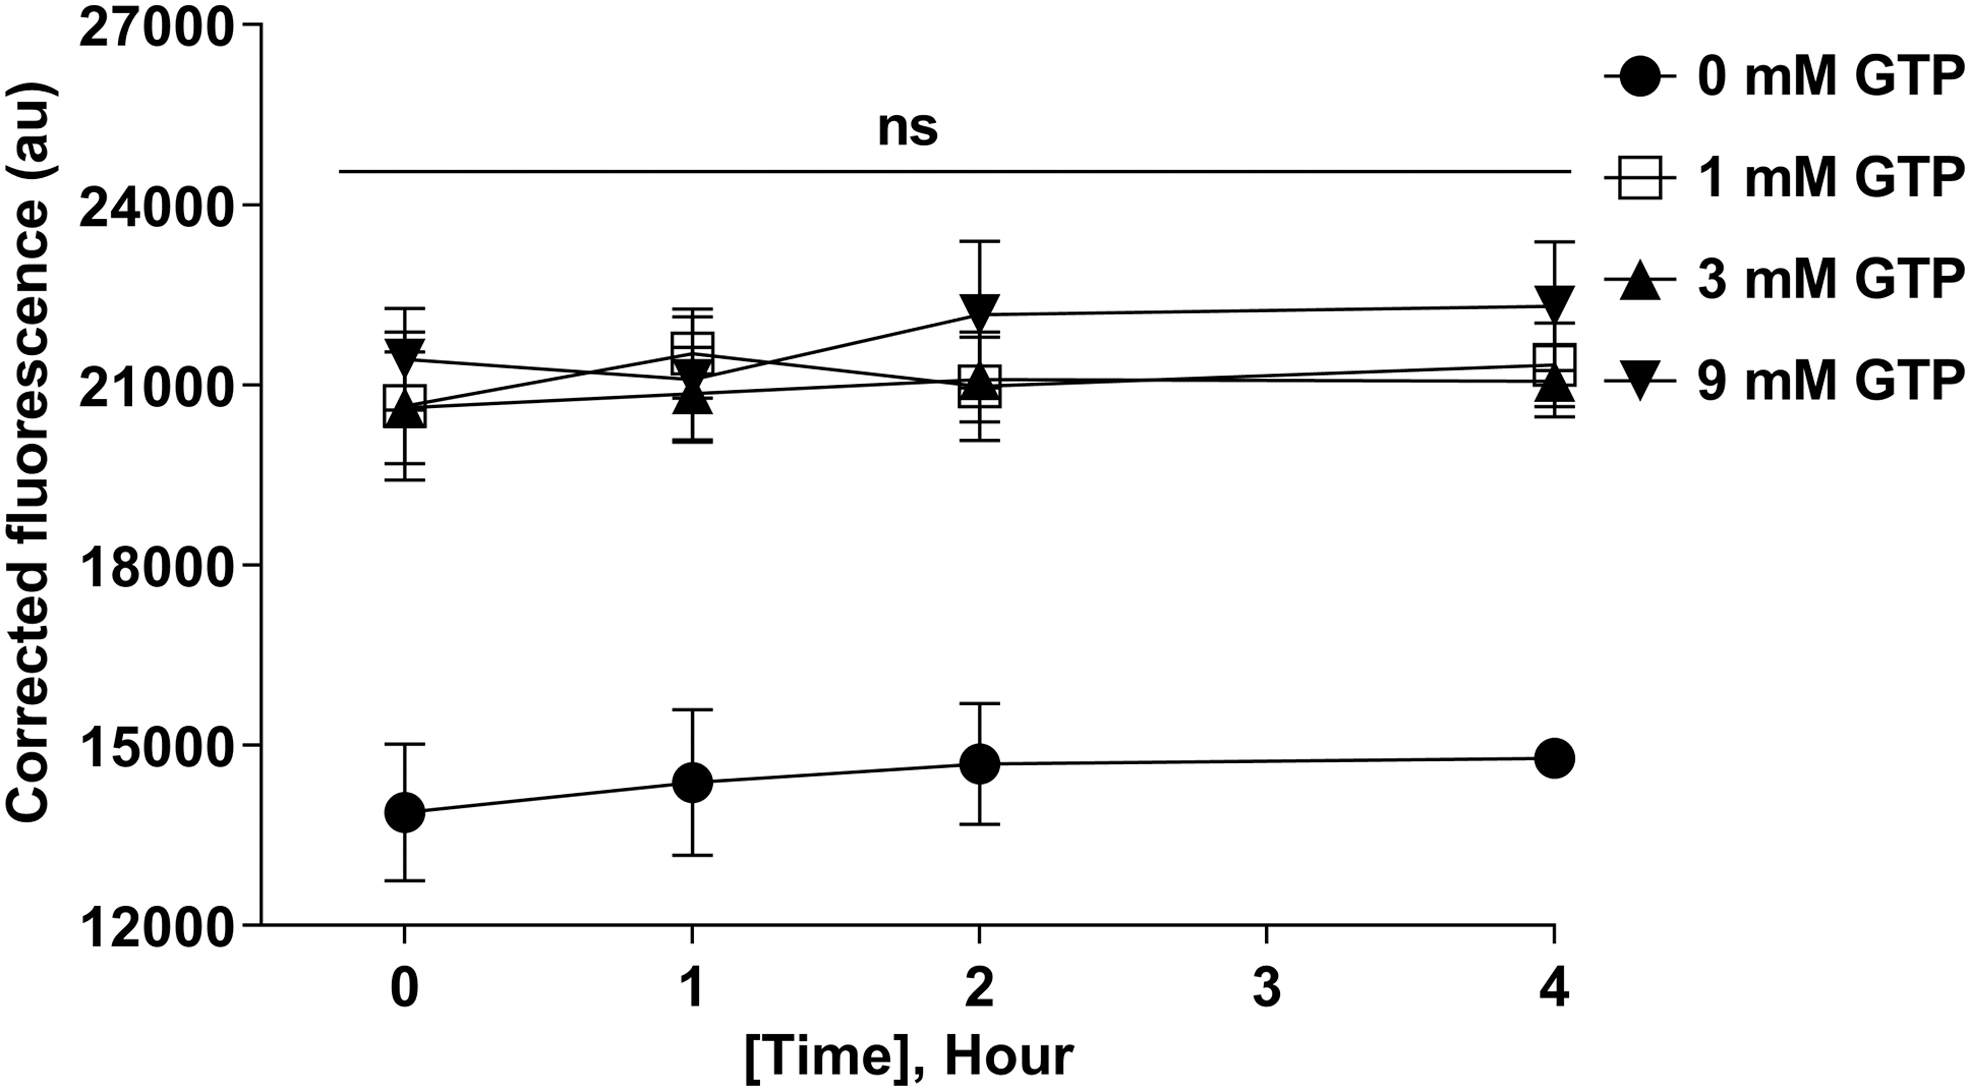
Effect of the incubation time on the binding between GFP-mSlp1 and mCherry-hRab27b. Different incubation times (0, 1, 2, and 4 h) were used to determine the binding between 0.35 μM GFP-mSlp1 and 0.15 μM mCherry-hRab27b using different GTP concentrations (0, 1, 3, and 9 mM) at room temperature. Data points represent mean ± SEM of three independent experiments performed in quadruplicates. One-way ANOVA: ns p > 0.05.
To determine the binding affinity of mSlp1 and mSlp2 effector proteins to Rab27b, different preliminary experiments were performed to optimize the concentration of mCherry-hRab27b recombinant protein that can be used in these binding affinity experiments (to use constant concentration).
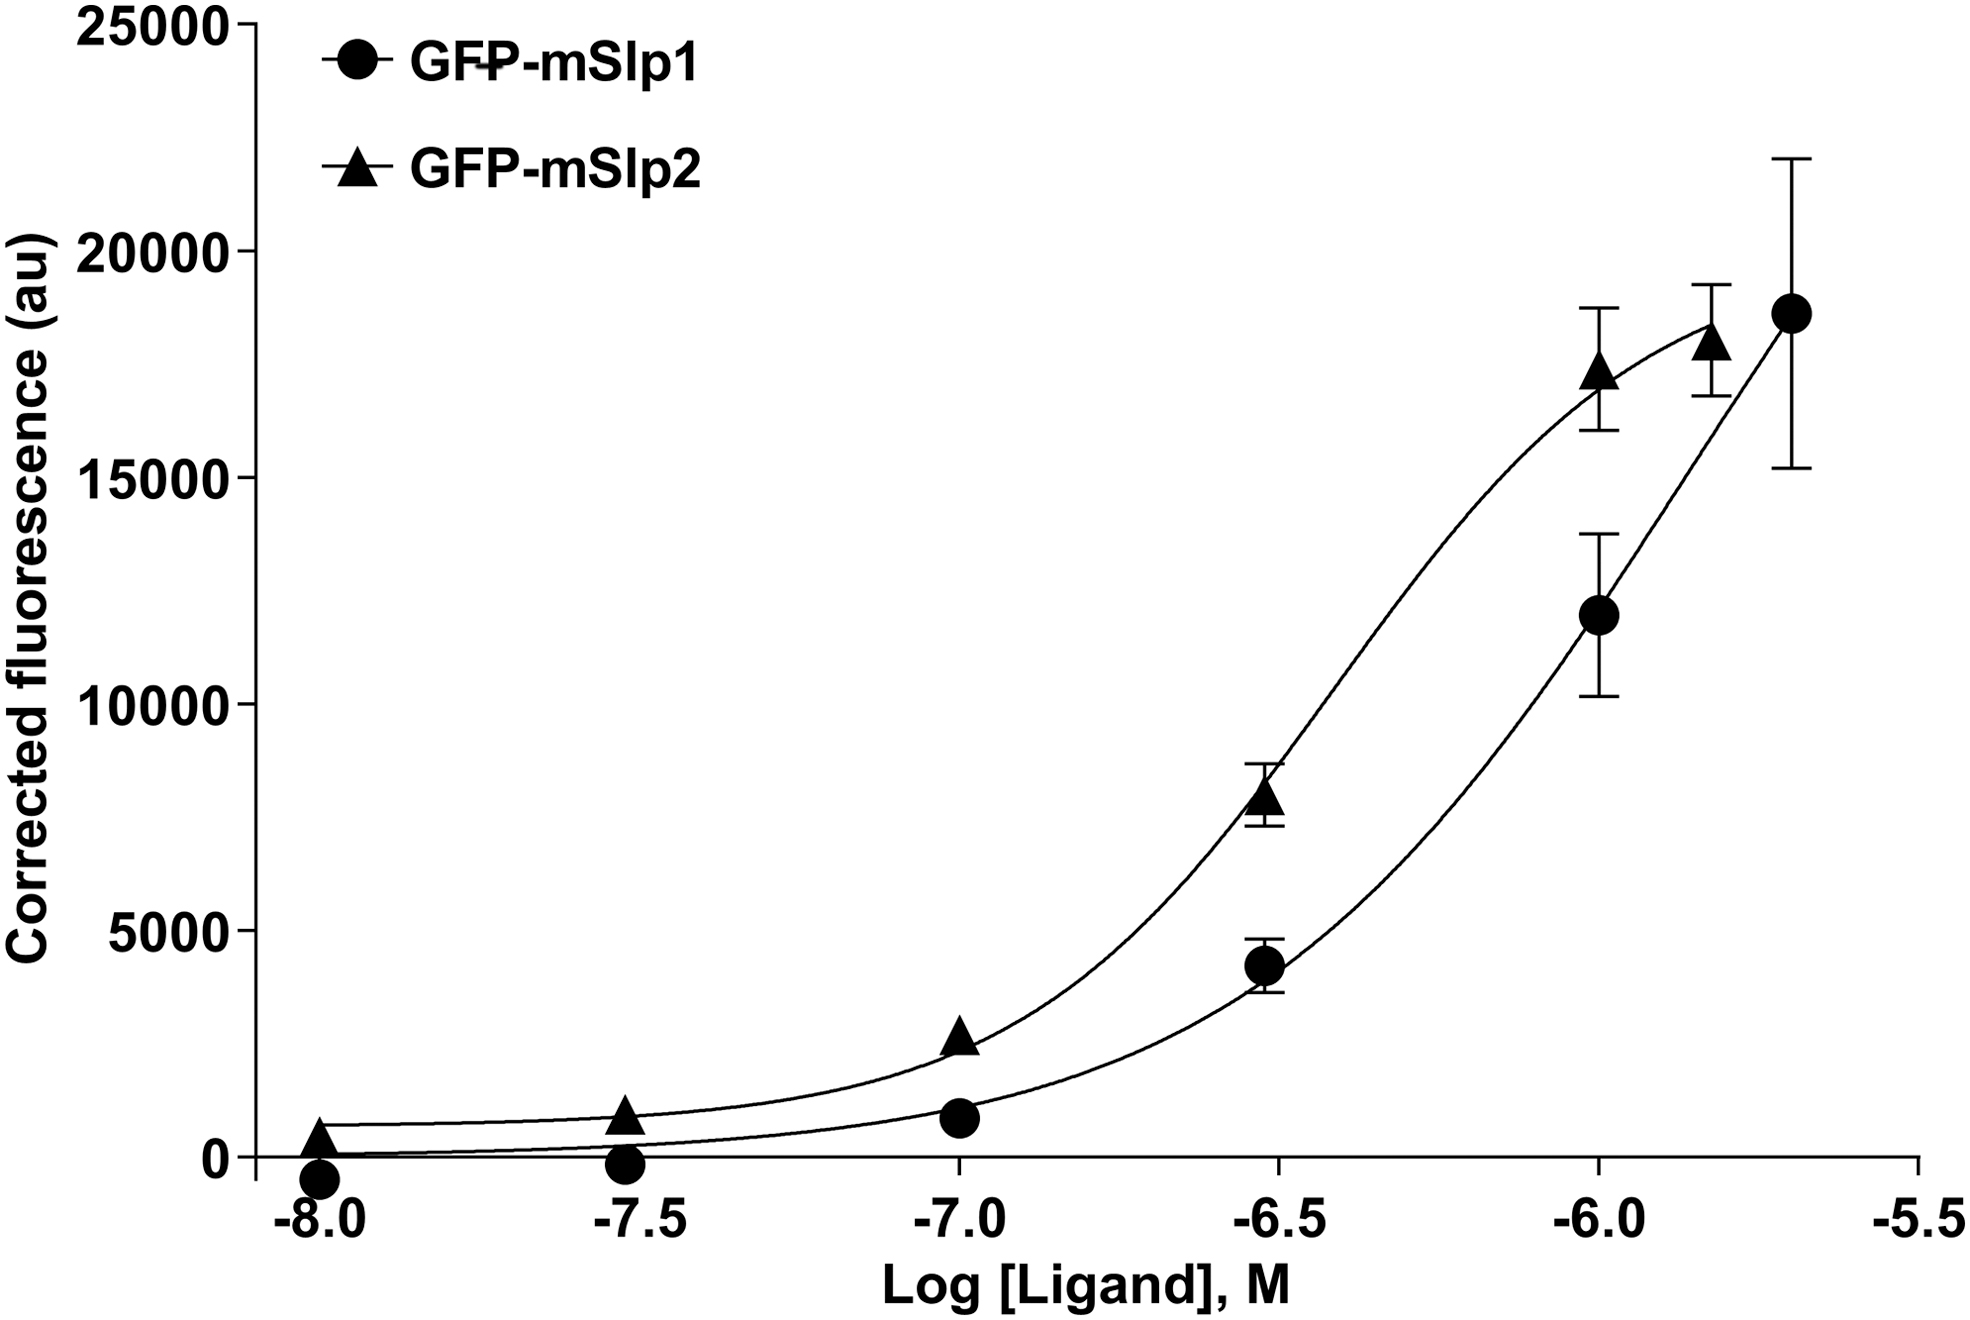
First, a constant concentration of mCherry-hRab27b (0.6 μM) was chosen to be used for determining the binding affinity of different concentrations of GFP-mSlp1 and GFP-mSlp2. The EC50 values of GFP-mSlp1 and GFP-mSlp2 binding to 0.6 μM mCherry-hRab27b were 1.75 and 0.44 μM, respectively. Although a plateau or saturation binding was not reached, this suggested that the binding affinity of mSlp2 to Rab27b was higher compared with mSlp1 (Fig. 9).

The binding-affinity profile of mSlp1 and mSlp2 effector proteins to 0.6 μM hRab27b. The binding affinity of different concentrations (0.01, 0.03, 0.1, 0.3, 1.0, and 1.5 μM) of GFP-mSlp1 (black filled circle) and GFP-mSlp2 (black down-pointed triangle) to 0.6 μM mCherry-hRab27b was determined using the FRET-based protein–protein interaction assay. The calculated EC50 values were 1.75 μM and 0.44 μM for GFP-mSlp1 and GFP-mSlp2, respectively. Data points represent mean ± SEM performed in quadruplicates. EC50, effective concentration 50.
As saturation binding was not reached by using 0.6 μM mCherry-hRab27b and to better determine the binding affinity of mSlp1 and mSlp2 to hRab27b, a lower concentration of 0.3 μM instead of 0.6 μM mCherry-hRab27b was used for determining the binding of these two Rab27 effector proteins. The EC50 values of GFP-mSlp1 and GFP-mSlp2 binding to 0.3 μM mCherry-hRab27b were 1.38 and 0.38 μM, respectively. Although, saturation was not reached, this suggested again that the binding affinity of mSlp2 was higher compared with mSlp1 (Fig. 10).
The binding affinity profile of mSlp1 and mSlp2 effector proteins to 0.3 μM hRab27b. The binding affinity of different concentrations of GFP-mSlp1 (black filled circle) (0.01, 0.03, 0.1, 0.3, 1.0, and 2 μM) and GFP-mSlp2 (black filled triangle) (0.01, 0.03, 0.1, 0.3, 1.0, and 1.5 μM) to 0.3 μM mCherry-hRab27b was determined using the FRET-based protein–protein interaction assay. The calculated EC50 values were 1.38 and 0.38 μM for GFP-mSlp1 and GFP-mSlp2, respectively. Data points represent mean ± SEM performed in quadruplicates.
Therefore, a lower concentration of mCherry-hRab27b (0.15 μM) was used to determine the binding affinity of mSlp1 and mSlp2. Repeatedly, these experiments confirmed that the Rab27-binding affinity of mSlp2 (EC50: 0.15 μM) is higher compared with mSlp1 (EC50: 0.33 μM) (Fig. 11). In addition, determination of mSlp1 and mSlp2-binding affinity using the FRET assay was specific, as this was evidenced by the EC50 values of the negative control reactions: (1) GFP binding to mCherry-hRab27b (EC50: 2.09 μM); (2) mCherry binding to GFP-mSlp1 (EC50: 2.47 μM); (3) mCherry binding to GFP-mSlp2 (EC50: 67.66 μM) (Fig. 11). These experiments demonstrated that the binding in the absence of one of the main interacting components (Rab27b, mSlp1, or mSlp2) was unspecific and not comparable to the binding affinity profile of GFP-mSlp1 or GFP-mSlp2 to mCherry-hRab27b recombinant protein.
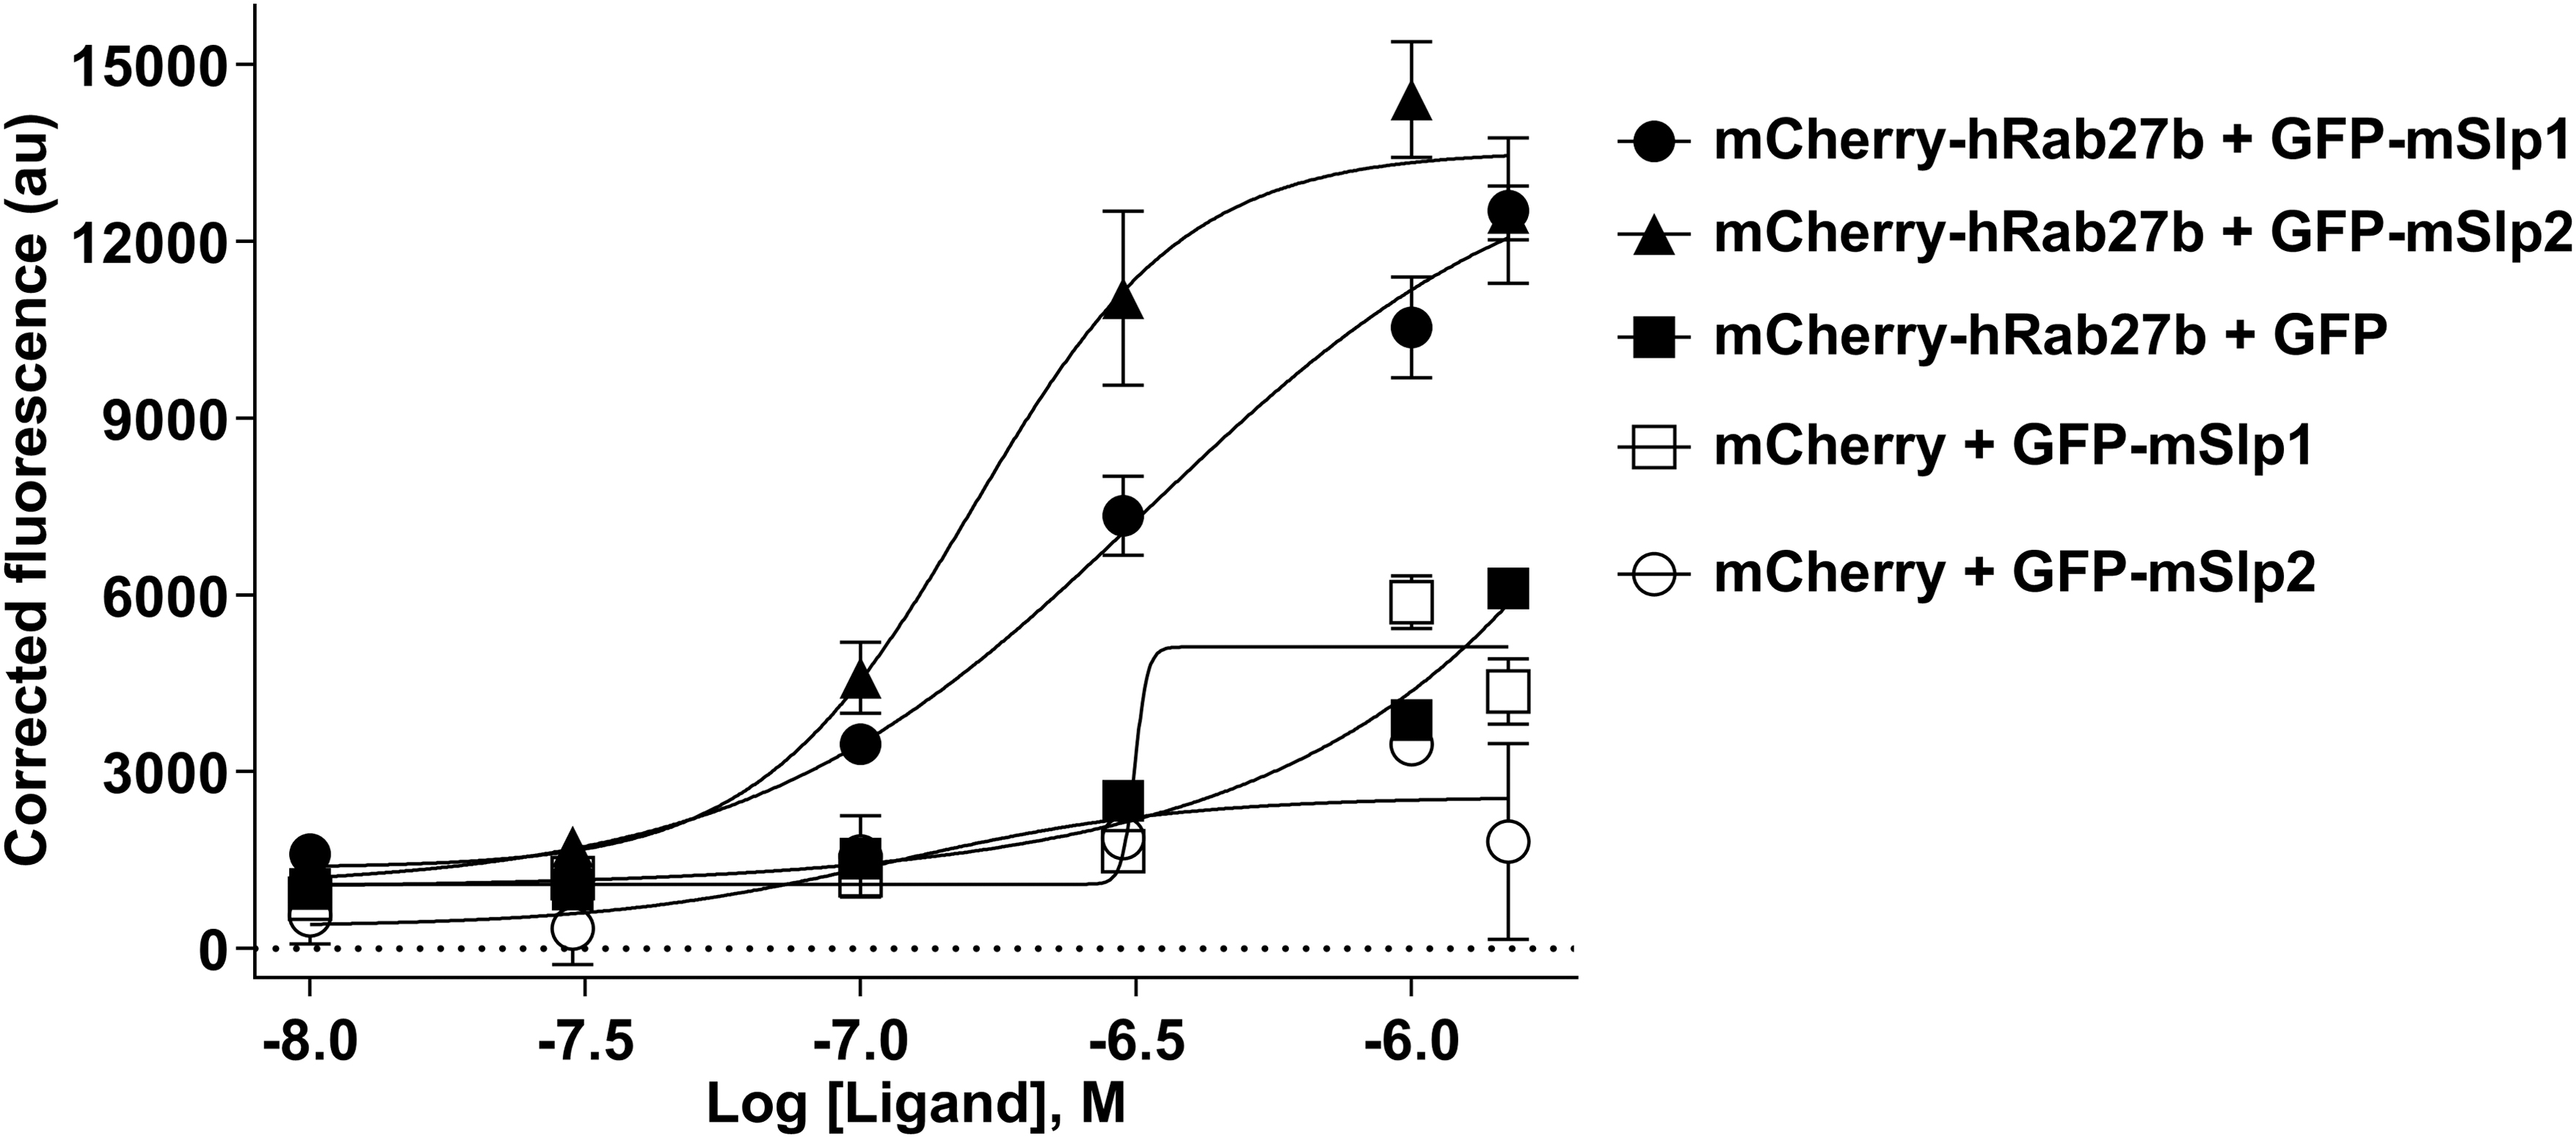
The binding affinity profile of mSlp1 and mSlp2 effector proteins to 0.15 μM hRab27b. Different concentrations (0.01, 0.03, 0.1, 0.3, 1.0, and 1.5 μM) of GFP-mSlp1 (black filled circle), GFP-mSlp2 (black filled triangle) and GFP (black filled square) were used to determine the binding affinity to 0.15 μM mCherry-hRab27b. The calculated EC50 values were 0.33, 0.15, and 2.09 μM for GFP-mSlp1, GFP-mSlp2 and GFP, respectively. In addition, different concentrations (0.01, 0.03, 0.1, 0.3, 1.0, and 1.5 μM) of GFP-mSlp1 (empty square) and GFP-mSlp2 (empty circle) were used to determine the binding affinity to 0.15 μM mCherry. The calculated EC50 values were 2.47 and 67.66 μM for GFP-mSlp1 and GFP-mSlp2, respectively. The FRET-based protein–protein interaction assay was used to determine the binding affinity in these experiments. Data points represent mean ± SEM of three independent experiments performed in quadruplicates.
Next, to further investigate the nature of binding of mSlp1 and mSlp2 to Rab27, the binding for the full length and C-terminal truncated hRab27b was tested. This was performed to find out whether there is a significant importance of the C-terminal of Rab27 in terms of binding to its effectors. To this end, the binding of GFP-mSlp1 and GFP-mSlp2 to mCherry-hRab27b (full length; 1–218 and C-terminal truncated; 1–200) was tested by using constant concentrations of mSlp1 and mSlp2. Note that double the already determined EC50 values were used to saturate the binding. The binding of mSlp1 and mSlp2 to hRab27b was not significantly different, indicating that there is no significant role for the C-terminal of Rab27 in the binding to either mSlp1 or mSlp2. However, the binding of mSlp2 for either full length or C-terminal truncated hRab27b was higher compared with mSlp1, since the used concentration of mSlp1 (0.7 μM) was almost double the concentration of mSlp2 (0.3 μM) (Fig. 12).

Comparison of the binding of mSlp1 and mSlp2 to the full length and C-terminal truncated hRab27b. The binding between 0.15 μM mCherry-hRab27b (full length; 1–218 and C-terminal truncated; 1–200) and either 0.7 μM GFP-mSlp1 or 0.3 μM GFP-mSlp2 was tested using the FRET-based protein–protein interaction assay. Data points represent mean ± SEM of three independent experiments performed in quadruplicates. One-way ANOVA: ns p > 0.05.
Moreover, the binding affinity of mSlp1 and mSlp2 to mCherry-hRab27a, another Rab27 isoform was determined using the same conditions and concentrations for mCherry-hRab27b. Again, these experiments demonstrated that the binding affinity of mSlp2 (EC50: 0.2 μM) to Rab27a was higher compared with mSlp1 (EC50: 0.32 μM) (Fig. 13). This indicates that the binding affinity of mSlp1 to Rab27a (EC50: 0.32 μM) and Rab27b (EC50: 0.33 μM) was similar, whereas the binding affinity of mSlp2 to Rab27b (EC50: 0.15 μM) was higher than to Rab27a (EC50: 0.2 μM) (Figs. 11 and 13).
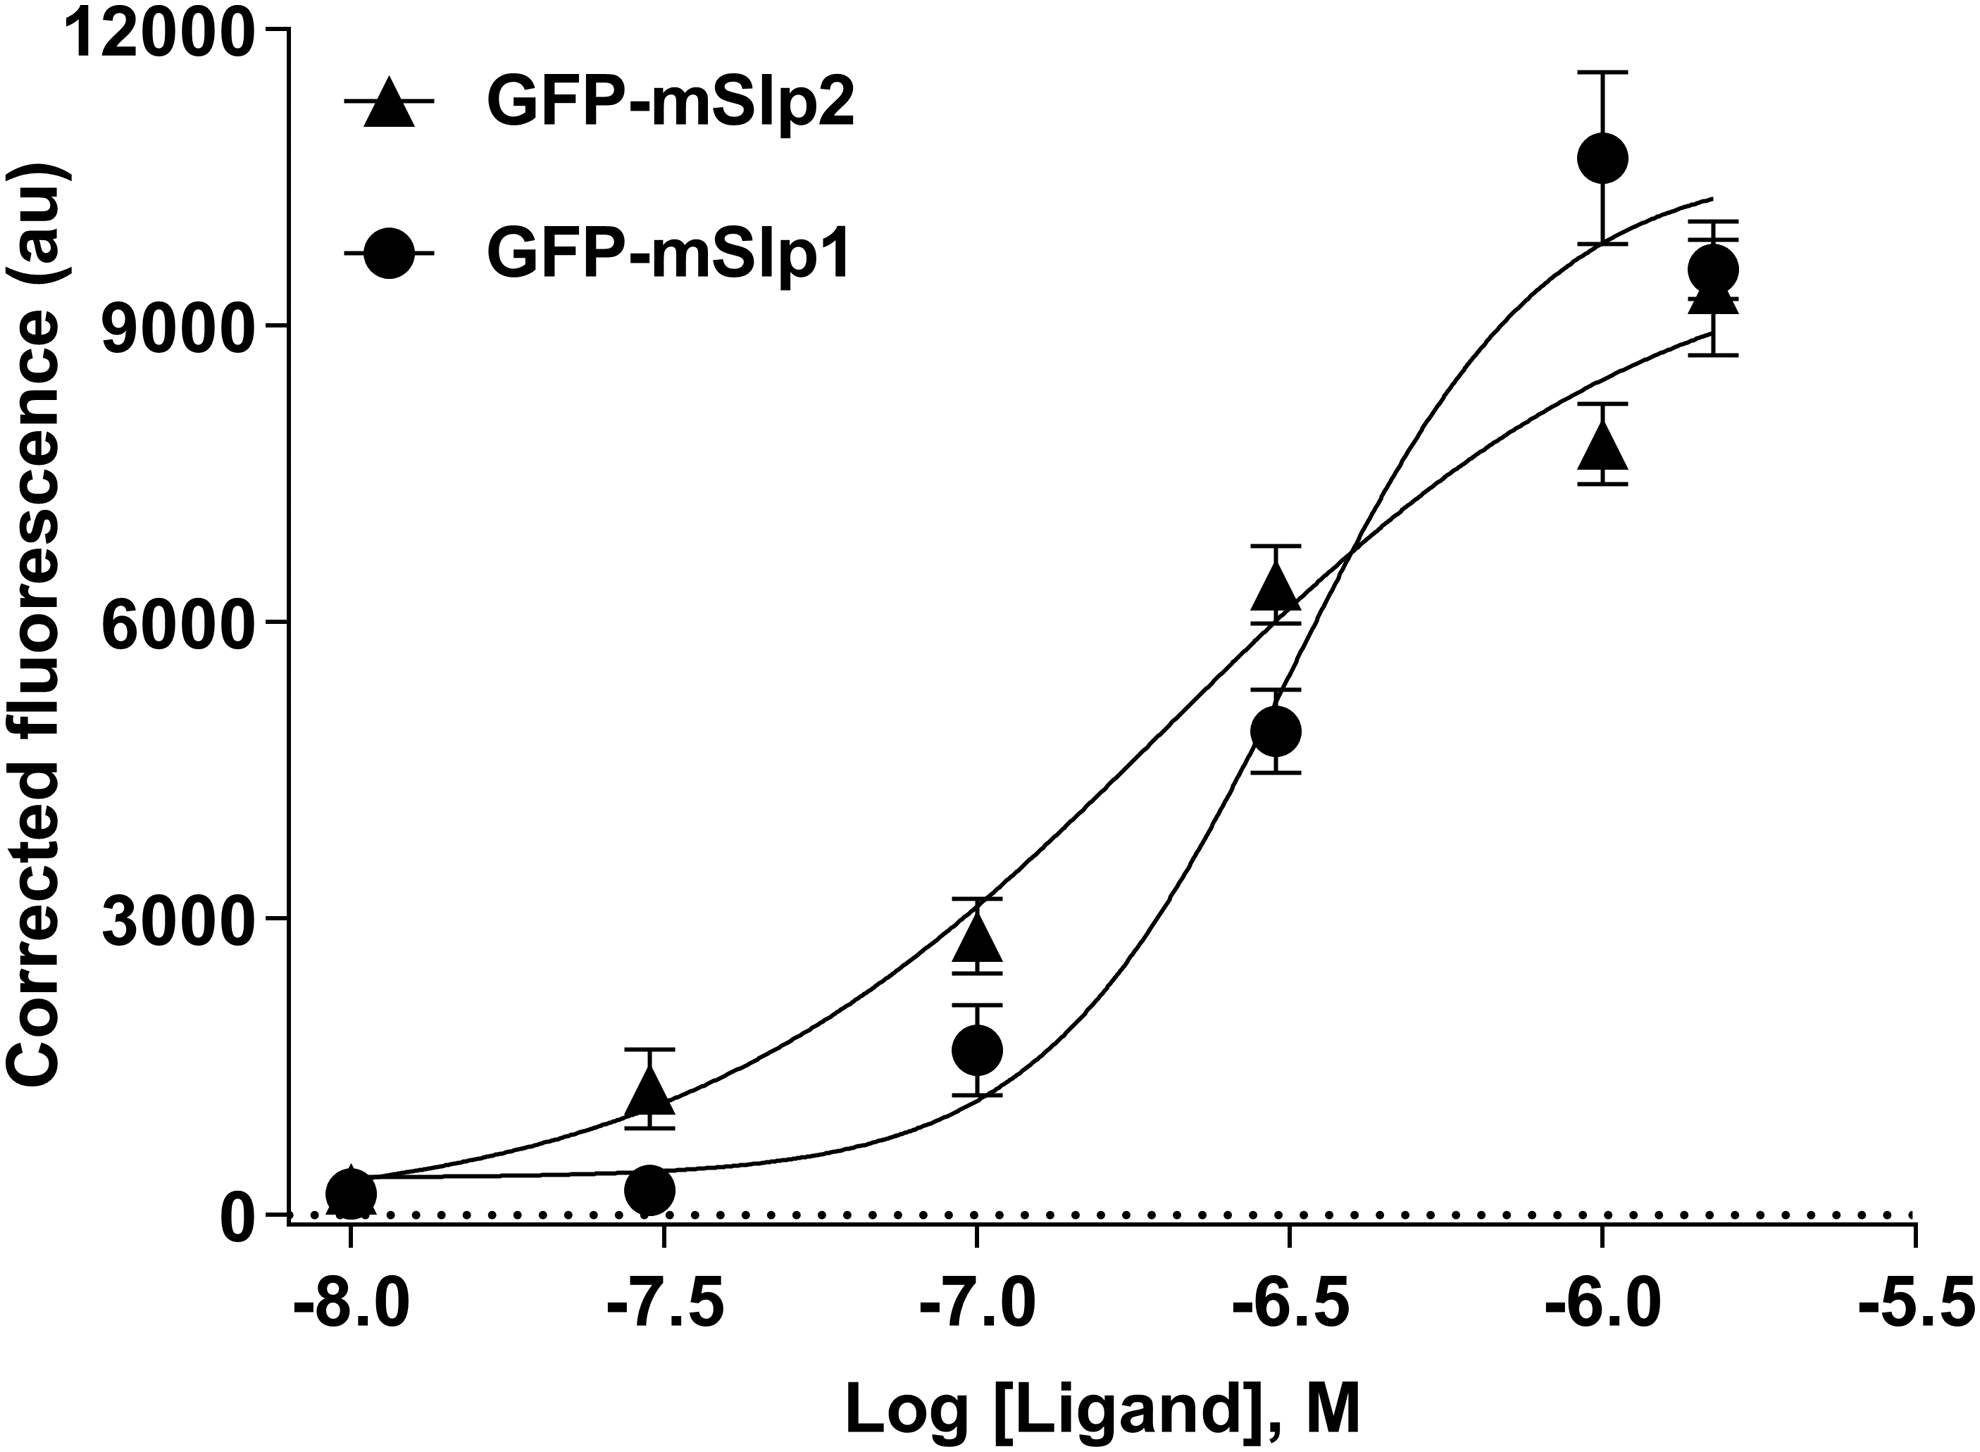
The binding affinity profile of mSlp1 and mSlp2 effector proteins to 0.15 μM hRab27a. Different concentrations (0.01, 0.03, 0.1, 0.3, 1.0, and 1.5 μM) of GFP-mSlp1 (black filled circle) and GFP-mSlp2 (black filled triangle) were used to determine the binding affinity to 0.15 μM mCherry-hRab27a. The calculated EC50 values were 0.32 and 0.2 μM for GFP-mSlp1 and GFP-mSlp2, respectively. The FRET-based protein–protein interaction assay was used to determine the binding affinity in these experiments. Data points represent mean ± SEM of three independent experiments performed in quadruplicates.
Overall, these experiments suggest that the binding affinity of mSlp2 to hRab27a/b was higher compared with mSlp1, which was evidenced by the EC50 value differences as described above.
Specificity of the FRET-based protein–protein interaction assay
By determining the Rab27
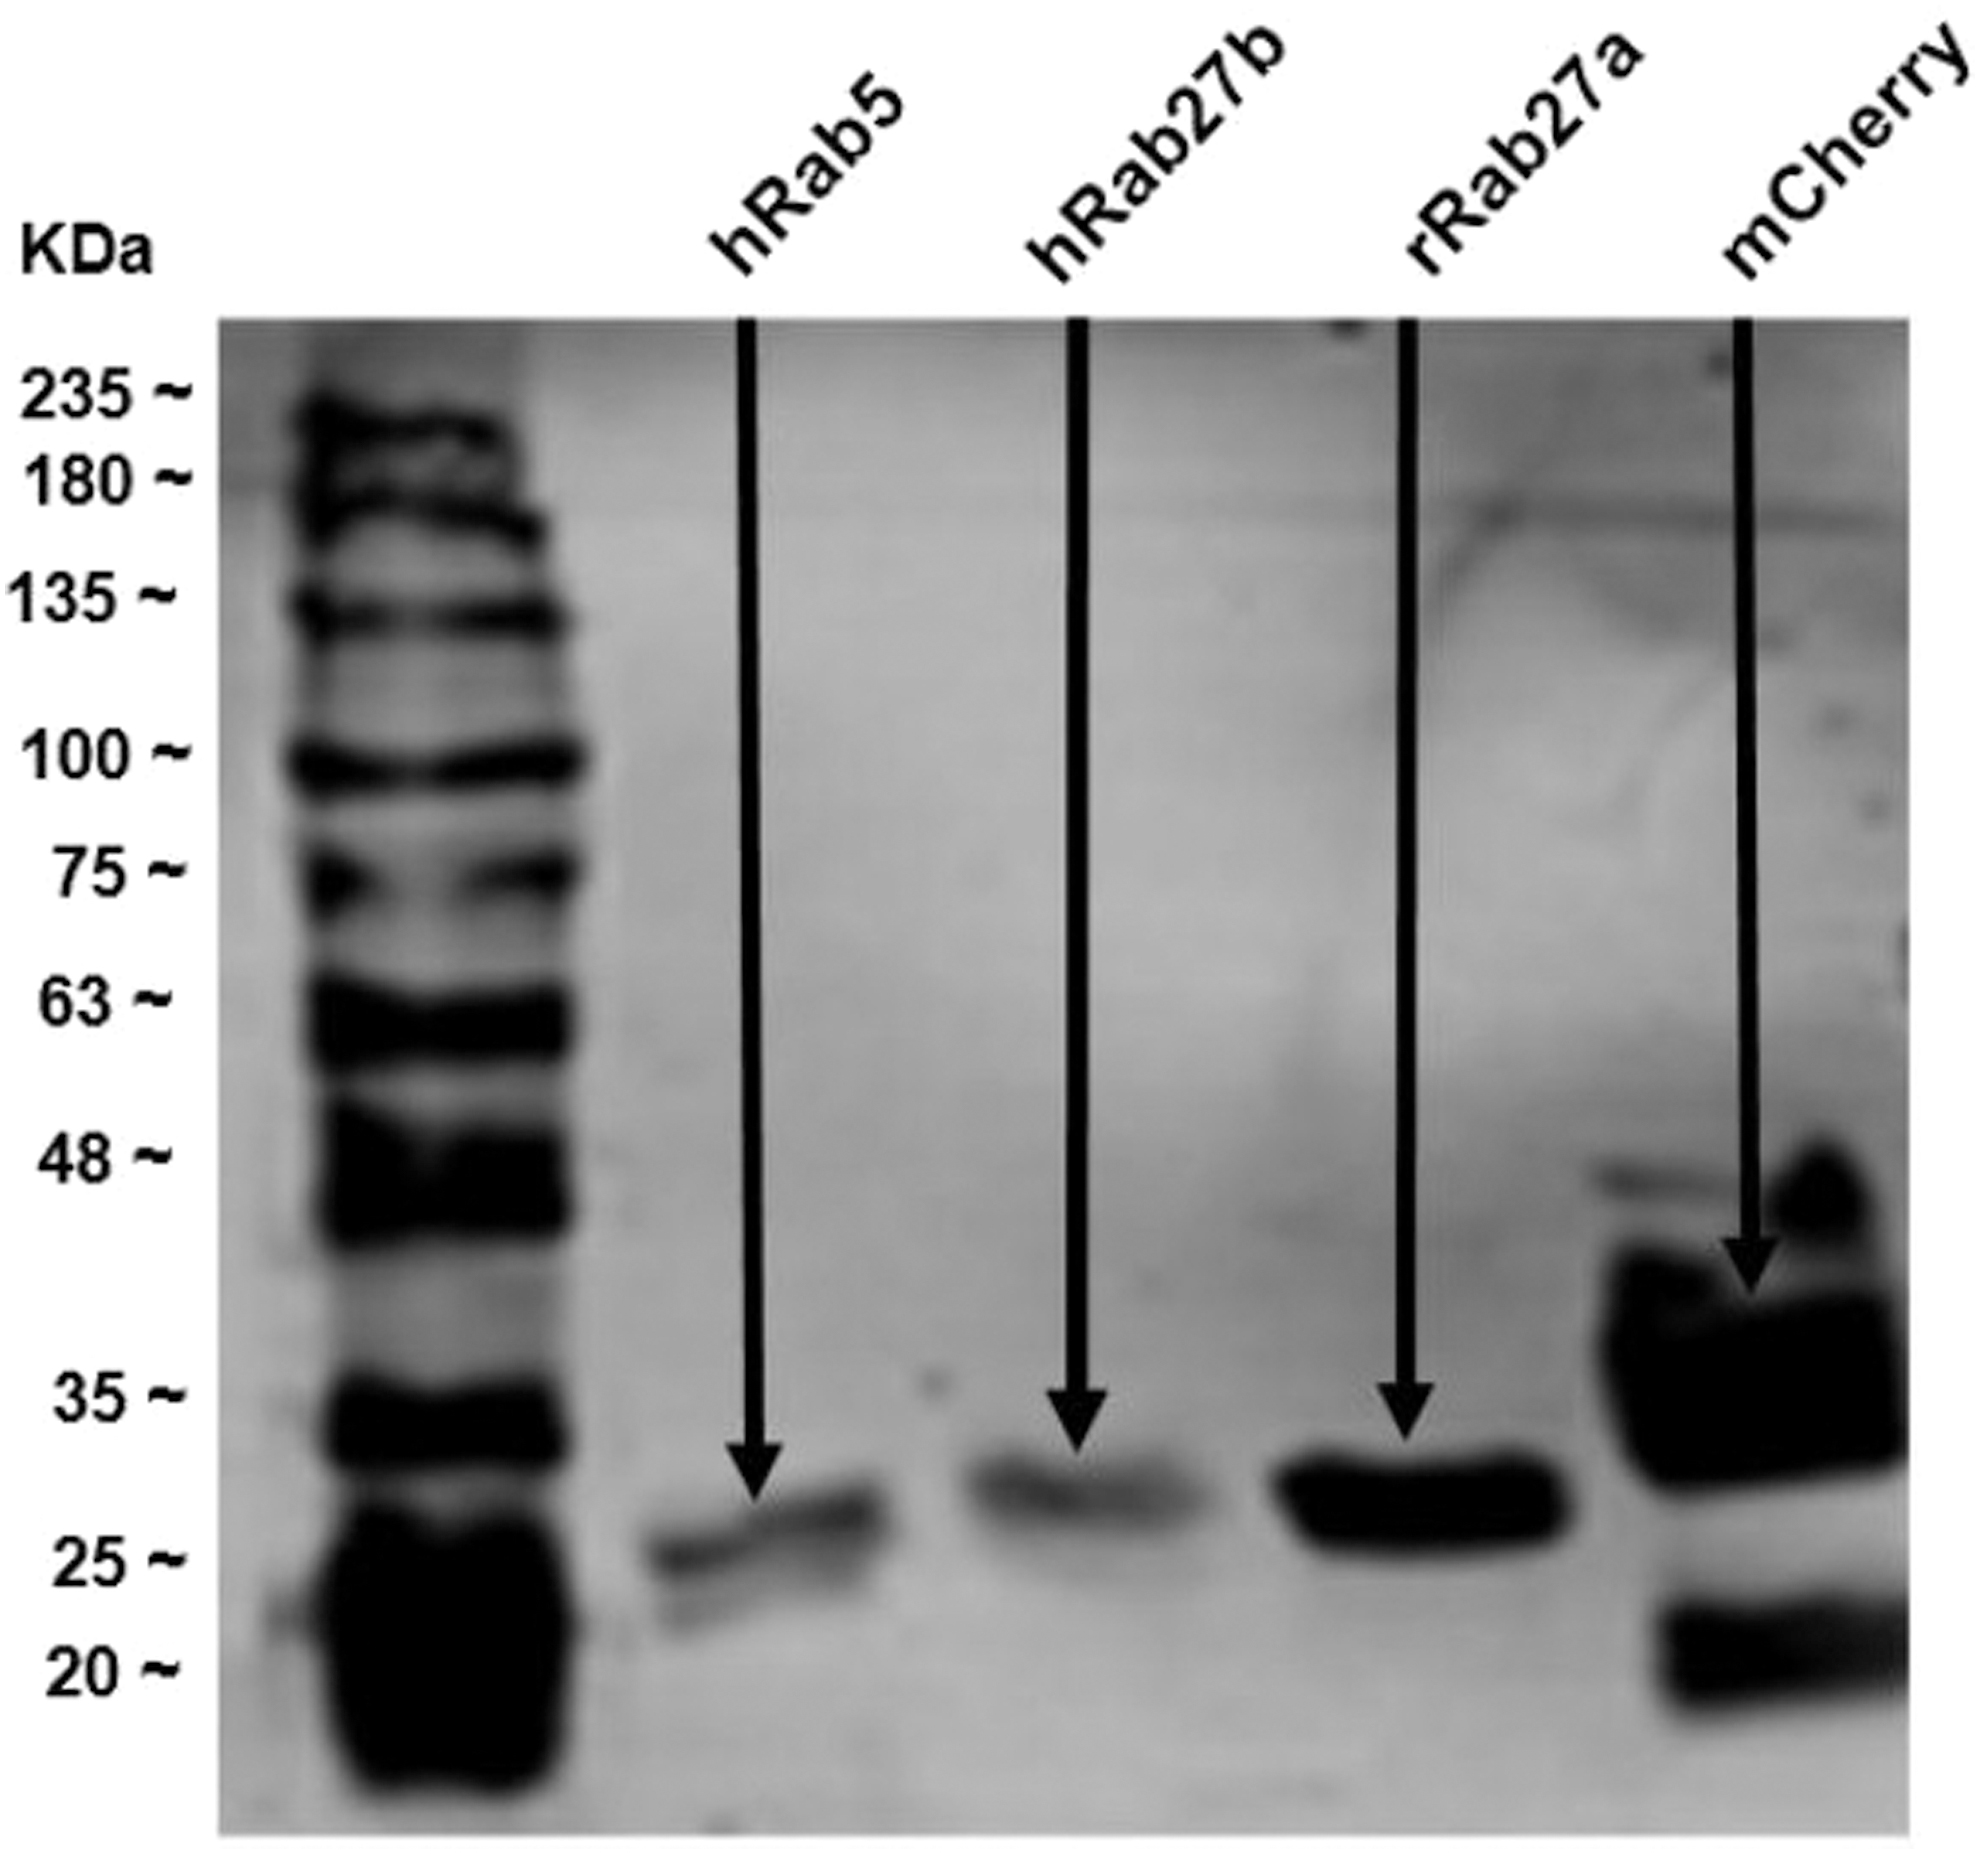
Western blot analysis profile of different 6 × Histidine recombinant proteins. 6 × Histidine-hRab5 (27.20 kDa), 6 × Histidine-hRab27b (28.38 kDa), 6 × Histidine-rRab27a (28.85 kDa), and 6 × Histidine-mCherry (30.86 kDa) recombinant proteins were loaded into 10% SDS-PAGE gel, transferred into PVDF membrane and immunoblotted with monoclonal anti-poly-Histidine antibody. Abundant protein bands (the arrows indicate bands) were detected at the predicted molecular weights for the transferred proteins. Reproduced from Al-Saad et al. (in press). 60
To disrupt the interaction between hRab27b and mSlp1 effector protein, 0.15 μM mCherry-hRab27b (as this concentration was used to determine the binding affinity of mSlp1 in the previous experiments) and 0.7 μM GFP-mSlp1 (double the calculated EC50; to saturate the binding with hRab27b) were incubated and different concentrations (0.0, 0.03, 0.1, 0.3, 1.0, 3.0, and 4.5 μM) of unlabeled rRab27a, hRab27b, and hRab5 were used as competitive inhibitors. The interaction between hRab27b and mSlp1 was completely disrupted using unlabeled Rab27a and Rab27b (evidenced by IC50 values), whereas Rab5 failed to disrupt the interaction (Fig. 15A). Consistent with this, the IC50 values of unlabeled rRab27a and hRab27b (0.035 and 0.026 μM) were lower compared with hRab5 (16.11 μM). Also, Rab5 failed to produce an inhibitory sigmoid curve, whereas Rab27a/b succeeded in producing inhibitory sigmoid curves.
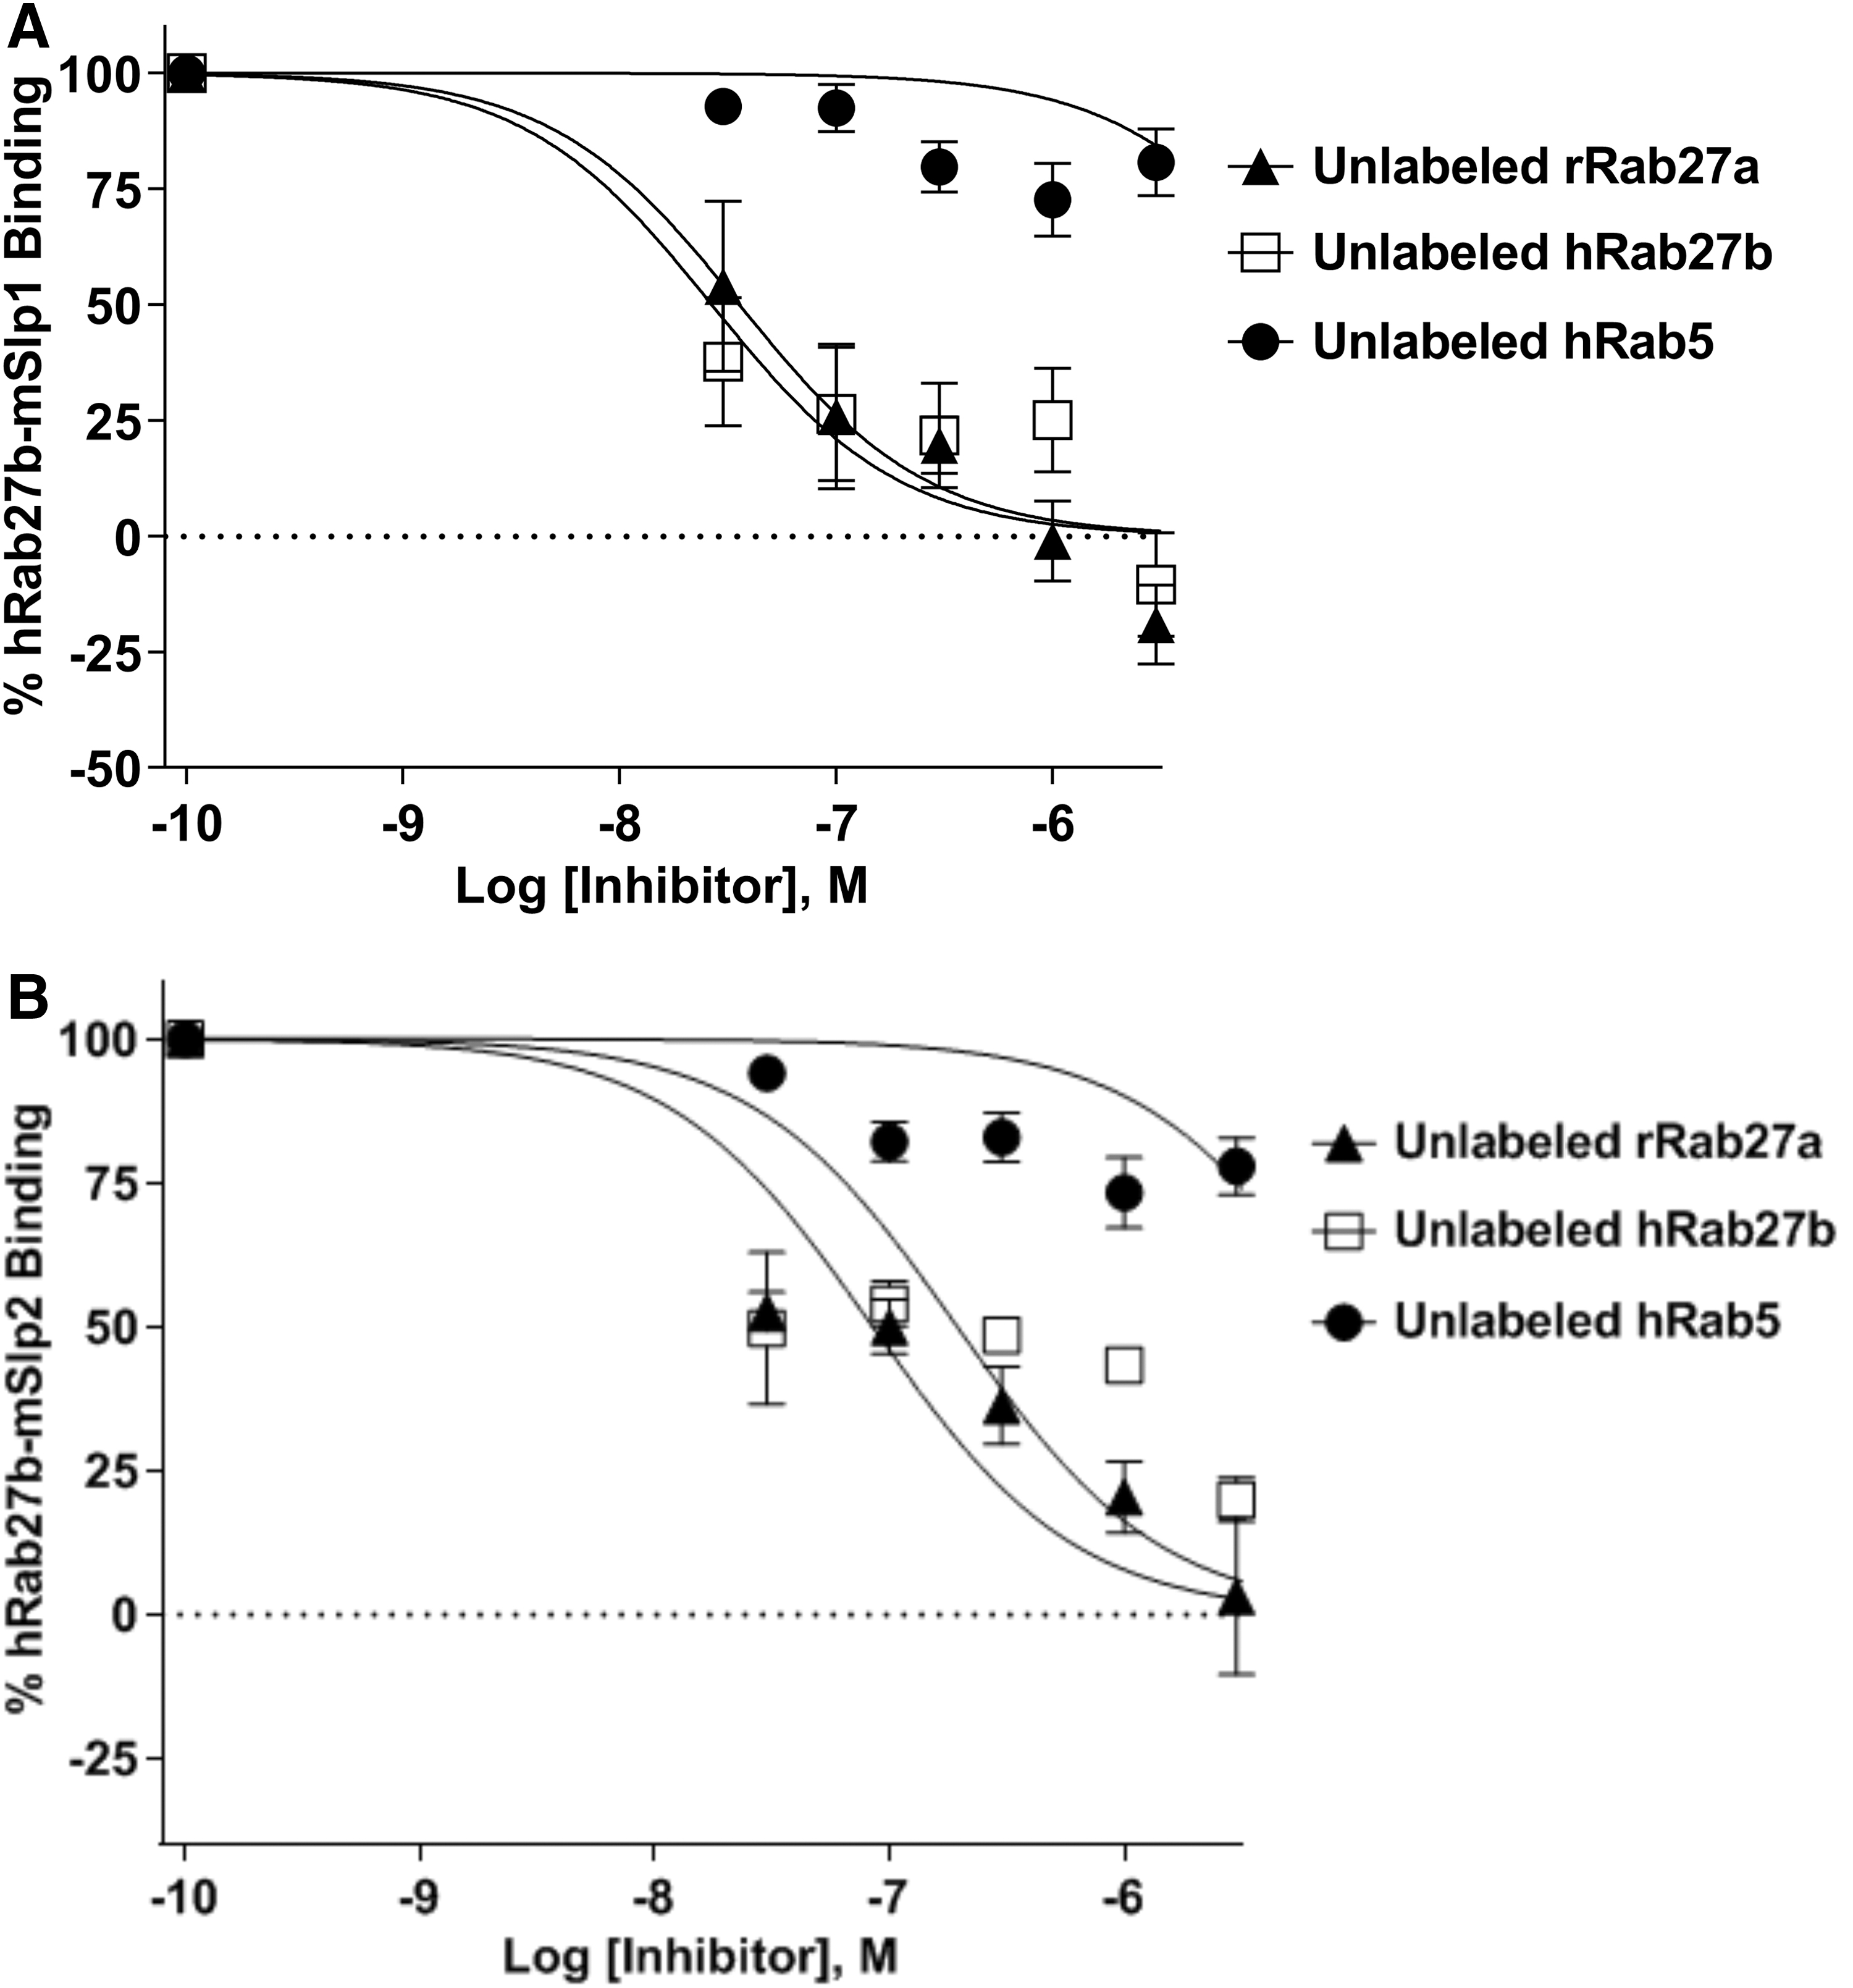
Disruption of hRab27b interaction with either mSlp1 or mSlp2 effector proteins using different unlabeled Rabs. Different concentrations (0.0, 0.03, 0.1, 0.3, 1.0, 3.0, and 4.5 μM) of unlabeled rRab27a (black filled triangle) and hRab27b (empty square) and hRab5 (black filled circle) (as a negative control) were used to disrupt the binding between:
Next, to further investigate the specificity of this assay, the same concentrations of the previously described Rab proteins were used to test the possibility of disrupting the interaction between hRab27b and mSlp2 using 0.15 μM mCherry-hRab27b and 0.3 μM GFP-mSlp2 (double the calculated EC50) (Fig. 15B). Repeatedly, the interaction between hRab27b and mSlp2 was completely disrupted using unlabeled rRab27a and hRab27b, whereas hRab5 failed to disrupt the interaction. This was evidenced by the IC50 values of unlabeled rRab27a (0.084 μM) and hRab27b (0.194 μM), which were lower compared with hRab5 (9.075 μM). Consequently, the specificity of the FRET-based protein–protein interaction assay was confirmed and this indicates that this assay can be used in the future to test and determine the effects of the candidate inhibitors of Rab27–effector interactions.
Discussion
The early studies to determine the binding of different Rab27 effectors were based on using the coimmunoprecipitation assays and simple glutathione-S-transferase (GST) pulldown techniques. 61 These assays involve performing multiple experimental steps; such as binding of the GST-fused proteins to glutathione, washing off the unbound protein fractions, elution of the bound proteins, separation of the bound proteins using SDS-PAGE, and analyzing them by western blot, which occasionally requires high-quality specific antibodies. 62 –65 This suggests that some bound proteins might be lost during performing those multiple experimental steps, thus affecting the sensitivity of those assays. In addition, accurate measures of the binding affinity cannot be obtained, for instance it is difficult to measure the EC50 values of the protein–protein interactions and the IC50 values for the candidate inhibitors as binding affinity sigmoid curves cannot be established accurately. Therefore, these techniques might be considered as effective qualitative rather than accurate quantitative measures of the protein–protein interactions.
This provokes the identification and development of an assay that can be used in determining Rab27–effector interactions, both quantitatively and qualitatively, which can be utilized further in testing the effects of the candidate inhibitors of those interactions.
Initially, this study experiments have mainly been focused on establishing and developing a robust FRET-based protein–protein interaction assay to be used as an in vitro measure of the binding affinity of Slp1 and Slp2 effector proteins to Rab27a/b proteins. Therefore, intermolecular FRET strategy was used and optimized, since the FRET is directly dependent on the binding between the interacting components and upon dissociation of these components, FRET signals are almost diminished. In comparison, using the intramolecular FRET strategy does not always ensure that the FRET is specific and directly related to the binding between the interacting components as they are already found in a complex form. It is more dependent on protein conformational changes than depending on direct protein–protein interaction, thus requiring further optimization experiments to obtain specific FRET signals. 66
To obtain robust FRET signals, the acceptor and donor fluorophores with highest fluorescence intensity must be chosen to be used and their excitation–emission spectra should overlap. 67 Therefore, GFP-(mSlp1 or mSlp2) and mCherry-hRab27 recombinant proteins were chosen to be used as donor and acceptor fluorophores, respectively. In addition, the fluorescence intensity of GFP and mCherry proteins are powerful and their excitation–emission spectra overlap as described previously in the section “Introduction”. In the early stages, preliminary experiments were performed using the appropriate controls (GFP and mCherry proteins) to test the possibility of FRET occurrence between mCherry-hRab27b and GFP-mSlp1 effector protein. These experiments demonstrated clearly that significant and specific FRET signals were obtained using those interacting components. In agreement with this, early FRET experiments using enhanced GFP-(donor)-DsRed-(acceptor) (the early discovered red fluorescent protein) pair revealed that the critical distance (r 0) for FRET occurrence (when FRET efficiency is 50%) was 4.73 nm. 68 Moreover, the calculated r 0 value of the enhanced GFP-(donor)-mCherry-(acceptor) pair ≈5.1–5.24 nm. 55,69 This suggests that GFP-mSlp1/2 and mCherry-hRab27 can produce significant FRET signals upon interaction of mSlp1/2 with hRab27, thus GFP and mCherry come close to each other, leading to FRET occurrence.
Altogether, the FRET evidence found in literature and preliminary data provided the basis to perform further experiments and assured that this approach can be used to determine Rab27–effector protein interaction and optimization of the assay was conducted accordingly. In general, the FRET signals are not always powerful and detectable, 67 therefore the conditions of the FRET assay were optimized, including optimization of the concentration of GTP, the incubation time of the interacted components, and using of the appropriate microplate reader with the proper fluorescence sensitivity. In addition, different concentrations of mCherry-hRab27b recombinant protein (0.6, 0.3, and 0.15 μM) were used to measure the FRET signals and fix the concentration of the acceptor protein. These experiments demonstrated that 0.15 μM mCherry-hRab27 recombinant protein was optimum to obtain powerful FRET signals and saturate the binding with mSlp1 and mSlp2 effector proteins. Note that as the concentration of the acceptor (mCherry-hRab27) is increased, a wide range and higher concentrations of the donor (GFP-mSlp1 or GFP-mSlp2) should be used. Therefore, mCherry-hRab27 concentration was decreased and optimized as much as possible to use lower concentrations of the donor (due to volume limitations).
The mSlp1 and mSlp2-binding affinity to hRab27b protein was determined and the EC50 values were calculated accordingly. Negative control experiments were performed using the appropriate controls; these involved testing the interaction of: GFP with mCherry-hRab27b, mCherry with GFP-mSlp1, and mCherry with GFP-mSlp2. Altogether, the results of these control experiments demonstrated that the binding between mCherry-hRab27b and GFP-Slp1 or GFP-mSlp2 was specific and the binding affinity was not comparable to that of the negative control experiments. In addition, these experiments revealed that the binding affinity of mSlp2 to Rab27b is higher compared with mSlp1. The binding affinity of mSlp1 and mSlp2 was further investigated by testing the binding of 0.7 μM GFP-mSlp1 and 0.3 μM GFP-mSlp2 to mCherry-hRab27b (full length; 1–218 and C-terminal truncated; 1–200). The binding of mSlp2 to either full length or C-terminal truncated Rab27b was higher compared with mSlp1, since the used concentration of mSlp1 was almost double the concentration of mSlp2. In addition, these experiments revealed that there is not crucial role for the C-terminal of Rab27 in terms of binding to its effectors.
To further investigate this finding, the interaction of GFP-mSlp1 and GFP-mSlp2 with mCherry-hRab27a was tested. Recurrently, the binding affinity of mSlp2 to Rab27a was higher compared with mSlp1. As the binding affinity of mSlp2 is higher compared with mSlp1 to either Rab27a or Rab27b, mSlp2 can be used as a typical Rab27 effector in this assay when testing the effects of the candidate inhibitors for these interactions.
To further assess the specificity of this assay in terms of using it to identify and determine the effects of the candidate inhibitors of Rab27–effector interactions, the information from the binding affinity experiments (the calculated EC50 values) was used to disrupt the interaction between Rab27b and Slp1/Slp2 using unlabeled Rab27a/b (as typical competitive inhibitors) and Rab5 was used as a negative control. The results of these experiments demonstrated that both unlabeled Rab27a/b were able to disrupt Rab27b–Slp1/2 interactions, whereas Rab5 does not disrupt the interactions between Rab27 and its effectors.
Overall, both the binding affinity experiments using mSlp1 and mSlp2 effector proteins and the competition experiments using unlabeled Rab27a/b as typical competitive inhibitors confirmed the validity and fidelity of the FRET-based protein–protein interaction assay. This assured that this assay is powerful and robust in terms of determining Rab27–effector protein interaction and can be used to test the effects of the candidate small molecule and peptide inhibitors of these interactions in the future.
In agreement with this finding, the Rab27a-binding affinity to different effector proteins was determined using immunoprecipitation assay in COS-7 cells; the descending order of the binding affinity was found to be as follows: rabphilin > Slp2-a > Slp1 > Slp5 > Slp4-a > Slac2-b > Noc2 > Slac2-a > Slac2-c > Slp3-a. Accordingly, rabphilin, Slp2-a, Slp1, Slp5, Slp4-a, Slac2-b, and Noc2 effectors were considered as a high-affinity-binding group for Rab27a, whereas Slac2-a, Slac2-c, and Slp3-a were considered as a low-affinity-binding group. 61 Therefore, these findings could provide the basis for focusing on mSlp2 when developing Rab27–effector interaction inhibitors in the future.
Accordingly, by optimization of the FRET-based protein–protein interaction assay, significant and specific FRET signals were obtained. Therefore, this exquisite assay was utilised to determine the binding affinity of mSlp1 and mSlp2 to Rab27a/b and it was found that the binding affinity of mSlp2 is higher compared with mSlp1 (evidenced by EC50 differences). In addition, the specificity of this assay was confirmed using unlabeled Rab27a/b as typical competitive inhibitors and the IC50 values for those inhibitors were determined. This assay has also many advantages over the classical GST pulldown assays as it involves performing fewer experimental steps and does not require using of high-quality specific antibodies, thereby it functions as an effective and sensitive measure for Rab27–effector interactions. Therefore, this assay can provide an in vitro read-out for Rab27–effector interactions and can be used in the future to identify candidate inhibitors of these interactions.
Footnotes
Acknowledgments
The authors would like to thank David Tooth (Center for Biomolecular Sciences, University of Nottingham, Nottingham, United Kingdom) for technical assistance and performing mass spectrometry analysis. Also, they wish to thank Steven Charlton (School of Life Sciences, University of Nottingham, Nottingham, United Kingdom) for giving permission to use the CLARIOstar microplate reader in his laboratory.
Disclosure Statement
I.K., and A.N.H. are employees of the University of Nottingham. R.Z.A.-S. was supported by the Iraqi Ministry of Higher Education, and Scientific Research/the Iraqi Culture Attaché in the United Kingdom funded PhD studentship.
Funding Information
This work was supported by the Iraqi Ministry of Higher Education, and Scientific Research/the Iraqi Culture Attache´ in the United Kingdom funded PhD studentship awarded to R.Z.A.-S.