




Abstract
Nanoemulsions (NMs) are one of the most important colloidal dispersion systems that are primarily used to improve the solubility of poorly water soluble drugs. The main objectives of this study were, first, to prepare an NM loaded with fenofibrate using a high shear homogenization technique and, second, to study the effect of variable using a central composite design. Twenty batches of fenofibrate-loaded NM formulations were prepared. The formed NMs were subjected to droplet size analysis, zeta potential, entrapment efficiency, pH, dilution, polydispersity index, transmission electron microscopy (TEM), Fourier transform infrared spectrophotometry, differential scanning calorimetry (DSC), and in vitro drug release study. Analysis of variance was used for entrapment efficiency data to study the fitness and significance of the design. The NM-7 batch formulation demonstrated maximum entrapment efficiency (81.82%) with lowest droplet size (72.28 nm), and was thus chosen as the optimized batch. TEM analysis revealed that the NM was well dispersed with droplet sizes <100 nm. Incorporation of the drug into the NM was confirmed with DSC studies. In addition, the batch NM-7 also showed the maximum in vitro drug release (87.6%) in a 0.05 M sodium lauryl sulfate solution. The release data revealed that the NM followed first-order kinetics. The outcomes of the study revealed the development of a stable oral NM containing fenofibrate using the high shear homogenization technique. This approach may aid in further enhancing the oral bioavailability of fenofibrate, which requires further in vivo studies.
Introduction
Nanoemulsions are thermodynamically unstable isotropic systems with droplet sizes that range between 1 and 100 nm. A nanoemulsion (NM) consists of two immiscible fluids, that is, oil and water, which are mixed together to form a single phase by the application of an emulsifying agent, such as surfactants and cosurfactants. NMs are used therapeutically as a diagnostic agent or as drug carriers, in which the active ingredient is dissolved, entrapped, or encapsulated. An oil phase is usually used to dissolve or entrap the drug. Surfactants and cosurfactants are used to solubilize the oil and aqueous phases by reducing the interfacial tension between them. NMs are used to solve problems associated with the conventional dosing system such as low aqueous solubility, low permeability, high molecular weight, presystemic first pass effect, enzymatic degradation, gastric irritation, low bioavailability, and stability of drugs. NM is a liquid dosage form and found to be safe for invasive and oral route. NM provides excellent oral, parental, ophthalmic, and topical drug delivery by controlling the release of drug and focusing on the site-specific action. NM also improves the biological performance with reduced toxicity and side effects of active pharmaceutical ingredients. It also improves the chemical as well as physical stability of active pharmaceutical ingredients. 1,2
Our study used fenofibrate as the drug candidate for encapsulation into NMs. Fenofibrate is a lipid-lowering medication used clinically as a hypolipidemic agent to decrease cardiovascular disease risk caused by atherosclerosis. Peroxisome proliferator-activated receptor-α (PPARα) is a gene transcription regulating receptor present in the liver, fat, kidney, skeletal muscle, and adipose tissue and helps in fatty acid oxidation. Fenofibrate activates the PPARα, and activation of PPARα enhances lipoprotein lipase synthesis and fatty acid oxidation. Fenofibrate is a Biopharmaceutical Classification System Class II drug and is practically insoluble in water; partially soluble in methanol and ethanol; and soluble in chloroforms, acetone, and benzene. Its water solubility is 0.42 mg/L at 25°C. The chemical structure of fenofibrate is shown in Figure 1. The absorption of fenofibrate takes place from the gastrointestinal tract. Food is the major factor that affects the absorption of fenofibrate. Its absorption is increased with meals. The absorption of fenofibrate from microcoated tablets in the presence of food increases up to 35%. Therefore, it is recommended to have food with fenofibrate. After the drug is dissolved, peak plasma levels of its active metabolite fenofibric acid are usually observed around 3 h after administration. Fenofibric acid is metabolized by two pathways: one by glucuronide conjugation and second by carbonyl reduction. The excretion of fenofibric acid is mainly done in the urine ∼60%–88% and ∼5%–25% of the drug is excreted in feces. 3,4 In addition, fenofibrate has also been reported to have noticeable side effects, such as severe stomach/abdominal pain, muscle pain, vomiting, yellowing of eyes and skin (jaundice), dark urine, and weakness. Poor solubility and poor bioavailability of fenofibrate in aqueous phase are the most important problems that can be improved by novel formulation using various approaches, including nanoformulaion, solid dispersion, and complexation. The drug is contraindicated in kidney failure, liver failure, and in gallbladder disease. There is no marketed formulation available other than tablets and capsules of fenofibrate due to its poor bioavailability problems. 5
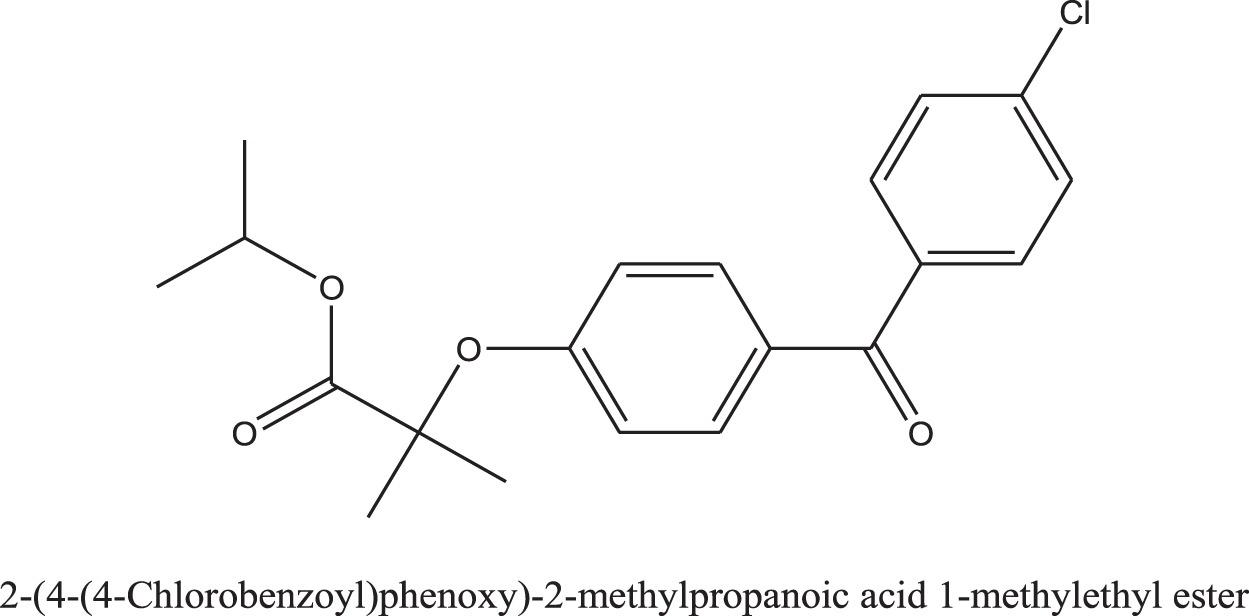
Structure of fenofibrate.
The primary aims behind the study are the designing and development of a fenofibrate NM formulation as a drug delivery system specifically to control droplet size, to improve solubility, to improve bioavailability, to improve patient compliance and release of the drug fenofibrate to attain the desired action of the drug. 6,7
Olive oil was used as an oil phase for the formulation of drug NM. This is because fenofibrate is soluble in olive oil. In addition, olive oil also contains large amounts of antioxidants that prevent bad low-density lipoprotein cholesterol from oxidation, thereby reducing the risk of heart diseases. It is also well regulated and is accepted by the major drug regulatory bodies, namely the Food and Drug Association. 8,9
Tween 80 and polyethylene glycol 400 (PEG 400) were used as surfactant and cosurfactant, respectively, in our study. Both are water soluble. Tween 80 is widely used as a surfactant in lipid base formulations, in cosmetics, in food products, and in various pharmaceutical formulations. Moreover, it is also nontoxic and nonirritant. 10
PEG 400 is soluble in water, benzene, acetone, propylene glycol, and alcohol and slightly soluble in aliphatic hydrocarbons. PEG 400 is commonly used as a surfactant, plasticizer, solvent, ointment, and also as a suppository base. PEG 400 has low toxicity with <0.5% absorption into body fluids. 11
The major objective behind the study was to formulate fenofibrate-loaded NMs by the high shear homogenization technique. The subsequent objectives were to study the effect of important variables, namely concentration of oil, concentration of Smix (surfactant and cosurfactant), and pressure of homogenizer on the entrapment efficiency of the NM. The high shear homogenization technique was selected for the preparation of NMs because it produces droplet sizes of up to nanolevel, and large amounts of NMs can be prepared in very less time, which could be easily transferred for larger scales.
Materials and Methods
Materials
Fenofibrate and olive oil were procured from Om Pharmaceutical Industries, Palghar, India, and from the Central Drug House Laboratory, India, respectively. Tween 80, PEG 400, and methanol were procured from Loba Chemie, Mumbai, India. Sodium lauryl sulfate (SLS) was purchased from Fisher Scientific, Mumbai, India.
Methods
Preparation of fenofibrate NM
For the preparation of fenofibrate-loaded o/w type NM, first, the oil phase was prepared by proper mixing of fenofibrate with olive oil. The aqueous phase was then prepared by mixing the surfactant Tween 80, cosurfactant PEG 400, and distilled water. The oil phase was then added to the aqueous phase at 100 revolutions per minute (rpm) at 40°C–50°C. This coarse emulsion was mixed together using a high-speed homogenizer (ULTRA-TURRAX; IKA India Pvt Ltd) at 3387 g for further 3 min to reduce the droplet size. The emulsion was eventually homogenized using a high shear homogenizer (Microfluidics, USA) at different pressures mentioned in Table 1. The concentration of fenofibrate to encapsulate in the NM was 9.6 mg/mL.
Data Obtained from Various Central Composite Designed Fenofibrate-Loaded Nanoemulsion Batches Formulated Using High Shear Homogenization Technique
The values in bracket indicate coded values. 20
NM, nanoemulsion.
Optimization of the fenofibrate NM using a central composite design
The experiments were designed using a central composite design (CCD) via Design Expert Software to evaluate the effect of important variables, namely (i) concentration of oil (X1), (ii) concentration of Smix (X2), and (iii) pressure of the homogenizer (X3) on the drug entrapment efficiency. The details of the twenty batches of fenofibrate-loaded NMs (NM-1 to NM-20) are enlisted in Table 1.
The CCD constituted of 8 (kn) batches of full factorial design (NM-1 to NM-8); 6 (2n) batches on axial points (NM-9 to NM-14) at an alpha value of 1.682, and 4 replicates at the center points (NM-15 to NM-18). CCDs are most commonly used for nonlinear responses involving second-order models.
Construction of the pseudoternary-phase diagram
The pseudoternary-phase diagram was plotted by an aqueous titration method. The olive oil and Smix were properly mixed and then titrated with distilled water to obtain a clear transparent NM. The quantities of surfactant and cosurfactant were optimized through different ratios of Smix (1:1, 2:1, 3:1, and 1:2). The visual appearance of emulsion and the area of oil-in-water NM region were adopted from the assessment criteria for the evaluation of cosurfactant. 12
Characterization of fenofibrate-loaded NM
Droplet size measurement and polydispersity index
For the measurement of droplet size, the fenofibrate NM (1 mL) was diluted with the distilled water (5 mL). The diluted sample of NM was transferred to a polystyrene cuvette and then scanned using a Zetasizer instrument (Malvern, UK). After the completion of the scan, the average diameter/size was recorded as Z-average. Polydispersity index (PDI) is an index of the spread or variation within the distribution of droplet size. If the value of PDI is low, then it indicates that the sample is uniformly distributed or a monodisperse sample, while its higher value indicates more dispersion of sample or a polydisperse sample. All the samples should be carried out in triplicate. 13
Zeta potential
It is used to measure the surface charge of droplets when placed in a liquid. In the present study, zeta potential analyses of all batches were carried out using Zetasizer instrument. Zeta potential may be positive or negative based on the oil and surfactant ratio. All the samples should be carried out in triplicate. 14
Entrapment efficiency
Entrapment efficiency expresses the amount of drug entrapped into an NM. An entrapment efficiency of 100% means that the total drug is entrapped into the NM. The entrapment efficiency of fenofibrate-loaded NM was determined by centrifuging 1 mL of NM at 12577 g for 30 min. After centrifugation, filter the supernatant using a 0.45 μm syringe, and then, the drug content was determined by a ultraviolet (UV)-visible spectrophotometer in triplicate.
14

pH
A pH meter was used for measuring the pH of the NM. The pH of the NM was measured at 25°C by immersing the electrode of the digital pH meter in the formulation. 15
Dilution test
A small amount of the formulated NM was diluted with water. If there is no stability issue after its dilution with water, then it is o/w emulsion; whereas if the oil phase and aqueous phase are apart after its dilution with water, then it is a w/o emulsion. 16
Fourier transform infrared spectrophotometry
Infrared (IR) spectrometry can be used to investigate and predict the physicochemical interactions between different components in a formulation. The Fourier transform infrared (FTIR) spectroscopy of various samples was done from an Alpha, Bruker, Germany equipment. The spectra were recorded for the pure drug (fenofibrate), surfactant (Tween 80), oil (olive oil), cosurfactant (PEG 400), and the fenofibrate-loaded NM. The FTIR spectra of all the samples were recorded from the range 400–4,000 cm−1. 17
Differential scanning calorimetry
Differential scanning calorimetry (DSC) measurements can be used to investigate and predict the physicochemical interactions between different components in a formulation. DSC measurement was done on a DSC Q10 V9.9 (TA Instruments, Waters, USA) differential scanning calorimeter. The calibration of the DSC was done with the help of indium used as a standard. Then the samples (fenofibrate, Tween 80, blank NM, fenofibrate-loaded NM) were taken in the sealed aluminum pans and heated under a controlled atmosphere of N2 gas (the flow of gas should be 60 mL/min) at a rate of 10°C/min from 40°C to 100°C, taking an empty aluminum pan as a reference. 17
Transmission electron microscopy
Transmission electron microscopy (TEM) of fenofibrate-loaded NM was carried out by a transmission electron microscope (Hillsboro, OR). TEM was used to study the globules shape and size and also to visualize any type of impurity present in NM. The 5 μL sample of fenofibrate-loaded NM was taken on the copper grid, stained with 5 μL of 2% uranyl acetate (negative stain), and allowed to settle for about 2–3 min. The excess sample of fenofibrate-loaded NM was removed with the help of tissue paper and allowed to dry, and then visualized. 18
In vitro dissolution study
The in vitro drug release of fenofibrate NM was carried out by the dialysis bag diffusion method in United State Pharmacopoeia (USP) Dissolution Apparatus II (Lab India DS 8000, Mumbai, India) with a rotating speed of 75 rpm using 0.05 M SLS in distilled water as dissolution media. The temperature of the dissolution medium should be maintained at 37°C ± 0.5°C. The cellophane dialysis membrane (molecular weight 12,000 Da; Hi Media Laboratories, Mumbai, India) was soaked in the dissolution medium for 24 h. After that the prepared fenofibrate-loaded NM was filled in the dialysis bag. The dialysis bag was sealed and then put in the dissolution apparatus containing 900 mL of 0.05 M SLS in distilled water as dissolution medium. The 5 mL of sample was withdrawn at a particular time interval with the replacement of same fresh medium of 0.05 M SLS in distilled water to maintain the sink condition. The samples were then analyzed by UV method (concentration range 5–25 μg/mL, absorption maxima 286 nm). 18
Drug release kinetic study
The release mechanism of drug fenofibrate from the NM can be studied by using the in vitro dissolution data of the optimized batch of fenofibrate NM. In vitro dissolution data were fitted in the various kinetic equations to understand the mechanisms and kinetics of fenofibrate release from NM. The various kinetic equations of various models, including zero-order, first-order, Korsmeyer-Peppas models, and Higuchi models, are used. The value of correlation coefficient (R 2 ) was obtained from the various models used for the determination of drug release mechanism and kinetics. 19,20
RESULTS AND DISCUSSION
The 20 formulations of fenofibrate NM were prepared via the high shear homogenization technique using the CCD for optimization of three variables: (i) concentration of oil (mL) (X1), (ii) concentration of Smix (X2), and (iii) pressure of homogenizer (X3). All batches of fenofibrate NM were analyzed for the droplet size, entrapment efficiency, pH, PDI, and zeta potential (Table 2). The findings revealed that NM batch NM-7, which was prepared with a low concentration of oil, a high concentration of Smix (surfactant and cosurfactant), and a high value of pressure, had the highest entrapment efficiency (81.82 ± 0.15%) with the lowest droplet size (72.28). This batch, in addition, also had a PDI of 0.423 and zeta potential of −11.2. The value of PDI was <0.5, which indicates that the droplet sizes are uniform throughout the NM.
Entrapment Efficiency, pH, Droplet Size, Polydispersity Index, and Zeta Potential of Various Batches of Formulations
All values are expressed as mean ± standard deviation, n = 3.
PDI, polydispersity index.
The effects of variables on the entrapment efficiency and particle size were determined with the help of contour plot polynomial equation, Pareto plot, and three-dimensional (3D) response surface plot. The probability value <0.05 was considered a significant level. Analysis of variance (ANOVA) was used to study the significance of the model.
The polynomial equation to determine the relationship between the various variables and drug entrapment efficiency is as follows:
Where Y = entrapment efficiency; X1 = concentration of oil; X2 = concentration of Smix; X3 = pressure; X1X2, X1X3, X2X3 show interaction terms; and X1 2 , X2 2 , and X3 2 are quadratic relationship terms.
The coefficient value of the concentration of oil (X1) was in negative form, showing that the increase in the concentration of oil leads to the decrease in the value of entrapment efficiency, whereas the concentration of Smix (surfactant and cosurfactant) (X2) and pressure of the homogenizer (X3) were found to be positive, indicating that the entrapment efficiency increases with an increase in the concentration of Smix and pressure of the homogenizer. The effects of various coefficients for entrapment efficiency are shown in Figure 2A. The quadratic model was considered significant (p = 0.0174) with an F-value of 4.22 for entrapment efficiency. The 3D response surface plot, Figure 2B, and contour plot, Figure 2C, helped to study the effects of variables on the entrapment efficiency of the drug fenofibrate graphically. ANOVA was used to ensure the significance of model (Table 3).

Analysis of Variance of Regression (Entrapment Efficiency and Particle Size)
p < 0.05.
The polynomial equation to determine the relationship between the various variables and drug particle size is as follows:
Where Y = particle size, X1 = concentration of oil, X2 = concentration of Smix, X3 = pressure
X1X2, X1X3, X2X3 show interaction term, X1 2 , X2 2 , and X3 2 are quadratic relationship terms.
The concentration of oil (X1) and pressure of the homogenizer (X3) were found to be negative, indicating that the average particle size of NM decreases with increase of the concentration of oil and pressure of high shear homogenizer. The ratio F = 4.16 shows the model is significant. The effects of various coefficients for particle size are shown in Figure 3A. The 3D response surface plot, Figure 3B, and contour plot, Figure 3C, helped to study the effects of variables on the particle size graphically.
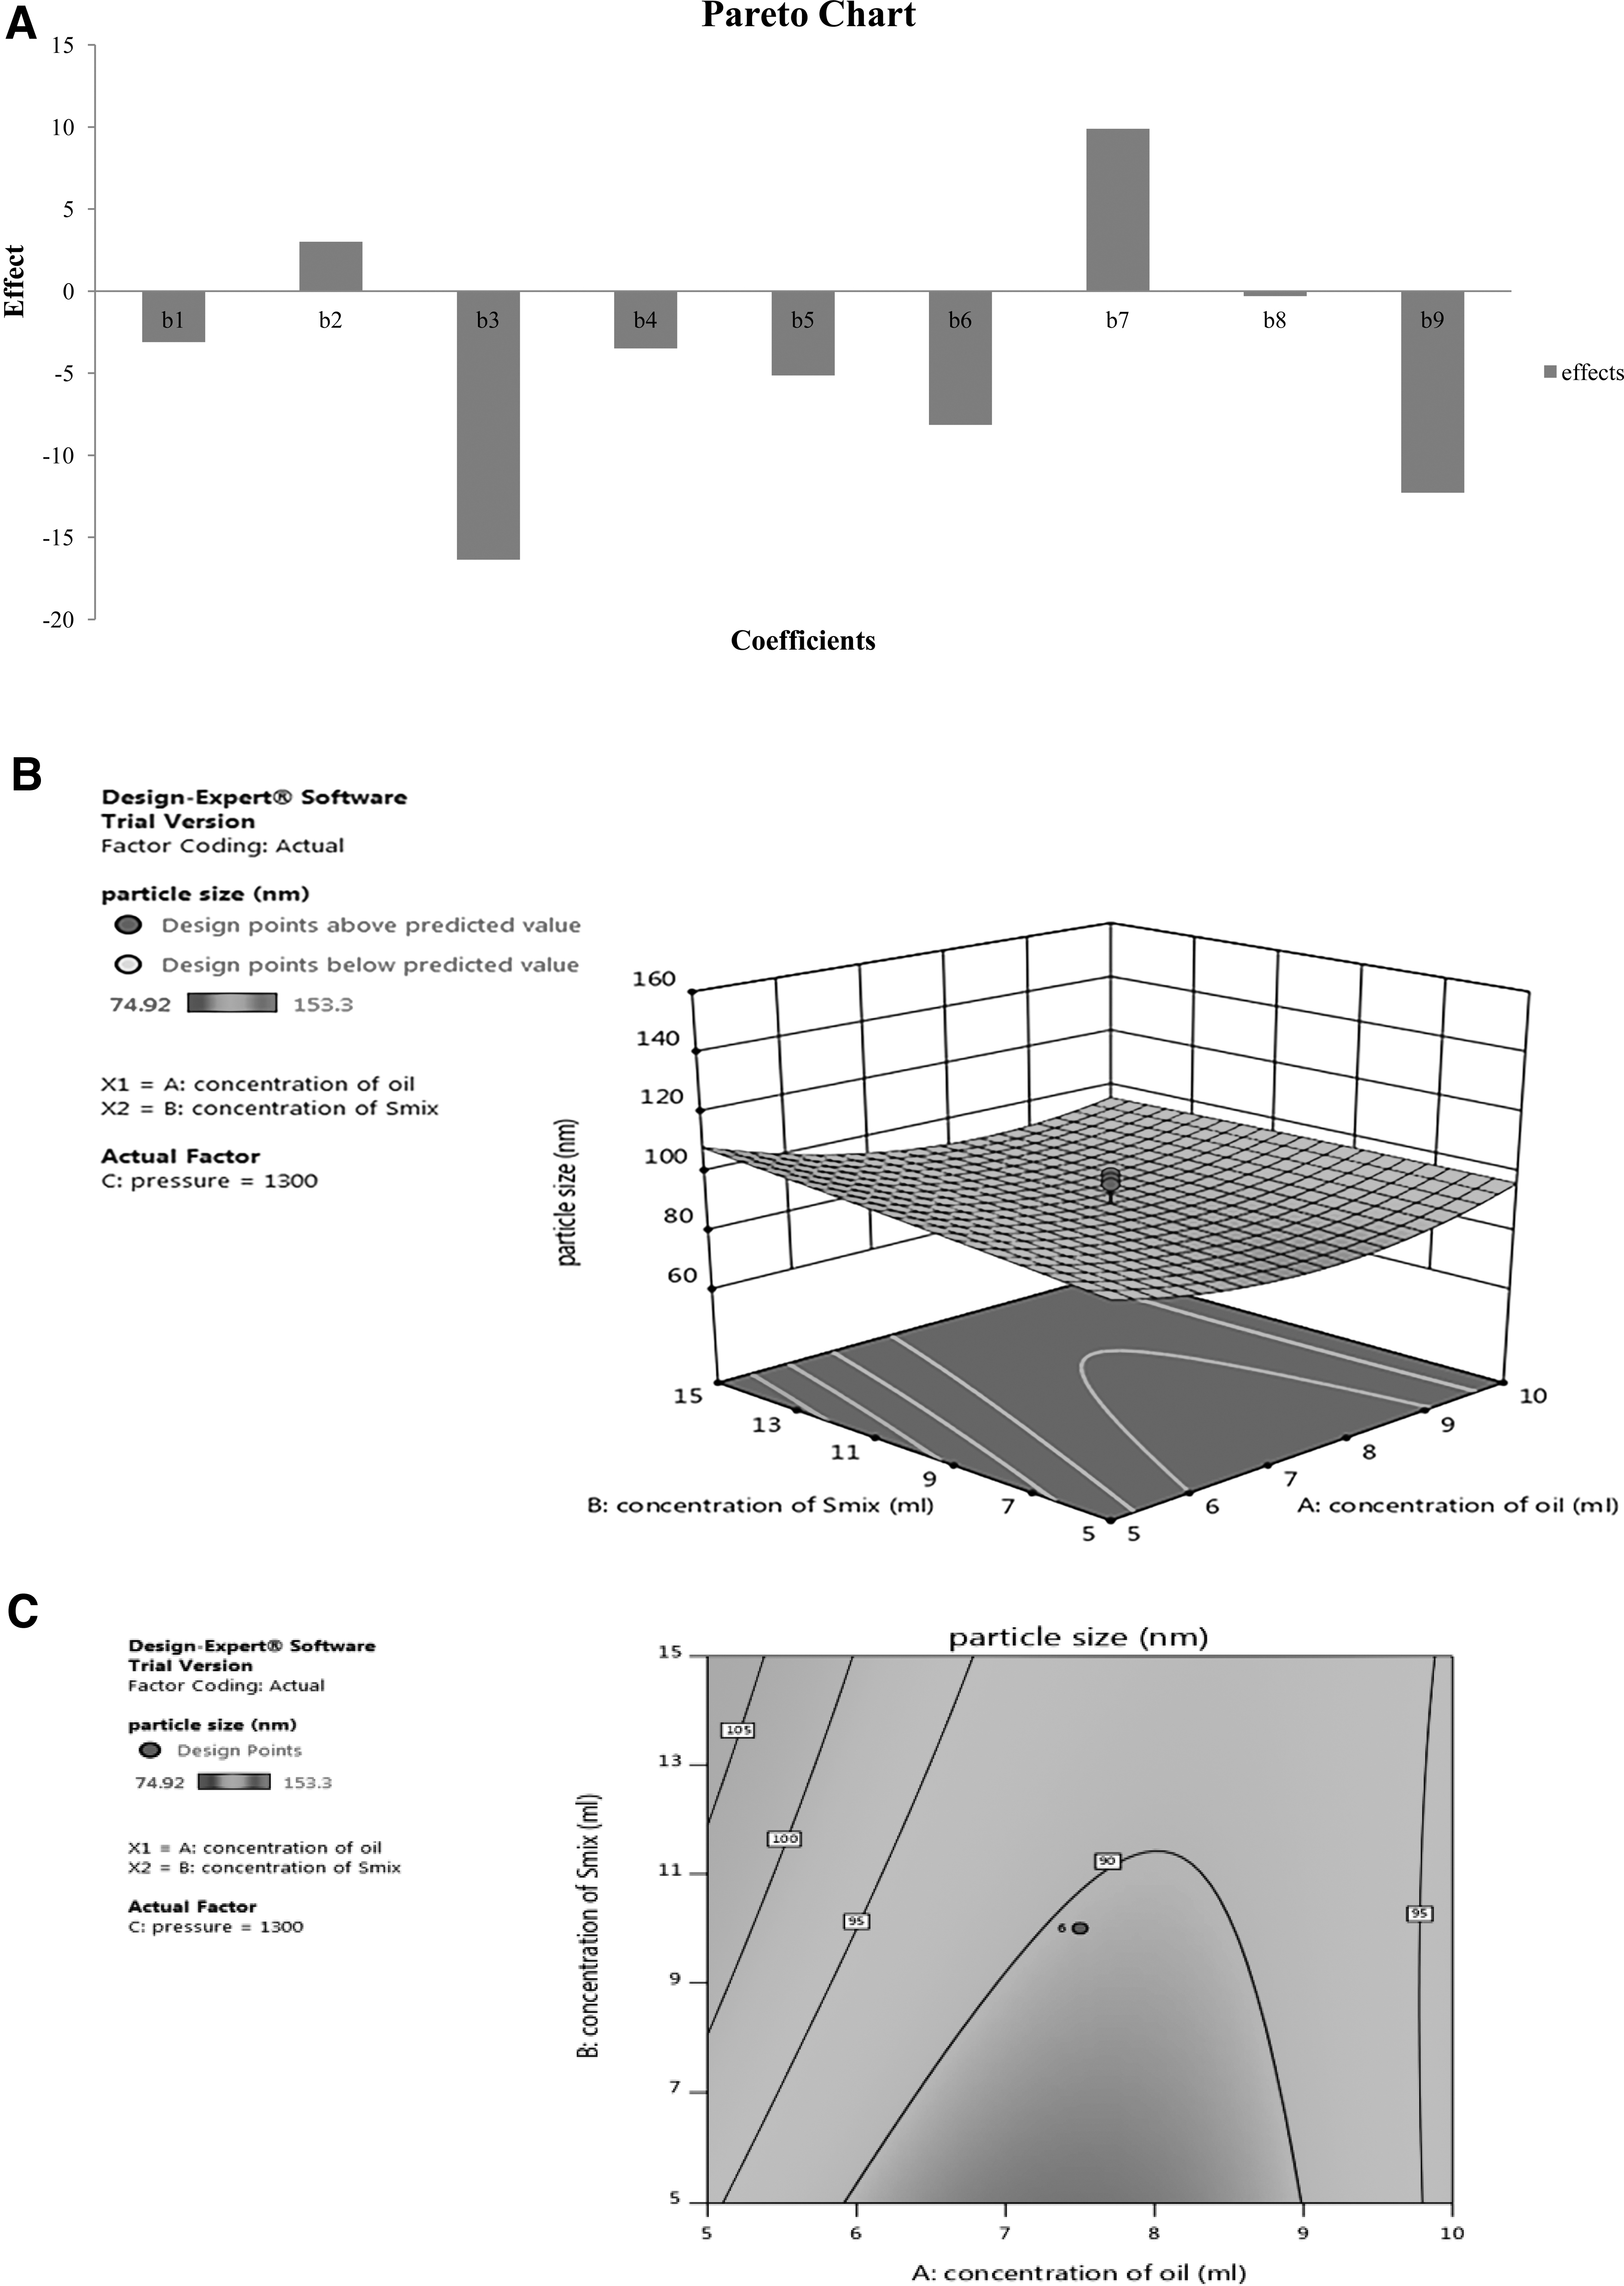
Pseudoternary Phase Diagram
Based on the visual appearance of emulsion and the area of oil-in-water NM region, the 3:1 of Smix (Tween 80 and PEG 400) was chosen for the preparation of NM. Pseudoternary diagram of all the ratios of Smix is shown in Figure 4.
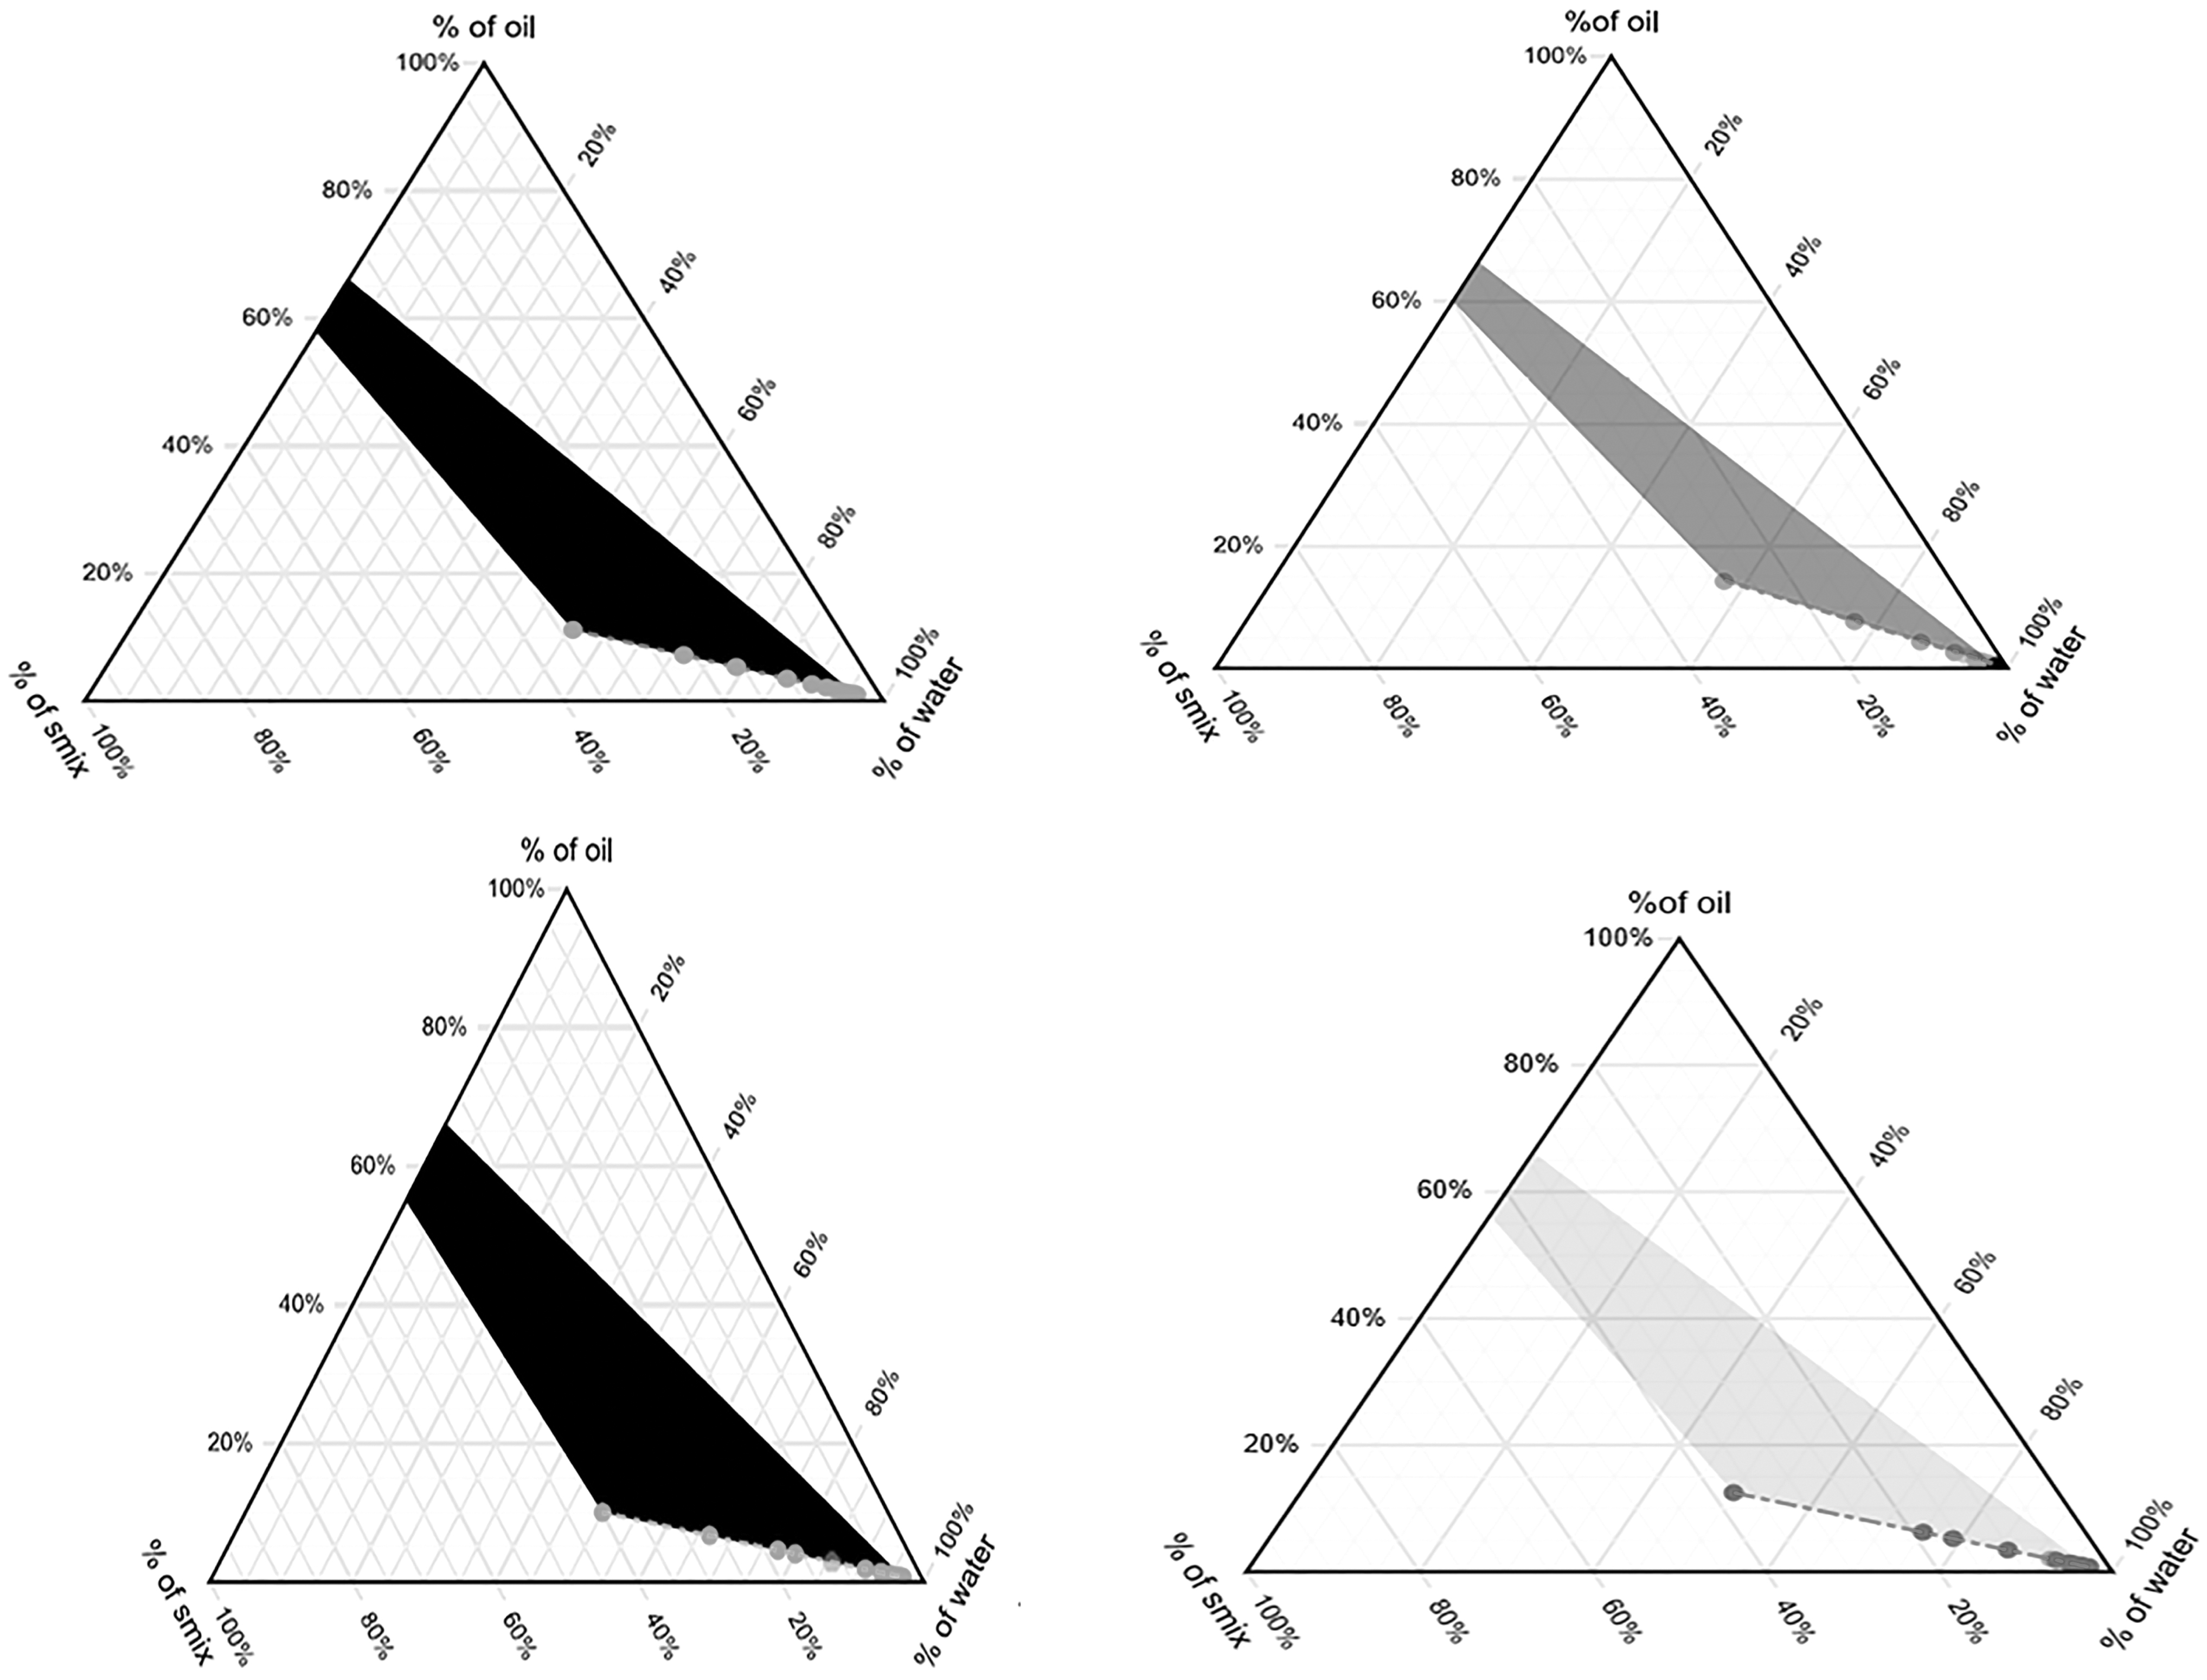
Pseudoternary-phase diagram for various ratios of Smix (1:1, 2:1, 3:1, and 1:2).
Droplet Size Measurement and PDI
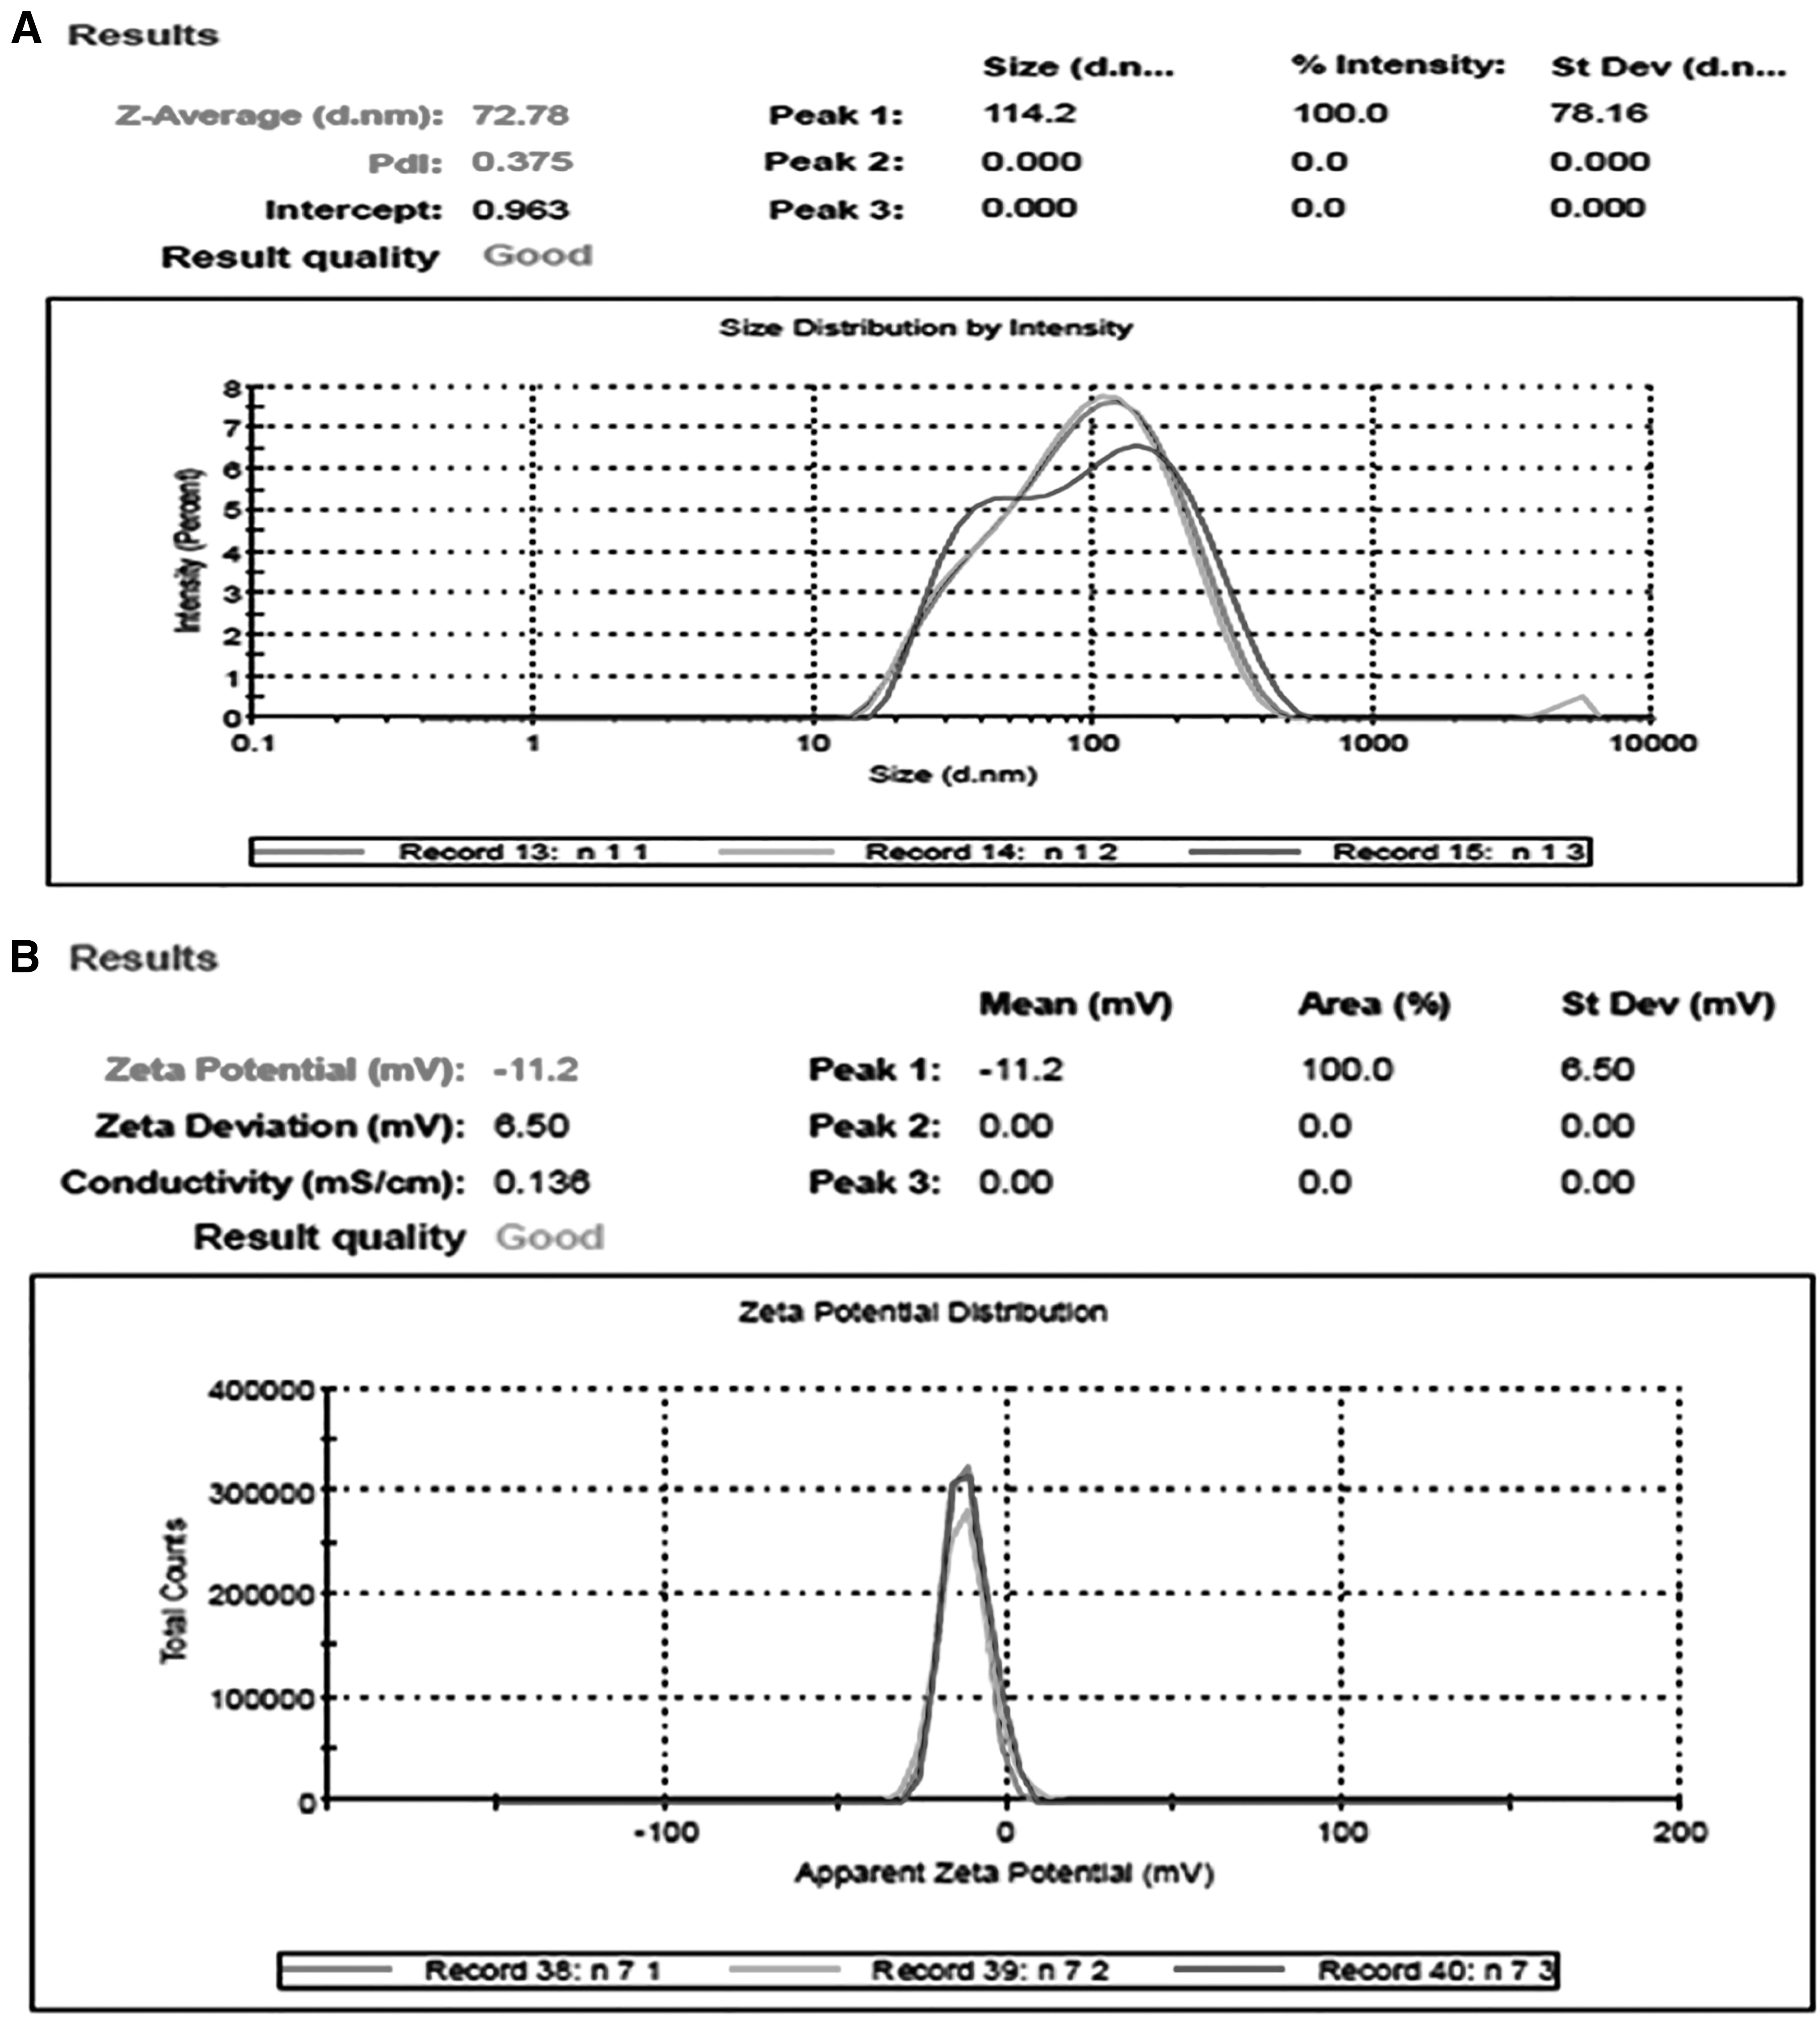
Droplet size experiments and PDI were carried out by using a Zetasizer instrument. Droplet size and PDI of all the batches of fenofibrate-loaded NMs carried out were found in the range of 72.28–153.3 nm and 0.177–0.555, respectively (Table 2). The droplet size and PDI of the optimized batch NM-7 were 72.28 nm and 0.423, respectively (Fig. 5A).
Zeta Potential
Zeta potential was determined by using a Zetasizer instrument. Zeta potentials of all the batches of fenofibrate-loaded NMs were found to be in the range of 0.05 mV to −20.7 mV, respectively (Table 2). The zeta potential of optimized batch NM-7 was 11.2 mV (Fig. 5B).
pH
The pH of all the batches of NMs was carried out and was found to lie in the range of 5.05–7.00, which confirms the stability of the NMs. Of all the batches, batches NM-1 and NM-8 were found to have the highest values, that is, 7.00, whereas optimized batch NM-7 (low value of concentration of oil, high value of concentration of Smix, and high value of pressure) had a pH of 5.40.
Dilution Test
A measured quantity comprising fenofibrate NM (1 mL) was diluted in distilled water (50 mL). The NM was found to be stable after dilution, which indicates that it is an o/w type NM (Fig. 6).
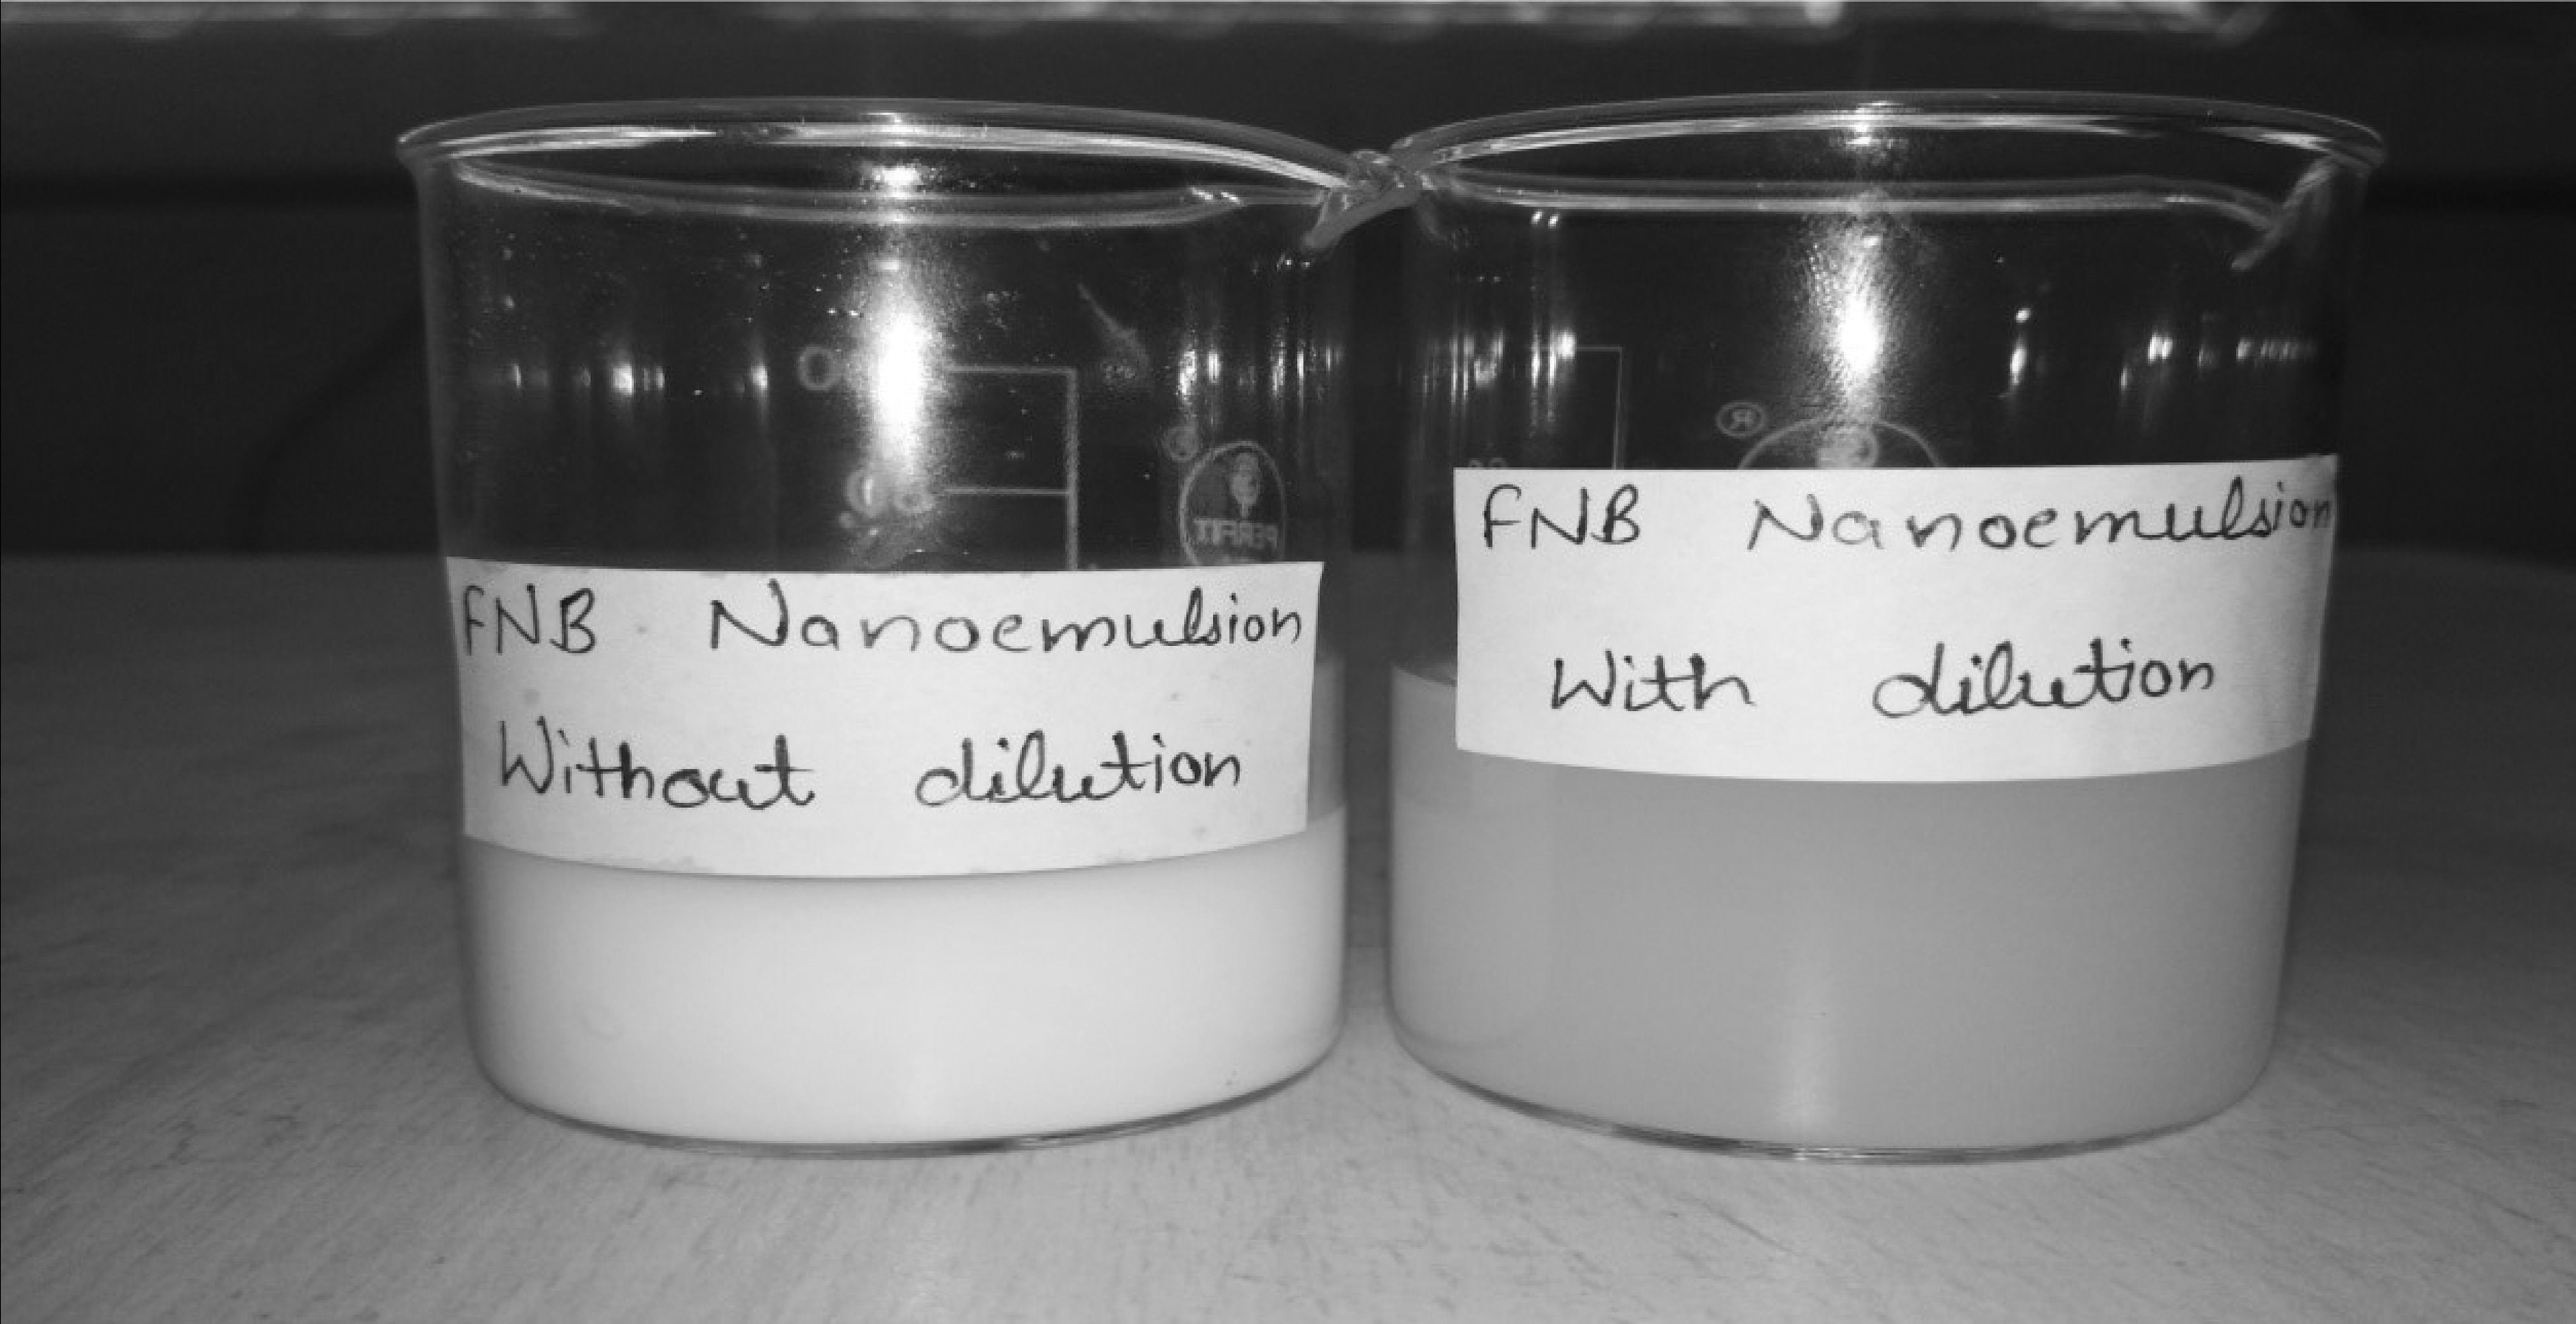
Dilution test for prepared nanoemulsions.
FTIR Spectrophotometry
IR spectrophotometry is used to predict any physicochemical interactions and therefore can be applied to the selection of suitable chemical compounds that are stable, compatible, and therapeutically acceptable. Here, fenofibrate was finely ground with infrared-grade potassium bromide and then pressed to form a pellet. The background was scanned, and then, the crystal window was closed. IR spectra of all the samples were taken in the range of 4,000–400 cm−1 at a constant temperature. The baseline correction was made in the obtained spectra. Fenofibrate was identified by FTIR and the characteristic peak obtained was compared with a standard spectra of pure drug reported in the literature. The FTIR spectra of the fenofibrate showed the characteristic peaks at stretch 1,723 cm−1 for the ketone (C = O) group, 662.16, 685, and 762 cm−1 for the chlorine group, and 850 cm−1 for the para disubstituted aromatic ring (Fig. 7A). The FTIR spectra of olive oil showed the characteristic peaks at 2,925.47 and 2,855 cm−1 for asymmetrical and symmetrical stretching vibration of the methylene (–CH2) group; 1,459 and 1,372 cm−1 for bending vibrations of the CH2 and CH3 aliphatic group; 1,747 cm−1 for the ester carbonyl functional group of the triglycerides; 1,236.84 cm−1 for C–O stretching; and 723.19 cm−1 for overlapping of the methylene (–CH2) rocking vibration and to the out-of-plane vibration of cis-disubstituted olefins (Fig. 7B).
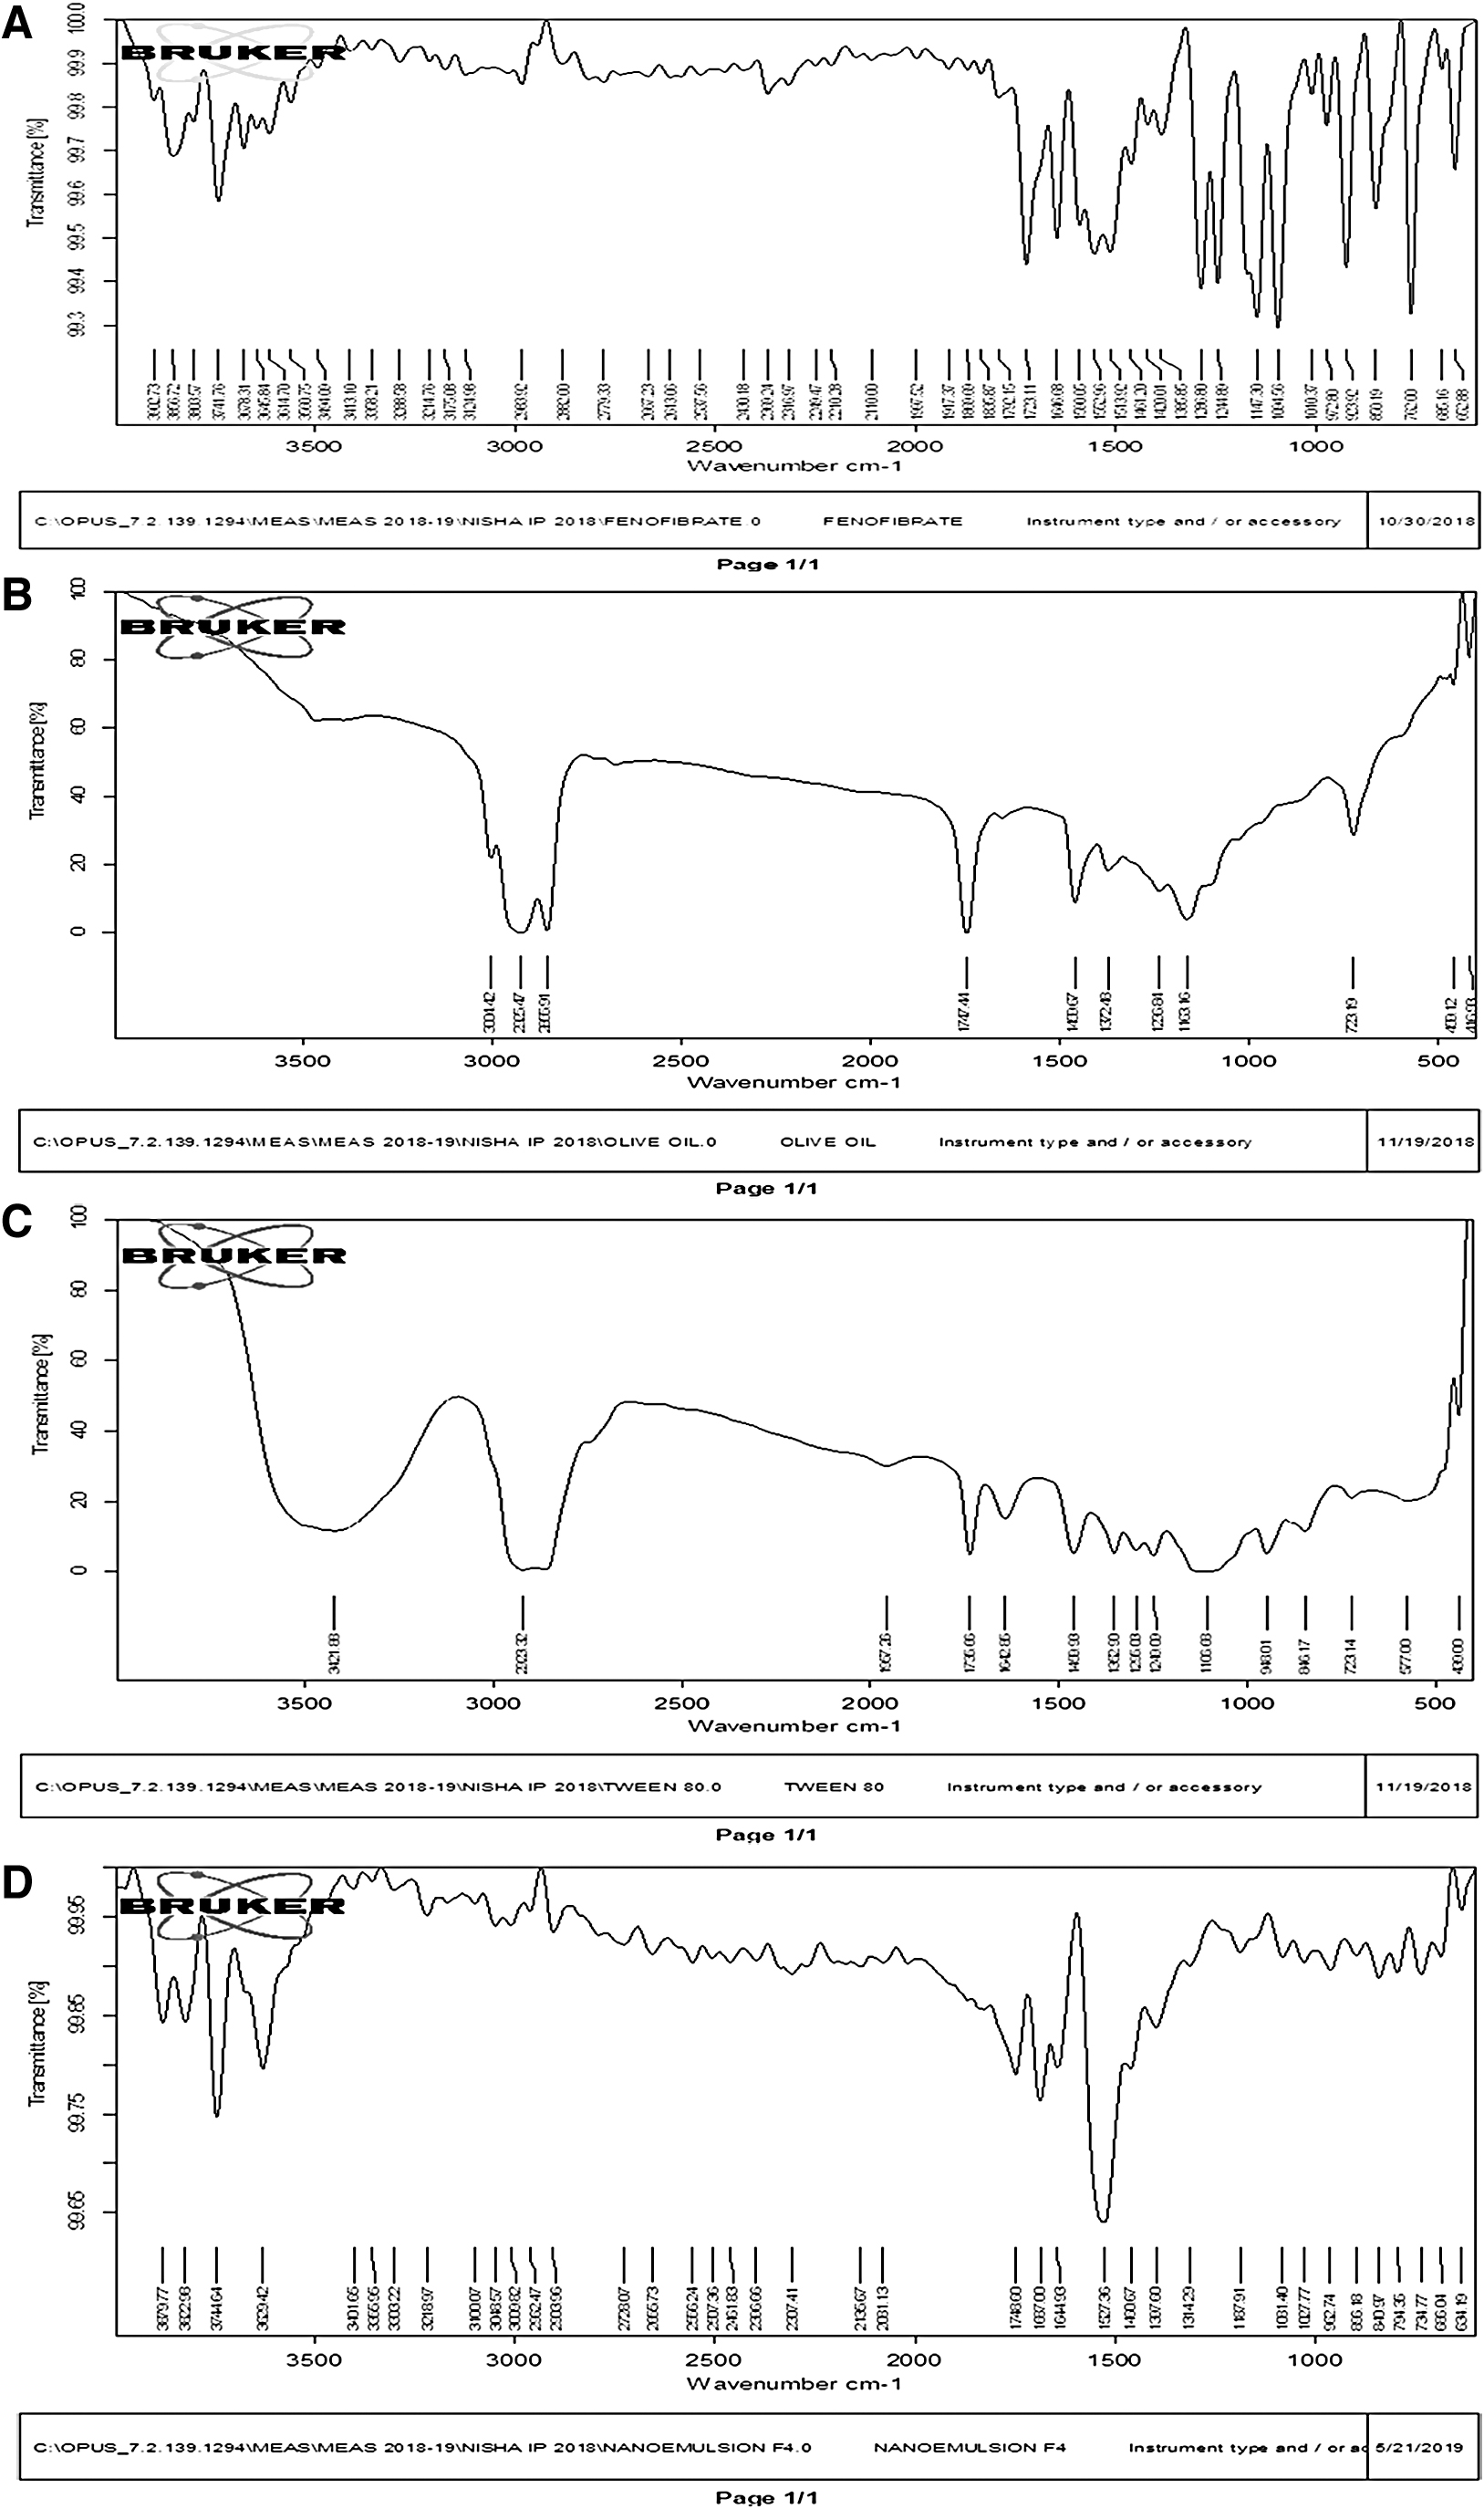
The FTIR spectra of Tween 80 showed characteristic peaks at 1,642 and 1,735 cm−1 for the carbonyl group; 1,106 cm−1 for the ether group; 2,923 and 3,421 cm−1 for sp3 C–H; and 1,106, 1,249, 1,295, 1,735 cm−1 for the ester group (Fig. 7C).
FTIR analysis of fenofibrate NM showed that there was no significant shifting of functional group peaks on comparison of obtained spectra with reference spectra (Fig. 7D). The FTIR spectra also show the fenofibrate stability during the encapsulation process. In addition, the study also suggested that there are no molecular interactions that alter the chemical structure of the drug. There are no chemical interactions between the functional groups of fenofibrate, olive oil, Tween 80, and PEG 400 that exist. Table 4 shows the comparison of FTIR spectra between the observed peak of fenofibrate and optimized batch NM-7.
Comparison of Fourier Transform Infrared Spectra Between Observed Peak of Fenofibrate and Optimized Batch NM-7
Differential Scanning Calorimetry
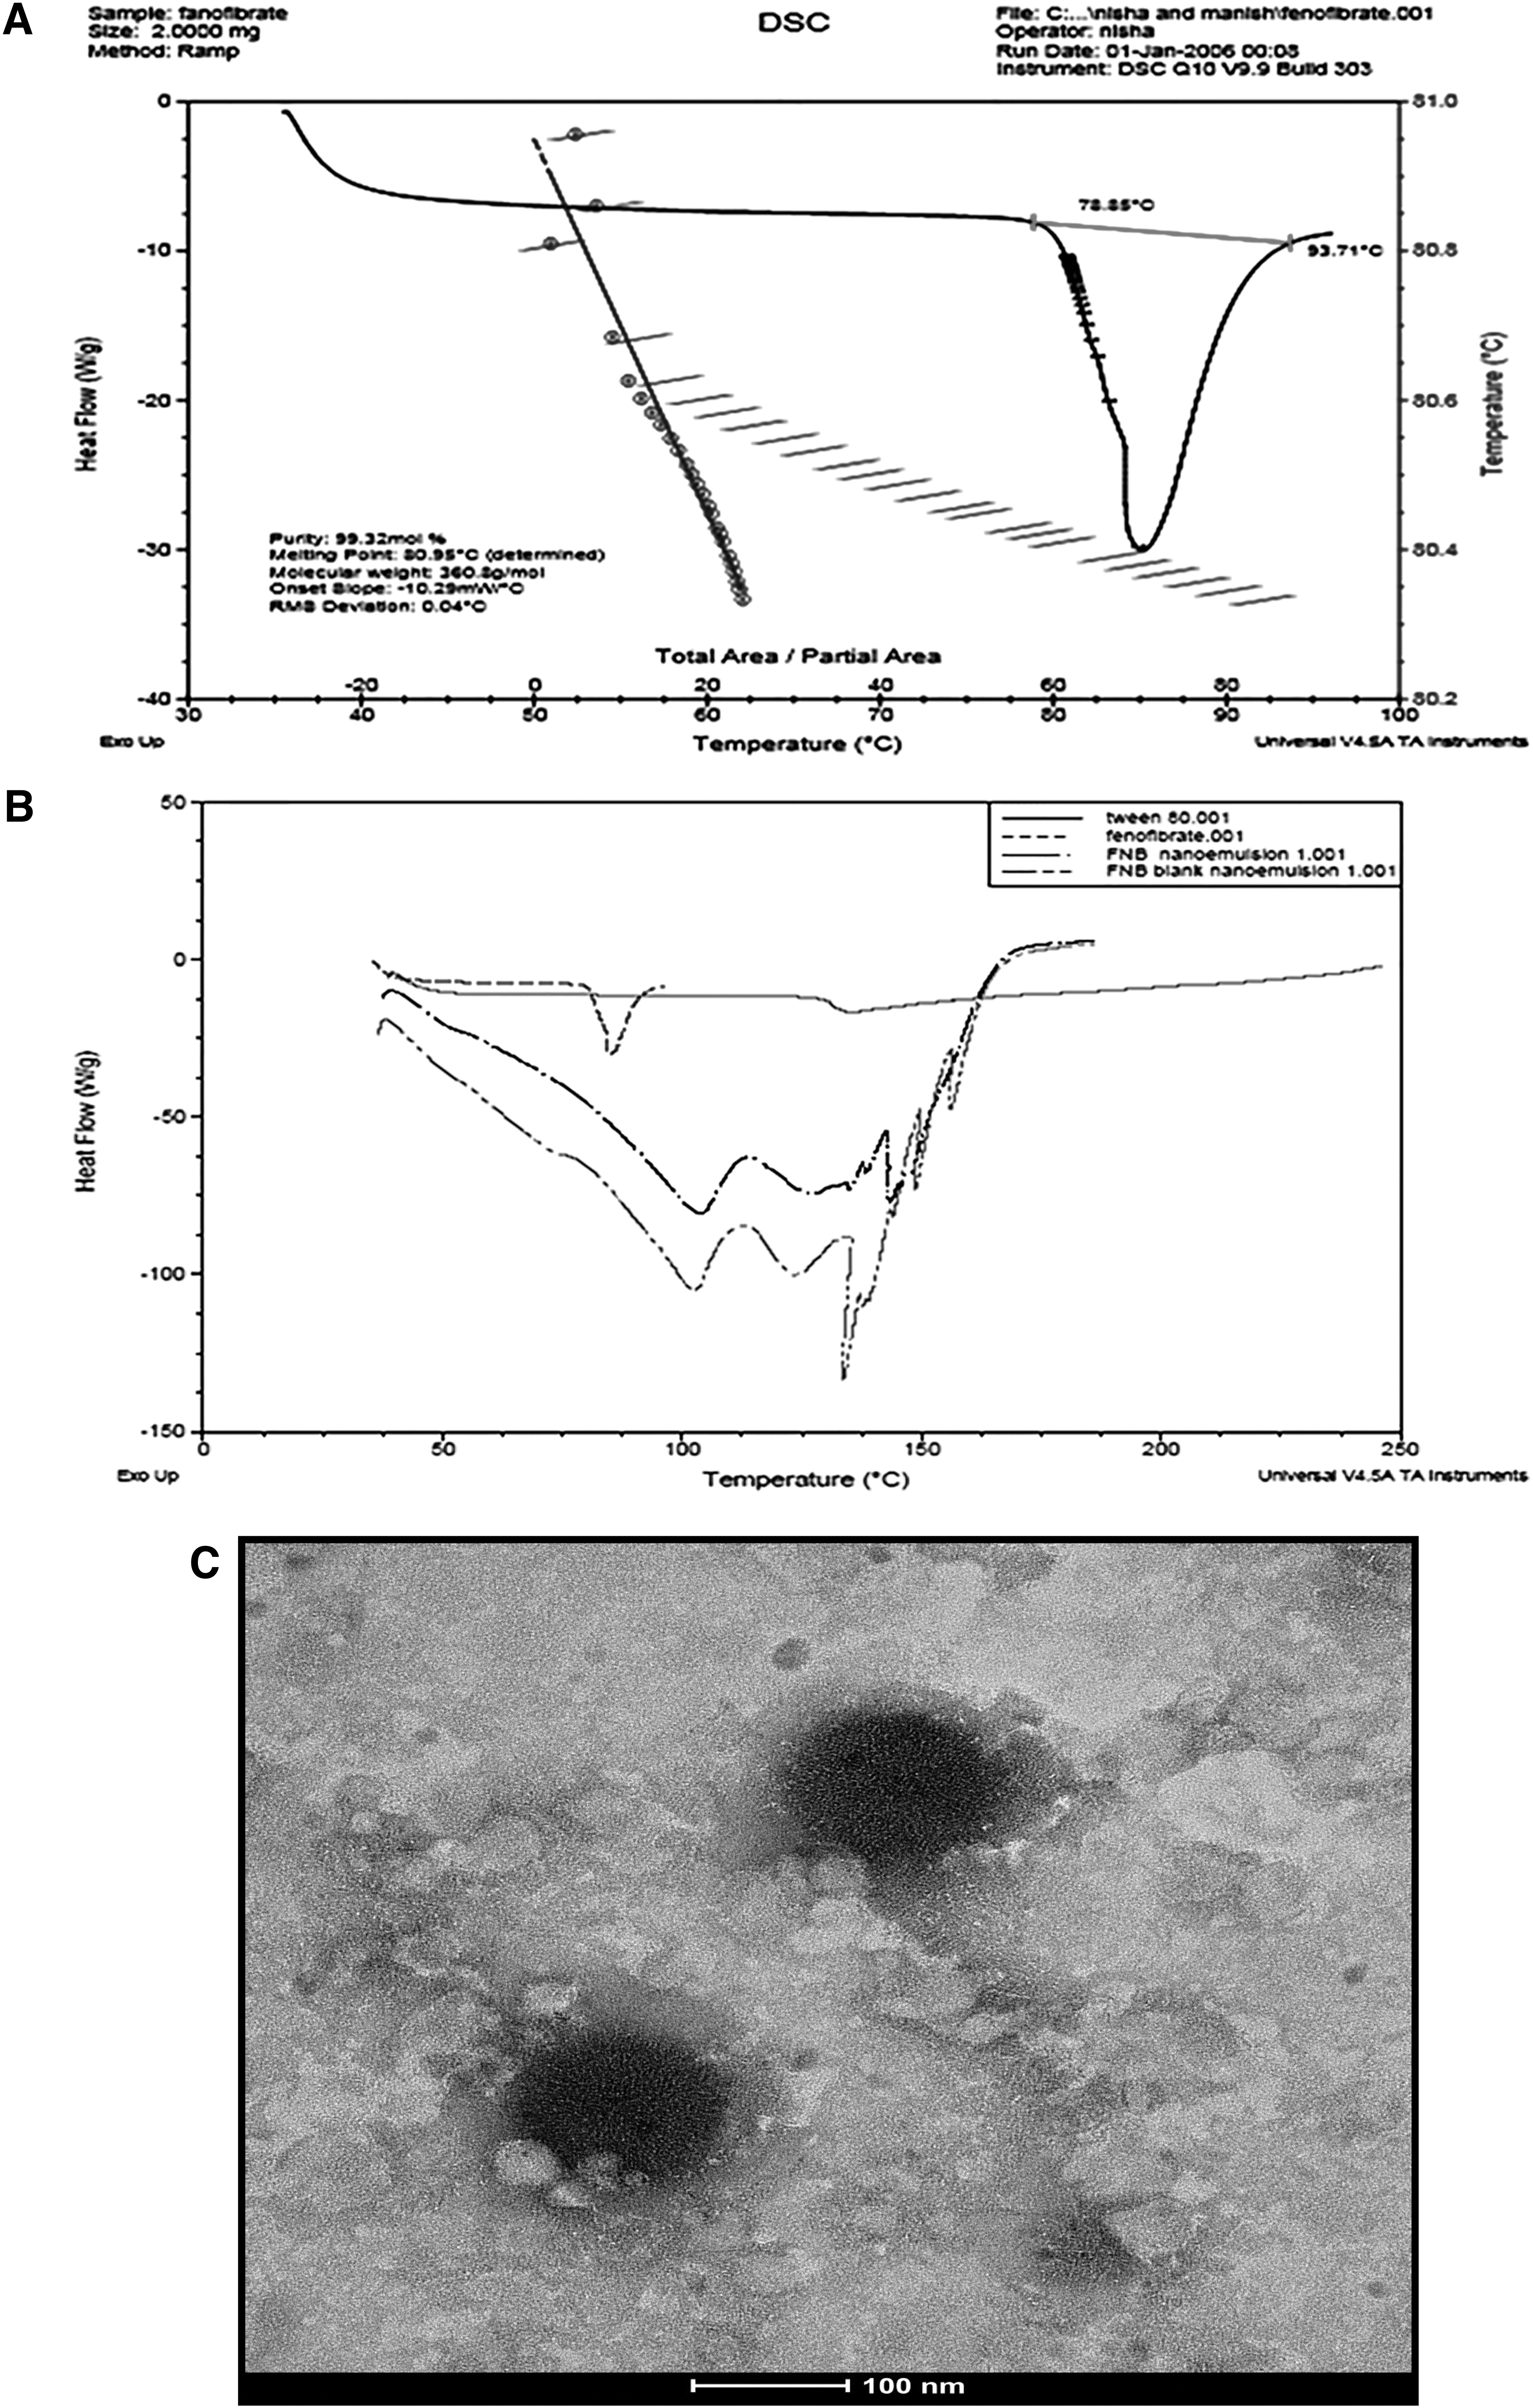
The DSC thermogram of fenofibrate at 80.95°C almost corresponded to its melting point (78°C–82°C) with a percentage of purity of 99.32%, as shown in Figure 8A. DSC study of NM revealed that the drug was dispersed inside the NM. There was no difference between the peaks of blank NM and drug-loaded NM. The overlay of DSC thermogram of fenofibrate, Tween 80, blank NM, and the fenofibrate-loaded NM (batch NM-7) is shown in Figure 8B.
Transmission Electron Microscopy
TEM analysis showed that the droplets in the fenofibrate NM were approximately spherical in shape with uniform distribution, however, with some deviation. The findings confirm that all the droplet sizes were <100 nm and there was no aggregation between the droplets. Droplets in the optimized batch of fenofibrate NM appeared to be dark black in color on a white background (Fig. 8C).
In Vitro Dissolution Rate Studies
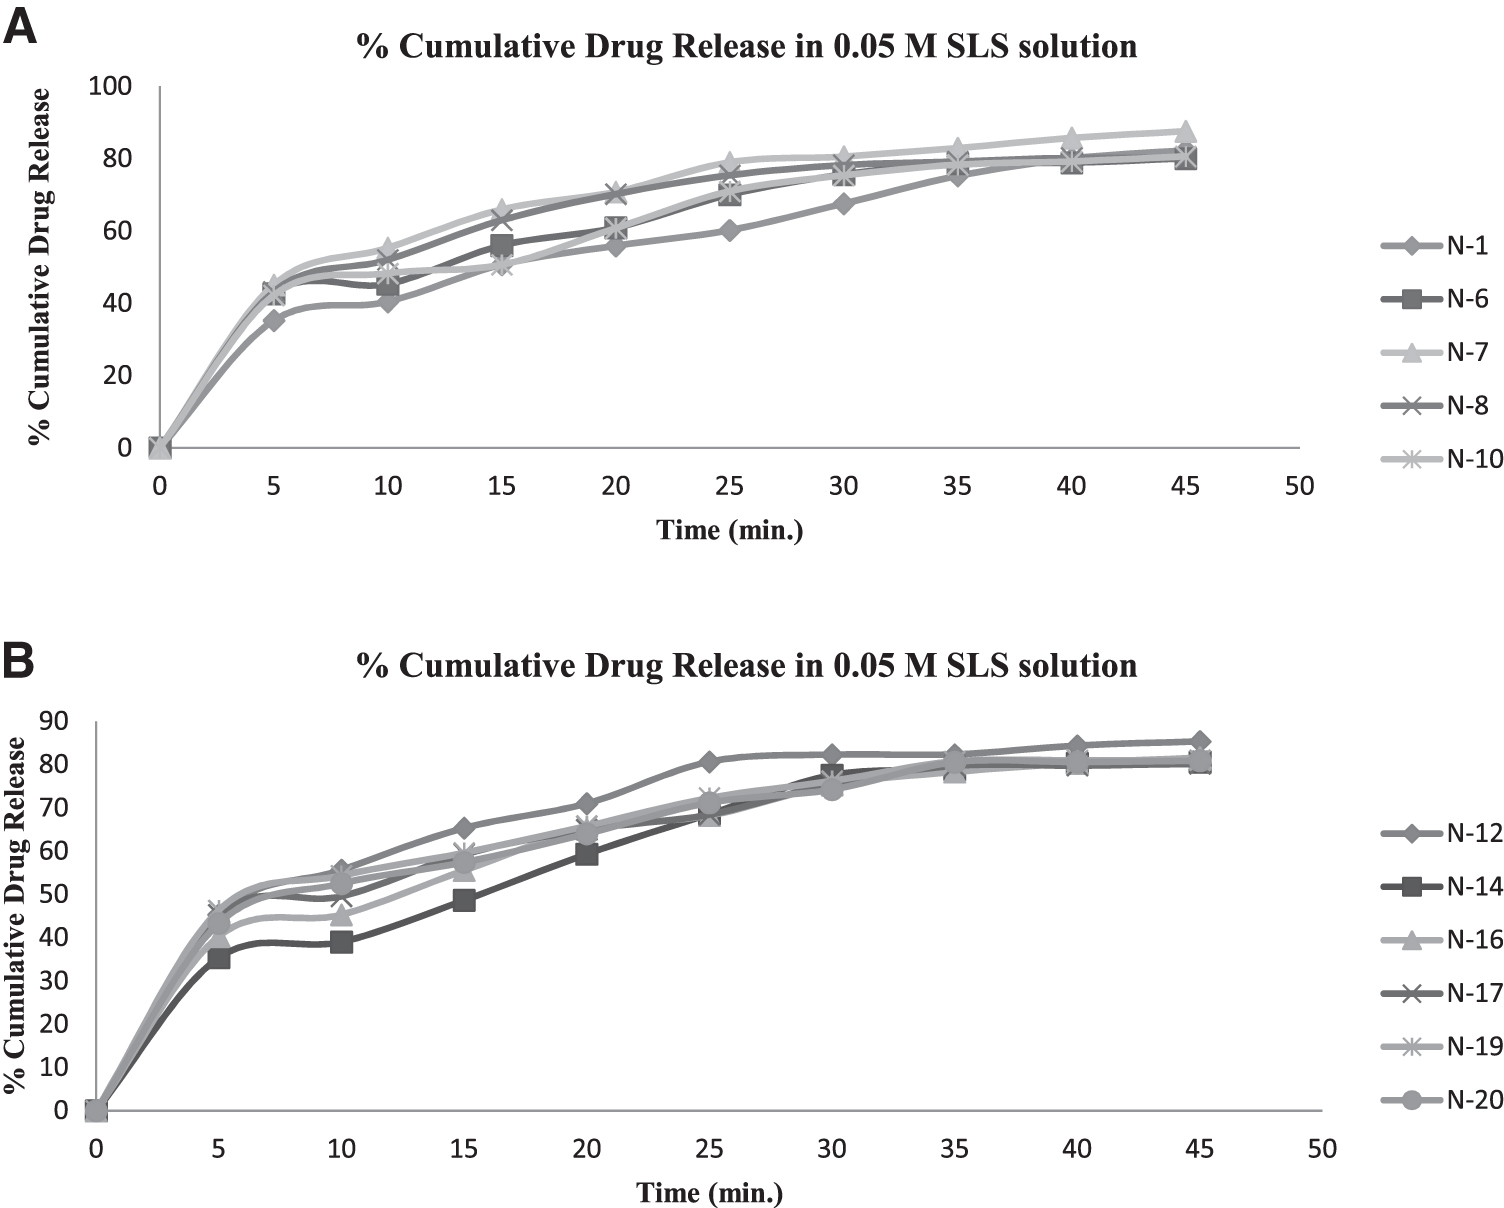
The in vitro drug release parameter of fenofibrate-loaded NM was performed in a USP Dissolution Apparatus II with 0.05 M SLS solution in distilled water at 75 rpm, while maintaining the temperature at 37°C ± 0.5°C. 3,4 NM taking 40 mg of fenofibrate drug was filled in the cellophane dialysis membrane (molecular weight 12,000 Da; Hi Media Laboratories), and the membrane was soaked in the dissolution medium for 24 h. After that it was sealed from both sides with the help of a thread. This membrane was then placed in the dissolution vessel containing 900 mL of 0.05 M SLS solution in distilled water as dissolution medium. Then 5 mL of dissolution fluid was withdrawn at specific time intervals (5, 10, 15, 20, 25, 30, 35, 40, and 45 min). A fresh 0.05 M SLS solution dissolved in distilled water as medium was added to the vessel at the same time to maintain the sink conditions. The sample withdrawn was estimated by UV analysis. All the experiments were carried out in triplicate. The in vitro release of all batches in 0.05 M SLS in distilled water is shown in Figure 9A and B . The batch NM-7 showed the maximum drug release in 0.05 M SLS solution.
Drug Release Kinetic Study
Drug release kinetics of fenofibrate NM was evaluated by fitting the obtained in vitro dissolution data of optimized batch into zero-order, first-order, Korsmeyer-Peppas, and Higuchi equations. Table 5 shows the kinetic analysis of the fenofibrate-loaded NM, NM-7. The value of correlation coefficient (R 2 ) was highest for first order, which indicates that the drug release mechanism follows the first order. For the Korsmeyer-Peppas model, the calculated value of n was found to be 0.03099 that was characteristic of the non-Fickian type of drug diffusion (0.45 < n < 1.0). Table 6 shows the correlation coefficient from different models.
Kinetic Analysis of the Fenofibrate-Loaded Nanoemulsion, NM-7
Correlation Coefficients from Various Models
Conclusion
The formulation of NMs by using the high shear homogenization technique was found to be an effective, less time-consuming, and simple method. The droplet size and the distribution of the drug can be monitored by varying the variables, namely concentration of oil, concentration of Smix, and pressure of the homogenizer. The fenofibrate-loaded NM has been successfully formulated by applying CCD. The combination of fenofibrate, olive oil, Tween 80, and PEG 400 produced a stable NM, which could be utilized for targeted drug delivery of fenofibrate as a hypolipidemic agent to decrease the cardiovascular risk occurred by atherosclerosis. It is also reported that fenofibrate also inhibits the progression of cardiac abnormalities related to hypertensive heart damage, heart failure, lipotoxic cardiomyopathy, cardiac hypertrophy, and vascular endothelial dysfunction. The optimized batch of NM was obtained with the desired droplet size range and entrapment efficiency revealing optimized physicochemical characteristics, which may aid in effective drug release at the target site. Overall, the outcome of this study indicates that a stable oral NM of fenofibrate was developed using cautious excipient selection, resulting in improved oral bioavailability. Furthermore, in vivo studies could give a better understanding of the results observed in the present investigation and targeted applications of NM.
Footnotes
Disclosure Statement
The authors report no conflict of interest.
Funding Information
There is no funding source.