




Abstract
Microstructure of a semisolid system is greatly influenced by the formulation composition and the processing parameters. Different polymers exhibit different three-dimensional structure and these have a great impact on the drug release properties. The current research focuses on studying the impact of hydroxypropyl cellulose gel microstructure on the release properties of chlorhexidine gluconate (CHX G). The two main investigating methods of microstructure were used namely, rheology and texture analysis to determine the differences in the formulations studied. The CHX G drug release study was performed using a developed and validated in vitro release test method, which is reproducible, discriminative, and robust to detect the formulation differences. The drug release results showed that there was appreciable difference in the release rates of the different formulations. The rheology and texture analysis data correlated well with the difference in the release rates. The formulations differences were further confirmed by a statistical approach using analysis of variance.
Introduction
Hydroxypropyl cellulose (HPC) is a nonionic water-soluble cellulose derivative, which has good solubility in a range of polar organic solvents and cold water. 1 HPC is widely used as a viscosity modifier in topical formulations. It imparts unique microstructural arrangements to the gel that are studied based on its adhesiveness, 2 viscoelastic behavior, 3 –5 flow behavior, 6 and aids in reducing the surface tension, 1,7 owing to its amphoteric nature. The formation of the viscoelastic gel network initiates upon addition of HPC to a suitable vehicle. The mechanism involved is the solvation of the hydrophilic amorphous portion of the polymer and then wetting the poorly accessible inner crystalline hydrophobic region, 3 which depends on the concentration and molecular weight of the polymer. 8 This viscoelastic three-dimensional gel network induces intermolecular interactions between the polymer molecules. 9 The gel network herein defined as microstructure determines the drug release from the formulation and hence, evaluation of microstructure of such systems serves as a quality control tool for comparing the product performance. Microstructural investigations of any drug delivery systems give deep insights of the structural arrangement of the formulation components and the drug loading, for example, tablets, nanotubes, or semisolids that aid in determining the influential factors on the drug release kinetics. 10 –12 Although there are some literature reports on topical semisolids evaluating the physicochemical properties and their release profiles, there is a dearth of scientific knowledge of such microstructural studies and rheological properties of HPC gels and their impact on drug release, which in turn restricts its use in topical products. Accordingly, the aim of the study was to understand the relationship between the rheological and mechanical differences in the microstructure of the HPC gels and their impact on drug release.
Topical Drug Classification System (TCS) by Shah and colleagues intends to be a tool to guide topical generic drug development. For a biowaiver from clinical endpoint studies to be granted, the test formulation should assure qualitative (Q1) and quantitative (Q2) sameness toward the reference listed drug along with the Q3 that relates to microstructure of a topical drug product using in vitro release testing (IVRT) methodology. United States Pharmacopeia (USP) also recommends the use of IVRT as a compendial method for evaluating the in vitro performance of the drug product. United States Food Drug Administration (USFDA) proposed the guidelines for the validation of the IVRT method for a specific drug product to consider it as a quality control tool for evaluating the batch-to-batch consistency in drug release and assess the stability of the drug product. 13 Under this scientific and regulatory paradigm, it is crucial to develop a specific IVRT method for each product. Moreover, evidence must be provided on its discriminatory capacity, accuracy, and robustness.
Therefore, the aim of this study was to evaluate the release of chlorhexidine gluconate (CHX G), a model drug for oral mucoadhesive gel, as a function of viscoelastic properties of the gel with varying concentrations of HPC. CHX G is the most common salt form of the chlorhexidine, formulated as an oral mucoadhesive gel or mouth rinse for reducing the severity of the oral ulcers and in the application of root canal treatment. 14,15 CHX G mucoadhesive formulations are mostly developed as aqueous systems wherein, it is mandatory to maintain pH ∼7.0 by pH modifiers owing to its instability in acidic (pH <4) and alkaline (pH >7) conditions. The variations in pH may lead to the formation of impurities, of which p-chloroaniline is the most weighty of all. 16,17 To address the issue of CHX G stability, this study aimed at developing a nonaqueous gel base comprising HPC at various concentrations. The novelty of this study involves the use of a new and systematically developed and validated IVRT method for CHX G along with the proper selection of the receptor medium as against the generally reported receptor medium for the determination of the drug release kinetics of HPC gels and further correlating the microstructural differences of HPC gels with their drug release behavior. Validation of IVRT method was conducted according to USFDA's SUPAC-SS guidance, 18 USFDA guidance on acyclovir cream, 19 and the literature report by Tiffner et al. 20 on various parameters that not only regards the discriminatory power of the method, but also other parameters.
Materials and Methods
Chemicals
CHX G (20%w/v) was received as a gift sample from Bajaj Healthcare Ltd (Gujarat, India). Nisso HPC-M (medium viscosity) grade with molecular weight 700,000 g/mol was received from Nippon Soda Co. Ltd. High-performance liquid chromatography grade acetonitrile (ACN) was purchased from Avantor Pharma (Mumbai, India). Synthetic membranes (cellulose acetate [CA] and cellulose nitrate [CN]) were purchased from Sartorius India Pvt Ltd, Mumbai, nylon membranes (NYL) were purchased from Pall solutions, Mumbai, polyethersulfone (PES) membranes were purchased from Pall Corporation, and regenerated cellulose (RCEL) membrane was purchased from Merck Millipore. All other chemicals used in the study were of analytical grade. The deionized water used during the analysis was obtained from Milli-Q® (Moslheim, France). A marketed 1% w/w CHX G gel was purchased from the local pharmacy shop.
Preparation of CHX G Nonaqueous Formulations
The nonaqueous base gel formulations containing CHX G 1%w/w were prepared using HPC polymer (molecular weight: 700,000 kg/mol) at three different strengths namely, 3% w/w, 5% w/w, and 7% w/w. These gels with different strengths of polymer 3% w/w, 5% w/w, and 7% w/w are hereafter denoted as Gel A, Gel B, and Gel C, respectively. The polymer of respective concentrations was solvated by dispersing it in a polar organic solvent namely, propylene glycol (PG), under continuous stirring using overhead stirrer by the gradual addition of the polymer. The drug loading was carried out when a complete smooth texture of the gel was obtained. The gels were kept aside for equilibration and complete polymer swelling for 24 h. Based on the visual observation of the flow behavior of the gels developed, Gel B was used as a standard product for the IVRT method development and validation studies and is denoted as Gel B-SP. The test samples Gel A, Gel B, and Gel C were subjected to “sameness” assessment so as to compare the release profile of CHX G.
In vitro release testing
Instrumentation
The Franz diffusion cell apparatus from Orchid Scientific & Innovative India Pvt Ltd (Nashik, India), was used for IVRT method development. The diffusion cell apparatus consisted of six vertical diffusion cells (VDCs) of 10 mL capacity each with 0.64 cm2 active diffusional surface area. The VDCs were mounted on a six-station diffusion apparatus installed with six individual magnetic stirrers for each cell and digital RPM indicator. The thermostatic water bath circulator (Orchid Scientific & Innovative India Pvt Ltd) was coupled to each cell to maintain a temperature of 37°C ± 0.5°C of the receptor medium, simulating the oral cavity temperature. Each VDC encompasses donor and receptor compartment parted by the selected membrane for the study. The receptor compartment of each cell was charged with 10 mL of the receptor medium. Magnetic stirrer was used in each cell for constant stirring at a set speed.
Method Development
Selection of receptor medium
The solubility of the drug in the receptor medium is of paramount importance while selecting the medium. The drug solubility in the receiving medium must be 10 times higher than the saturation solubility of the drug even at the final time point to ensure “sink conditions” for the drug to release from the semisolid formulations. 21 Based on this criterion and the dose of the gel, the miscibility of 100 μL of CHX G in 10 mL receptor solutions each of distilled water, distilled water:ACN (50:50 v/v), and distilled water:ACN (70:30 v/v) was checked. The resultant solutions were diluted 100 times by taking 0.1 mL of the above solutions and diluting to 10 mL, which were then filtered using a 0.45 μm nylon filter. The solutions were further subjected to spectral scanning and %recovery estimation using ultraviolet (UV)-Visible spectrophotometer.
Selection of membrane
During drug diffusion, the inertness of the membrane for compatibility with the formulation and receptor fluid and noninterference of the membrane in the analytical assay are the quintessential properties of the membrane required during the diffusion study. Hence, the selection of the membrane is a prerequisite for the diffusion study. Five membranes namely, CA (0.45 μm, 47 mm; Sartorius, Göttingen, Germany); CN (0.45 μm, 47 mm; Sartorius), Nyl (0.45 μm, 47 mm; Pall Corporation), PES (diameter 25 mm, pore size 0.45 μm, SUPOR 450; Pall Corporation), and RCEL (pore size, 0.005 μm, thickness, 20 μm; Millipore Sigma, Merck) were selected for the membrane screening. The drug adsorption onto the membrane was scrutinized by immersing the membrane in 10 mL of the receptor medium containing 200 μg/mL concentration of CHX G maintained at 37°C ± 0.5°C for 4 h considering the maximum stay duration of the gel on the oral mucosa. The reference drug solution without the membrane equilibrated at 37°C ± 0.5°C for 4 h was considered as the control. Each of the membrane was immersed into the receptor medium to serve as the blank for CHX G analysis in the above samples. The CHX G concentration in the test and the reference samples was analyzed using the UV spectrophotometric analysis of 20 ppm solution achieved by dilution. The percentage recovery of the CHX G from the samples was determined and compared with the control. The acceptance criteria for the percent recovery of drug should lie between 95% and 105%.
Analytical Method Development Using UV-Vis Spectrophotometry
The CHX G drug concentration in the IVRT samples was analyzed using the validated UV-Vis spectrophotometer method. The UV absorbance measurements were carried out using Shimadzu (UV-1800) UV-Visible Spectrophotometer. One milliliter capacity quartz cell with a path length of 1 cm was used for the absorbance measurement. UV-Visible spectrum of CHX G was recorded on UV probe 2.4 software. The drug solution of 20 ppm concentration was prepared in different receptor media and was scanned over a range of 200–600 nm. Based on the results obtained, the selected receptor media was validated for linearity over range (4–20 μg/mL), accuracy, precision, repeatability, specificity, limit of detection, limit of quantification, and robustness as per the International Conference on Harmonization (ICH) Q2 (R1) guidelines. ICH Q2 (R1) guidelines prescribe the standard protocol to be followed for the development and validation of the new analytical method for drug substances and products.
IVRT Method
The IVRT runs of all the samples were conducted collaterally on six VDCs. Each receptor chamber was filled with 10 mL of the selected receptor solution and was degassed for 10 min in a sonicator before the experiment. The temperature equilibration of receptor medium of each cell was carried out at 37°C ± 0.5°C for 30 min before the initiation of the experiment. A constant speed of 500 rpm was set for each cell and a temperature of 37°C ± 0.5°C of receptor medium was maintained throughout the experiment. Accurately weighed 200 mg of the gel was applied evenly on a membrane presoaked for 30 min in the receptor medium. The membrane was then mounted on the receptor chamber and clamped by placing the donor chamber above it. Aliquots of 1 mL were withdrawn at a time interval of 15 min for initial 1 h, followed by 30 min for the second hour from the receptor chamber of six VDCs. An equal volume of the blank receptor solution was replaced. The whole sampling and replacing the aliquot process were carried out carefully to avoid the emergence of air bubbles. Aliquots of each sample were analyzed using UV-Vis Spectrophotometer at a λmax of 258.5 nm.
Calculation of the Drug Release
The drug concentration in the receptor medium (Cn) present at each interval was measured using a UV-Vis spectrophotometer. The curvature of the release profile was determined by fitting the experimental data of the fractional amount of drug release (Mt
/M
∞ < 0.6) to Equation 1 as proposed by Korsemeyer and Peppas
22,23
commonly known as “Power law.” It is a simple and semi-empirical model equation that relates the drug release exponentially with the elapsed time (t).
wherein, Mt
/M
∞ is the fractional amount of drug released at time (t),
k is the drug release constant that considers the structural and geometrical modifications of the system (dimension of time−1),
n is the transport exponent determining the drug release mechanism (Fickian or non-Fickian).
The power law model is specifically used when the drug release mechanism from the polymeric matrix system is not known or it may follow more than one type of drug release phenomenon. The equation stands applicable only when the release is one directional and the release curve is plotted for the initial 60% of the drug attained in the receptor medium. The n value of the drug release profiles governs the release mechanism of the drug from the planar matrix as follows:
n = 0.5 (Fickian Diffusion as per Higuchi model)
n > 0.5 (non-Fickian or anomalous diffusion)
n = 1 (Case II transport or zero order mechanism)
n > 1 (Super Case II transport)
The release kinetics of this model is presented as log-log plot of fractional drug release with respect to time, wherein the slope denotes the “n” value and the anti-log of the intercept denotes the release rate constant “k.”
The release kinetics of this study presented the n value as 1 for the three consecutive IVRT runs, demonstrating the non-Fickian Case II transport or the zero-order release mechanism (1.011, 1.006, 0.988 for IVRT runs 1, 2, and 3, respectively). The drug release from such system may be because of the swelling or the relaxation mechanism of the polymeric chains. The drug being in the completely solubilized form enables the rapid release at a constant rate from the delivery system as confirmed by the release exponent of the power law model. For this reason, the experimental data of this study were further analyzed using the zero-order release model. The model is represented by Equation 2.
wherein, k0 is the zero-order release rate constant
Mt is the amount of drug dissolved in time t
M0 is the initial amount of drug dissolved at time t = 0, which is mostly zero.
The drug release curves are represented graphically as the amount of drug released versus time (t), resulting in a straight line with slope being the zero-order release constant and the nonzero intercept representing the initial lag time of the drug release owing to the moving boundary layer at the interface.
The drug release rate is independent of the concentration of the drug in the matrix system and widely suitable for sustained or prolonged release matrix systems.
Validation of IVRT Method
The validation of the developed IVRT method is imperative to remain certain during the investigation of the formulations with known differences, confirming the discriminative power of the variables investigated. The validation of the method was performed in accordance with US FDA's SUPAC-SS guidance, 18 USFDA guidance on acyclovir cream, 19 and the literature report by Tiffner et al. 20 The parameters for the validation of the IVRT method are enlisted hereunder with their methodologies.
Linearity, precision, and reproducibility
The release profiles of the developed IVRT method were fitted to the power law model to analyze the drug release mechanism. Since the cumulative percent release at the end of 120 min is <60%, all the data points of the release profile were considered for the power law model. Based on the n value of the three IVRT runs, which is closer to 1, the zero-order release model was fitted to the experimental data of the complete study. Subsequently, to assess the linearity, precision, and reproducibility of the developed method, three IVRT runs were conducted on three consecutive days with a set of six VDCs per day using the formulated 1% w/w CHX G gel. The regression coefficient value (R 2 > 0.9) of the linear regression curve plotted with the time (minutes) on the x-axis, and the amount of drug released per unit area on the y-axis was considered as the acceptable limits for linearity. The linearity curves were further assessed statistically for more rigorous regression analysis using the RegressIt excel Add-in for the average drug release profiles of the three IVRT runs. Furthermore, the intra, inter-run variability, and reproducibility of the release rates across all IVRT runs were determined to inspect the precision and reproducibility of the method. The mean, standard deviation, and coefficient of variation (%CV) of release rates within and across all runs were computed to determine the same. The developed method was considered as precise and reproducible with a % CV <15.
Sensitivity, selectivity, specificity, and accuracy
The developed IVRT method should possess the discriminative attribute to rule out the differences in between the two similar formulations. The discriminating capacity of the developed method can be assessed using the three concepts known as sensitivity, selectivity, and specificity.
The sensitivity of the method can be investigated by comparing the drug release rate from the formulations containing three different concentrations of CHX G, namely, 0.5%, 1%, and 2% w/w. The two test products (TPs) will be denoted as TP1 (0.5% w/w CHX G gel) and TP2 (2%w/w CHX G gel) and Gel B-SP as reference product (RP). The sensitivity of the method can be assured if the results obtained can identify the differences in the release rates as higher in vitro release rate (IVRR) and lower IVRR for the concentrations of the gel used with the respective strengths of the formulation.
The IVRT method “specificity” was validated by investigating the release rate of the drug proportionality with the amount of drug release when three different drug concentrations were evaluated. The correlation coefficient R 2 value was estimated from a linear regression model plotted between the IVRR (dependent variable) and the different concentrations of CHX G gel (independent variable). The method was considered to be explicitly validated for “specificity” if the results show a linear relationship with the R 2 > 0.9.
The selectivity of the IVRT method is the ability to discriminate between the IVRR of the 1% w/w CHX G gel from the higher and lower concentrations appropriately. The inequivalence in the IVRR of Gel B-SP was determined by comparing the IVRR of the other two concentrations that served as the TPs TP1 and TP2, using the Mann–Whitney U-test statistical approach described in USP<1724>. If the 90% confidence interval (CI) of both RP versus TP pairwise comparison test falls outside the limits of 75.0%–133.33% as per SUPAC-SS guidance 18 and USP, 24 the method was considered to be selective in discriminating the drug release rates and stating it as statistically inequivalent.
On the contrary, the accuracy of the IVRT method was validated using the product “sameness test” performed using the same statistical approach described in the USP Chapter <1724> from the results of the IVRT runs conducted for linearity, reproducibility, and precision. Herein, the IVRR of the Gel B-SP was compared with the IVRR of the other two IVRT runs of Gel B-SP to establish the reproducibility of the product in all IVRT runs. The developed method is termed as accurate and statistically equivalent if the 90% CI of the calculated pairs of TP/RP ratios falls within the limits of 75.0%–133.33% as per SUPAC SS.
Robustness
Robustness is the measure of the resistance of the method to the minor perturbations imposed deliberately on the conditions of the IVRT method. The robustness of the developed IVRT method was validated by conducting the two IVRT runs with minor deliberate changes in the temperature, that is, ±2°C relative to the standard temperature of 37°C of the receptor medium and stirring speed, that is, ±50 rpm relative to the standard stirring speed of 500 rpm. The method was said to be robust if the slope of IVRR falls within ±15% CV of the average slope of IVRR for the IVRT runs conducted at standard operating conditions.
Recovery and dose depletion
The amount of drug accumulated in the receptor solution until the entire duration of the IVRT run was computed using Equation 3 to determine the recovery of the drug from the applied dose in the donor compartment. The data from the precision and reproducibility study were used to compute the results of recovery.
Rheological Characterization
The rheological properties of the developed formulations were studied using Physica–MCR 301 rheometer from Anton Paar instruments. All the experiments were carried out at a room temperature of 20°C using a 25 mm parallel plate geometry. A small amount of gel was placed on the lower plate for each test and the upper plate was lowered with a controlled speed until it reaches a gap of 1.0 mm. The gap of 1.0 mm was set for rheological testing of all the samples. The excess amount of sample around the plate was scraped off to avoid the remixing of the gel during the analysis. Rheological characterization of the gel includes a continuous flow test to determine the shear viscosity of the gel as a function of shear strain, flow behavior, and a dynamic oscillatory measurement to determine the viscoelastic gel network strength of the developed formulations. Continuous flow test was carried out at a shear rate ranging from 0.01 to 100 (1/s) and data collection at 6 points/decade. Dynamic oscillatory measurement was carried out using amplitude strain sweep with shear strain (ϒ) ranging from 0.01% to 100% at a constant angular frequency (ω) of 10 radians/s and data collection at 6 points/decade. The data of the rheological analysis were recorded on the Rheoplus software and was used for determination of the rheological parameters. All the experiments were conducted in triplicates. 3,25
Texture Analysis
The developed formulations were analyzed on CT3-1000 Texture Analyzer (Brookfield Engineering Labs., Inc.) using TA2/1000 probe to determine the textural properties under compression mode. The set parameters for the texture analysis are given in Supplementary Table S1. The probe consists of a male and a female cone of which the female cone holds the sample and a male cone is used for insertion into the product. The female cone is attached to the base of the sample holder base table and the male cone attached to the load cell. Before the start of the experiment, care was taken to align the position of the male and the female cone to avoid instrument overload. The female cone was filled with the product slightly below its brim level and placed below the texture analysis probe. The test was initiated by lowering the probe toward the product at the pretest speed for a fixed target distance. The probe produced a deformation of the product at a test speed of 1.0 mm/s with zero trigger load. The probe withdrew from the sample at the same rate it took for penetration. The results of the analysis were recorded on the TexturePro CT software. The samples were evaluated in triplicates at a room temperature of 25°C, following the same procedure. 26,27
In vitro Drug Release
The developed IVRT method was applied to assess the differences between the developed formulations of CHX G 1% w/w gel to confirm the discriminatory power of the developed IVRT method. A comparative IVRT run was conducted between the three formulations of different polymer strengths with the parameters fixed during the method development and validation study, that is, 500 rpm, 37°C ± 0.5°C on six VDCs. The test was carried out in accordance with the SUPAC-SS guidance. The three IVRT runs were subjected to the product sameness performance test to compare their release profile. The release rate of each cell was determined by the slope of the graph showing the cumulative amount of drug release on the y-axis and time on the x-axis for the initial 60% of the drug release. The formulations were compared statistically using one-way analysis of variance (ANOVA).
Results and Discussion
IVRT Method
Selection of the receptor medium
CHX G is soluble in water and polar organic solvents but tends to precipitate in the presence of salts because of ionic interactions. In this study, the receptor medium selection was based on the miscibility of the drug in the respective media that shows maximum absorbance. It is essential to select the receiving media that shows maximum solubility and prevent drug precipitation as also mimics the physiological condition. Of interest, it was realized that all the receptor solutions showed miscibility of the drug. The UV-Vis spectral scan analysis of these samples containing the same concentration of the drug, however, showed different absorbance values at the λmax of 258.5 nm. Furthermore, it was observed that the drug showed two peaks points at different wavelengths, that is, at 231–232 nm and the second at 258.5 nm in all the receptor media studied. As per the literature, the maximum wavelength for CHX G is 258 nm. Several researchers performing diffusion studies of CHX G for different formulations have evaluated the drug release profile using distilled water as the receptor medium and UV-Vis spectrophotometer to analyze the drug in the receptor medium. 28,29 However, this study shows a discrepancy in the selection of the λmax as the UV-Vis spectrum of CHX G in distilled water shows two overlapping peaks with equal absorbance at two different wavelengths. This observation with distilled water gave equal absorbance for both the peaks, which makes the selection difficult. It was observed that the selectivity of the peak increases by reducing the polarity of the solvent. Hence, the solvent with reduced polarity, that is, ACN, was analyzed as the second solvent in the binary solvent system. The two ratios (70:30 v/v and 50:50 v/v) of the binary solvent system comprising distilled water and ACN were evaluated for confirming the maximum selective wavelength of CHX G in the IVRT samples. Surprisingly, it was observed that as the concentration of ACN increased in the receptor media, the selectivity for λmax 258.5 nm increased drastically, showing the solvent-induced effect, which may be owing to solvent–solute interactions. This contrasts with the use of distilled water as the diffusion medium, as reported in the literature, which may be chosen simply because of the miscibility of the drug. Figure 1 depicts the UV spectrum of the CHX G in different receptor media. Supplementary Table S2 shows the absorbance values of the UV analysis in different receptor media. The binary solvent system distilled water:ACN was selected as the receptor medium solution for the IVRT analysis. Furthermore, the samples were analyzed to detect the amount of drug miscible with the solvent medium to avoid drug saturation during the investigation. The concentration of 2,000 ppm CHX G drug solution, which is 10 times the applied dose, was miscible without any precipitation in the selected medium, thus confirming sink conditions. The test samples showed a percent recovery of 99.89% ± 0.17% of CHX G from the above samples confirming the presence of the drug in the solubilized form (Table 1).

UV spectrum of the CHX G in different receptor media. CHX G, chlorhexidine gluconate; UV, ultraviolet.
In Vitro Release Test Method Development
ACN, acetonitrile; NLT, not less than.
Selection of membrane
From the five membranes selected for the drug adsorption study, the three membranes CA, CN, and PES were ruled out because of their incompatibility with the solvent system that contains ACN. The membranes shrank when placed in the receptor solution. The literature also reports the incompatibility of the cellulose ester membranes with ACN solvent. 30
Furthermore, the percent recovery of CHX G from the solutions of the other two membranes is reported in Table 1. The results have shown adsorption of 3.6% of the CHX G on RCEL membrane, which is within limits and percent recovery of 96.38% ± 1.61%, and for Nyl membrane 9.32% of adsorption and 90.69% ± 1.60% recovery. It is seen clearly that CHX G binding to RCEL is less as compared with the Nyl membrane and conforms to the acceptable limits of 5%. This confirms that the RCEL membrane does not act as the rate-limiting barrier for CHX G compared with the Nyl membrane.
Consequently, from the above observations and further to its easy availability, membrane inertness, and cost-effectiveness, the RCEL membrane was chosen as the membrane for the IVRT analysis of CHX G gel formulations.
Analytical Method
UV-Vis spectrophotometer method validation
The UV-Vis spectrophotometry method for estimation of CHX G in IVRT samples was developed and validated according to the ICH Q2(R1) guidelines, and the results of the same are summarized in Supplementary Table S3.
Validation of the IVRT Method
The developed IVRT method for 1% w/w CHX G gel was validated according to the USFDA (2016) guidance for IVRT method development for acyclovir and draft guidance of USFDA's SUPAC-SS. The results of the validation parameters are given in Table 2.
Results of the In Vitro Release Testing Method Validation
IVRT, in vitro release testing; LL, lower limit; RSD, relative standard deviation; TP, test product; UL, upper limit.
Linearity, precision, and reproducibility
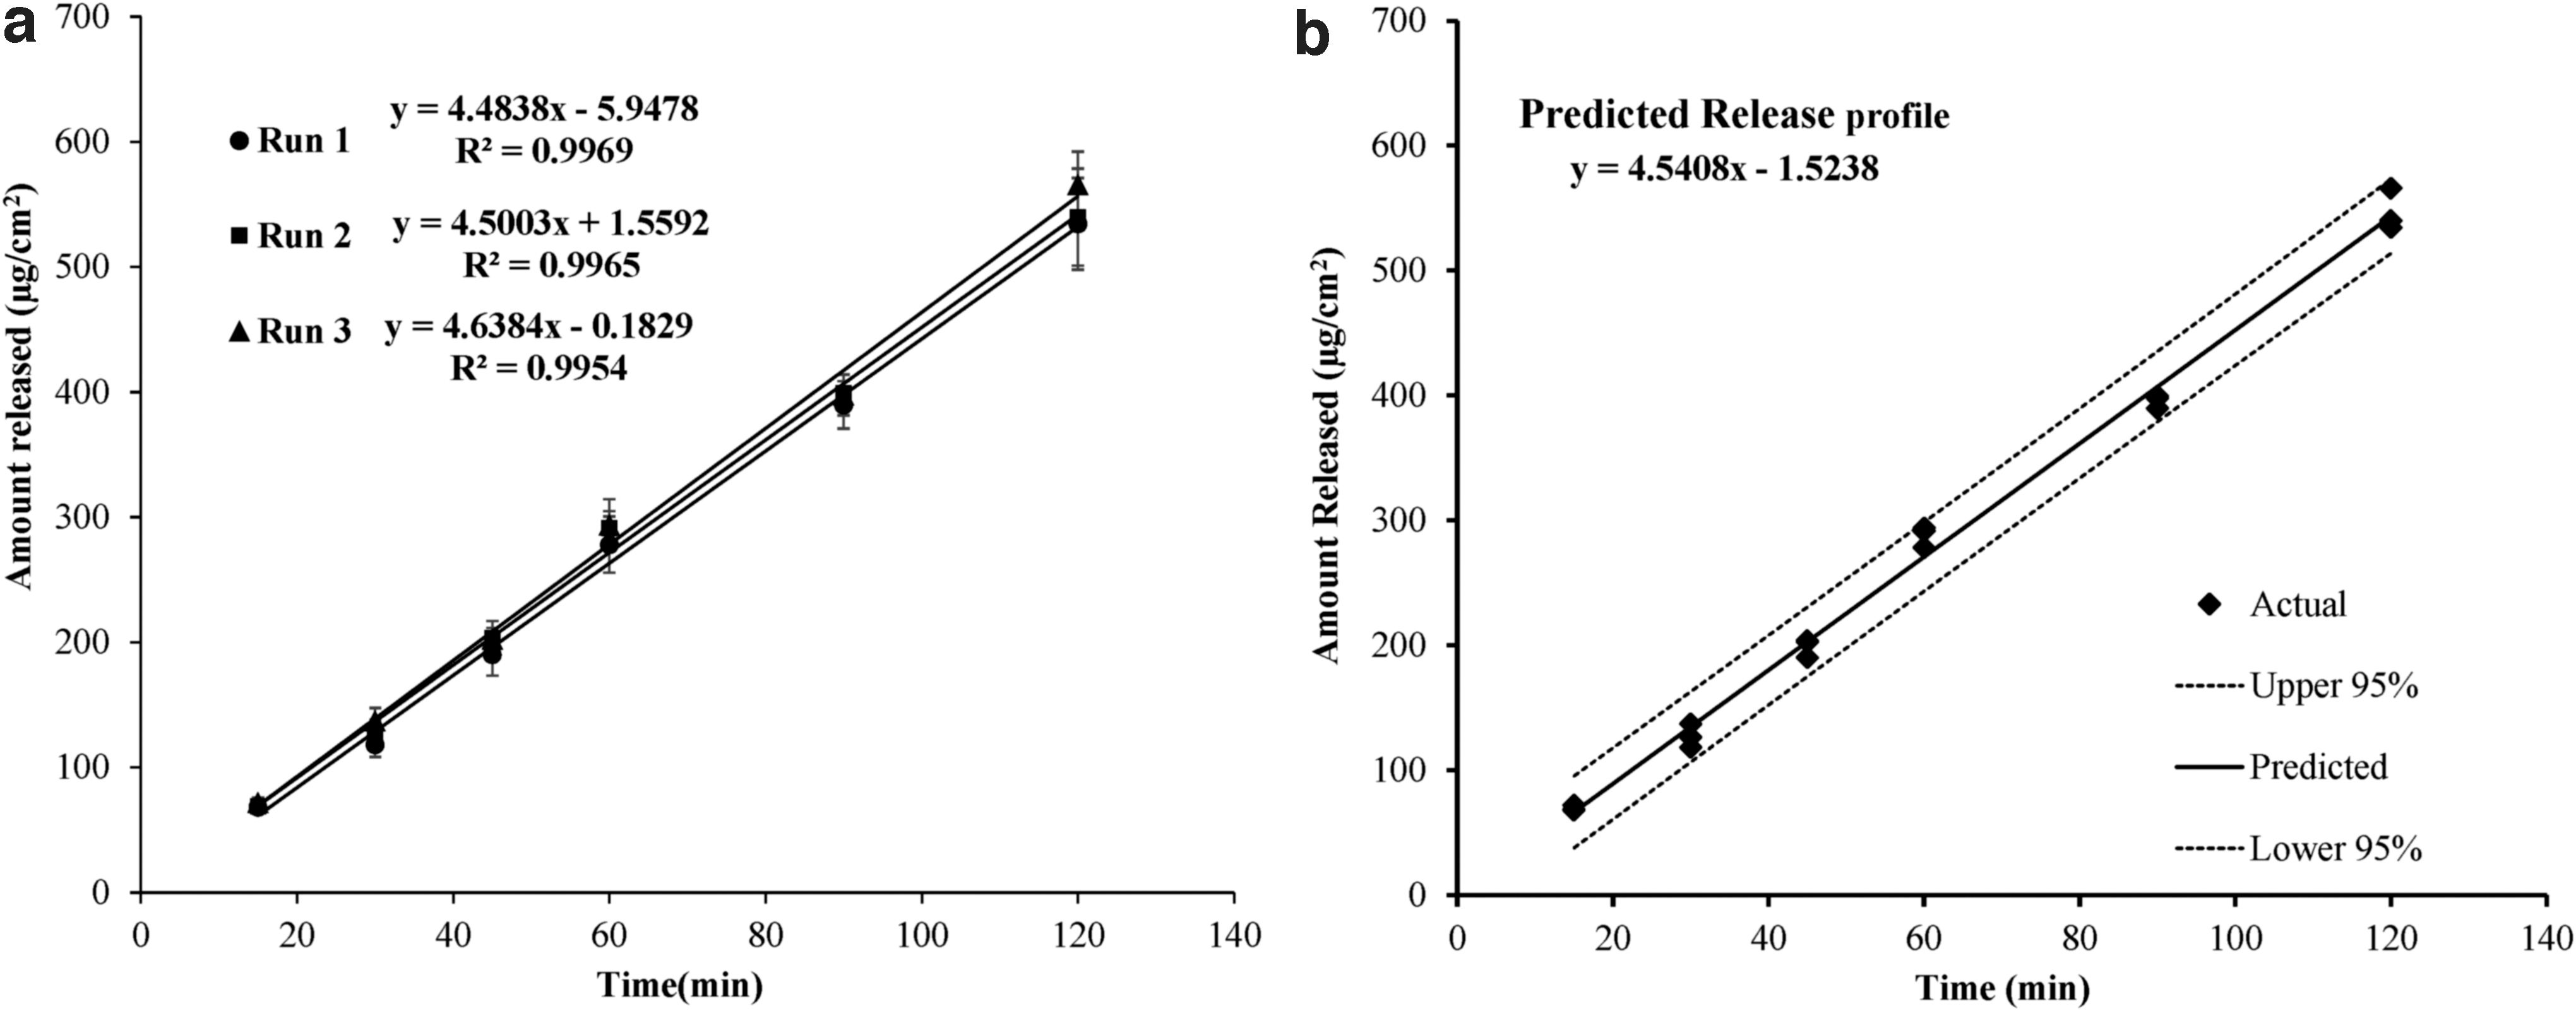
The results for linearity of the CHX G release profile conducted on three IVRT runs with six VDCs for each run was obtained by plotting time (in minutes) on the x-axis and average cumulative drug release per unit area (μg/cm2) on the y-axis. The linearity graph displayed a good linear relationship (R 2 > 0.99) for the three runs. The linear regression analysis performed using RegressIt on the average release profiles of the three runs further confirmed the accuracy of the release rates falling within 95% CI. Table 3 provides the regression statistics of the release profiles of three IVRT runs. Figure 2a shows the linearity of the release profiles of three runs and (b) Predicted linear regression line versus Actual within the upper (UL) and lower limit (LL) of 95% CI.
Linear Regression Statistics for Linearity of In Vitro Release Testing Method Validation
CI, confidence interval.
Inter-run variability and intra-run variability results of precision and reproducibility of the three IVRT runs (which one with six diffusion cells), conducted over three consecutive days demonstrate that the developed IVRT method is very precise and repetitive. The 18 release rates showing mean, standard deviation, and coefficient of variation are summarized in Table 2. The obtained values fall within the acceptable limit of 15% coefficient of variation.
Sensitivity, selectivity, specificity, and accuracy
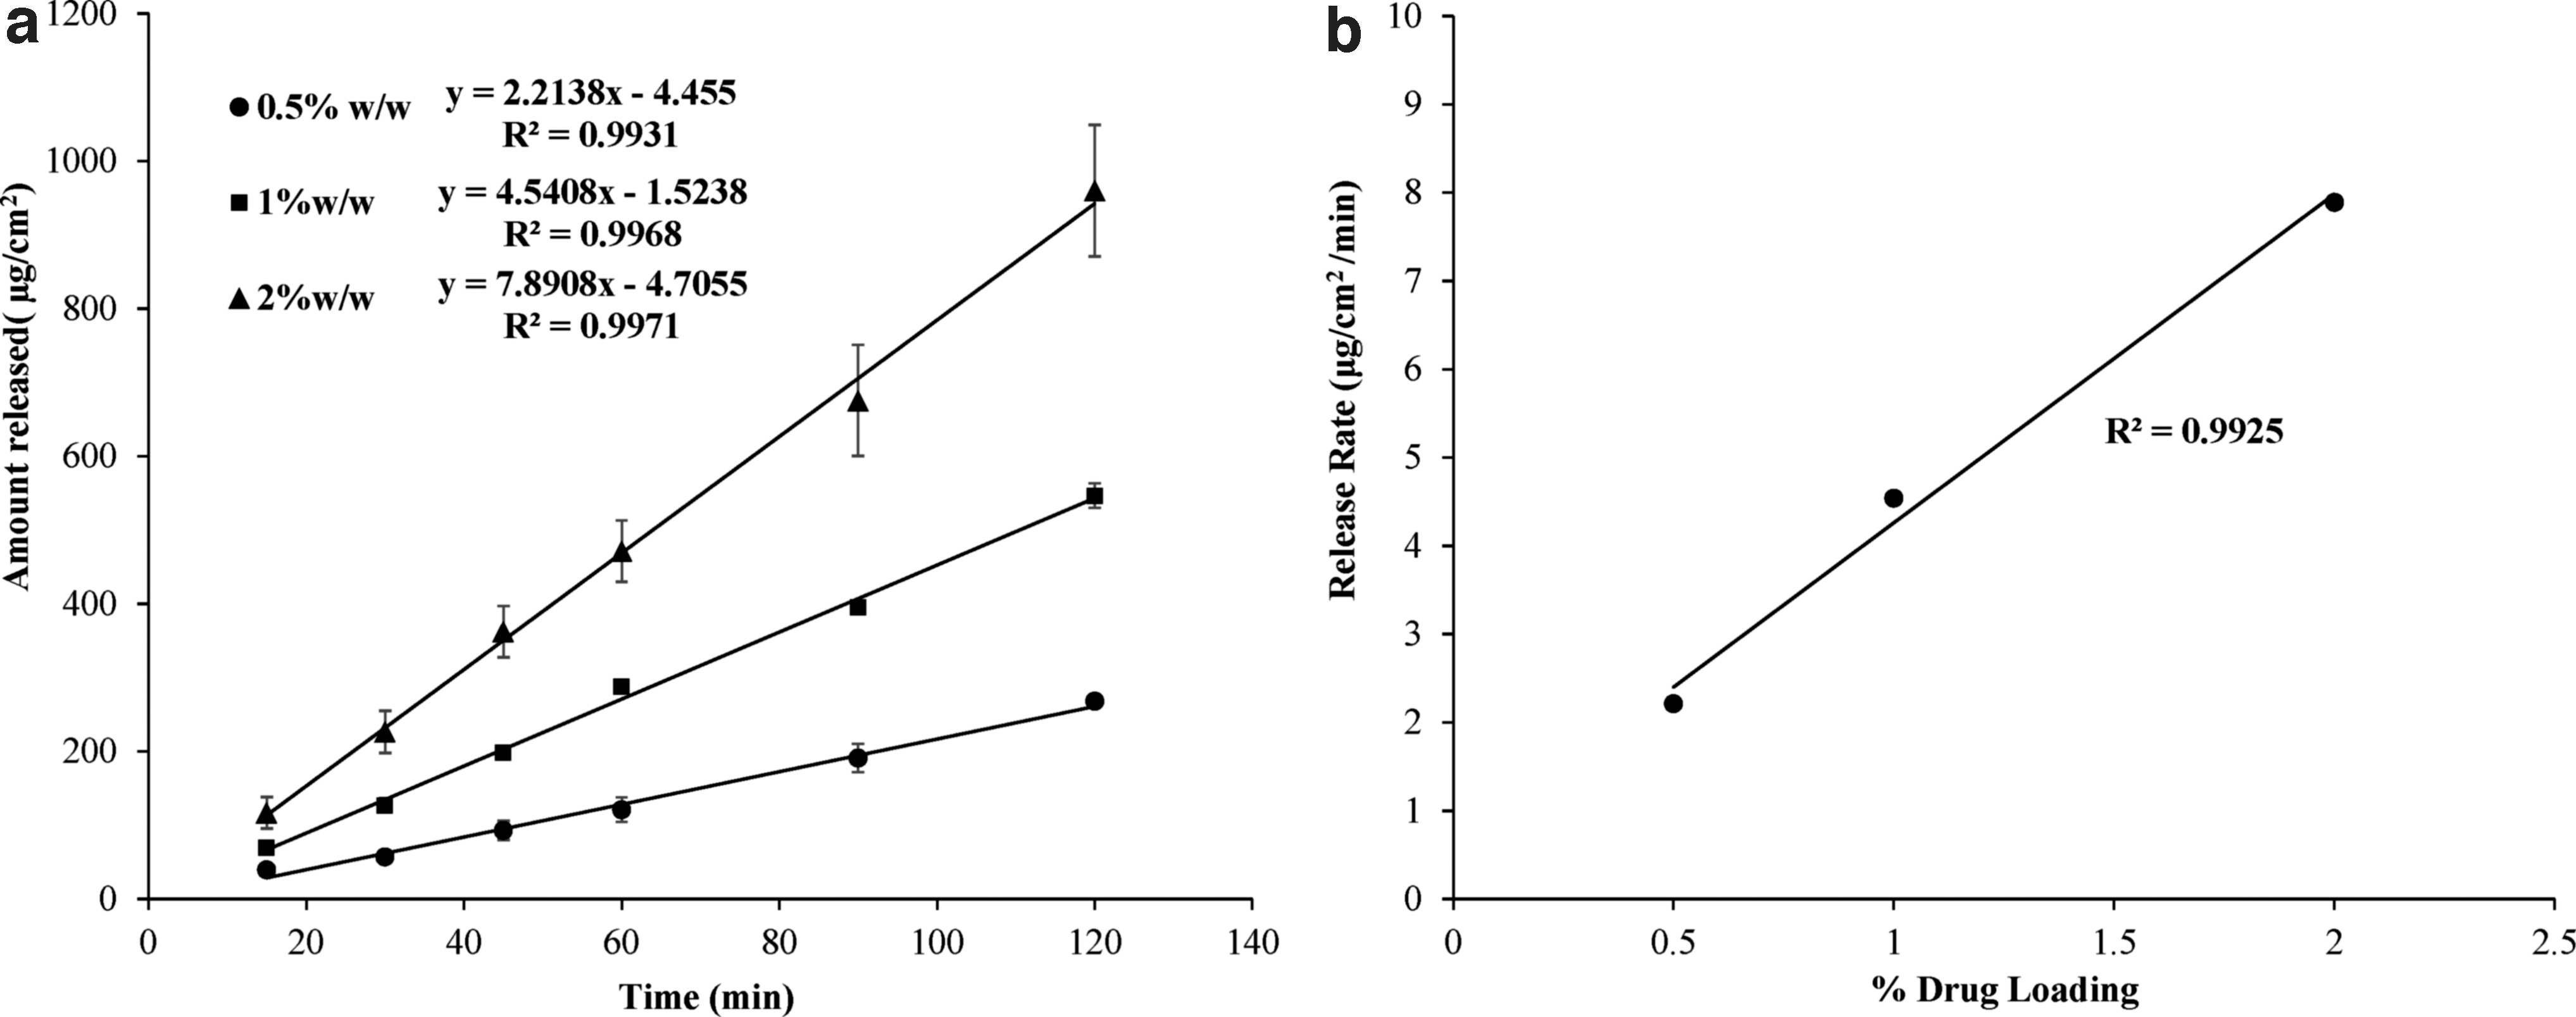
To distinguish between the formulations with the release rates that may be acceptable or nonacceptable, the developed IVRT method must have the discriminatory power. The three gels Gel B-SP, TP1, and TP2 were studied for the sensitivity, specificity, and selectivity of the method. The mean release rates were found to be 2.213 ± 0.179 μg/cm2/min, 4.541 ± 0.08 μg/cm2/min, 7.891 ± 0.66 μg/cm2/min for Gel B-SP, TP1, and TP2 gels of CHX G, respectively. The increasing release rates of CHX G with increasing concentration of the product confirmed the validity of the method for sensitivity as the method can discriminate between the different concentrations of the drug in the product.
Figure 3a. represents the sensitivity of the method for the release rate of three strengths of CHX G gel, and Figure 3b represents the linear regression model for specificity with mean release rates as the dependent variable and the drug concentration in the TP as the independent variable. The obtained results evidenced a linear relationship with the correlation coefficient of 0.9925 between the different drug concentrations of the product and the mean release rates of CHX G, validating the specificity of the developed method as the mean release rates are directly proportional to the increasing concentrations linearly.
The selectivity of the method was validated by conducting the pairwise comparison of the Gel B-SP (RP) with the other two products, namely, TP1 and TP2 as the test samples of the gel. The results of the computed CIs based on the Wilcoxon rank sum/Mann–Whitney rank test as described in SUPAC-SS guidance for the pairwise comparisons are given in Table 2. The results demonstrate the inequivalence in the mean release rates of the two test samples of different strength products compared with the RP as the resultant CI limits fall outside the limits 75.00%–133.33%. The inequivalence reports of the test samples confirmed the validation of the developed IVRT method for selectivity.
In addition, one-way ANOVA further showed significant difference (p < 0.05) between the RP and the TP1 and TP2, confirming the validation of the method for selectivity.
Similarly, the comparative statistical analysis was performed to determine the accuracy of the mean release rates of the three IVRT runs using the Mann–Whitney U-test and the CI limits were determined. The results obtained are given in Table 2. The results fall well within the limits of 75.00%–133.33% as recommended by SUPAC-SS guidance, validating the accuracy of the method or the product sameness. However, the literature reports do not consider accuracy as the relevant parameter because the release rates of particular drug products vary between the runs. 31
Thus, the range of concentrations investigated in this validation study, that is, 0.5% w/w, 1%w/w, 2%w/w of CHX G gel facilitated evaluating the discriminatory power of the developed IVRT method.
Robustness
The sustainability of the developed IVRT method with deliberate variations is essential to determine its robustness. The selection of the parameters for deliberate variations may include the processing conditions of the equipment, variations in the receptor media, or the quantity of the applied formulation. In this study, the robustness of the developed IVRT method was evaluated by considering variations in the temperature and mixing rate. The average slope of the IVRR of six VDC for the IVRT run conducted with deliberate variations made in the parameters studied is given in Table 2. The obtained mean release rates for temperature variations and mixing rate variations were found to be well within the acceptance limit of 15.0% CV from the mean release rate of the IVRT run conducted with the nominal parameters of 37°C ± 0.5°C and 500 rpm.
The results obtained confirm the robustness of the method as it can sustain the deliberate variation impinged on the method. Figure 4a represents the 1% w/w CHX G gel release rate curves with temperature variations and Figure 4b with mixing rate variations.

In addition, a gradual increase in the mean release rate was observed with the speed variations. These data suggest the impact of mixing rate variations on the release profile than the temperature variations. In a similar way, Tiffner et al. 20 and Parera et al. 32 reported results of the effects of temperature variations on the release rates of acyclovir and naproxen.
Recovery and dose depletion
The recovery of the three IVRT runs of six VDCs was computed from the cumulative amount released at the last time point of each of the runs. The results of the calculated recoveries for the three IVRT runs conducted for the linearity, precision, and reproducibility were 16.142% ± 1.1%, 16.304% ± 1.17%, and 17.08% ± 0.799%, respective for the last time point of 2 h, respectively. The average percent recovery of the three IVRT runs was found to be <60%, confirming the dose depletion of CHX G in the developed method as acceptable according to the power law model. Besides, the observed linearity in the release rates of the three IVRT runs for the dose depletion of CHX G further supports the acceptability of the method.
Rheological Characterization
Gels are single-phase dispersions, developed by a liquid interpenetrating solid to form a three-dimensional structure. 33 The structure of polymeric gels depends on the concentration of the polymer and the solvent system. 34 Rheological characterization of the gels owes its importance because of its ability to provide basic knowledge of the formulation consistency, flow property, quality, storage stability, effect of formulation variables, and also determines the release of the drug. Evaluation of flow properties of the developed HPC gels was performed to understand their rheological behavior, that is, Newtonian or non-Newtonian. 33 The increase in HPC concentration in the solvent system results in increased apparent viscosity owing to the solvation of HPC molecules.
The flow curves of a continuous flow test, for all the gels exhibited a shear thinning behavior after attaining the yield stress. As seen from Figure 5a, the yield stress value for the three gels, namely, Gel A, Gel B, and Gel C increases with the increasing polymer concentration in the system. This result is mainly attributed to the increased apparent viscosity of the gels achieving the high viscosity and increased polymer–polymer interactions at higher HPC concentrations. A higher shear stress (τ) denotes a more structured framework of the gel providing resistance to external deformational forces with increased viscosity. However, τ should not be so high that it impacts the spreadability of the gel over the mucous surface. 35 The increased shear rates demonstrated a tremendous impact on the viscosity of the three gels as given in Figure 5b. The viscosity of the three gels ranged from 33.6 ± 3.98 to 4.16 ± 1.2 Pa·s (Gel A), 150 ± 3.8 to 5.51 ± 2.8 Pa·s (Gel B), and 580 ± 3.98 to 10.4 ± 4.3 Pa·s (Gel C), respectively, under the shear rate condition of 10−2 to 100 s−1. These results demonstrate an approximate increase of four times in apparent viscosity with 2% increase of polymer concentration in the solvent system. To compare viscosity factor (m) and flow behavior (n) between the formulations with different polymeric concentrations, a very general Herschel–Bulkley model, was fitted to the non-Newtonian flow curve. The values of the rheological model were fitted in a log –log diagram of shear stress versus shear strain Equation 4.
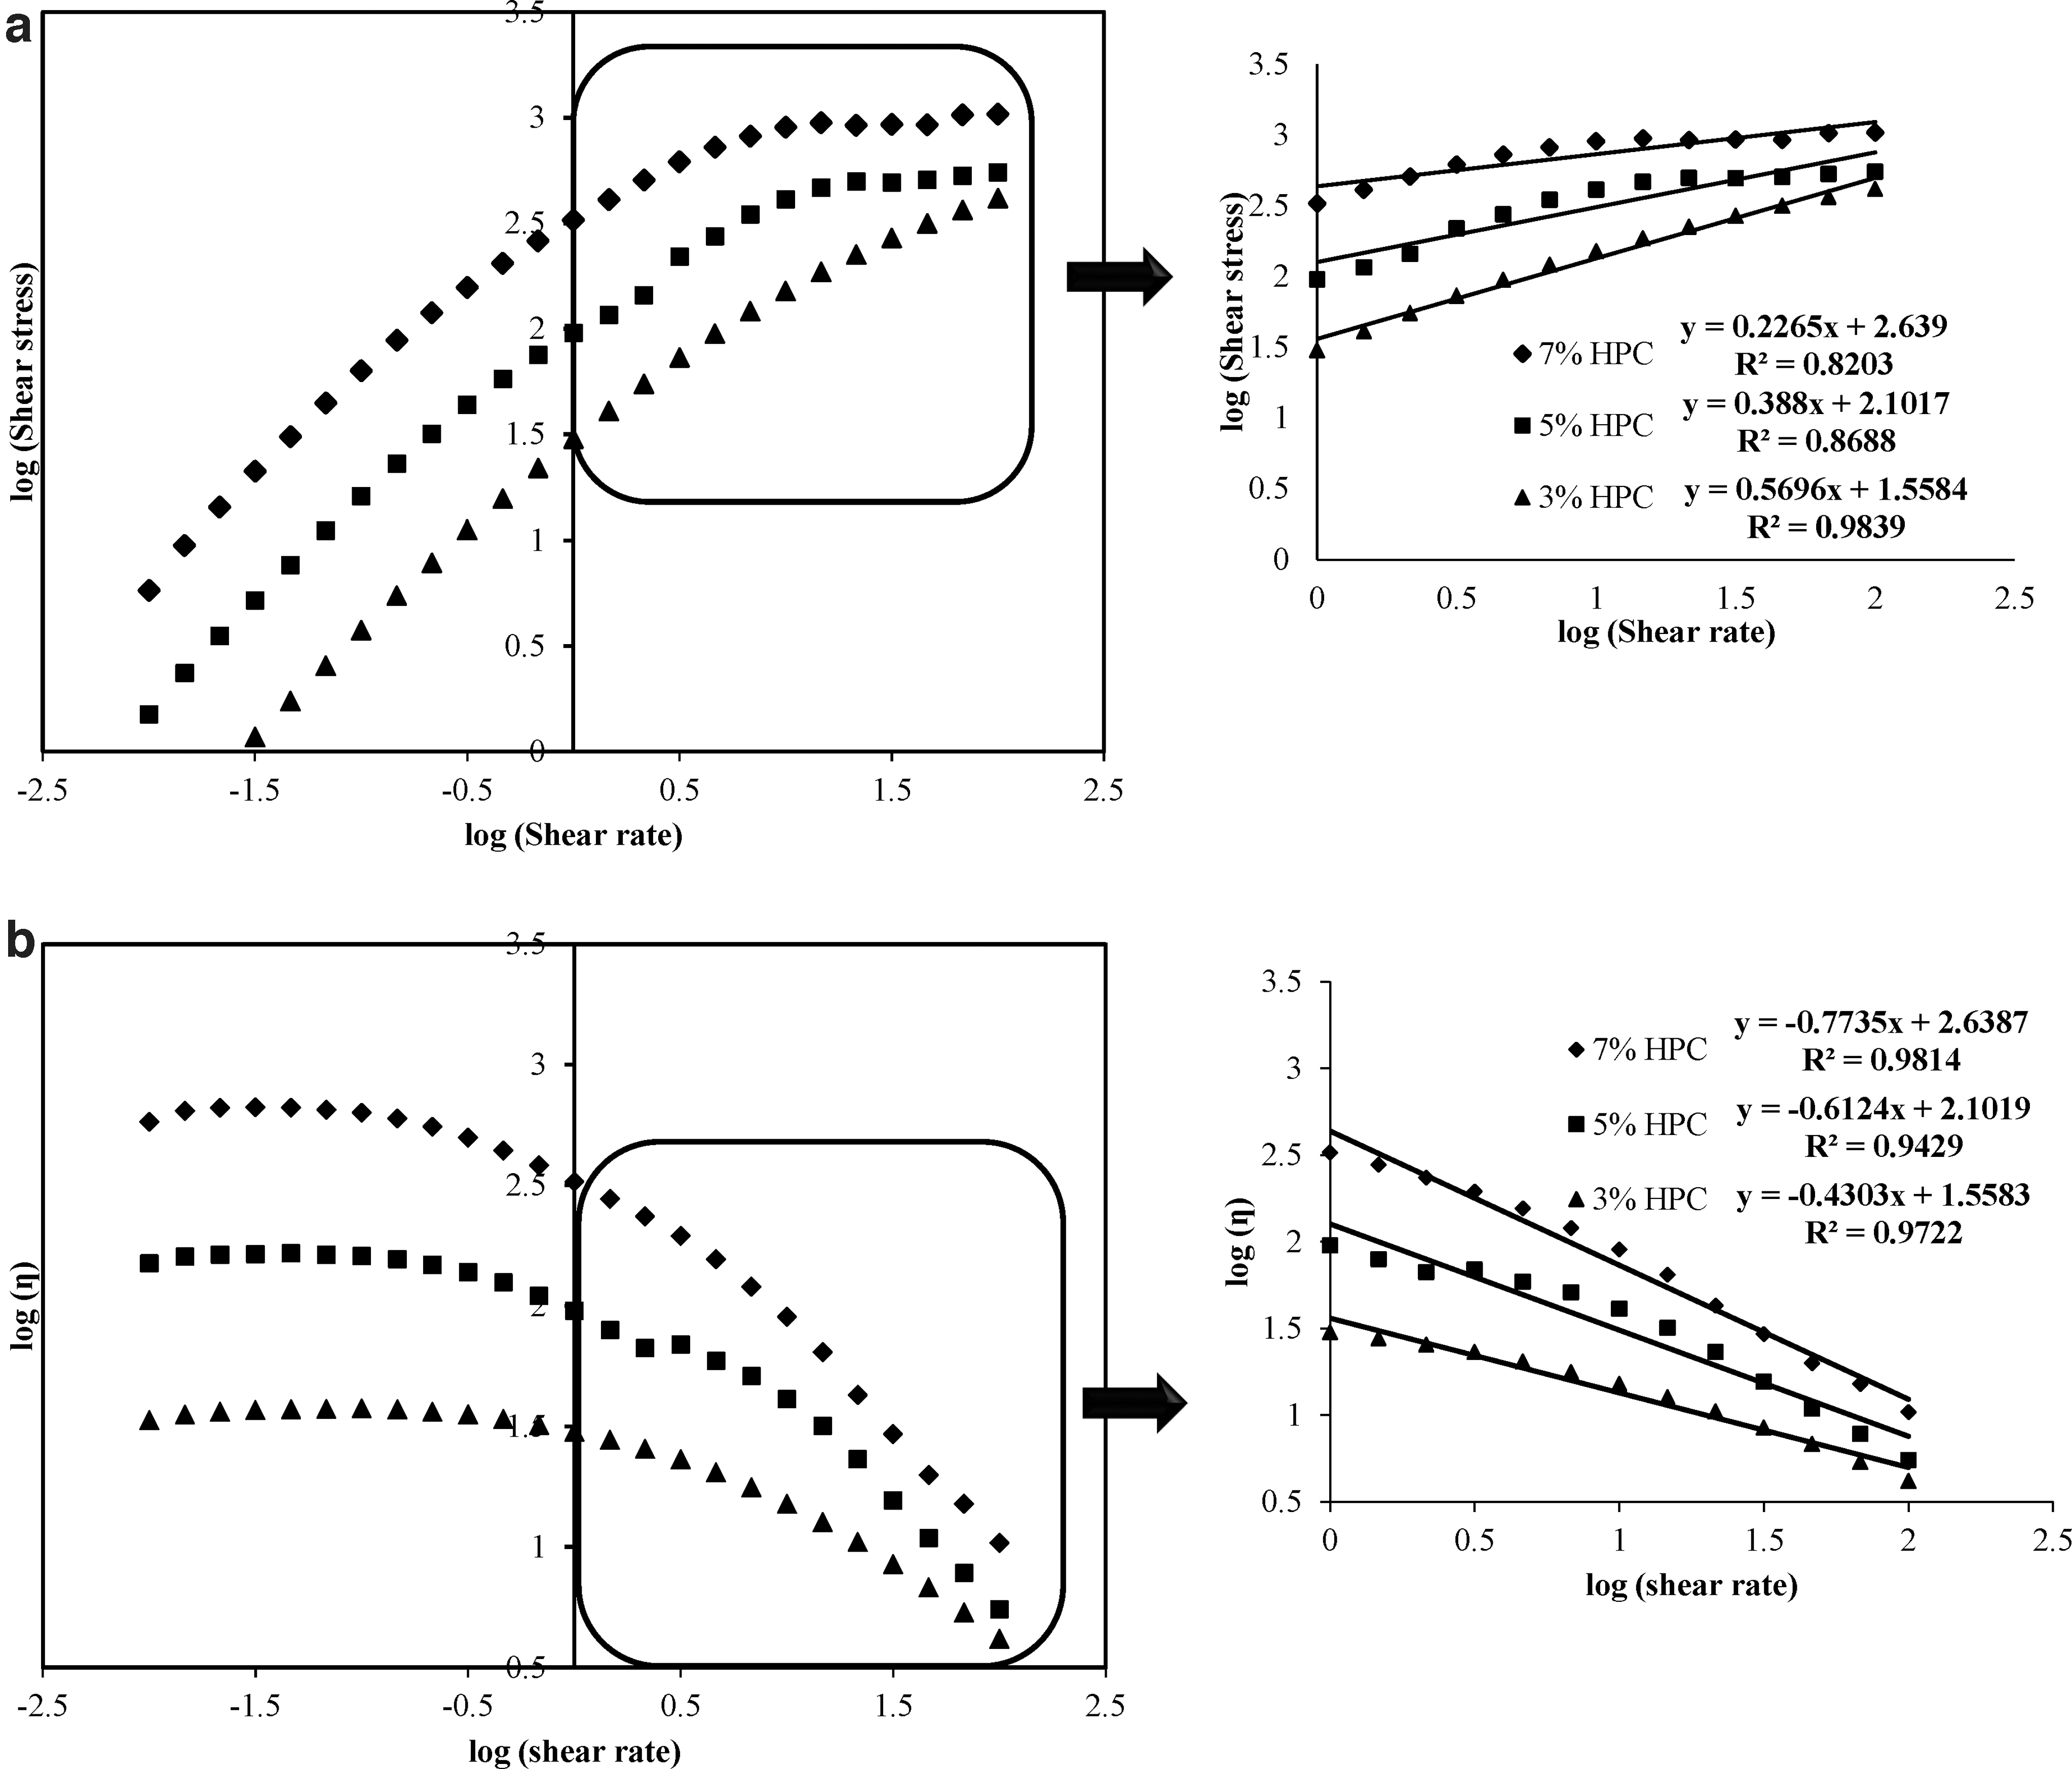
where, τ represents shear stress, τ0 represents yield stress, ϒ represents shear strain, and m, n (Herschel–Bulkley index) are the constants for the Herschel–Bulkley model that are obtained graphically. Herein, m and n representations are described above. The non-Newtonian apparent dynamic viscosity (η) of the Herschel–Bulkley model is given by Equation 5.
The two constants of Herschel–Bulkley model, that is, “m” and “n” were found to be directly and indirectly related to η, respectively. In addition, both the constants were dependent on the polymer concentration in the solvent system. The flow behavior index provided a decreasing trend in viscosity with increasing polymer concentration indicating a high shear thinning property at higher polymer concentrations. In other words, gels with increasing polymer concentration demonstrate an increasing non-Newtonian behavior. On the contrary, increasing trend in viscosity factor with increasing polymer concentration signified increased apparent viscosity. The flow behavior index (n < 1) value for all the gels demonstrated a pseudo-plastic flow property. 36 The values of the Herschel–Bulkley constants for the three CHX G gels are given in Table 4. The obtained results are in accordance with the results reported by Ramachandran et al. 6 for HPC gels. As the flow characteristics has a great impact on the residence time at the mucosal target site and spreading of the formulation, Gel B has the acceptable spreading behavior with medium non-Newtonian behavior from the gels studied, that is, not too runny nor too viscous, which is further confirmed by the texture analysis.
Herschel–Bulkley Constant Values to Predict the Flow Property
The rheological studies of the semisolid dosage forms mostly consider viscosity as the rheological parameter for investigation. However, the dynamic viscosity measurements employ a very high speed, which tends to destroy the three-dimensional structure of the gel and hence, may not give accurate results. Hence, it is recommended to perform oscillatory measurements at the stress values that do not destroy the gel structure. Oscillatory measurements were conducted by applying an amplitude shear strain sweep to determine the viscoelastic properties of the developed gel formulations. Figure 6 represents the storage modulus (G′) and the loss modulus (G″) as a function of shear strain in percentage value. The application of the sinusoidal shear strain amplitude sweep with controlled shear deformation to the prepared gels provides us with two dynamic moduli, namely, G′ and G″ that represents the viscoelastic properties of the gel at a given angular frequency. The G′ is the energy stored and recovered within the gel during elastic deformation and is an indication of the stiffness of the gel, whereas G″ is the energy dissipated during the deformation process. The viscoelasticity of the polymeric solutions gives rise to the phase angle given by tan δ. The loss tangent (tan δ), is a dimensionless term given by the ratio of the G″ to the G′. In cases where tan δ < 1, the system exhibits a more solid like behavior with predominant elastic properties, whereas tan δ > 1 exhibits a liquid-like behavior comprising more viscous properties. Furthermore, when tan δ becomes equal to 1, that is, the crossover of G′ and G″ occurs (G′ = G″), the yield point is attained beyond which there is breakdown in the microstructural arrangement transitioning to a liquid-like behavior. 37

Amplitude sweep test at constant frequency (n = 3).
The HPC gels of different polymer strengths exhibited the viscoelastic property over the amplitude strain studied (10−2 to 102%). The observation from Figure 6 shows that G′ > G″ for all the three formulations suggesting the sol-like viscoelastic behavior of the gel structure. However, it is worth noting that G′ values of the three formulations differ significantly and are in the order of increasing trend with decreasing tan δ with increasing polymer concentration owing to increased polymer entanglement. The results are consistent with the observations reported by Jones et al. wherein the increased G′ and decreased tan δ trend was observed with increased polymer concentration and the variations in the solvent system. 5 The tan δ of the three gels were found to be <1 indicating their elastic solid behavior. The tan δ of the Gel A, Gel B, and Gel C were found to be 0.950 ± 0.01, 0.857 ± 0.07, 0. 707 ± 0.002 (n = 3), respectively, at an amplitude strain of 0.01%, which remained stable until the amplitude strain of 68%. The stable region of the oscillatory curve denotes the linear viscoelastic region for the three gels wherein the microstructure of the gel does not get damaged with the applied shear strain. An initial rearrangement of molecules was observed in Gel A owing to weak arrangement of polymer network. It can be seen from the tan δ observations that Gel A close to 1 represented a solid–liquid behavior, that is, the consistency of the gel was more of a liquid, whereas Gel B and Gel C showed increase in solid elasticity, that is, more like viscous solid. Furthermore, the tan δ of Gel A, Gel B, and Gel C initiated a drop attaining the value of 0.989 ± 0.01, 0.941 ± 0.01, 0.831 ± 0.01 at 100% amplitude strain. This observation suggest that the microstructure of Gel A was close to disorientation, followed by Gel B; however, Gel C remained stable implying the strong polymeric gel network as against Gel A.
As stated by Ramachandran et al. the lower the crossover point more is its elastic behavior, which enables the spreadability of the gel over the mucous surface, pourability, and processability. 6 The rheological characterization of the developed CHX G gel formulations exhibiting pseudo-plastic behavior shows that Gel B has the acceptable consistency and viscoelastic properties in comparison with the other two gels. The rheological properties of Gel B have the required performance characteristics concerning the mucosal adhesion, spreadability on mucosal surfaces, and controlled diffusion of the drug. 38
The differences in the microstructure of the gels as studied previously, may have some effect on the CHX G release from the gel matrices. The entanglement of the polymer molecules depending on the polymer concentration and its impact on drug diffusion will be studied in the IVRT analysis of the gels.
Texture Analysis
The developed formulations were further characterized using texture profile analysis study. The textural properties such as hardness or firmness, deformation at hardness, adhesive force, and adhesiveness that are the components of shear stress are dependent on the formulation composition. 4,27 These properties are essential to understand the mechanical behavior of the semisolid formulations as they provide information on the gel structure or the microstructural arrangements and also aid in predicting the performance under various physiological and environmental conditions. 26 Hardness of the product facilitate the understanding of spreadability and ease of application at the mucosal site. It is related to the viscosity of the formulation, which is a reflection of the polymer concentration. The higher polymer concentration is directly proportional to the hardness of the gel, which makes it difficult to spread and thus discourage the ease of application. The hardness of the gel is the measure of the maximum force required to deform the product to the defined target distance and is denoted by the maximum positive value of force obtained in the force versus time plot (Fig. 7).
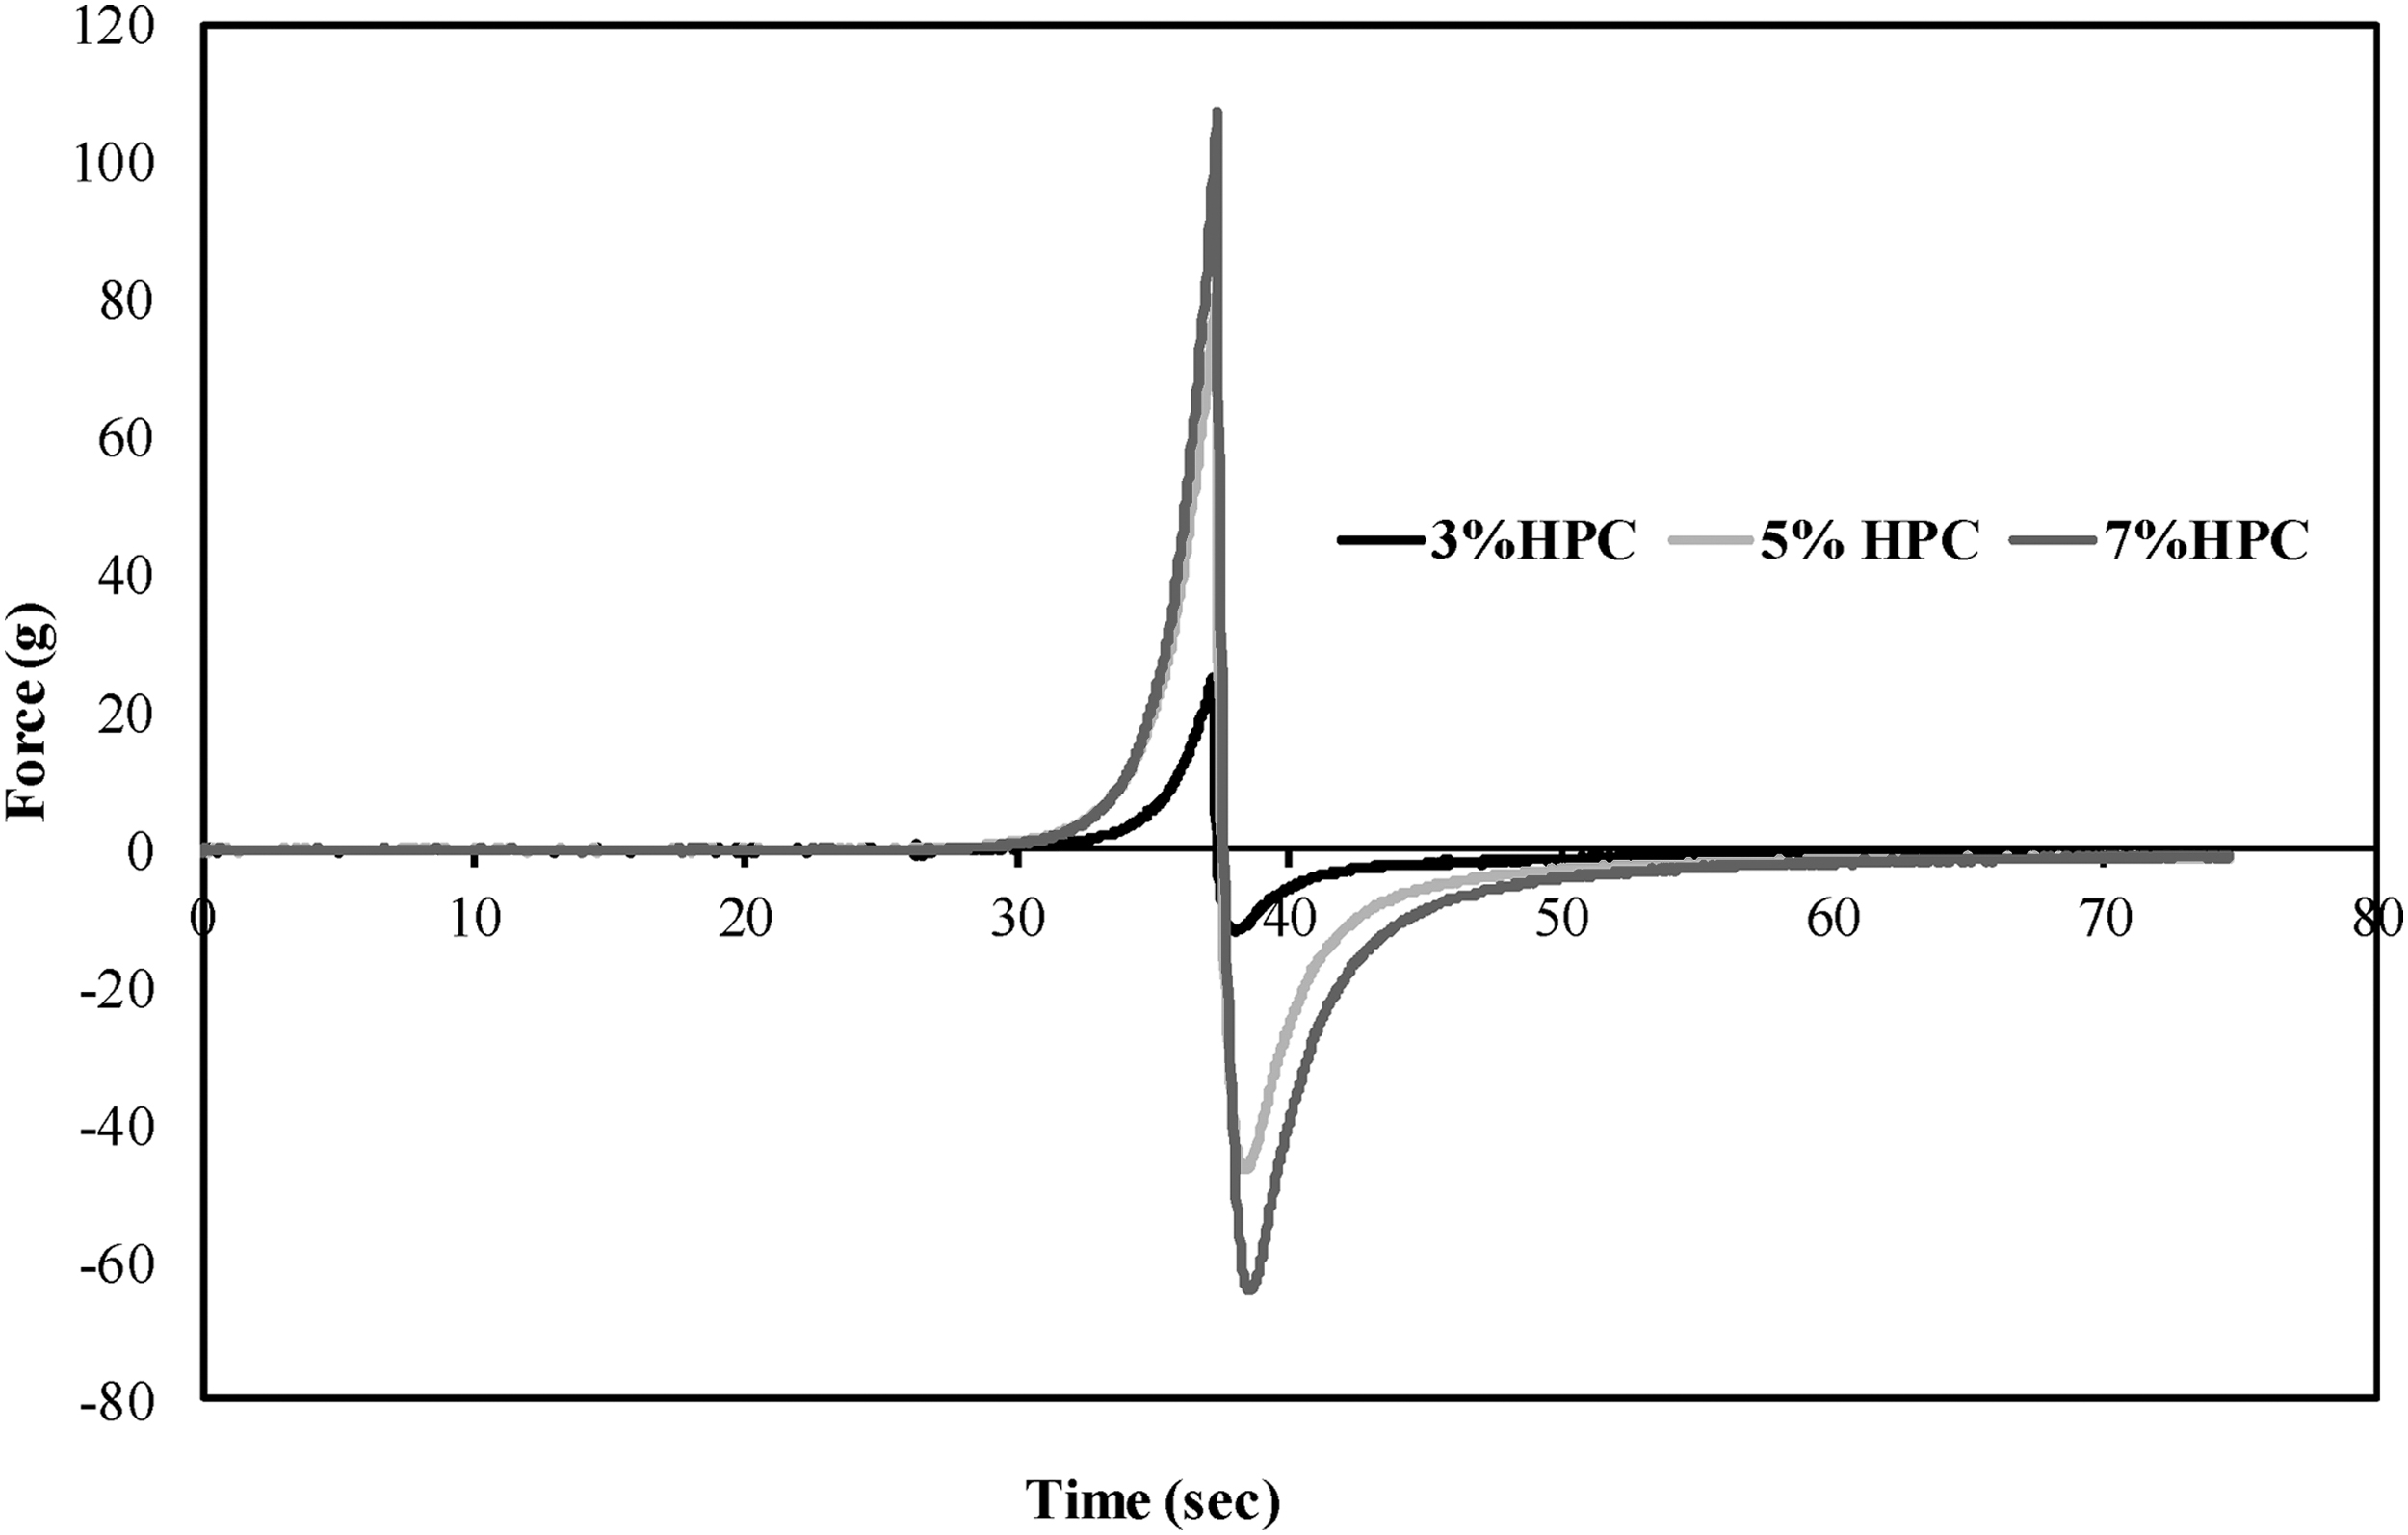
Texture analysis profile (n = 3).
The results of the textural properties for the three formulations are given in Table 5. The obtained results of the hardness, compression force, and adhesiveness showed a proportional increase in magnitude of textural properties with increase in the polymer concentration of the three formulations. The formulation Gel A showed the least hardness with a least compression force, which may be because of the loose bonding polymeric network that causes the mobility of the polymer molecules in the vehicle, whereas the formulation Gel C showed the maximum hardness with maximum compression force that explains the stiffness in the formulation with maximum bonding in their polymeric network. This is well explained by McTaggart and Halbert 39 showing maximum compression force for the highly cross-linked gels, wherein the polymeric network is more entangled as compared with the loosely cross-linked gels. As explained earlier, the results suggest that Gel A, which shows the least hardness has maximum spreadability owing to the least resistance in its deformation and Gel C shows exactly the opposite performance because of the maximum resistance for deformation of the gel. In addition, the observed hardness correlated well with the rheological characterization of the gels. Similar observations of correlation between the hardness and viscosity were reported by Jones et al., 27 Pandey et al., 26 and Baloglu et al. 38 The hardness of the gel was found to be in the order Gel C > Gel B > Gel A. These results suggest less spreadability for Gel C as compared with Gel A.
Results of the Textural Properties of the Developed Gels
Adhesive force and adhesiveness are the properties that determine the stickiness of the formulation. The maximum negative force taken by the formulation to detach the product from the probe breaking the cohesive bonds is the adhesive force, and the area of negative curve of the graph is the energy required to break the cohesive forces attached to the probe, denoted as adhesiveness. The results of the adhesive force and the adhesiveness also show increasing order with the increasing polymer concentration. However, very less adhesiveness was observed for Gel C. The texture profile results show that Gel B has a good hardness and adhesiveness, whereas Gel C has a very high hardness and adhesiveness. In contrast to this observation, Gel A has poor hardness and adhesiveness. These results suggest that there is a strong gel network formation in Gel C and Gel B and weak network formation in Gel A. The obtained results were found to be in accordance with the rheological studies.
In vitro Release Testing
The IVRT of the three formulations Gel A, Gel B, and Gel C was conducted using the developed and validated IVRT method. The difference in the microstructural network of the three formulations, as studied by the rheological and texture analysis method should reflect in the drug release profile. However, Jones et al. 5 reported that the microstructural difference has no relationship with the drug release properties from the HPC gel systems. Moreover, the difference in the drug release obtained from the HPC gel systems having different polymeric strength with significant difference in their rheological parameters, exhibited negligible difference in their release rates. To determine the same, the release rate of the three formulations shown in Figure 8 were compared with evaluate the drug release profile and compute the difference in their release rates. Furthermore, the release profiles were fitted to Korsemeyer–Peppas model to determine the release mechanism followed by the three gels. The value of n for the three gels was found to be 1.00, 0.9696, 1.043 for Gel A, Gel B, and Gel C, respectively. This suggest that the drug release phenomenon was Case II transport mechanism of non-Fickian diffusion. The mass transfer rate was a result of the diffusion and polymer relaxation following the zero-order release kinetics. As suggested by Möckel and Lippold in their study, the zero-order release pattern of the drug may be because the process is mainly controlled by the dissolution of the polymer. This means there is the immediate diffusion of the drug on the surface of the matrix on contact with the receptor medium followed by the dissolution of the polymer, which is the rate determining step that in turn correlates well with the rheological properties of the matrix system. 40

Release profile of the developed formulation.
The developed IVRT method would be considered as a very sensitive method if it has the ability to determine the reported differences in the release rates of three formulations. The mean release rates for the three gels were found to be 5.059, 4.524, and 3.636 μg/cm2/min for Gels A, B, and C, respectively, computed from the release profile curves. As observed in the study case of Jones et al., the differences in the release rates of three formulations obtained were in decreasing trend with the increasing polymer concentration. Although the three formulations behaved significantly different during their rheological and mechanical investigation, such difference had minimalistic effects on the drug release properties from the HPC gel systems. This behavior of HPC gels during drug diffusion is well explained by Jones et al. 5 The increase in polymer concentration in the PG solution increases the viscosity of the solution. On comparing the rheological parameters with the release profiles, it is evident that the viscosity of the gels is inversely proportional to the drug release rate constant, whereas tan δ is directly proportional. From these observations, it is implicated that the release rate decreases gradually with the increase in the viscoelasticity of the gels, that is, increase in the polymer entanglement in the gel network. Thus, Gel C with stronger gel network showed slower drug release and Gel A with a weaker gel network showed a faster release rate.
In addition, the difference in the release rates were compared statistically using one-way ANOVA and by calculating the CIs limit for the pairwise comparison between the three gels as recommended by SUPAC-SS. The release rates among the three formulations were found to be significantly different (p < 0.05). Shah and colleagues well explain the differences in the product performance based on the IVR profiles. 41,42 The differences in the performance observed based on their release profiles mainly attributed to the qualitative (Q1), quantitative (Q2), and state of arrangement of matter or microstructure of the formulations (Q3) as explained in TCS. Thus, the differences in the microstructure have an impact on their performance. This may be owing to the fact that viscoelastic properties of HPC largely depends on the solvent system, molecular weight, polymer concentration, and interactions between the polymer and the solvent system. However, as per the SUPAC-SS guidance the UL and LL of CI obtained for Gel A (LL:107.964 and UL: 117.623) and Gel B (LL:72.86 and UL: 87.201) fall within the limits because of wider range indicating that two gels have similarity in the drug release behavior from their matrices. The results further indicate that the wider specifications sometimes may give false-positive results for the formulations having minimal differences in their release rates, which in this case was observed for Gel A and Gel B, whereas Gel A and Gel B in comparison with Gel C (LL: 64.300 and UL: 78.199) show statistically different release behavior as per the same SUPAC-SS guidance.
As can be observed that the three gels demonstrate a significant difference in their release rates, as shown with p < 0.05, it reflects differences in rheological and mechanical properties of gels. Hence, we consider the developed method has the discriminatory power to evaluate the formulation differences and is able to detect the miniscule differences in their microstructural arrangement. Thus, the developed IVRT method was found to be sensitive enough to highlight the differences in the microstructure of the gel prepared with different concentrations of the HPC polymer in a stated solvent system.
Conclusion
The nonaqueous-based gels of varying concentration of HPC were prepared successfully. The rheological and mechanical analysis demonstrated the impact of HPC concentration on microstructure of the prepared gels. With the increase in the HPC concentration, there was a gradual rise in a yield stress, hardness, adhesiveness, and cohesiveness values suggesting the increase in the viscoelastic properties of gels. These differences in the viscoelasticity affected the release rates of CHX G from gel formulations. The release rates were assessed using the developed and validated IVRT method indicating the discriminatory power of the method. The IVRT method was successfully developed and validated for linearity, precision, reproducibility, specificity, sensitivity, selectivity, robustness, accuracy, recovery, and dose depletion as per USFDA SUPAC-SS guidance.
Footnotes
Disclosure Statement
No competing financial interests exist.
Funding Information
No funding was received.
Supplementary Material
Supplementary Table S1
Supplementary Table S2
Supplementary Table S3
Supplementary Table S4