
Abstract
Simvastatin (SIM) is known to lower cholesterol levels and is speculated in the pathogenesis of Alzheimer's disease. In this study, the bioanalytical method of SIM SNEDDS was developed and validated for the estimation of SIM in the rat's plasma using reverse-phase high-performance liquid chromatography. C-18 reverse-phase octadecylsilyl column was used to validate the method. Atorvastatin (ATV) was used as an internal standard. Gradient elution was performed using acetonitrile and water in a ratio of 90:10 with a flow rate of 1 mL/min. The chromatogram of these both compounds SIM and ATV was detected at a wavelength of 238 and 244 nm. The drugs were extracted from the plasma samples using the protein precipitation method. The retention time of SIM and ATV was found to be 3.720 and 8.331 min, respectively. The developed method was found to be linear in the range between 50 and 250 ng/mL, with a regression coefficient (r2) of 0.9994. According to ICH M10 guidelines, the method was validated. The percent of drug recovery was more than 95% and the % relative standard deviation was <2% in the replicate studies, which showed that the method was accurate and precise. The limit of detection and limit of quantification were found in rat plasma to be 0.12 and 0.38 ng/mL, respectively. The obtained result indicated that the developed method was successful in estimating SIM in rat plasma and passed all validation test parameters.
INTRODUCTION
Chemically, simvastatin (SIM) is (1S,3R,7S,8S,8aR)-8-{2-[(2R,4R)-4-hydroxy-6-oxooan-2-yl] ethyl}-3,7- dimethyl-1,2,3,7,8,8a-hexahydronapththalen-1-yl 2,2 dimethyl Butanoate, shown in Figure 1. 1 It appears as a white powder with a molecular weight of 418.566 g/mol and log P is 4.46. SIM is a reversible lactone prodrug that goes through metabolism. It is a lipid-lowering drug that works by inhibiting hydroxy-methyl-glutaryl coenzyme A (HMG CoA) reductase. 2 This helps in the conversion of HMG-CoA to mevalonate. Thus, it reduces plasma low-density lipoprotein (LDL) cholesterol by depleting intracellular cholesterol. In addition, it increases LDL receptor expression and helps in the treatment of hypercholesterolemia. 3

Structure of SIM. SIM, simvastatin.
Few individual studies have reported that SIM was used to reduce the risk of dementia and Alzheimer's disease (AD), 4 as well as AD-related neuropathological changes. 5
SIM causes substantial toxicity in a variety of animal species when used at high doses. 6 It has been linked to a broad range of side effects, ranging from minor gastrointestinal problems to potentially fatal disorders like rhabdomyolysis. Its high systemic dosage increases the risk of side effects such as renal damage and liver failure. Constipation, nausea, diarrhea, and myotoxicity-related side effects, which range from mild myalgia to the infrequent occurrence of rhabdomyolysis, are among the most commonly reported negative effects of statins. 7
Hence, it becomes important to develop some suitable oral dosage forms of SIM, as well as to develop a simple, sensitive, and robust analytical method for its estimation in the dosage form as such, in biological samples such as blood, urine, feces, and saliva. It becomes crucial to have a selective and sensitive method to estimate the drug in biological fluids because, during pharmacokinetic studies, the drug concentration is very low at the nanogram level. Hence, the development of an analytical method with a very low limit of detection (LOQ) becomes the prime requirement.
Nevertheless, at some time, it becomes an important task for the analyst to look for a simple as well as an economical method for their detection.
In the past, some liquid chromatography and mass spectrometry (LC-MS) based methods have been developed and some of them are also described in this study. However, these methods are quite expensive as the operation cost and instrument cost, as well as the requirement of other accessories to run the machine make the overall method development a very expensive process. Owing to these challenges with hyphenated techniques, the search for the simple high-performance liquid chromatography (HPLC) method is always ongoing and worth exploring. Based on this objective, our work was initiated to develop a new HPLC method at our laboratory. Of course, there also exist some HPLC methods, but most of them have provided a longer run time than the run time reported in this article. Few studies are discussed below in subsequent paragraphs.
In 2015, Liu et al, described a bioanalytical method for the estimation of SIM using LC/MS with electrospray ionization. 8 The mobile phase consisted of acetonitrile (ACN) and 10 mM ammonium acetate (pH 4.5). Its flow rate was 0.8 mL/min. The run time of SIM was found to be 3.11 min.
Similarly, in another study, Auti, in 2018, developed a bioanalytical method using reverse-phase HPLC (RP-HPLC) for the estimation of SIM, in combination with piperine in rat plasma using 0.01%formic acid and methanol as a mobile phase with a flow rate of 1.0 mL/min. The retention time of SIM was reported at 22.1 min. 9 In 2020, Pandey et al developed an RP-HPLC bioanalytical method and validated the estimation of SIM in combination with glimepiride. The method was carried out in rat plasma using ACN and potassium dihydrogen phosphate buffer pH 5 (75:25, v/v) as a mobile phase with flow rate 1.0 mL/min. The retention time of SIM was found to be 9.59 min, % recovery was 98.96, and LOD and LOQ were 11 and 33 ng/mL, respectively. 10
In both methods, the SIM was estimated after longer time duration. Longer retention time indicates toward consumption of more solvent and leads to expensive method development. Hence, it was decided to develop a faster and more affordable bioanalytical method for SIM in rat plasma.
Methods
Chromatographic conditions
A bioanalytical method was developed utilizing ICH M10 standards for drug quantification in rat plasma. 11 The mobile phase utilized a 90:10 v/v mixture of ACN (A) and water (B). The flow rate was set at 1 mL/min, and the chromatogram was measured at 238 nm. SIM was analyzed using various mobile phase compositions, such as ACN-0.1% formic acid, methanol-water, and ACN-water 90:10, ACN and % ortho-phosphoric acid, and ACN and water 60:40, by adjusting the mobile phase ratio.
Collection of blood and extraction of plasma
Using a capillary tube and radioimmunoassay (RIA) vials containing ethylene diamine tetra acetic acid (EDTA) crystals, a blood sample was collected from rats through the retro-orbital puncture. The rat was initially held, while having its neck scuffed and its eye made to bulge. Blood was allowed to flow into the EDTA vial through a capillary tube after a capillary was placed dorsally into the retro-orbital plexus of the eye. The EDTA tubes were centrifuged at 5,000 rpm for 15 min and the temperature was adjusted to 2°C–8°C. The clear supernatant was removed with a micropipette and stored for processing in a deep freezer at −20°C (Solution C).
Preparation of standard stock solutions
SIM (10 mg) was dissolved in 10 mL of ACN in a 100 mL volumetric flask and then the volume was adjusted to 100 mL to obtain a solution concentration of 100 mg/mL (Solution A). A second volumetric flask was used to dilute Solution A to a concentration of 10 mg/mL using ACN up to 100 mL (Solution B). A further SIM dilution was obtained by taking 10 mL aliquots of solution B and diluting them to 100 mL in ACN to attain a concentration of 1.0 mg/mL (Solution C).
To obtain a concentration of 200 ng/mL, 20 mL of liquid from solution C was dissolved in a 100 mL volumetric flask, and the volume was increased by 100 mL of ACN (Solution D). Atorvastatin (ATV) (10 mg) was dissolved in a small amount of ACN in a 100 mL volumetric flask, and the volume was then adjusted to 100 mL using ACN to obtain a final concentration of 100 mg/mL (Solution E).
Preparation of internal standard
ATV 10 mg/mL was used as the internal standard (IS) for dilution preparation. A quantity of 10 mg was weighed and added to a volumetric flask (100 mL) containing 20 mL of ACN. The solution was sonicated for 10 min. The final volume was adjusted to 100 mL using ACN to produce a stock solution with a concentration of 100 mg/mL.
Specificity study
SIM and blank plasma samples were injected on HPLC using mobile phase ACN: water (90:10 v/v) to validate method specificity. The possibility of drug-plasma peak interference was investigated.
Development of calibration curve
One milliliter of solution E was added after aliquots of 1.25, 2.5, 3.75, 5, and 6.25 mL of solution D were transferred into separate 10 mL volumetric flasks. Around 0.1 mL of plasma was added to each of the above dilutions and mixed for 5 min. To precipitate and break down plasma protein, acetone (1 mL) was added to each sample and thoroughly agitated using a sonicator for 15 min. Then, all samples were centrifuged in an Eppendorf at 10,000 rpm for 30 min at 4°C. To get theoretical SIM concentrations of 50, 100, 150, 200, and 250 ng/mL and ATV concentrations of 10 mg/mL, the supernatant was collected using a micropipette, and the volume was adjusted to 10 mL in a volumetric flask. HPLC was used to analyze SIM and ATV using the final prepared samples. 12
Validation of the method
According to the ICH M10 standard, the developed method was validated. 13 System suitability parameters, including theoretical plate, height equivalent to the theoretical plate, tailing factor, detection limit, and quantification limit, were measured to assess the system performance further.
Linearity and range
The concentration was plotted on the X-axis, and the mean peak area was plotted on the Y-axis, to create the calibration curve. The slope, the standard deviation (SD) of response (sigma), the y-intercept, the SD of the intercept, and the regression coefficient (r 2 ) were calculated using the calibration data. 14
Accuracy
The absolute recovery of the drug from the quality control samples was estimated to determine the method's accuracy. Three different concentration levels of the method were used to prepare the samples: lower quantified concentration (LQC, 80%), medium quantified concentration (MQC, 100%), and high quantified concentration (HQC, 120%) at the midrange concentration of 100 ng/mL. Aliquots of solution D in the amounts of 3.0, 3.75, and 4.5 mL were added into separate 10 mL volumetric flasks to obtain these concentrations. One milliliter of solution E and 0.1 mL of plasma were then added. After adding plasma, the samples were sonicated and centrifuged in an Eppendorf at 10,000 rpm for 30 min at 4°C.
The supernatant was transferred using a micropipette into a 10 mL volumetric flask, and 3.75 mL of solution F was then added. The volume was then diluted to 10 mL with ACN. As a result, the theoretical concentrations of SIM in these solutions were 120, 150, and 180 ng/mL, respectively, with 10 mg/mL of ATV. These concentrations were determined using HPLC in six replicate tests.
12
The formula shown in the following Eq. (1) was used to estimate the absolute percentage of drug recovery:
Precision
The repeatability and intermediate precision of the developed method were used to determine its precision. Six injections of the LQC, MQC, and HQC samples were performed into the same experimental setup on the same day to ensure repeatability (without the addition of sample solution F). By calculating LQC, MQC, and HQC samples six times under similar experimental conditions, but on different days with different analysts (interanalyst), the intermediate accuracy was determined.
15
Following the collection of mean data, the percentage relative standard deviation (RSD) was calculated using the formula shown in the following Eq. 2:
System suitability and estimation of LOD and LOQ
System compatibility was evaluated using the peak purity index, height equivalent to theoretical plate (HETP), theoretical plate, and tailing factor. The SD of response (sigma) and slope of the calibration curve were used to determine the LOD and LOQ (S).
16
The SD was calculated using the SD of the Y intercepts of the regression line. The following Eqs. (4) and (5) were used to calculate the results
17
:
Stability study
Three freeze-thaw cycles were used to study the stability of plasma samples spiked with SIM, with short-term stability at room temperature for 3 h and long-term stability at −20°C for 3 weeks. Three milliliters of plasma was collected in one RIA vial for freeze-thaw stability. To this vial, 10 mg of SIM was added (to achieve a concentration of 1,000 mg/mL), and the solution was vortexed for 5 min. This test tube was placed in a freezer at a −20°C temperature. The test tube was taken out and thawed at room temperature after the sample had frozen. From the thawed samples, 1 mL of plasma was removed (Cycle 1), and the remaining 2 mL of plasma was stored in the deep freezer for the following cycle.
The drug was precipitated from the extracted plasma (1 mL), and the supernatant was centrifuged. After centrifugation, the clear translucent supernatant was obtained and diluted to 100 mL with ACN to obtain a concentration of 100 mg/mL. 18 Dilutions were also prepared to obtain 120 ng/mL (LQC), 150 ng/mL (MQC), and 180 ng/mL (HQC). Similar to Cycle 1, the final frozen plasma sample (2 mL) was taken out, allowed to thaw at room temperature, and then 1 mL was extracted (Cycle 2). The final 1 mL of thawed plasma was then placed back in the deep freezer. It was taken out and thawed after it had frozen (Cycle 3). As in Cycle 1, the method was repeated in Cycles 2 and 3 to prepare LQC, MQC, and HQC samples. IS was added to all these solutions at a concentration of 10 mg/mL.
All dilutions were produced in triplicate, and injected into HPLC, and their retention times at 238 nm were determined. The mean, SD, and % RSD were calculated for each concentration. 19,20 Similar to this, at room temperature, the short-term stability of a plasma sample injected with SIM was determined. Before extraction, the stability was tested at 1, 2, and 3 h. In the short term, 3 mL of plasma and 10 mg of SIM were added (to achieve a concentration of 1,000 mg/mL) to the RIA vial and vortexed for 5 min. The RIA vial was maintained at a constant temperature (room temperature).
After each interval, a sample (1 mL) was collected, the drug was withdrawn from the plasma, processed to create the LQC, MQC, and HQC samples, and IS (10 mg/mL) was added. The retention times of each dilution were measured at 238 nm after they had been prepared in triplicate and injected into the HPLC. The mean, SD, and % RSD were estimated for each concentration. 21 Three RIA vials containing 1 mg of SIM each were filled with 1 mL of plasma to ensure long-term stability (to achieve a concentration of 1,000 mg/mL). All three vials were put in the freezer at −20°C after the mixture had been vortexed for 5 min.
After 1, 2, and 3 weeks, the three vials were removed from the freezer. Following each interval, the drugs were taken out of the plasma, prepared for LQC, MQC, and HQC samples, and then IS (10 mg/mL) was added. To measure the retention times at 238 nm, each dilution was made in triplicate and then injected into the HPLC. The mean, SD, and % RSD were calculated for each concentration. 22
Statistical analysis
The experimental values are all reported as mean SD. The mean, SD, and percent RSD were calculated using an MS Excel worksheet. In GraphPad Prism version 7.0, the calibration curve was developed and the results were compared using Tukey's multiple comparison test. (GraphPad Software, Inc., CA). A significant difference in the collected data was shown by a p-value of <0.05.
RESULTS AND DISCUSSION
Specificity, Linearity, and Range
Since no other peak was found in the chromatogram of the blank plasma sample at the drug's retention time and lambda max, the developed method was verified to be drug molecule specific. As a result, it was determined that the chosen method was drug specific. 23 The plasma-based calibration curve was shown to be linear in the 50–250 ng/mL range. The regression coefficient (r 2 ) was determined to be 0.9994, indicating linearity. The calibration curve shown in Figure 2, and the chromatogram of blank plasma and SIM in rat plasma are given in Figure 3:
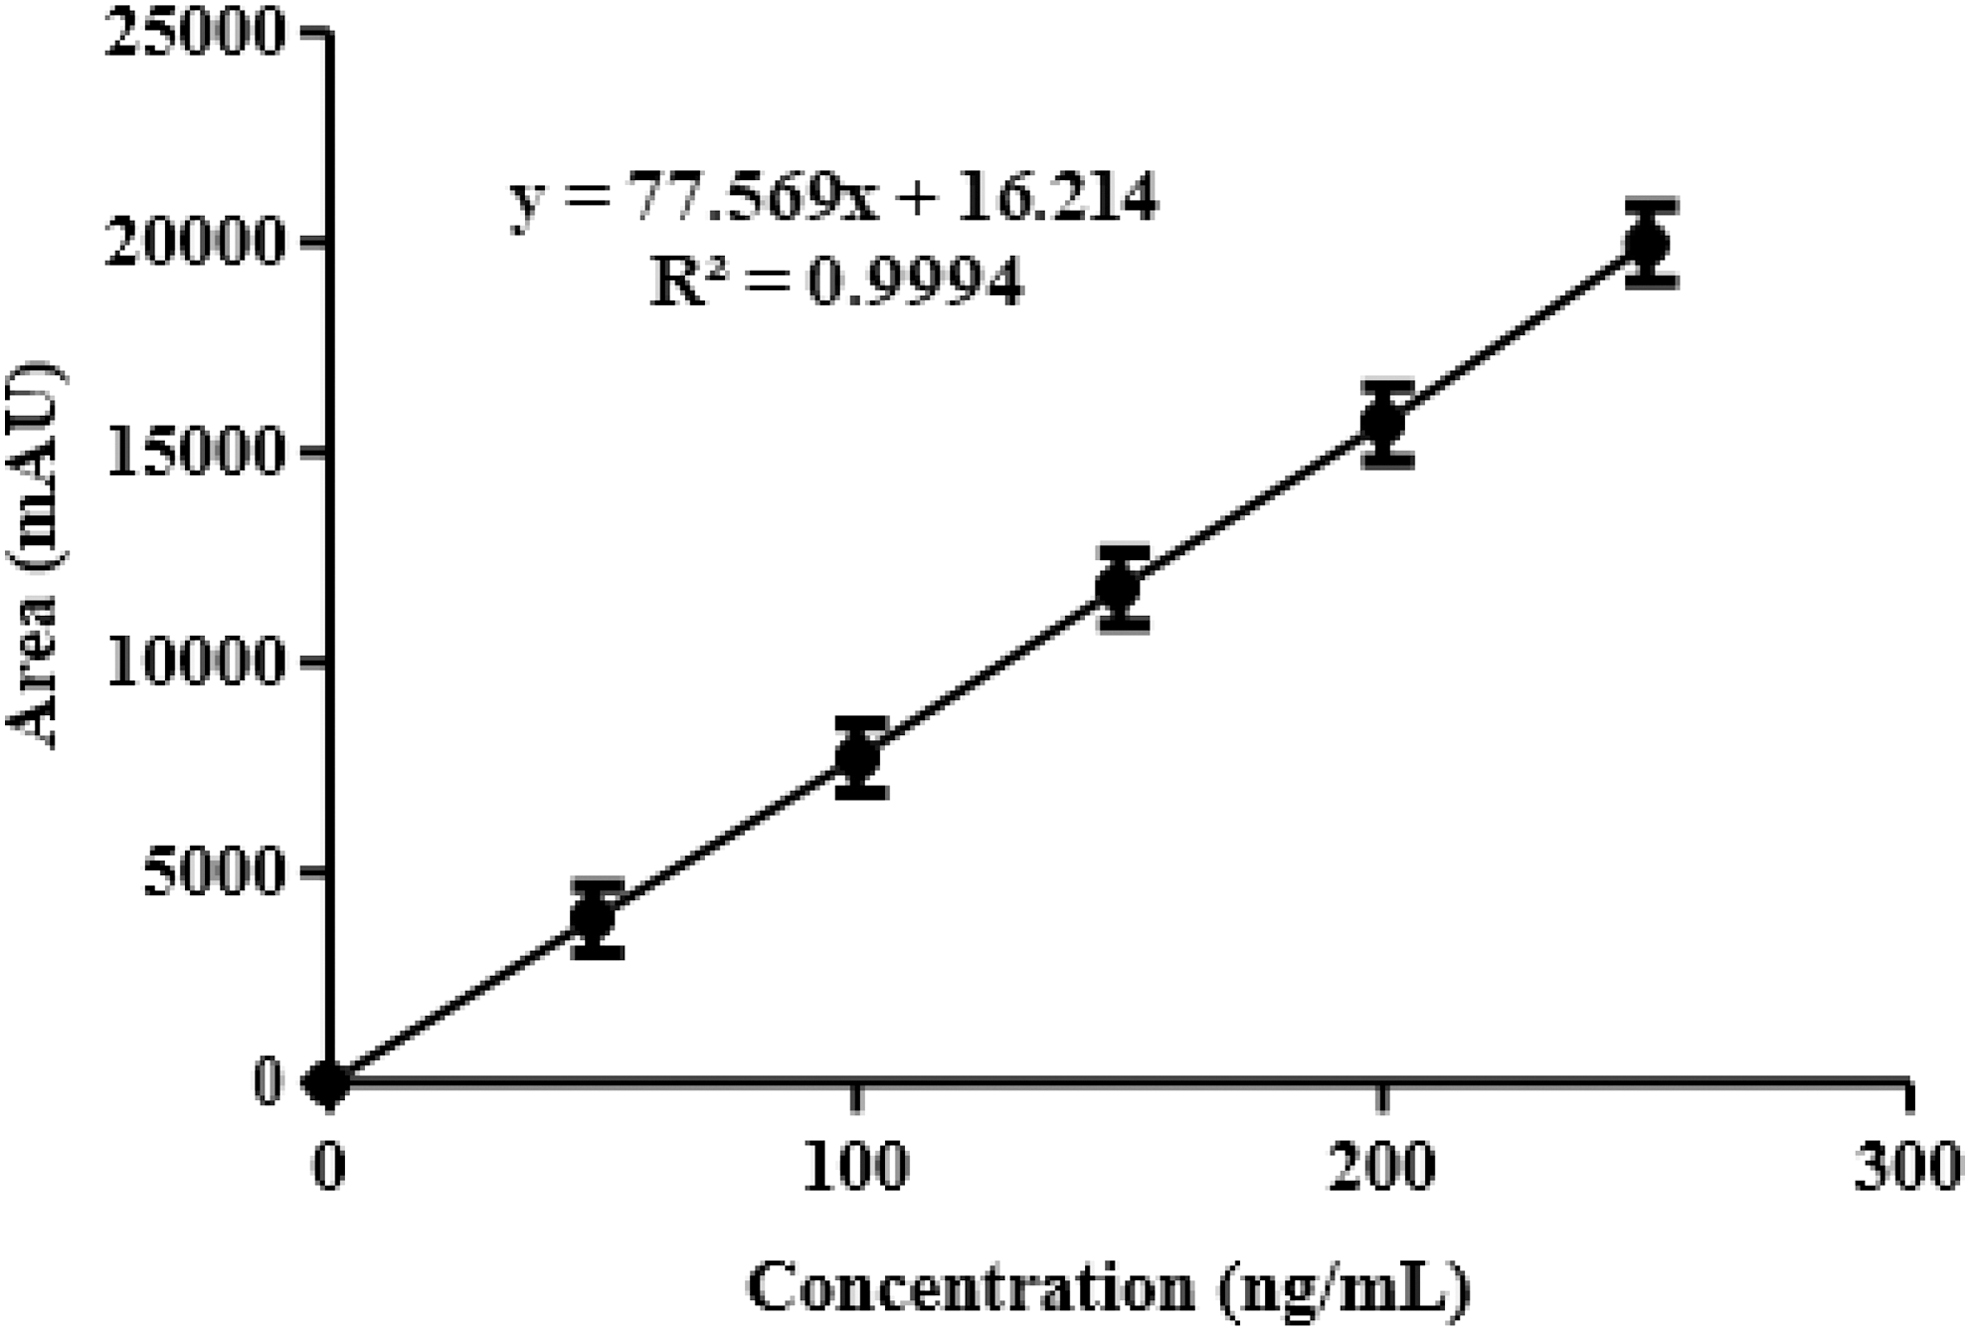
Calibration curve of SIM.

Accuracy
The result showed that the mean percentage recovery for all three levels was within the standard ranges, that is, 95%–105%. This shows that the developed method was accurate under the study's test conditions, as shown in Table 1:
Results of Accuracy Study
HQC, high quantified concentration; LQC, lower quantified concentration; MQC, medium quantified concentration.
Precision
The precision of developed techniques was determined by calculating the % RSD for the six LQC, MQC, and HQC solution determinations at the intraday, interday, and interanalyst levels under the same experimental studies. The percentage relative deviation was <2%, indicating that the developed technique was precise under the specified test conditions, as shown in Table 2:
Results of Precision Study
RSD, relative standard deviation; SD, standard deviation.
Stability Study of Plasma Samples
For the LQC, MQC, and HQC samples, the stability study was conducted for spiking samples of SIM in plasma at three different levels, including short term (Table 3), freeze-thaw cycles (Table 4), and long term (Table 5). In all cases, the results indicated that more than 95% of the drug was recovered, with an RSD <2%. These studies' results showed that drugs in plasma samples were stress stable and long-term storage stable. 24
Short-Term Stability for Plasma Samples of Simvastatin
Freeze-Thaw Stability for Plasma Samples of Simvastatin
Long-Term Stability for Plasma Samples of Simvastatin
LOD and LOQ
LOD and LOQ were found in rat plasma to be 0.12 and 0.38 ng/mL, respectively. These showed that the method was sensitive for the detection of the drug at lower concentrations.
System Suitability
According to usage, a chromatographic system's suitability and effectiveness are examined using a system suitability test. The tailing factor for all peaks, including SIM and ATV peaks, did not exceed two to show good peak regularity (acceptance limits <2) and the number of theoretical plates were always >2,000 in all chromatographic runs to ensure good column efficiency throughout the developed separation process shown in Table 6. 15
Results of System Suitability Parameters
ATV, atorvastatin; HETP, height equivalent to theoretical plate; SIM, simvastatin.
CONCLUSION
The work was carried out to develop a cost-effective, easy, sensitive, accurate, and precise bioanalytical method for quantifying SIM in rat plasma. The percentage recovery of SIM from plasma samples was 95%–105%, indicating excellent recovery. The percentage RSD of samples with various concentrations used for intraday and intermediate precision studies was determined to be <2%, and system suitability studies revealed that the method was repeatable and robust. When compared to other methods for determining SIM in biological samples, the method also significantly improves drug recovery from plasma samples, has lower linearity and range, and lowers LOQ and LOD values. The developed method can be used to study the pharmacokinetics and biodistribution of the drug in SIM or bulk form in different pharmaceutical formulations.
Footnotes
ACKNOWLEDGMENT
Authors are thankful to Central Instrumentation facility of Lovely Professional University for providing analytical support.
AUTHORs' CONTRIBUTIONS
Conception: constructing an idea or hypothesis for research and/or article (Hardeep, N.K.P.). Design: planning the methods to generate hypothesis, or to reach the conclusion (N.K.P. and S.K.S.). Supervision: organizing and supervising the course of the project or the article and taking the responsibility (N.K.P. and S.K.S.). Resources: providing personnel, environmental and financial support, and equipment and instruments that are vital for the project (Hardeep, B.K., and D.S.B). Materials: biological materials, reagents, and referred patients (Hardeep, N.K.P., L.C., U.G., and D.S.B.). Data collection and/or processing: taking responsibility in the execution of experiments, patient follow-up, and data management and reporting (Hardeep, N.K.P., L.C., and B.K.).
Analysis and/or interpretation: taking responsibility in logical interpretation and presentation of the results (N.K.P., S.K.S., B.K., and U.G.). Literature search: taking responsibility for conducting literature search (Hardeep, L.C., U.G., and D.S.B.). Writing article: taking responsibility in the construction of the entire or a substantial part of the article (Hardeep, N.K.P., and L.C.). Critical review: reviewing the article before submission not only for spelling and grammar but also for its intellectual content. (N.K.P., S.K.S., B.K., and U.G.).
ETHICAL APPROVAL
The study procedure was conducted at Lovely Professional University, School of Pharmaceutical Sciences and approved by Institutional Animal Ethics Committee (protocol no: LPU/IAEC/2022/04).
DISCLOSURE STATEMENT
No competing financial interests exist.
FUNDING INFORMATION
No funding was received for this article.