




Abstract
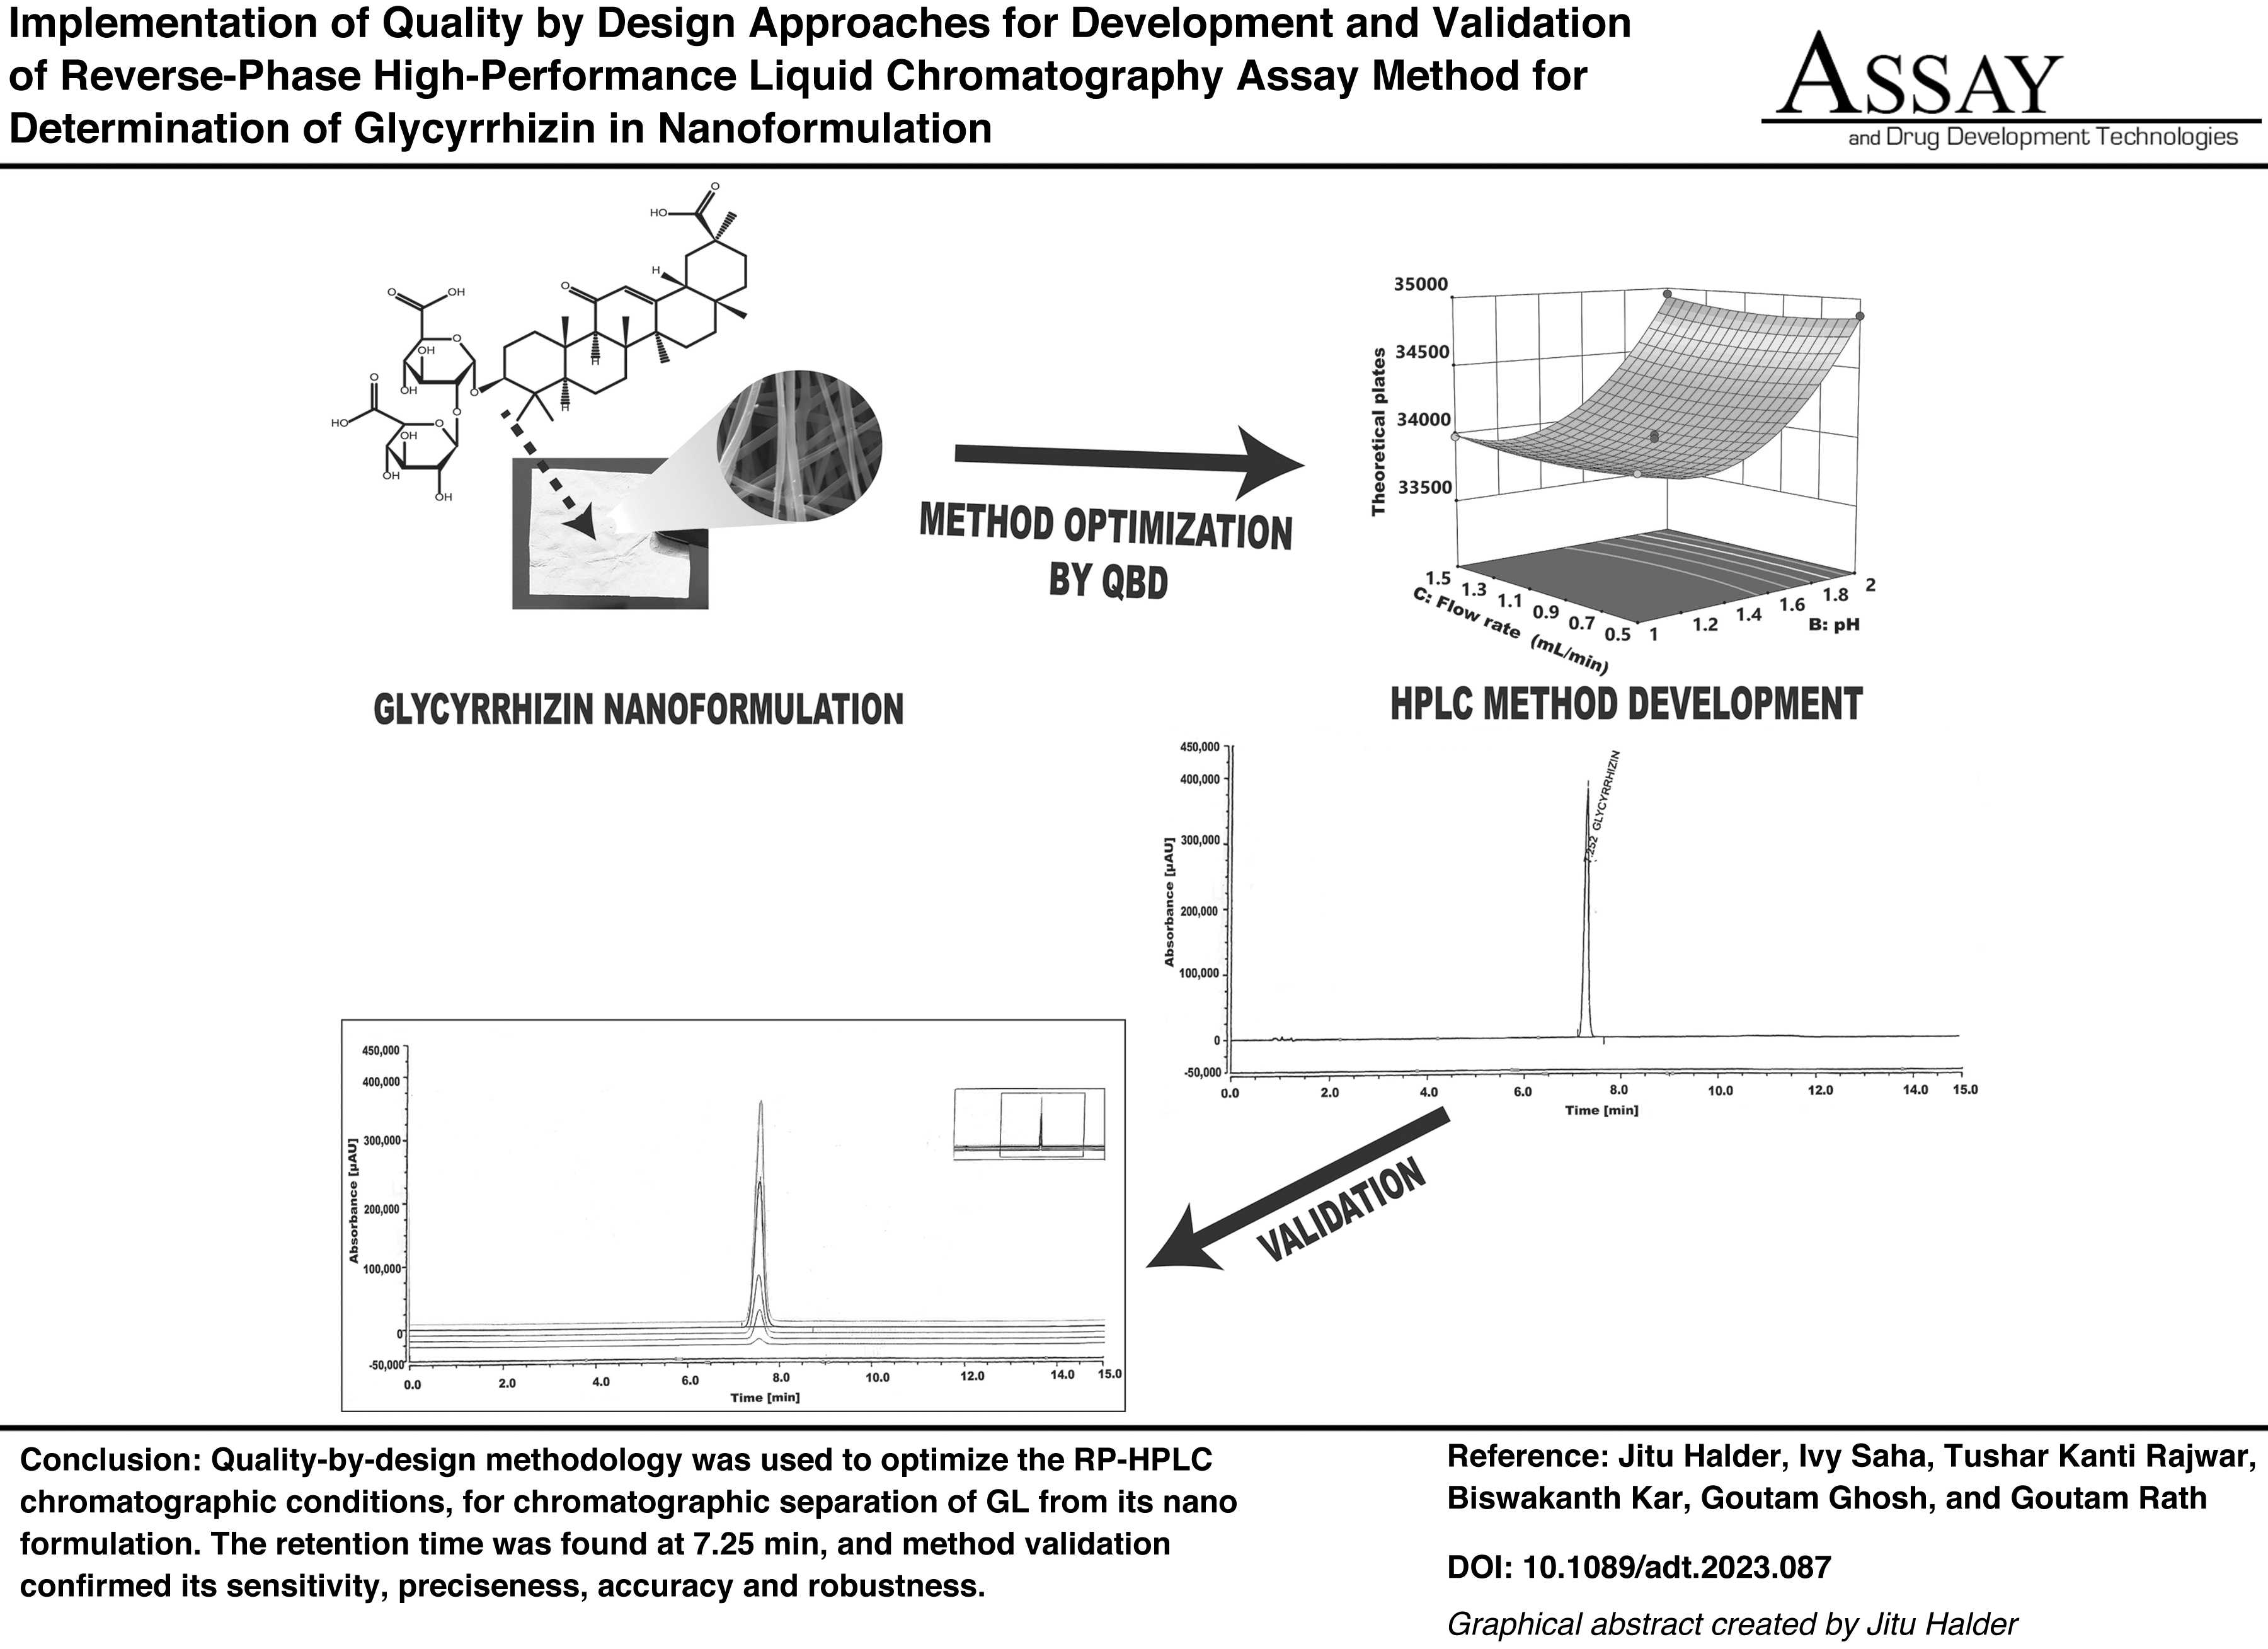
Glycyrrhizin (GL) is the principal constituent of Glycyrrhiza glabra, having antiallergic, anticancer, anti-inflammatory, and antimicrobial action. The reverse-phase high-performance liquid chromatography (RP-HPLC) analytical method was used to quantitatively estimate GL in a nanoformulation and validated as per International Conference on Harmonization Q2 (R1) standards. A stationary phase of the C18-HL reversed-phase column and a mobile phase of acetonitrile and water were used for effective elution. The chromatographic conditions of RP-HPLC were optimized utilizing a quality-by-design approach to accomplish the required chromatographic separation of GL from its nanoformulation with minimal experimental runs. Optimized RP-HPLC conditions for the assay method consist of acetonitrile (41%) and water, pH 1.8, balanced with phosphoric acid (0.1%) as a mobile phase with a flow rate of 1 mL/min. The retention time was found at 7.25 min, and method validation confirmed its sensitivity, preciseness, accuracy, and robustness.
INTRODUCTION
Glycyrrhizin or “20-β-carboxy-11-oxo-30-norolean-12-en-3β-yl-2-O-β-d-glucopyranurosyl-α-d-glucopyranosiduronic acid” (C42H62O16, MW 822.92), is the major component of Glycyrrhiza glabra. 1,2 It has been reported as an antiallergic, anti-inflammatory, and antimicrobial molecule concerning their modes of action. 3 –6 It has a mild anti-inflammatory effect because it is less potent than “steroidal or nonsteroidal anti-inflammatory drugs such as prednisolone, dexamethasone, indomethacin, and diclofenac.” In particular, glycyrrhizin (GL) is a naturally occurring anti-inflammatory agent that can downregulate the interleukin-1 β (IL-1β), IL-6, and tumor necrosis factor α. 7 However, the therapeutic efficiency of GL is restricted because of its low aqueous solubility leading to low bioavailability. 8,9 The limited solubility of GL becomes problematic as it leads to decreased bioavailability when taken orally. 10 GL has been developed into a nanofiber formulation (Fig. 1) to address this concern, effectively enhancing the drug's bioavailability. 11

Scheme of GL nanoformulation preparation. GL, glycyrrhizin.
According to earlier research, the nanofiber is widely investigated due to its distinctive characteristics, high surface area, microporous fibrillar nature, and similarity to the natural extracellular matrix.
12,13
Their main impact is evident in weak water-soluble drugs. Malik et al. prepared poly
In addition, the Design of experiments (DOE) has been used frequently to optimize analytical procedures due to its application, which reduces the overall number of trials required, resulting in less reagent utilization and much less laboratory work. Moreover, DOE enables the development of a statistical model, which facilitates evaluation of the contribution and statistical acceptance of the different factor impacts on the evaluated responses and assesses their interactions. 21 –23
Several analytical techniques have been published for chromatographic condition optimization through HPLC procedures using a quality-by-design (QbD) approach, according to a literature review. 24 –27 There has yet to be any prior reporting of an analytical method for GL in the HPLC method utilizing QbD methodology. Furthermore, few dedicated HPLC methods are available for GL estimation in nanoformulations. 28 The proposed research centers on the QbD strategy for developing an HPLC technique for analyzing GL in nanoformulation. The method will be validated to ensure its suitability for estimating GL in nanoformulations. “According to ICH guidelines, the validation process will encompass assessing the method's linearity, sensitivity, robustness, accuracy, and precision, which are crucial to validating a new analytical technique.”
MATERIALS AND METHODS
Materials
GL was acquired from TCI Chemicals Pvt. Ltd. (Tokyo, Japan). HPLC-grade Acetonitrile was purchased from Merk life sciences. Laboratory-grade chemicals and solvents were used in the investigation. Throughout the investigation, we used Milli-Q water.
Instrumentation and Chromatographic Conditions
A Shimadzu LC System with a UV-visible detector performed the reversed-phase HPLC analysis. The Chromeleon 6.8 Chromatography Data System was used to assess the data. The samples were analyzed using a C18-HL reversed-phase column (150 4.6 mm, 3.5 m; Zorbax Ltd.). The elution was performed using a binary gradient solvent system and ambient temperature (40°C), with Acetonitrile:water contained phosphoric acid by volume. A basic analytical balance INCAL (Scale-Tec) was used to perform all weighing procedures for the proposed analysis. The measurement was observed at wavelength found from a UV-Visible spectrophotometer (Shimadzu 1900i) after analysis of standard GL solution with a sample injection volume of 10 μL. The duration of the analysis was 15 min.
Preparation of Sample and Stock Solution
Stock solution of standard drug
Acetonitrile:water (50:50, % v/v) was used as a diluent to prepare the standard stock solution of GL. Accurately weighed power drug 10 mg GL was taken into a 100 mL volumetric flask, shaken with diluent to dissolve and diluted with the same to make up the volume to 100 mL. A 0.45 μm filter (Millex®; Sigma Aldrich) was used to filter the solution. An optimal volume of solution was diluted from the filtrate using acetonitrile:water to get a final concentration of 60 μg/mL (100%).
Standard solution of drug nanoformulation
GL nanoformulation (nanofiber) was prepared by electrospinning technique as reported by our earlier research. 29 GL nanoformulation was dissolved in 100 mL of diluent, that is, acetonitrile:water (50:50, % v/v). Then, the final concentration of the drug in the solution was equivalent to 100 μg/mL. A 0.45 μm filter (Millex; Sigma Aldrich) was used to filter the solution. An optimal volume of solution was diluted from the filtrate using acetonitrile:water to achieve a concentration of 60 μg/mL.
Optimization of RP-HPLC Method
In the beginning, the trial-and-error technique was used to find out more regarding the effectiveness of the process and to find a number of significant independent parameters and their impacts on dependent variables. Design Expert® Software (version 13; Stat Ease, Inc., Minneapolis) optimized the formulation using a three-factor, three levels Box-Behnken design (BBD). The composition of acetonitrile (X1; %), pH (X2), and flow rate (X3, mL/min) were the independent variables. At the same time, the dependent variables were selected to be the retention time (Y1), theoretical plates (Y2), and tailing factor (Y3). The independent variables were selected at three levels, that is, high (+1), medium (0), and low (−1). All these factors are presented in Table 1.
Independent Variables and Their Upper and Lower Limits
A total of 15 batches were suggested by the software with three center points (all other material and process parameters were constant). Three additional center points in each block were added to 15 batches in triplicate. All other parameters except the independent variables were kept at their ideal values. The Design of the Experiment software was adjusted to fit the retention time, theoretical plates, and tailing factor data, except for the independent variables. Response surface analysis was used to determine the expected points of the independent variables that would make up the optimized method and comprehend the relationship and interaction terms between the parameters. The design was examined using an analysis of variance (ANOVA).
The ideal experimental condition was found once quality parameters were set at desired values using checkpoint analysis and the desirability approach. 30 We derived one optimized condition in triplicate, as recommended by the software. We measured the dependent variables after determining the range in which the optimum circumstances may fall using overlay plots using the desirability function. To validate the model, we compared the predicted retention time, theoretical plates, and tailing factor with the observed retention time, theoretical plates, and tailing factor.
Validation of Response Surface Methodology and Data Analysis
The collected results were adapted for use with Stat-Ease's Design-Expert software. The influence of various independent factors on the response variables was investigated using “multiple linear regression analysis (MLRA),” which was performed by creating second-order polynomial models utilizing software. 31 The developed methodologies were confirmed using ANOVA. Further, the software's generated equations were examined to determine the relative impact of each critical material attribute (CMA). The program produced “3D response surface plots, 2D perturbation curves, and contour plots” to determine the primary and interaction effects of variables. Objectives were established, and checkpoint batches were created by the software's desirability approach to determine the CMA composition that would produce the desired quality attributes. The combination that predicted the maximum level of desirability was chosen and the experiment outcomes were compared to the projected values. 32
Validation of the Method
System suitability
To confirm the system's functioning, system suitability parameters were measured. Six replicate injections of 60 μg/mL GL standard solution were used to determine the system's precision. The two crucial parameters, the theoretical plate number, and tailing factor were measured. 33
Selectivity
A sample of GL nanoformulation was developed to test the selectivity of the suggested method. Along with the percentage recovery of both analytes, its area was compared to the area of the standard solution.
Linearity
The suggested method's linearity was assessed in accordance with the guidelines of the International Conference on Harmonization (
Accuracy
The drug recovery procedure involved injecting a solution (n = 3) with known concentrations (60 μg/mL) of both drugs that had been made from fresh stock solutions (100 μg/mL). During the study, three distinct nanofiber samples were produced at varying concentrations, specifically at levels of 80%, 100%, and 120%, respectively. Standard GL solution was also prepared in the same manner as the test samples at three varying concentrations of 80, 100, and 120%. All the samples were prepared by dilution method. Each level of concentration of 4.8 mL (80%), 6 mL (100%), and 7.2 mL (120%) of stock solution was taken into a 10 mL volumetric flask and diluted with the diluent to make up the volume to 10 mL. Each concentration was subsequently examined using the HPLC method in a triplicate manner. The drug percentage recovery and percentage relative standard deviation (% RSD) was calculated for each level. 35
Method precision
The precision of the initial analysis was assessed using intraday and interday precision. Six replicate injections of 60 μg/mL samples were examined for intraday precision using the established HPLC method. These injections were made in the morning and the evening of the same day. Six replicate injections on the first day (morning) and six replicate injections on the next 2 days (morning) were conducted by the established HPLC method to determine the interday precision. The peak area and percentage coefficient of variations (% CV) or % RSD were then selected to assess the precision of the method. 36
Robustness
“According to ICH, the robustness of an analytical procedure is described as its capacity to remain unaffected by minor and deliberate modifications to method parameters.” The robustness study has considered the impact of buffer pH, mobile phase composition, injection volume, flow rate, analyst, and column oven temperature. GL injections were tested using the established HPLC method using three injections at 60 μg/mL concentrations for each operating condition. The method's robustness was then determined by calculating the percentage coefficient of variance.
Statistical Analysis
“The data were statistically analyzed using GraphPad Prism version 9.” The variance in the groups was compared using a one-way ANOVA. Statistics were deemed significant at p = 0.05. Data are the mean SD, with n = 3 or n = 6.
RESULTS AND DISCUSSION
Optimization of RP-HPLC Method
Response surface methodology model was created for statistical optimization of the RP-HPLC method for GL nanoformulation. The software was used to create polynomial equations, contour plots, and 3D response surface plots and perform a multilevel regression analysis to examine the interactions between CMAs and critical quality attributes (CQAs). The results were between 6.32 and 7.99 in retention time, 33,580 and 34,954 in theoretical plates, and 1.03 and 1.1 in tailing factors. The maximum wavelength for GL was observed at 249 nm from the UV-visible spectrophotometer analysis. Table 2 displays the response data for all experimental runs from various created batches.
Response Values of Experimental Runs
Analysis of Interaction Effect of CMAs on Individual CQAs
Interaction effect on retention time
For response Y1, or the retention time, the model produced the following polynomial equation [Eq. (1)]. Factor coefficients could be utilized to determine each response's primary and secondary effects. Using an equation expressed in terms of coded factors, predicting the reaction for specific levels of each element is possible. The high levels of factors are coded as +1, and their low levels are coded as −1 by default. The relative importance of the elements can be determined by comparing the factor coefficients in the coded equation.
The equation showed that pH (X2) and flowrate (X3) have a favorable impact on retention time, and the composition of acetonitrile (X1) has a negative impact on it. As a result, it can be inferred that increasing the flow rate and pH from low to intermediate levels increases the retention time, whereas decreasing the composition of acetonitrile from the optimum level causes an increase in retention time, as shown by the contour curve and 3D response surface plot (Fig. 2).

QbD-based model graphs for retention time and tailing factor.
Interaction effect on theoretical plates
Figure 3, a representation of a 2D and 3D response surface plot, showed a positive association with a maximum magnitude between the theoretical plates and pH. The equation showed that the pH (X2) and flow rate (X3) have a positive impact on the theoretical plates, whereas the acetonitrile composition (X1) has a negative impact. Similarly, it was found that the interaction between X1X3 and X2X3 was synergistic, while X1X3 had a detrimental effect on theoretical plates.
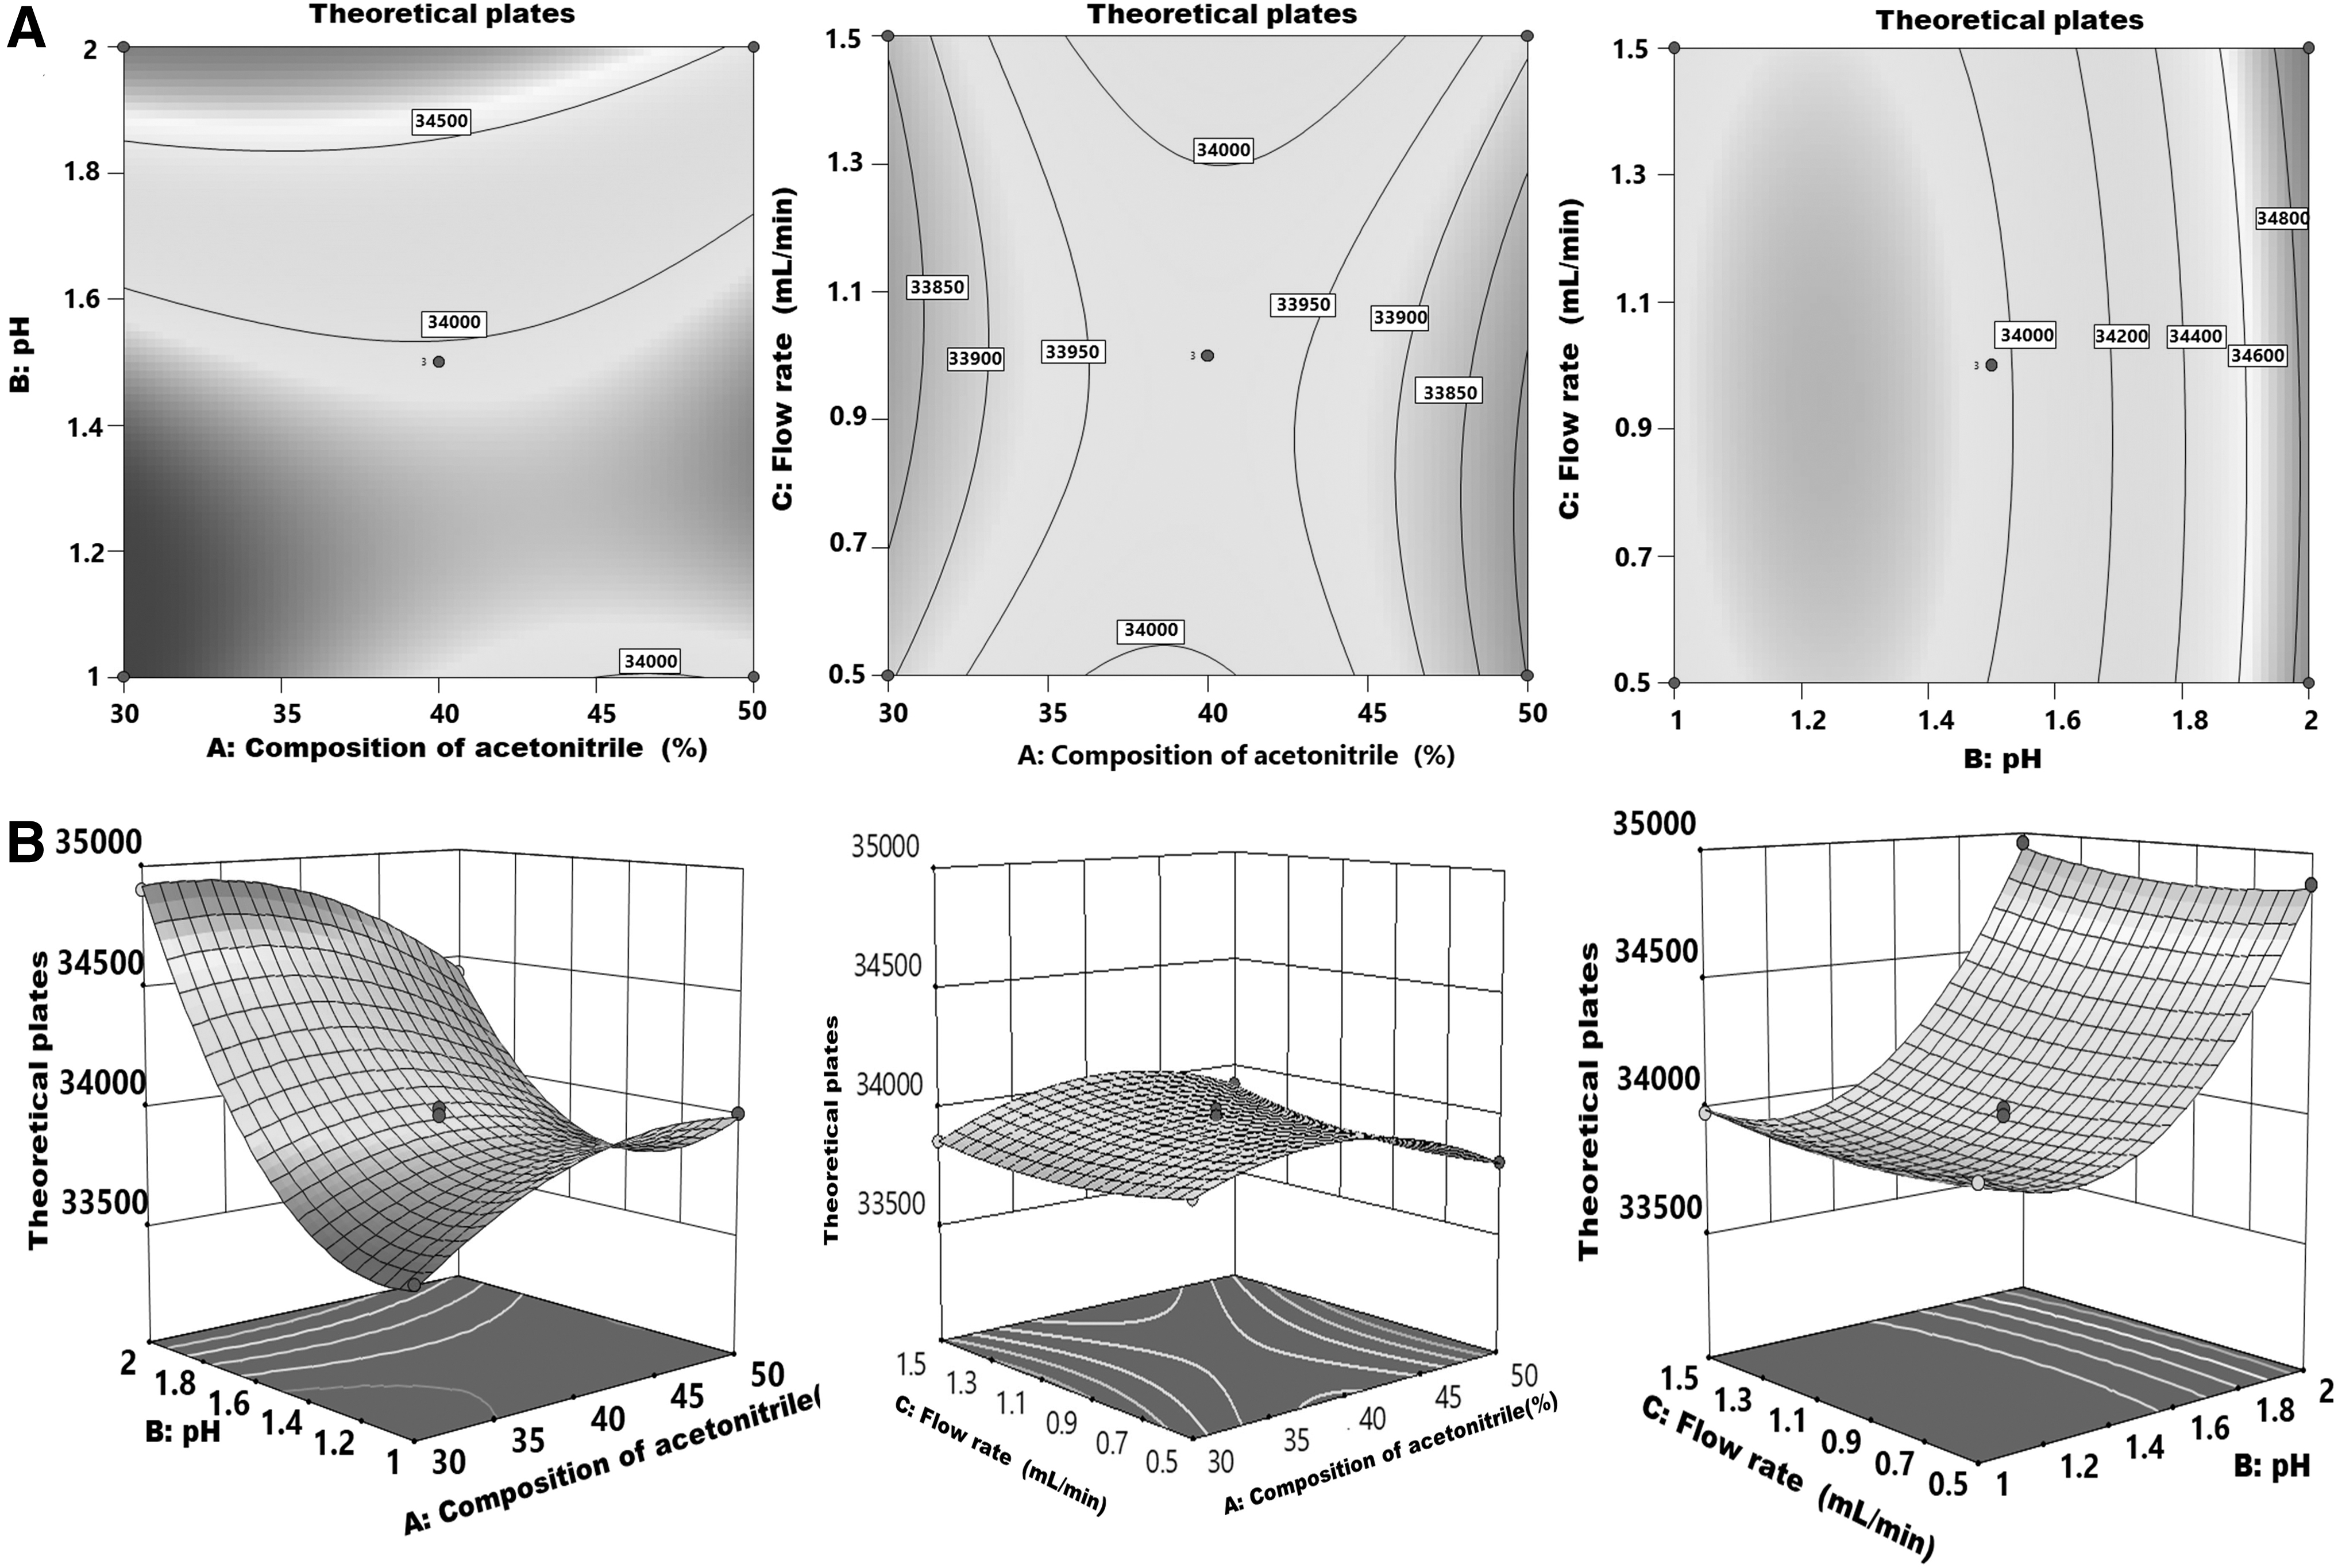
QbD-based model graphs for theoretical plates.
Here, increasing pH and flow rate increases the theoretical plates. It was discovered that every variable had an enormous quadratic impact on theoretical plates, as represented through the contour plot and 3D response surface curve (Fig. 3A, B).
Interaction effect on tailing factors
The probable effects of altering independent variables on the extent of tailing factors are portrayed by the 2D plots and 3D plots (Fig. 2C, D). The actual equation [Eq. (3)] represents the Interaction effect on tailing factors.
The equation showed that the pH (X2) and flow rate (X3) have a positive impact on the Interaction effect on tailing factors, whereas the acetonitrile composition (X1) has a negative impact. A decrease in acetonitrile composition increases the tailing factors, whereas increases in pH and flow rate increase the tailing factors. Since, it was discovered that every variable had an enormous linear impact on tailing factors. Design-Expert software's postanalysis point prediction capability was used in conjunction with the maximum desirability technique to find the optimal RP-HPLC conditions for the estimation of GL from nanoformulations. In the process of numerical optimization depicted in Figure 4, the BBD initially generated 100 solutions to determine optimized chromatographic conditions. However, establishing specific goals or criteria subsequently reduced the number of solutions. Constraints, retention time, theoretical plates, and tailing factor in the range were defined as the intended target/goals for essential chromatographic conditions.

Numerical optimization for chromatographic conditions.
For the purpose of optimizing the chromatographic conditions, several constraints for factors and responses were specified. With optimized chromatographic conditions, such as the composition of acetonitrile (X1) = 41%, pH (X2) = 1.8, and flow rate (X3) = 1 mL/Min, with maximum desirability value of 1.00, respectively, the chromatogram of GL was shown in Figure 5. The experimental values of the checkpoint batch and the software-predicted response values were compared. The model was also validated by ANOVA using Design Expert Software (Table 3). In postanalysis point prediction, the observed and predicted retention time were determined to be 7.25 and 7.24, respectively, while expected and measured theoretical plates and tailing factors were found to be 33,939, 33,979, 1.06, and 1.07, respectively, with 95% confidence levels.
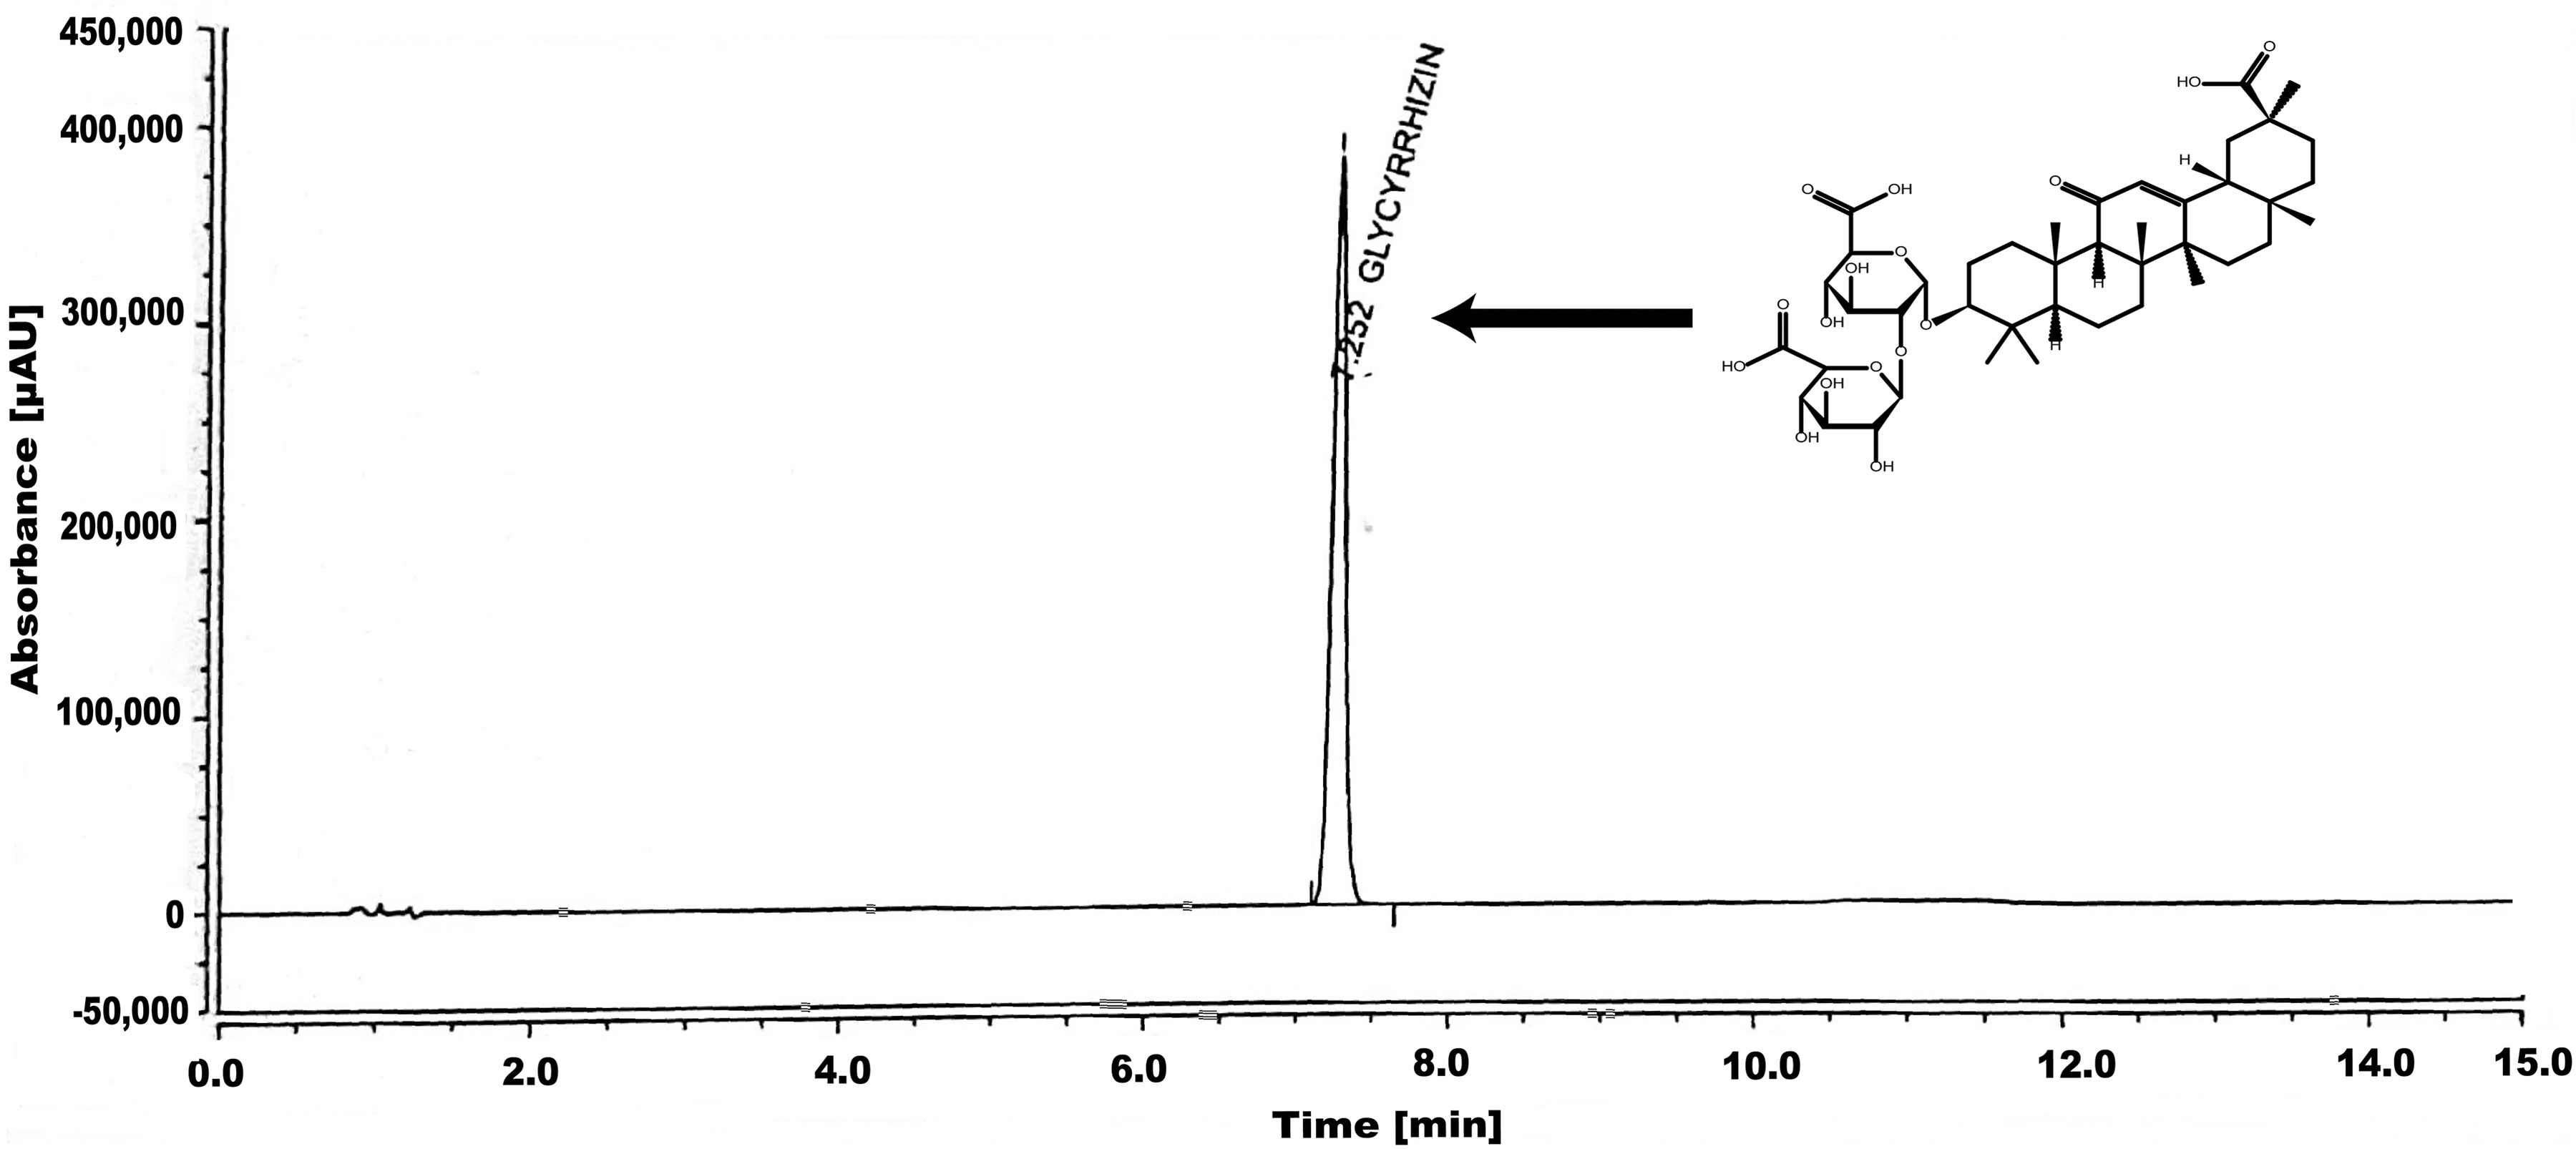
Chromatogram of GL in optimized chromatographic condition.
Analysis of Variance Results Analyzed by Design Expert Software
% CV, percentage coefficient of variations.
The prediction error was within the acceptable range, demonstrating the used design's good predictive capacity and validity. As a result, the used design for statistical optimization of chromatographic conditions was determined to be valid and accurate.
Validation of the Method
The HPLC method developed for analyzing GL in nanoformulations underwent validation in accordance with the guidelines provided by ICH Q2 (R1). 37
System suitability
At the beginning of the sample analysis, system suitability tests are recommended to evaluate the chromatographic system. Six samples of GL at a concentration of 60 μg/mL were analyzed while estimating the system suitability. A newly developed HPLC method was used to evaluate the concentration of GL. The system suitability of this method was determined by calculating the % CV for the peak area, tailing factor, and the number of theoretical plates. Table 4 presents the findings of this study.
System Suitability of High-Performance Liquid Chromatography Method Developed for Glycyrrhizin Estimation
Data presented as average ± SD, n = 6.
Selectivity
The GL in prepared nanofiber was estimated using the recommended RP-HPLC method. Figure 6 displays the typical chromatograms of the mobile phase and GL solution (60 μg/mL). It was discovered that GL had a retention time of 7.25 min.

Chromatogram of blank and GL in prepared nanoformulation. Standard curve of GL in optimized chromatographic conditions.
Linearity
The standard curve of GL was prepared at λmax 249 nm using HPLC, and regression (r 2 ) was found to be 0.998. Linearity was found to be in the concentration range of 80 to 120%, where the 100% concentration level was 60 μg/mL. Figure 6, represents the standard curve obtained using optimized chromatographic conditions and the regression equation was y = 48,801x − 606,054.
Accuracy
The percentage of drug recovery was found to be 97.1% ± 0.15%, 98.4% ± 0.01%, and 96.4% ± 0.009%, respectively, at 80%, 100%, and 120% concentration levels. The accuracy results of the nanoformulations showed minor variations when compared to the standard. These deviations could be attributed to the specific chemicals and solvents used to prepare the nanofibers. Then, the % RSD estimates were found to comply with the range 0.16, 0.11, and 0.10, respectively, and meet the examination's acceptance requirements.
Precision
“According to ICH recommendations, the concentration of GL was established utilizing assay at different times on the same day and by alteration for three consecutive days (intraday and interday precision) to evaluate the method's precision.” Table 5 provides a summary of the precision study's findings. Six replicates of GL solution with a concentration of 60 μg/mL were used to measure the precision between and within days. It was found that the % RSD for intraday and interday precision ranged from 0.6% to 0.98% (less than 1%), reflecting the accuracy of the suggested method.
Precision of Glycyrrhizin by Optimized Reverse-Phase High-Performance Liquid Chromatography Method
Data presented as average ± SD, n = 6.
RSD, relative standard deviation.
Robustness
The developed HPLC method's robustness was evaluated using a few minor modifications to the operational circumstances. Data on the suggested approach's adaptability are shown in Table 6 as a percentage coefficient of variation, and it is observed that this value is less than 1%, further demonstrating the robustness of the method. This showed that the investigated independent variables did not affect the outcomes because each factor's influence was based on its maximum effect, and none of the factors exceeded this limit. In addition, it was discovered that the established approach was precise because, at a GL retention time, the excipients exhibited no interference at all.
Robustness of the Developed Reverse-Phase High-Performance Liquid Chromatography Method for Glycyrrhizin Determination
Data presented as average ± SD, n = 3.
Analysis of in-house nanoformulation and comparison with the reported method
The RP-HPLC technique was applied to determine the amount of GL in the in-house prepared nanoformulation. The drug assay for the nanoformulation yielded a result of 98.5% ± 0.41%. This suggests that the developed method is highly accurate and precise for analyzing GL in nanoformulation. In the future, the proposed RP-HPLC method holds promise for regular use in GL analysis. The assay percentage of GL in nanoformulations generated with the suggested approach and the reported RP-HPLC method was compared with De et al. 18 Based on the assay results, the suggested approach can be compared to the current reported method. The summarized details of the method can be found in Table 7.
Summary of the Proposed Reverse-Phase High-Performance Liquid Chromatography Method's Regression, Validation, and In-House Nanoformulation Assay Parameters and Comparison of the Proposed Method with the Reported Method 18
Data presented as average ± SD, n = 3 or n = 6.
CONCLUSION
This research aimed to develop a sensitive, accurate, and precise method for quantifying GL in nanoformulations (nanofiber). The team utilized Box-Behnken principles to create an RP-HPLC method for estimating GL in bulk and in-house nanoformulations. The BBD allowed simultaneous evaluation of independent factors and their interactions to optimize experimental conditions through the DOE approach. Based on the response surface plots, it was observed that the composition of acetonitrile and the flow rate had the most significant impact on retention time. The 3D response surface graphs indicated that the pH of the aqueous phase greatly influenced the responses. The validation study confirmed that the optimized chromatographic conditions of the proposed method ensured accuracy, precision, ruggedness, and robustness. In conclusion, the proposed HPLC method holds great potential for researchers as a reliable tool for routine analysis of GL in nanoformulations.
Footnotes
ACKNOWLEDGMENTS
We want to express our gratitude to the management of Siksha ‘O’ Anusandhan (Deemed to be University), Bhubaneswar, India, for providing the necessary infrastructure and facilities that enabled us to complete this work.
AUTHORs' CONTRIBUTIONS
Conceptualization: G.R.; data curation: J.H. and I.S.; formal analysis: T.K.R.; investigation: G.G.; methodology: J.H.; software: J.H.; supervision: G.R.; validation: G.R.; visualization: B.K.; writing of original draft: J.H.; review and editing: I.S. and T.K.R.
DISCLOSURE STATEMENT
No competing financial interests exist.
FUNDING INFORMATION
This work was supported by the Science and Engineering Research Board, department of Science and Technology [CRG/2021/005540], New Delhi, India.