
Abstract
The aim of this study was to determine the patterns of change in body fat and metabolic parameters in a South African cohort on a first line ART regimen containing stavudine. Fasting lipogram, blood glucose and insulin levels, CD4 cell count, viral load, BMI, waist-to-hip ratio (WHR), and skinfold thickness at the triceps, scapula, and iliac crest were measured before starting ART in 42 (27 female) subjects. Repeat measurements were performed at four monthly intervals for 2 years. Lipodystrophy was diagnosed using patient perception and assessment by a physician. At baseline, subjects who went on to develop lipodystrophy (LD group) were fatter and had higher skinfold thickness at all three sites and higher insulin levels than subjects who never developed lipodystrophy (NLD group). The WHR increased to a greater extent while hip circumference and tricep skinfolds fell more significantly in the LD than NLD group. Triglyceride and cholesterol levels increased significantly in both groups while lactate and glucose levels increased more and insulin levels increased less in the LD than the NLD group. Neither viral load nor CD4 count differed between the groups during the study. Viral load correlated positively with insulin levels at baseline. Thus, lipodystrophy in the South African population is characterized by a higher BMI before initiation of ART and lipoatrophy of the arms and hips, lipohypertrophy of the waist, and increased lactate production. When compared to the NLD group, the LD subjects display attenuated insulin secretory output in response to a higher weight gain.
Introduction
M
Materials and Methods
Subjects
Fifty HIV-infected participants referred to the clinic for ART were recruited by convenience sampling from April 2004 to December 2005 and followed up at four monthly intervals for 24 months. Participants were eligible for this study if they intended to begin ART, were ART naive, between the ages of 18 and 55 years, and were not pregnant at the time of enrollment. The criteria for initiating ART was a CD4 count of less than 250 or the presence of an AIDS-defining illness. The human Ethics Committee of the University of the Witwatersrand approved the study with written informed consent obtained at enrollment.
Body composition
All participants had weight, height, and waist and hip circumference recorded, with subsequent calculation of body mass index (BMI; kg/m2) and waist-to-hip ratio. The participants were identified as having “lipodystrophy” in this study if the patient and the health care worker both identified noticeable lipoatrophy or lipohypertophy at more than one of the following body sites: face, dorsocervical region, breasts, arms, abdomen, buttocks, and legs. 11 Specifically, the patients were asked if they had noticed thinning of the face, arms, buttocks, hips, and legs. They were also asked if they had noted any increase in fat deposition, particularly over the abdomen, breasts, or on the back. These changes must have occurred after initiation of ART. The patients were seen by the same physician (J.G.) at every visit.
Body composition was assessed at baseline and at four-monthly visits using standardized procedures by the same two trained nurses. Subjects were weighed after removing shoes and outdoor clothing. Waist circumference was measured at the narrowest part of the torso between the lower rib and the iliac crest, and hip circumference at the level of greatest gluteal protuberance. Skin fold thicknesses were assessed from the mean of two repeated skinfold thickness measurements made at three sites: the triceps, subscapular area, and over the abdomen as previously described. 12
Metabolic measurements
Blood was collected after an overnight fast for glucose, lactate, lipids (Roche Modular analyser, Roche Diagnostics, Mannheim, Germany), and insulin measurements (Immulite 1000 analyzer Diagnostics Corp., Los Angeles, CA). Low-density lipoprotein (LDL)-cholesterol levels were calculated using the Friedewald formula 13 and insulin resistance assessed using the homeostasis model assessment (HOMA) method. 14 Other measurements taken were CD4 counts (Beckman Coulter flow cytometry, Miami, FL) and viral load (Roche Cobas Amplicor, Indianapollis, IN). Venous blood samples were collected with the use of a tourniquet and samples were centrifuged and assayed immediately. All metabolic and immunological measurements were repeated every 4 months. Impaired fasting glucose (≥5.6 mmol/liter), hypercholesterolemia (≥5.0 mmol/liter), hypertriglyceridemia (≥1.7 mmol/liter), hyper-LDL-cholesterolemia (≥3.0 mmol/liter), and hypo-HDL-cholesterolemia (<1.0 mmol/liter in males and <1.3 mmol/liter in females) were defined using the guidelines from the National Cholesterol Education Programme, Adult Treatment Panel III (NCEP-ATPIII). 15
Statistical analysis
Data that were not normally distributed were log transformed to normality. Metabolic and anthropometric variables at different time points were compared using the Student's paired t-test or the Wilcoxon matched pairs test. Differences between the lipodystrophic and nonlipodystrophic groups were compared using the Student's nonpaired t-test or the Mann–Whitney U test. The prevalence of dyslipidemia or impaired fasting glucose (IFG) was compared between groups using the chi-squared test.
The principal determinants of fasting insulin and lipid levels prior to commencement of ART were investigated using univariate (Pearson correlation) analysis. The variables studied for correlation with insulin levels were gender, BMI, weight, waist and hip circumference, waist-to-hip ratio (WHR) and tricep, scapular, and iliac crest skinfolds, viral load, and glucose levels. The same variables with the addition of insulin and HOMA were investigated for their correlation with lipid levels. The variables that gave significant correlations in the univariate analysis were then included as independent variables in stepwise, backward multiple regression analysis. Data are expressed in the tables and figures as mean ± SD or median (interquartile range).
Statistical analyses were performed using the software package Statistica version 7.1 (StatSoft, Tulsa, OK).
Results
Patient characteristics
Study entry characteristics are summarized in Table 1. Fifty patients were recruited into the study of which 42 completed 24 months of follow-up and eight did not complete the study for the following reasons: two moved away from the locality, one became pregnant, two died, and three withdrew from the study. These events occurred early in the study and therefore data collected for these participants were not included in the analyses. All participants were started on the standard first line antiretroviral therapy of d4T, 3TC, and EFV. d4T was dosed according to body weight: 16 patients were on 30 mg twice daily because their weight was below 60 kg and 26 patients were on 40 mg twice daily for weights above 60 kg. No differences were observed for changes in metabolic or anthropometric variables over the course of the study when the 30-mg and 40-mg d4T dose groups were compared.
Data expressed as mean ± SD or median (interquartile range).
Data are reported only from those 42 patients who completed the study. All patients were black African, and 65% were female. Median CD4 counts and viral loads were 93 cells/mm3 (range: 6.0–315.0) and 248,000 HIV RNA copies/ml (range: 6800–1,400,000), respectively, at initiation of ART and changed to 312 (range: 114–745; p < 0.0005) and 0.0 (range: 0.0–15,000), respectively, after 2 years of therapy. At baseline the 42 participants who completed the study had a mean age of 34.4 years (range: 23–51 years) and a BMI of 22.7 (range: 20.5–41.1).
Only 16 subjects remained on the original ART regimen after 2 years. d4T-associated toxicity accounted for most drug changes (2 for peripheral neuropathy, 4 for lactic acidemia, and 18 for lipoatrophy). Two participants changed therapy due to the development of resistance to EFV. The overall prevalence of lipodystrophy was 42.9% (18 of 42 subjects) after 2 years of treatment. Median time to diagnosis of lipodystrophy was 78 weeks (range: 53–82 weeks); of those who developed lipodystrophy a mixed pattern was reported in the majority (n = 14); two subjects each displayed either lipoatrophy alone or lipohypertrophy alone. The prevalence of lipodystrophy was higher in females (57.1%) than males (12.5%; p < 0.05). At the time of diagnosis of lipodystrophy patients had d4T replaced with AZT and at the end of the study period these subject had received AZT for a median period of 36 weeks (range: 14–77 weeks).
Baseline anthropometric and metabolic parameters that predicted lipodystrophy
Subjects who developed lipodystrophy tended to have a greater BMI prior to initiation of therapy (p < 0.05; Table 2) and greater skinfold thickness at the triceps (p < 0.05), scapular (p < 0.005), and the iliac crest (p < 0.0005) prior to commencing therapy than those who never developed lipodystrophy (Table 2).
Data expressed as median (interquartile range); * p < 0.05, ** p < 0.005, *** p < 0.0005 vs. the LD group at the same time point.
Insulin levels were higher at baseline in subjects who later developed lipodystrophy (p < 0.05; Table 2), but there was no difference in insulin resistance as determined by HOMA.
Principal determinants of insulin and lipid levels prior to commencement of ART
Fasting insulin at baseline correlated significantly (p < 0.05) with mass, hip circumference, scapular and iliac crest skinfold thickness, and viral load in univariate analyses. When these factors were included as independent variables in a stepwise, backward regression model only iliac crest skinfold measures (beta = 0.53, p < 0.0005) and viral load (beta = 0.44, p < 0.005) demonstrated statistically significant relationships with insulin. The r-value for this model was 0.63 (p < 0.0001). Viral load explained 18% of the variance in insulin levels. A similar analysis showed that HOMA also correlated with viral load (beta = 0.40, p < 0.05) and iliac crest skinfold measures (beta = 0.36, p < 0.05) in a multiple regression model (r = 0.48, p < 0.01).
Significant, negative correlations were observed for fasting LDL cholesterol with insulin, HOMA, and viral load in univariate analyses. Due to collinearity HOMA and insulin could not be included together in a multiple regression model and therefore were analyzed with viral load in two separate models. In both models only viral load correlated significantly with LDL cholesterol (beta = –0.40, p < 0.05 in both models) explaining 19% of the variance in LDL concentrations.
Fasting triglyceride levels demonstrated weak positive correlations in univariate analyses with age (p = 0.07), viral load (p = 0.07), and HOMA (p = 0.09). When these variables were included in a multiple regression model, viral load was found not to be a significant determinant of triglyceride levels (beta = 0.16, p = 0.30), but age (beta = 0.39, p < 0.05) and HOMA (beta = 0.37, p < 0.05) were. The r-value for this model was 0.53 (p < 0.05).
Changes in anthropometry during ART
Subjects who developed lipodystrophy had a significantly higher BMI at 59 weeks when compared to the no lipodystrophy (NLD) group (p < 0.05; see Table 2), and the mean percentage change in mass from the baseline level was greater in the LD subjects (Fig. 1A). All patients showed a significant increase in waist circumference at the end of the study (p < 0.001 for baseline versus week 111 for the NLD and p < 0.005 for the LD group); however, the percentage increase above baseline values was greater in LD than NLD subjects, although this trend did not reach statistical significance (Fig. 1B). Percentage change from baseline values for hip circumference was negative in the LD group and significantly different from that for NLD subjects at 59, 77, 94, and 111 weeks (Fig. 1C). By week 111 patients who developed lipodystrophy had significantly increased in WHR from baseline values compared to the NLD subjects (p < 0.005; see Table 2).

Percentage change from baseline values for weight (
Subjects who developed lipodystrophy experienced a greater increase in triceps skinfold thickness at 41 weeks than did the NLD group, after which triceps skinfold fell markedly (Fig. 1D). Skinfold thickness of the scapular and iliac crest showed a steady increase in both groups but remained significantly higher at 59 and 111 weeks in the LD group (Table 2; p < 0.05 for all)
Metabolic and immunologic changes with therapy
All subjects showed a steady increase in triglycerides, total cholesterol, and HDL and LDL cholesterol over the course of the study with no significant differences noted between subjects who did or did not develop lipodystrophy. There was a marked increase in the percentage of participants who developed abnormal lipid profiles based on NCEP-ATPIII guidelines by the end of the study period (see Table 3). Despite this only one study subject met the NCEP-ATPIII criteria for the initiation of lipid-lowering therapy by the end of the study, with no subjects meeting these criteria at the start of the study.
Data expressed as mean ± SD or median (interquartile range) or percentage; * p < 0.05, ** p < 0.005, *** p < 0.0005 vs. baseline. NCEP III, National Cholesterol Education Programme, Adult Treatment Panel III.
The HOMA level did not increase significantly between baseline and week 111 in the LD subjects (p = 0.62) but in the NLD group there was an increase in HOMA that just failed to reach statistical significance (p = 0.076; Table 2). In the LD group insulin did not increase from baseline levels as significantly as for the NLD subjects (Fig. 2A), with fasting insulin being significantly higher at the end of the study compared to baseline in NLD (p < 0.05) but not LD subjects (p = 0.40; Table 2).
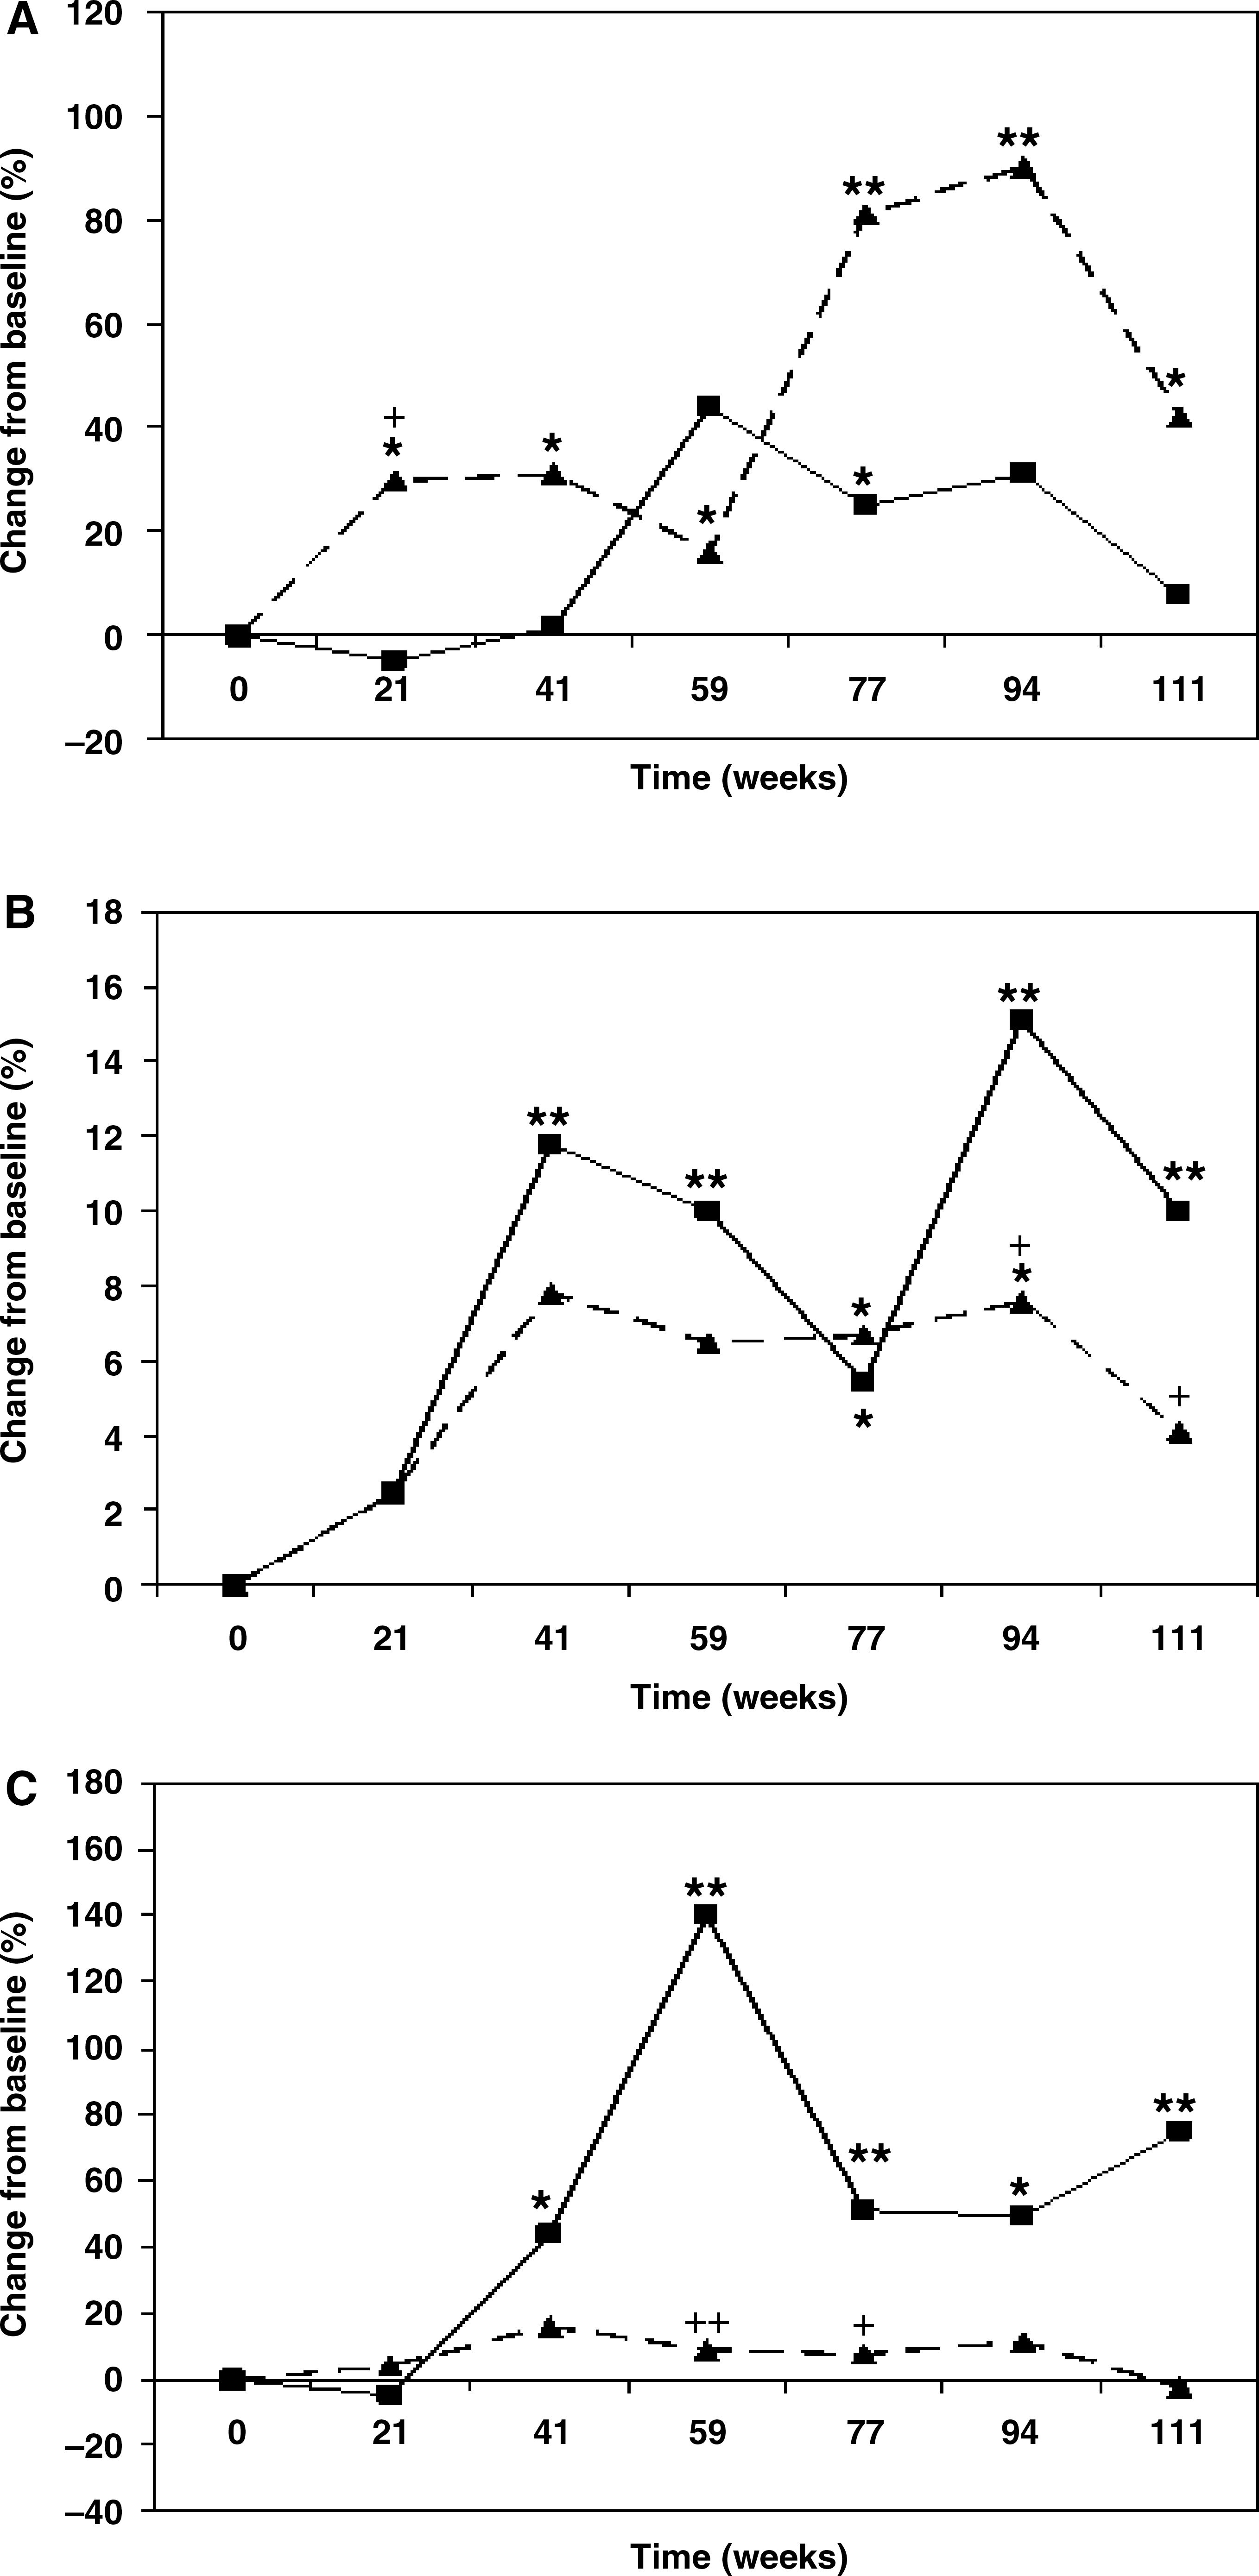
Percentage change from baseline values for insulin (
A steady rise in glucose was observed in all subjects with marked differences from baseline values noted at 111 weeks of therapy (Table 3). Although there were no differences in absolute glucose between LD or NLD subjects (Table 2), those patients who developed lipodystrophy experienced a greater percentage increase in plasma glucose at weeks 94 and 111 than the NLD patients (p < 0.05 for both; Fig. 2B) and fasting glucose levels at the end of the study were significantly higher than the baseline levels for LD (p < 0.005) but not NLD (p = 0.60) subjects. The prevalence of impaired fasting glucose was 2.40% at the start of the study and this did not change significantly by the end of the study (Table 3).
Plasma lactate increased in all patients. After 59 weeks of therapy both absolute lactate levels (p < 0.005; Table 2) and percentage change in levels from baseline (p < 0.005; Fig. 2C) were significantly higher in the LD than NLD subjects. After 111 weeks there was no difference in mean lactate between these two groups (see Table 2 and Fig. 2C) because lactate dropped when therapy in the LD patients was changed from d4T to AZT.
No differences in viral load or CD4 cell counts were observed between the LD and NLD subjects at baseline or after 2 years of therapy (data not shown).
Effects of replacing d4T with AZT in subjects with lipodystrophy
All subjects who developed lipodystrophy were transferred from d4T to AZT therapy. Table 4 shows anthropometric and metabolic variables measured at initiation of ART at time of replacement of d4T with AZT and at the end of the study period. It can be seen that during d4T therapy, BMI and waist both increased significantly (p < 0.05 and p < 0.005, respectively) while tricep skinfold thickness fell (p = 0.07). During the time of AZT therapy BMI and waist tended to fall, but both remained significantly higher than at baseline. Tricep skinfold thickness rose slightly over this time period but remained significantly lower than the baseline value. Glucose, lactate, total cholesterol, and triglyceride blood levels all rose significantly with d4T therapy. Glucose levels remained static with AZT therapy while triglyceride levels rose slightly and both remained significantly higher than baseline levels. Lactate and total cholesterol levels fell with AZT therapy, the latter significantly (p < 0.05), but both remained at levels significantly higher than at baseline.
Data expressed as mean ± SD or median (interquartile range); * p < 0.05, ** p < 0.005, *** p < 0.0005 vs. baseline; † p < 0.05 vs. visit at which d4T was replaced with AZT.
Increases in viral load during ART
In 11 subjects (4 from 18 with lipodystrophy and 7 from 24 without lipodystrophy) viral loads increased from undetectable levels during the course of ART. These rises in viral load could be explained in seven of the patients: four (one subject with lipodystrophy) were due to nonadherence to therapy and three (two with lipodystrophy) were due to temporary removal from ART due to lactic acidosis. Therefore, in four subjects (one with lipodystrophy) the rise in viral load could not be explained. If these are assumed to be due to noncompliance then the total prevalence for noncompliance to ART would be 11.1% (2 of 18) in those with lipodystrophy and 25.0% (6 of 24) in subjects without lipodystrophy (p = 0.26).
Discussion
This study is very relevant because within developing countries the most common first-line ARV regimens for treating HIV infection make use of d4T. 9,10 A number of studies performed in the developed world have shown that the use of d4T leads to detrimental metabolic and morphologic side effects. 11,16 –18 However, despite the prevalent use of d4T in African countries, no longitudinal studies have been performed to monitor the development of such side effects in these population groups. One large study has been performed within a Rwandan population, but this was a cross-sectional analysis. 19
We have demonstrated a high prevalence of lipodystrophy among subjects taking a widely used ART regimen in a black South African population, with several baseline clinical and metabolic factors predicting the development of this syndrome. Subjects who developed lipodystrophy had greater adiposity before receiving ART than subjects who did not. It is possible that lipoatrophy is easier to identify in such subjects; however, there was considerable overlap in BMI and hip and skinfold measurements between the LD and NLD groups and the NLD group displayed small reductions in hip circumference and triceps skinfolds compared to the LD group.
The prevalence of lipodystrophy in our study is similar to that in studies from developed countries 11,20,21 and from a large African study. 19 We described a mixed pattern of lipoatrophy and lipohypertrophy as the most common feature of lipodystrophy, which is similar to the findings from a large Rwandan cohort 19 and agrees with data generated from many studies of lipodystrophy in European and American populations. 2,3 However, it must be noted that studies have reported that lipohypertrophy is not a feature of ART-associated lipodystrophy when HIV-positive subjects are compared with a control group of HIV-negative subjects. 22,23 However, both these studies included patients using a variety of different ART regimens and the control populations had higher body weights than the HIV-positive subjects. 22,23 Furthermore, in females HAART was actually associated with greater visceral fat mass. 23
The most notable feature of lipodystrophy in the current study was the fall in body mass, hip circumference, and triceps skinfold after an initial rise in all three measurements. Waist circumference also tended to rise more dramatically in the LD subjects and WHR was therefore higher in those with lipodystrophy after 111 weeks on ART. Thus, this study supports the many previous investigations demonstrating that lipoatrophy is the prime feature of the lipodystrophic syndrome in patients receiving ART. 2
All subjects developed significant increases in serum lipid levels confirming data from other studies. 19,21,24 Although some studies have shown that ART is associated with decreased glucose tolerance, 19,25 the prevalence of impaired fasting glucose did not increase in this study. However, both fasting glucose and insulin were significantly higher by week 111 compared to baseline measurements for the total study cohort. On further analysis it was observed that the LD group showed significant increases in fasting glucose but not fasting insulin from baseline to week 111, whereas the reverse was observed for the NLD subjects. This trend was observed throughout the study period with the percentage change from baseline values for insulin being greater in the NLD than the LD group at all but one time point, whereas the percentage change for glucose was higher in the LD than the NLD group at most time points. Furthermore, BMI, weight, and waist measurements all rose more significantly in LD than NLD subjects. These data suggest that in LD subjects, fasting insulin secretion does not rise sufficiently to compensate for the rise in insulin resistance produced by increased abdominal fat deposition; this leads to poorer glucose tolerance compared to NLD subjects. The reason for the lower increase in fasting insulin levels from baseline in the LD group is not known. However, it is noteworthy that before ART commenced the LD group had higher BMIs and had higher fasting insulin than the NLD subjects. It is therefore possible that the LD subjects, even before ART was initiated, have experienced a period of high beta cell insulin secretory output and that the added burden of increased fat deposition after the commencement of ART has reduced beta cell insulin secretory capacity. The use of NRTIs, particularly d4T treatment, has been shown to increase fasting insulin levels in a longitudinal study 18 and thus d4T in the present study may also contribute to increased insulin secretory demands. Only fasting insulin levels were measured in the current study and therefore we are not able to comment on the effect of body fat changes or ART on insulin secretory responsiveness.
The description of greater adiposity in LD compared to NLD subjects prior to commencement of ART is a novel finding and suggests that fat levels influence the development of the syndrome. The molecular mechanism underlying this relationship is not known; however, it does demonstrate that adipose tissue is a key target organ in ART-associated lipodystrophy. The present study also demonstrated that in comparison to the NLD group the LD subjects tended to accumulate more adipose tissue immediately after initiation of ART at anatomical sites at which lipoatrophy subsequently occurred. Thus, lipoatrophy seems to be preceded by relative lipohypertrophy. These data are intriguing since in vitro data show that NRTIs can block adipogenesis. 26 Therefore, lipohypertrophy in the presence of NRTI therapy must be a consequence of adipocyte hypertrophy rather than adipocyte hyperplasia. This suggests that lipoatrophy is a result of the inability of adipose tissue depots to replace fully matured adipocytes undergoing apoptosis with new adipocytes recruited from the preadipocyte population. The reason for the early increased fat deposition observed in LD subjects is not known but may be a consequence of their higher insulin levels or a genetic predisposition to obesity. The reason why lipoatrophy does not occur at the abdominal fat depot is unclear. Visceral adipocytes are metabolically distinct from subcutaneous adipocytes 27 and this metabolic difference may also extend to the sensitivity of visceral adipocytes to the inhibitory activity of NRTI drugs on adipogenesis. Studies have also shown that hyperplasia is more prominent in subcutaneous than visceral fat depots 28,29 suggesting that inhibition of adipogenesis may have a greater effect on lipid accumulation in subcutaneous adipose tissue.
Lipodystrophy was associated with a dramatic rise in fasting lactate levels up to 59 weeks of therapy. A previous investigation has also shown that lipodystrophy is a risk factor for hyperlactatemia 30 and a number of studies have demonstrated that d4T use is strongly related to elevated lactate levels 30,31 and that discontinuation of d4T leads to a fall in serum lactate concentrations. 31 The association between hyperlactatemia and lipodystrophy observed in this study further supports the hypothesis that the adverse effects of NRTI therapy are due to mitochondrial toxicity. 32
The replacement of d4T with AZT in the subjects who developed lipodystrophy led to slight improvements in the body fat changes observed after initiation of ART (see Fig. 1 and Table 4). The AZT therapy was monitored for only a median time period of 36 weeks and therefore it is possible that greater improvements may have been observed over a longer period of observation. Previous studies have shown that replacing d4T with AZT does lead to a reversal of lipoatrophy. 33,34 Metabolic variables also improved after AZT therapy was initiated, most particularly lactate and cholesterol levels (see Table 4). This is in agreement with data showing that lactic acidosis does not reoccur after replacing d4T with AZT. 35,36
The lipodystrophy and changes in metabolic variables observed in the present study seem to be the result of ART, as also described in many previous studies. 11,16 –19,21,24,25 Stavudine is well known to have effects on body fat distribution and metabolic profiles 11,16 –18 ; however, EFV has also been shown to cause lipoatrophy 37 and lead to increases in lipid levels. 38 It is therefore possible that the metabolic and anthropometric changes observed in the present study may be due to the combined effects of d4T and EFV.
The positive relationship observed between viral load and HOMA levels in the current study is a novel finding. It is well recognized that insulin resistance and hyperglycemia are features of infection. 39 Furthermore, an earlier investigation, although not observing any correlation between insulin resistance and viral load, did report a negative relationship between CD4 counts and insulin resistance in a large group of ART-naive patients. 40 However, it must also be noted that two previous studies conducted on a small number of ART-naive HIV-infected subjects observed improved insulin sensitivity in the HIV-positive compared to the healthy, control group. 41,42 The data from the current study therefore suggest that the hyperinsulinemia observed in subjects receiving ART may not be a consequence of the therapy alone but may also involve the virus itself.
The negative relationship between LDL cholesterol and viral load observed in this study has also been demonstrated in previous studies 40,43 as has the positive correlation of viral load with triglyceride concentrations. 40 However, a unique observation has been that the relationship between triglyceride levels and viral load is a consequence of insulin resistance and is therefore not a direct effect of the virus on triglyceride metabolism.
There was no formal assessment of adherence to ART in the current study. All subjects were questioned about adherence at each clinic visit and four did admit to short breaks in therapy, which were mirrored by a rise and fall in viral loads. Unexplained rises and falls in viral load were observed in a further four subjects and this was used as a proxy indicator of noncompliance. Thus, 25% of subjects without and 11.1% of subjects with lipodystrophy were ART noncompliant. A previous study has shown that lipodystrophy is associated with greater adherence to ART. 44
Limitations of this study include the small sample size. Despite this the study was sufficiently powered to demonstrate statistically significant differences in anthropometric and metabolic variables between LD and NLD subjects and to observe significant relationships of viral load with lipid and insulin levels. Furthermore many of the observations reported in the current study are supported by data from previous investigations. 1,5,21,24,30,31,40,41 The clinical stage of the disease was not recorded at baseline in the present study. This may be a limitation of the study because it has been shown that the prevalence of metabolic and anthropometric side effects to ART is high in subjects with late-stage HIV infection. 45 A further drawback of the current study was the method used for the diagnosis of lipodystrophy, which was based on self-reporting by the patient, and confirmation of body fat changes by the physician. This method, however, has been used in many previous studies 11,19,22,23,46,47 and is reported to be the best procedure to use if scanning techniques for quantifying body fat redistribution, such as DEXA, are not available. 48 Furthermore, the method used in the present study for diagnosing lipodystrophy is possibly superior to that used in other studies because all the patients were monitored and diagnosed by the same clinician, thus overcoming any problems of interobserver variability and unfamiliarity with the patient's previous body habitus.
A control group of HIV-negative subjects was not included in the present study and therefore we were unable to compare metabolic variables between such subjects and our HIV-positive patients. However, data from South Africa have demonstrated a less atherogenic fasting lipid profile in African than European or Indian population groups 49,50 and this mirrors the low prevalence of hypercholesterolemia and hypertriglyceridemia at baseline in our study. Furthermore, at baseline no subjects met the NCEP-ATPIII criteria for the initiation of lipid-lowering therapy 15 and at the end of the study period only one subject met these criteria. Investigations have also shown that in African subjects insulin resistance is higher than in European subjects but similar to Indian subjects, 51,52 while the prevalence of type 2 diabetes is higher in the Indian than African group with the lowest prevalence observed in the European population. 53
The longitudinal nature of the current study allowed changes in metabolic and anthropometric variables to be monitored for up to 2 years from the start of ART. This enabled us to demonstrate that subjects who went on to develop lipodystrophy had greater BMI and higher insulin levels at baseline than subjects who did not develop lipodystrophy and that with initiation of ART insulin levels increased from baseline levels less in the LD than the NLD group. Thus, LD is associated with beta cell insulin secretory dysfunction in combination with insulin resistance and this novel finding is supported by studies demonstrating reduced proinsulin-processing efficiency 54 and an attenuated insulin secretory response to insulin resistance 55 in subjects with ART-associated lipodystrophy. Furthermore, profound hyperlactatemia was noted in the LD group, a finding observed in only one previous study. 30
The majority of African ART roll out programs continue to use d4T, largely due to cost, availability, and ease of use. In South Africa, which has the largest ART program in the world, d4T is currently still the first-line therapy for the majority of patients. Lipodystrophy and metabolic dysfunction are common using this first-line regimen, 5,19 and it is therefore essential that guidelines for early detection of this highly stigmatizing condition is built into any ART program using d4T as first-line therapy. Nurse and lay-worker-driven ART programs are common in Africa and detection of lipodystrophy with rapid substitution of d4T should be the norm in this setting.
Footnotes
Acknowledgments
We thank the South African Department of Health staff and the clinic patients. The Carnegie foundation and the National Health Laboratory Service funded the study. Dr. Venter is supported by PEPFAR.
Disclosure Statement
No competing financial interests exist.