
Abstract
West African adults with warning signs of failure of antiretroviral treatment (ART) at 6 months were assessed for the probability and factors associated with success at 36 months. After 6 months on ART, patients were included if they had a bad immunologic response (BIR) (month 6 CD4 count < pre-ART CD4 count + 50/mm3), incomplete virologic suppression (IVS) (month 6 plasma HIV-1 RNA >300 copies/ml), or both (Dual). They were followed for 30 months after inclusion. CD4 counts and HIV-1 RNA were measured every 3 months. We estimated the probability of reaching immunovirologic success (CD4 count >350/mm3 and plasma HIV-1 RNA <300 copies/ml) and looked for determinants using Cox analysis. A total of 208 adults were included. Among patients in the IVS and Dual groups, 23% and 38% had at least one genotypic resistance mutation at month 6. The 36-month cumulative probability of immunovirologic success was 0.84 in BIR, 0.81 in IVS, and 0.67 in Dual (p = 0.02). Adjusting for CD4 count, viral load, ART regimen, and morbidity, patients who had no genotypic resistance mutations at month 6 or a medication possession ratio (MPR) >90% between month 6 and month 36 had a likelihood of success 3.8 and 3.6 higher than other patients. The 36-month probability of success was 0.56 and 0.86 in patients with an MPR <90% and >90% and 0.59 and 0.84 in patients with and without resistance. After warning signs of failure at 6 months, a large proportion of patients reaches immunovirologic success before 36 months provided there is a high rate of adherence to medication and the absence of early resistance mutations.
Introduction
I
First, the efficacy of antiretroviral drugs in reducing mortality and severe morbidity has been shown to be as good in sub-Saharan Africa as in industrialized settings. 1 –16 Second, patients in Africa generally initiate ART later than in industrialized countries. As a consequence, many die before even starting ART, while those who do receive treatment have a high rate of severe morbidity during the first months of therapy. 3,4,17 Third, a greater proportion of people who start ART in Africa are subsequently lost to follow-up, compared to industrialized countries. 3,4,18 Fourth, treatment failure is more difficult to diagnose when CD4+ T cell (CD4) count and plasma HIV-1 RNA viral load measurement instruments are not readily available. 19 Furthermore, second-line drugs are significantly more expensive than first-line ones in Africa, and neither genotypic resistance tests nor third-line regimens are routinely available. In this context, identifying people who need to switch to a second-line ART regimen as well as defining the best timing for this switch are issues of increasing importance. 19,20
The first biological assessment of ART efficacy is usually made 6 months after treatment initiation. A number of studies have shown that the percentage of patients in Africa who are observed to have failed treatment at this time is comparable to the numbers in industrialized countries. 9,21 –23 However, no study has estimated the probability of succeeding on ART at a later time point, after failing at 6 months. This assessment could help determine the extent of the problem of early failure in Africa.
We followed a cohort of HIV-infected adults with warning signs of immunologic and/or virologic failure 6 months after ART initiation in Côte d'Ivoire, West Africa, and assessed the probability and determinants of further immunovirologic success over the following 30 months.
Materials and Methods
Patients
Study subjects were adults included in the prerandomization phase of the Trivacan trial (ANRS 1269), which was designed to study the outcomes of structured treatment interruptions in Abidjan, Côte d'Ivoire. 24 The protocol of the Trivacan trial was approved by the ethics committee of the Ivorian Ministry of Health and the Institutional Review Board of the ANRS. All patients gave written informed consent. To be eligible for inclusion in the prerandomization phase, patients had to be ART naive and have a CD4 count between 150 and 350 cells/mm3. Subjects initiated continuous ART at the time of inclusion, were followed monthly, and had CD4 count and plasma viral load measurements taken every 3 months. After 6 months of continuous ART, patients were eligible for randomization in the interruption trial if they had CD4 counts >350 cells/mm3 and plasma HIV-1 RNA <300 copies/ml. More detailed methods of the Trivacan trial have been described elsewhere. 24 Patients who never met the randomization criteria remained on their continuous ART regimen and were followed under the same conditions and for the same time as patients who were randomized into the Trivacan trial.
Here, we present data describing all the HIV-1-infected patients who started ART in the prerandomized phase of the Trivacan trial, failed to achieve viral suppression and/or good immunologic response at 6 months, and therefore were not included in the trial at that point. Patients were eligible for the present study if they met at least one of the following criteria: (1) month 6 CD4 count < pre-ART CD4 count + 50/mm3, and (2) month 6 plasma HIV-1 RNA ≥300 copies/m. There were no exclusion criteria. Our study lasted 30 months, from the date of the 6-month visit to the date of the 36-month visit.
Follow-up
Patients were scheduled to attend the study clinic every month and could show up in between scheduled visits if a problem arose. Standardized questionnaires were used to record baseline and follow-up characteristics, including names and quantities of drugs delivered. At each monthly visit, patients received counseling in order to discuss adherence to ART and self-reported symptoms occurring since their previous visit. Subjects were given numbered boxes containing a fixed quantity of antiretroviral drugs corresponding to 35 days of therapy, and were asked to return with the box and any unused tablets at the following visit. Cotrimoxazole prophylaxis was systematically given monthly, unless patients had a history of severe intolerance to the drug. At each scheduled and unscheduled visit, signs and symptoms were managed according to standardized algorithms of investigation and treatment. 25 All clinical events were reviewed by an event documentation committee. Telephone calls or home visits were made by experienced social workers if patients did not keep their monthly scheduled appointments. A patient was defined as lost to follow-up if the last contact with his study center was ≥1 day at study termination, he was not known to be dead, and the tracing team was unable to acquire further information for up to 6 months after the study's closing date. All care was free-of-charge, including transport, consultations, investigations, hospitalizations, and drugs. The Ivorian Ministry of Health subsidized ART for all participants after study completion.
CD4 count (True Count technique on FACScan, Becton Dickinson), plasma HIV-1 RNA (real-time PCR on Taq Man technology Abi Prism 7000, Applied Biosystems, threshold of detectability at 300 copies/ml),
26
and blood cell count (MaxM Coulter, Beckman) were measured every 3 months. Patients with detectable viral load at 6 months were systematically referred to an experimented social worker for a series of consultations specifically dedicated to searching for potential causes for nonadherence and to providing them with counseling in order to discuss adherence to ART. At 6 months, genotypic resistance tests were performed by sequencing reverse transcriptase (RT) and protease genes for all viral loads ≥300 copies/ml.
27
Resistance mutations were defined according to the IAS list.
28
Drug resistance was defined according to the French ANRS algorithm (
Statistical analysis
Baseline was defined as the date of the 6-month visit (M6). Participants were assigned to one of the following three groups: bad immunological response only (BIR) (month 6 CD4 count < pre-ART CD4 count + 50/mm3), incomplete virologic suppression (IVS) only (month 6 plasma HIV-1 RNA ≥300 copies/ml), or both (Dual).
The study closing date was the date of the 36-month visit (M36). The main outcome was immunovirologic success, defined as the concomitance of a CD4 count >350/mm3 and plasma HIV-1 RNA <300 copies/ml. Other outcomes included death, loss to follow-up, and severe morbidity (WHO stage 3 or 4 defining events or events leading to death). Data were censored either at M36, at death for patients who died before M36, at time of immunovirologic success for patients who met the criteria for success before M36, or at last contact with the study center for patients who were lost to follow-up before reaching immunovirologic success.
We used a Kaplan–Meier analysis to describe the probability of success, and log-rank testing to compare the probability of success for BIR, IVS, and Dual patients in univariate analysis. We used univariate Cox proportional hazard regression models to analyze the association between immunovirologic success and the following determinants: (1) baseline characteristics: sex, age, WHO clinical stage, hemoglobin level, body mass index, CD4 count, serum transaminase, HBs antigen serostatus, ART regimen, care clinic, ART regimen modification between ART initiation and M6, and medication possession ratio between ART initiation and M6 (MPR M0–M6); (2) follow-up characteristics: ART regimen modification between M6 and M36, severe morbidity between M6 and M36, and MPR between M6 and M36 (MPR M6–M36). MPR was defined as the ratio of the equivalent days of treatment delivered to the patient at the pharmacy to the days of follow-up between the beginning of the period (ART initiation for MPR M0–M6, M6 for MPR M6–M36) and last visit of the period (≤M6 for MPR M0–M6, ≤M36 for MPR M6–M36). 4,9 ART regimen modification included any substitution of at least one drug for any reason other than failure (toxicity, pregnancy, etc.), and any switch to an entirely new second-line regimen for treatment failure. Variables associated with success that had p < 0.20 in univariate analysis were included in a multivariate Cox model. Interactions between variables were tested. The incidence of mortality, severe morbidity, loss to follow-up, and ART regimen modification was compared for BIR, IVS, and Dual patients, using Poisson regression models.
We performed sensitivity analyses, successively considering “virologic success” (plasma HIV-1 RNA <300 copies/ml, irrespective of CD4 count) and “immunologic success” (CD4 count >350 cells/mm3, irrespective of viral load level) as separate outcomes.
Analyses were performed using SAS software, version 9.1 (SAS Institute, Inc., Cary, NC).
Results
Population
Of the 840 participants in the Trivacan Trial prerandomization phase, 208 (25%) had a bad immunologic response (n = 97), incomplete virologic suppression (n = 79), or both (n = 32). All these 208 patients were included in the present study. No patients were excluded from the analysis. Table 1 shows the baseline and follow-up characteristics of the participants. Of the 208 participants, 12 had substituted one antiretroviral drug before M6, due to toxicity (anemia n = 7, digestive intolerance n = 2, cutaneous toxicity n = 1, neurologic disturbance n = 1) or pregnancy (n = 1). Of these 12 changes, two were with interruption. None of the patients had switched to a second-line regimen.
BIR, bad immunologic response only; IVS, incomplete virologic suppression only; Dual, both bad immunologic response and incomplete virologic suppression; n, number; %, percentage; IQR, interquartile range; kg, kilogram; ART, antiretroviral treatment; NNRTI, nonnucleoside reverse transcriptase inhibitors; NRTI, nucleoside reverse transcriptase inhibitors; PI, protease inhibitors; MPR, medication possession ratio; NA, nonapplicable.
At ART initiation, the only 2 NRTIs + 1 NNRTI regimen was ZDV–3TC–EFV and the only 2 NRTIs + 1 PI regimen was ZDV–3TC–IDV/r.
At 6 months, 172 patients (83%) were receiving ZDV–3TC–EFV, 28 patients (13%) were receiving ZDV–3TC–IDV/r, 7 patients were receiving d4T–3TC–EFV, and 1 patient was receiving ZDV–3TC–NFV.
Among the 162 women included in the study, 78% had never received a short ART regimen for preventing mother-to-child transmission (pMTCT) of HIV-1, and 22% had received ARV drugs for pMTCT at least once, including 13% with NVP alone, 9% with ZDV alone, and 6% with ZDV plus 3TC plus NVP. These percentages were, respectively, 54%, 38%, 4%, and 4% in the Dual group, 73%, 14%, 5%, and 8% in the IVS group, and 89%, 4%, 7%, and 0% in the BIR group.
At month 6, 111 patients had detectable HIV-1 RNA, including five who could not be amplified and 106 who could be amplified. Among the latter, 76 (72%) had zero mutations, and 30 (28%) had at least one mutation [IVS 28/79 (23%), Dual 12/32 (38%)]. This included resistance to nonnucleoside reverse transcriptase inhibitors in 22 patients [IVS 13/79 (16%), Dual 9/32 (28%)] and to nucleoside reverse transcriptase inhibitors in 13 patients [IVS 9/79 (11%) Dual 4/32 (13%)]. The 22 patients with resistance to NNRTI had the following mutations: K103N (n = 18), K101E (n = 2), G190A (n = 1), Y181C (n = 1), and Y188L (n = 1). The 13 patients with resistance to NNRTI had the following mutations: M184V (n = 12) and T215A (n = 1). No resistance to protease inhibitors was observed.
Among the 111 patients with detectable HIV-1 RNA at 6 months, 108 had an HIV-1 RNA available at 3 months, including 64 (59%) with undetectable HIV-1 RNA at 3 months and 44 (41%) with detectable HIV-1 RNA at 3 months. Among the latter, the 6 months HIV-1 RNA level was lower than the 3 months HIV-1 RNA level in 23 (52%), including only nine patients in whom the 3 months HIV-1 RNA level was lower than the pre-ART HIV-1 RNA level. The rate of patients with at least one resistance at 6 months was 19% in patients with undetectable HIV-1 RNA at 3 months and detectable HIV-1 RNA at month 6, versus 41% in patients with detectable HIV-1 RNA both at 3 month and at 6 months (p = 0.02).
ART during follow-up
The median MPR during follow-up was 0.97 (IQR 0.92–1.00) overall, 0.98 (IQR 0.92–1.00) in the BIR group, 0.92 (IQR 0.67–0.97) in the IVS group, and 0.94 (IQR 0.60–1.00) in the Dual group. Six patients (3%) switched to a second-line regimen before M36 because of ART failure and five (2%) others replaced one drug, due to toxicity. Among the six patients who switched to a second-line regimen because of ART failure, three had at least one resistance mutation at 6 months.
Clinical events
Table 2 shows the rates of mortality and morbidity for each group. Seven subjects died and 21 subjects experienced 28 severe morbidity events, including oral candidiasis (n = 11); invasive bacterial disease (n = 5), which included pneumonia (n = 1), isolated bacteremia (n = 2), deep abscess (n = 1), and enteritis (n = 1); tuberculosis (n = 5); cerebral toxoplamosis (n = 1); Kaposi's sarcoma (n = 2); isosporosis (n = 1); and three other events, including prolonged unexplained diarrhea, pneumonia of unknown origin, and trauma. The rate of mortality was significantly higher for patients in the Dual group. Of the seven patients who died, none had switched to a second-line regimen between M6 and death due to ART failure and one had at least one resistance mutation at 6 months. The MPRs before month 6 and the last contact with the study team for these patients were 9.0, 57.8, 62.3, 82.7, 90.6, 100, and 100.
BIR, bad immunologic response only; IVS, incomplete virologic suppression only; Dual; both bad immunologic response and incomplete virologic suppression; p, Poisson regression; CI, confidence interval.
Event-free probability: 36-month probability of remaining free of the outcome while not reaching immunovirologic success.
Incidence: incidence of the outcome during the time between inclusion and immunovirologic success or the time between inclusion and 36 months if success was not reached before 36 months.
Immunovirologic success
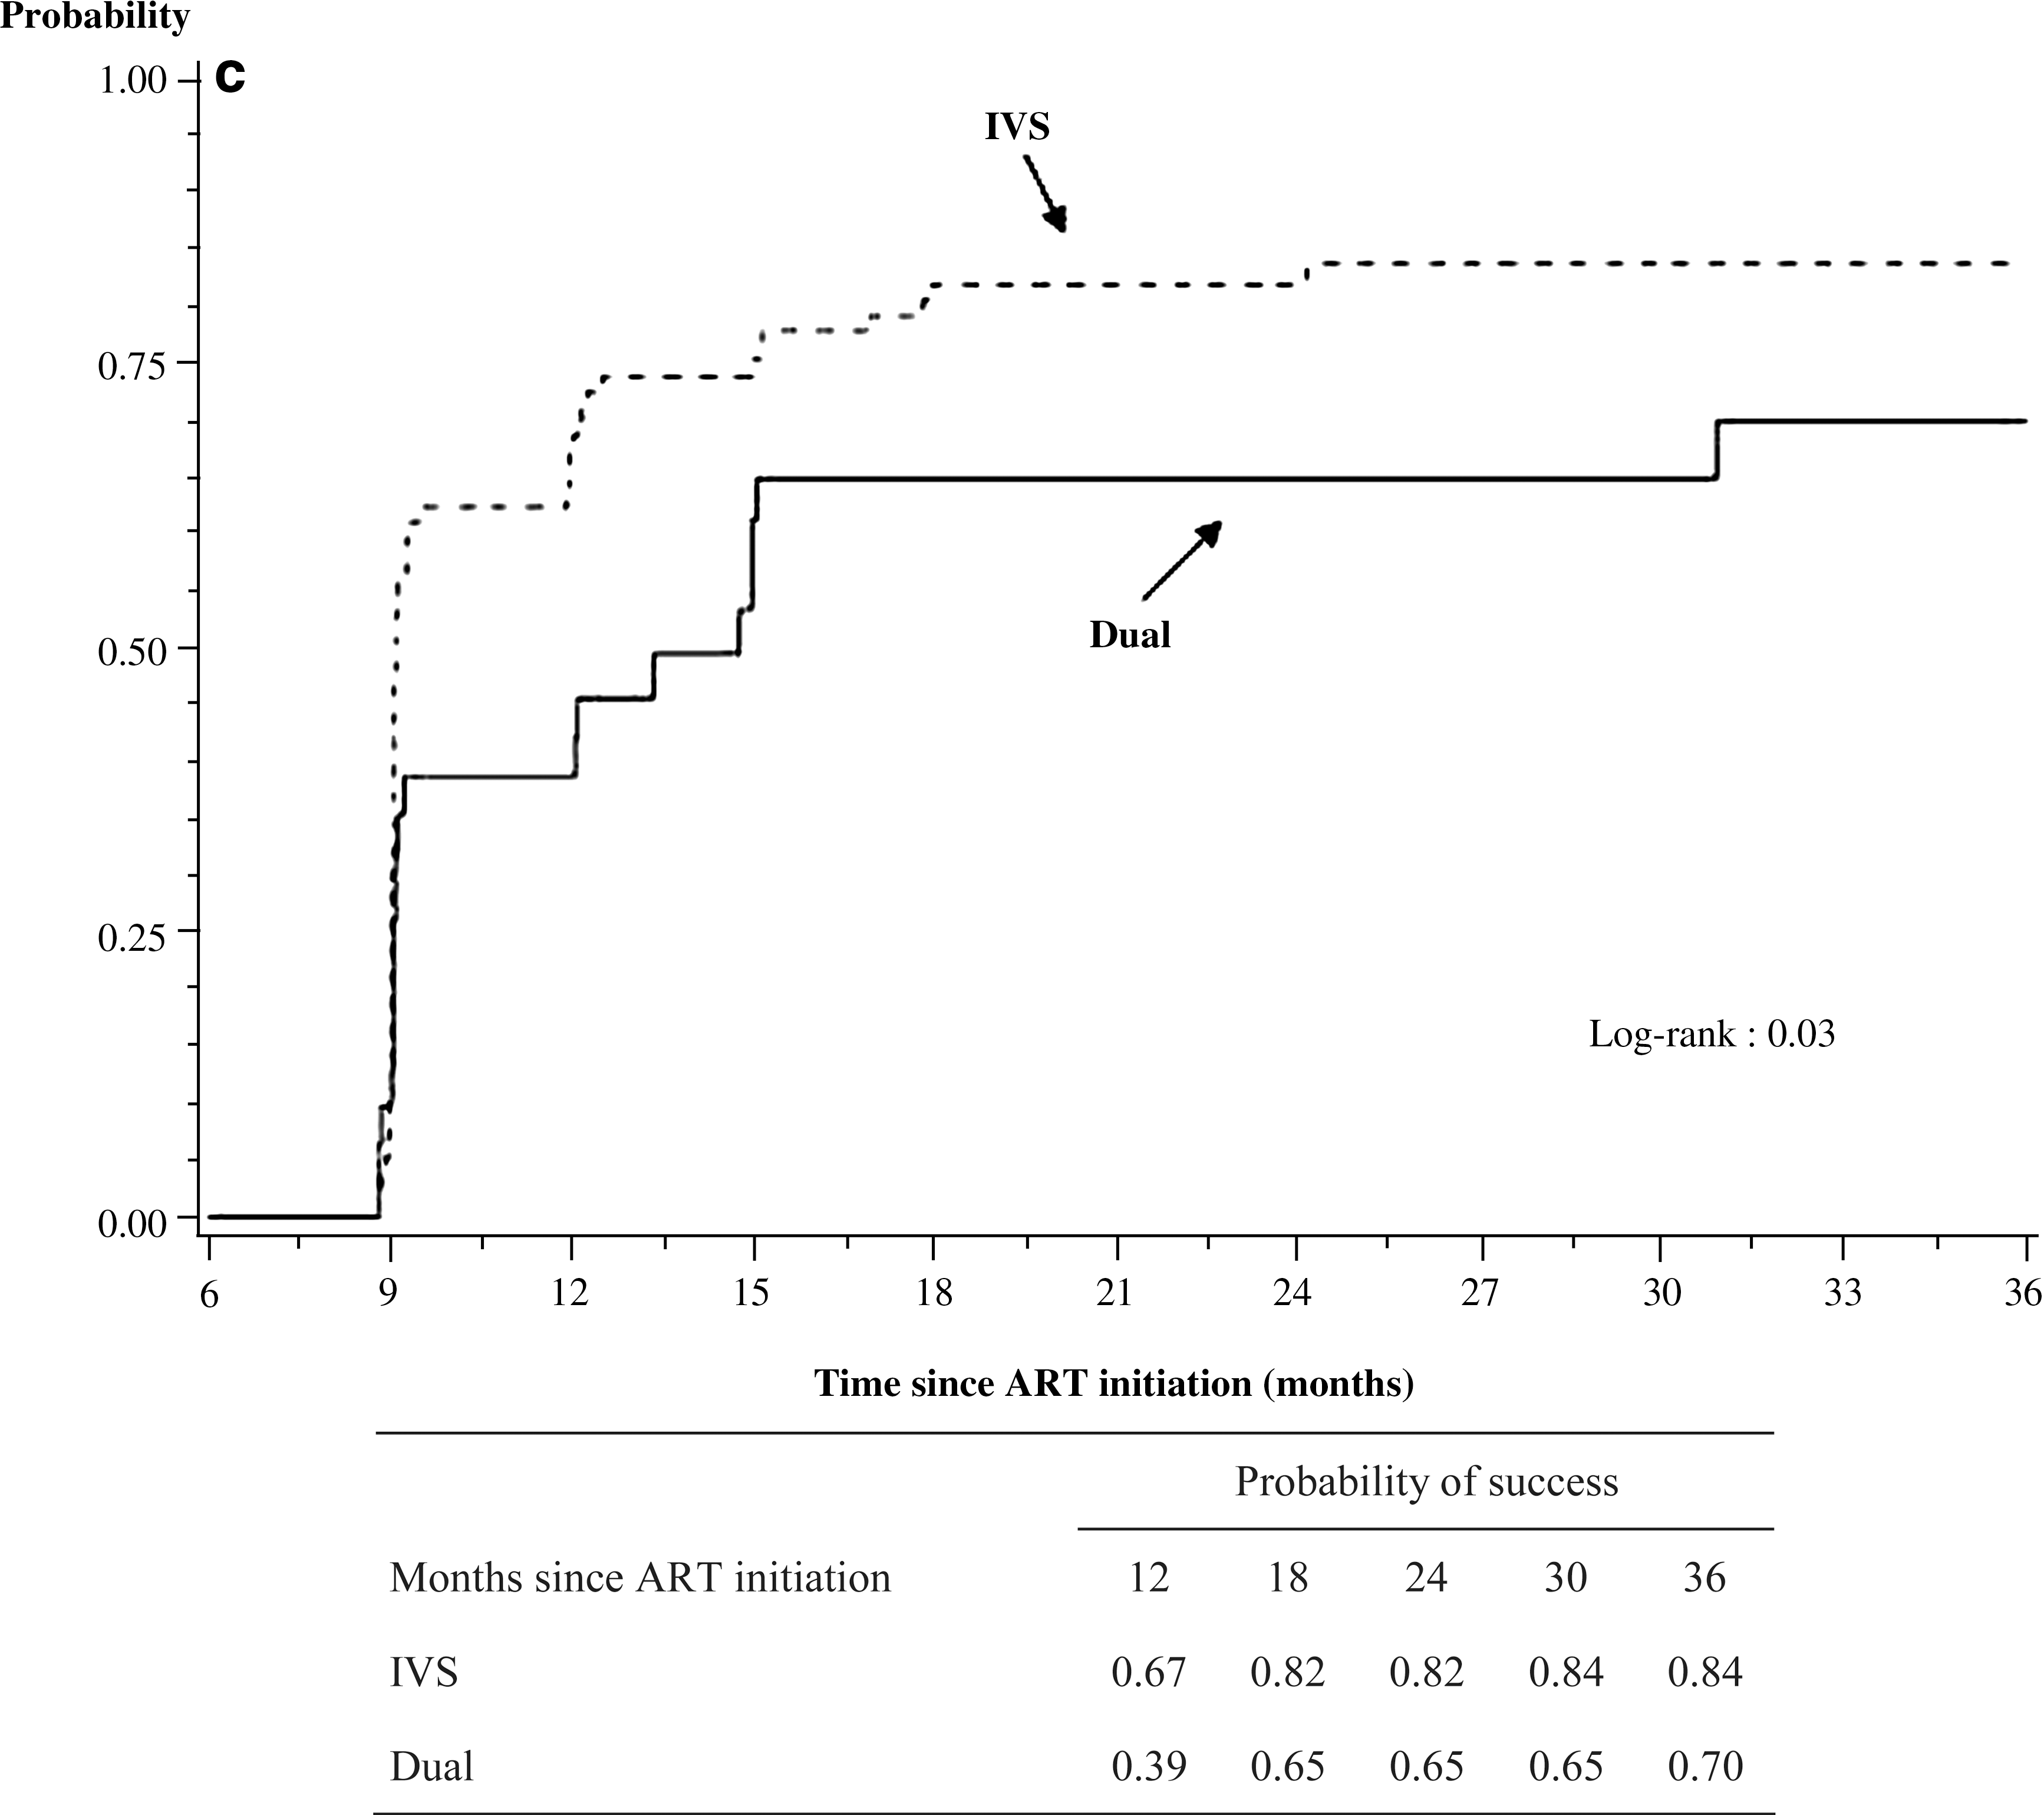
At month 36, nine patients were dead (including seven deaths without having reached immunovirologic success and two deaths after reaching immunovirologic success), 12 patients were lost to follow-up (all of them without having reached immunovirologic success), and 187 patients were alive and followed up (including 159 who had reached immunovirologic success before month 36 and 28 who had not). Among patients alive and followed up, the percentage of missing values for CD4 count and HIV-1 RNA was 4% at month 36, 4% at month 30, 2% at month 24, 3% at month 18, 3% at month 12, and 0% at month 6. Figure 1 shows the probability of reaching immunovirologic success (Fig. 1A), immunologic success (Fig. 1B), and virologic success (Fig. 1C) by group, over time. As shown in the figure, the probability of immunovirologic success was high in all three groups, and was significantly higher for patients in the BIR and IVS groups (both >0.80) than for those in the Dual F group (0.67). Of the 30 patients with detectable viral load and at least one resistance mutation at month 6, 18 (60%) reached immunovirologic success before month 36.
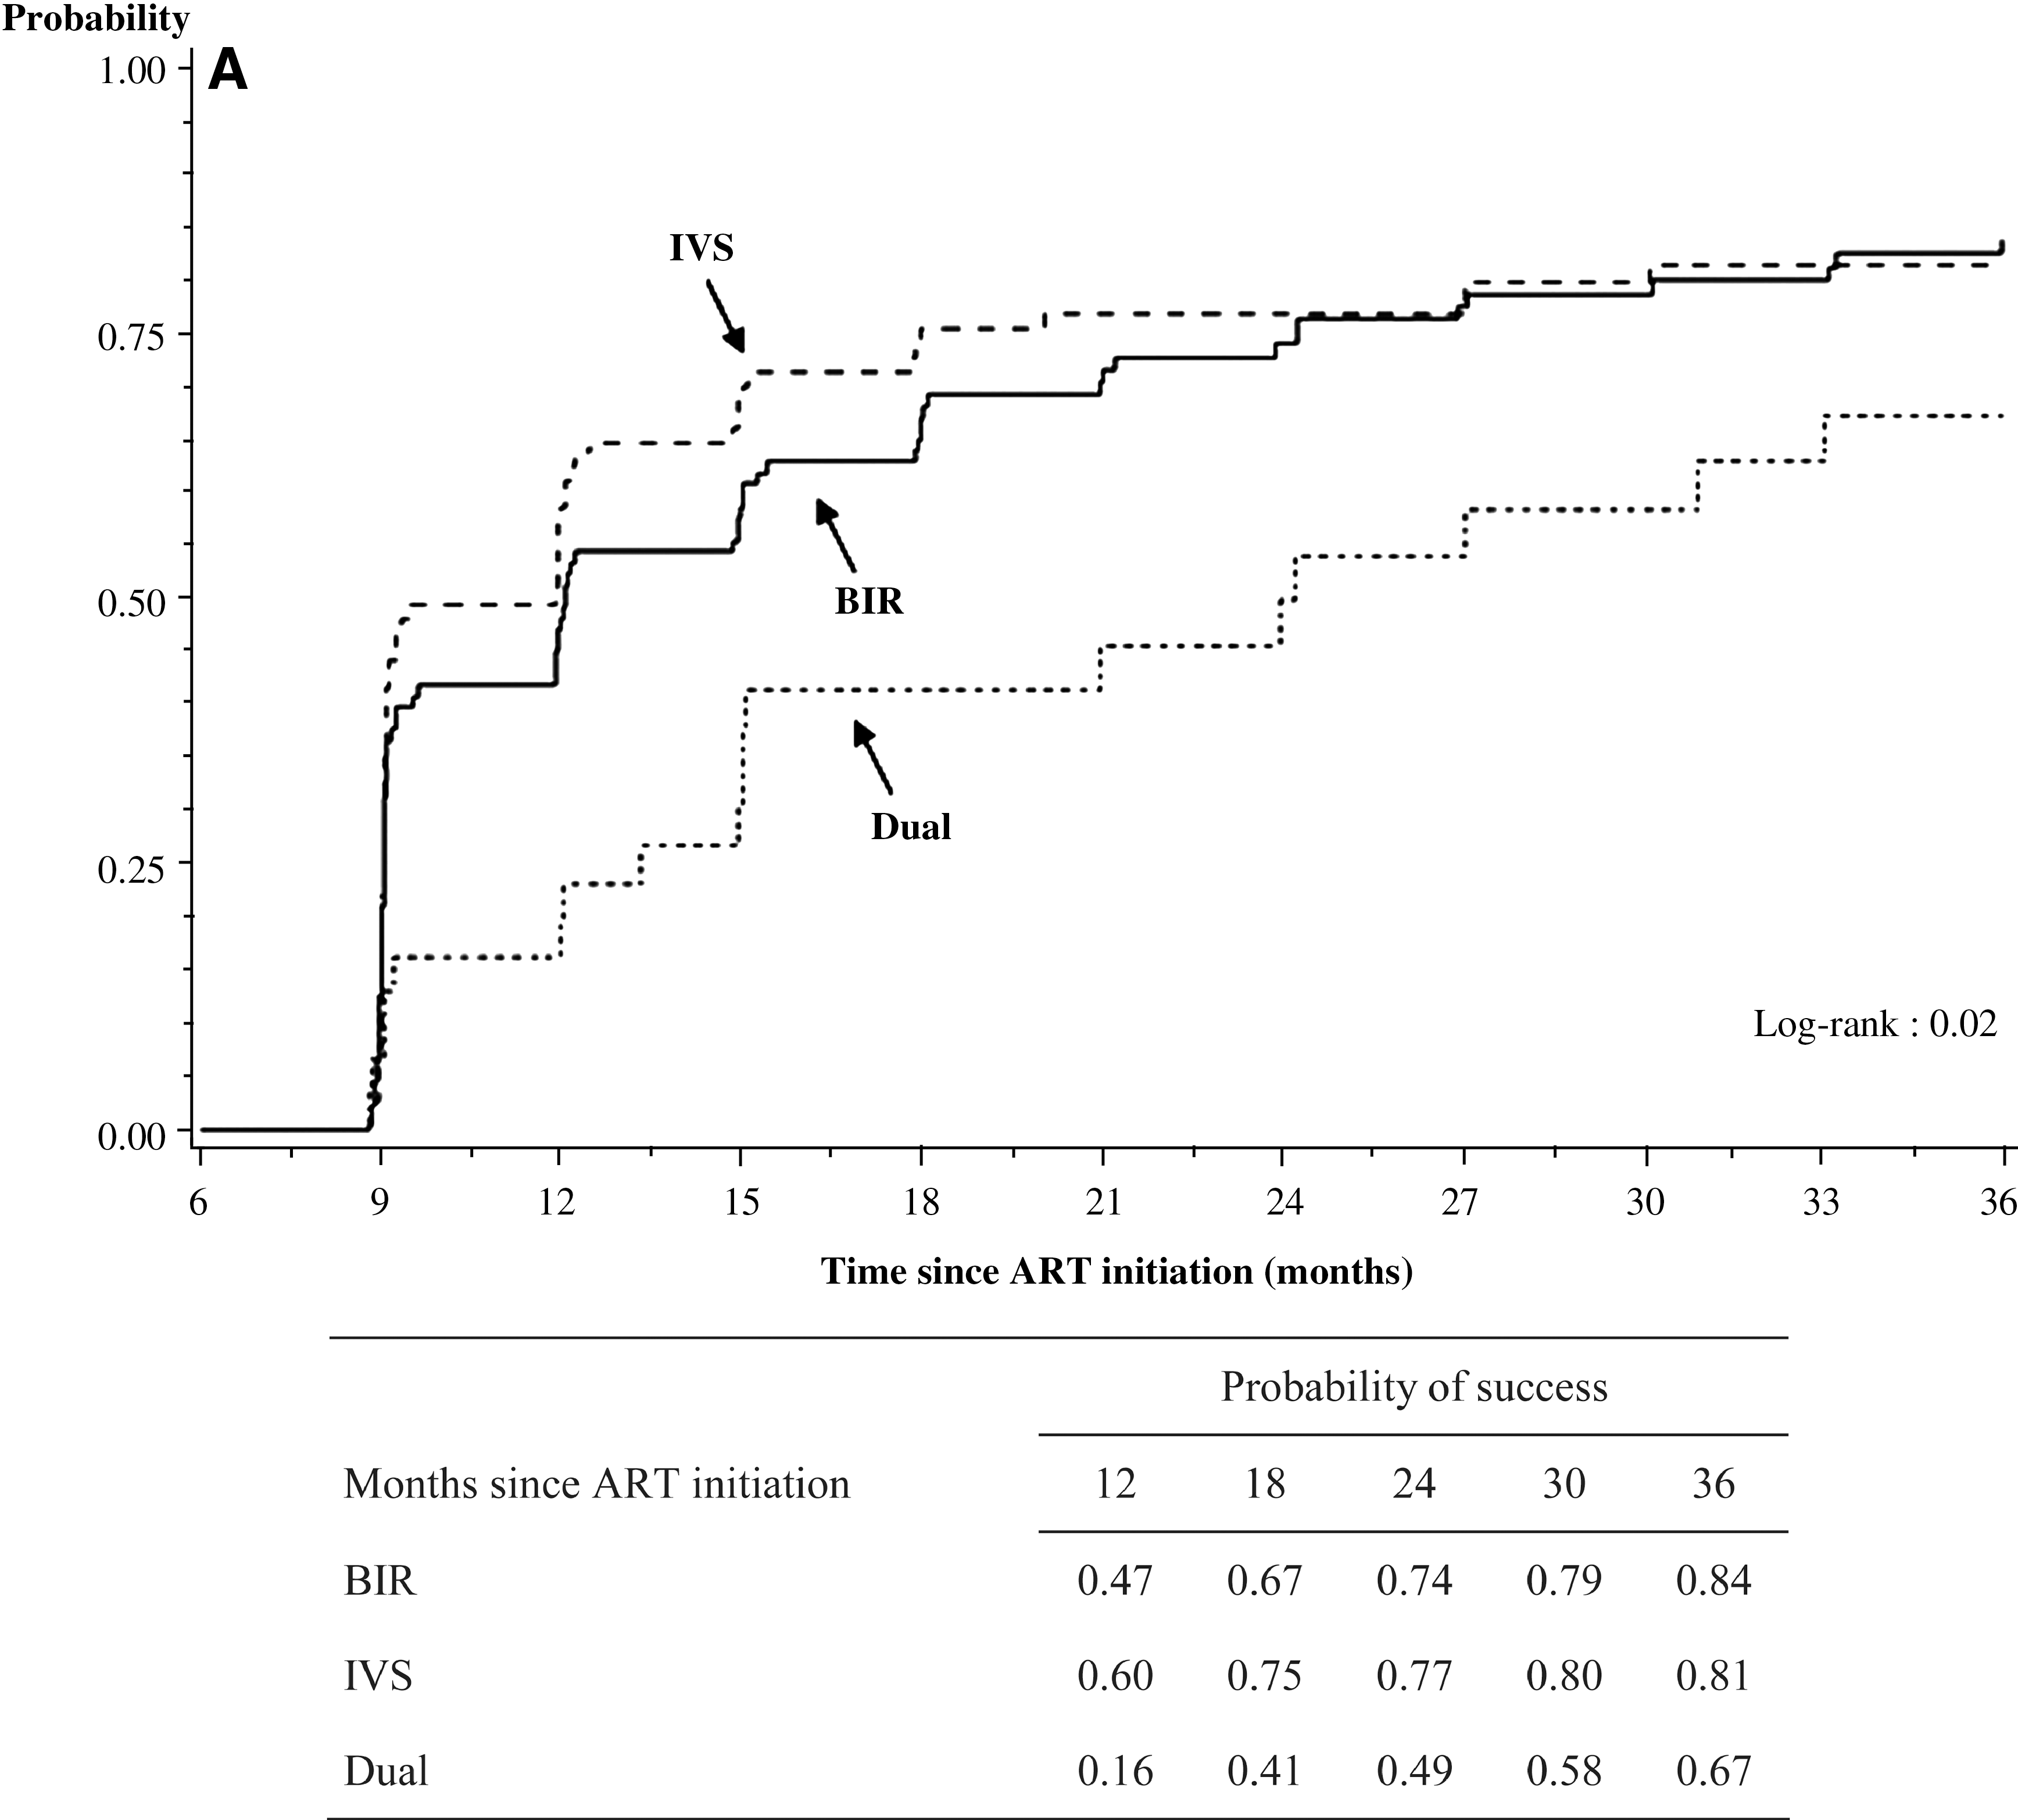
Probability of reaching success between month 6 and month 36, by type of early signs of failure at month 6. (

Factors associated with success
The following variables were associated with immunovirologic success, with p < 0.20 in univariate analysis: study center (p = 0.17), ART regimen at M6 (p = 0.02), MPR M0–M6 (p = 0.20), CD4 count at M6 (p < 0.001), virologic status at M6 (p = 0.07), hemoglobin level at M6 (p = 0.02), MPR M6–M36 (p < 0.001), incidence of WHO stage 3–4 morbidity events between M6 and M36 (p = 0.07), and rate of ART regimen switching between M0 and M6 (p = 0.02). For the latter, the proportional hazards assumption was not validated. Thus, the multivariate model was adjusted for this variable but we did not determine a hazard ratio for it.
Table 3 shows the result of the multivariate analysis. Immunovirologic success was independently associated with study center, CD4 count at M6, virologic status at M6, and MPR M6–M36.
HR, hazard ratio; CI, confidence interval; p, multivariate Cox analysis; NNRTI, nonnucleoside reverse transcriptase inhibitors; ART, antiretroviral therapy; PI, protease inhibitors.
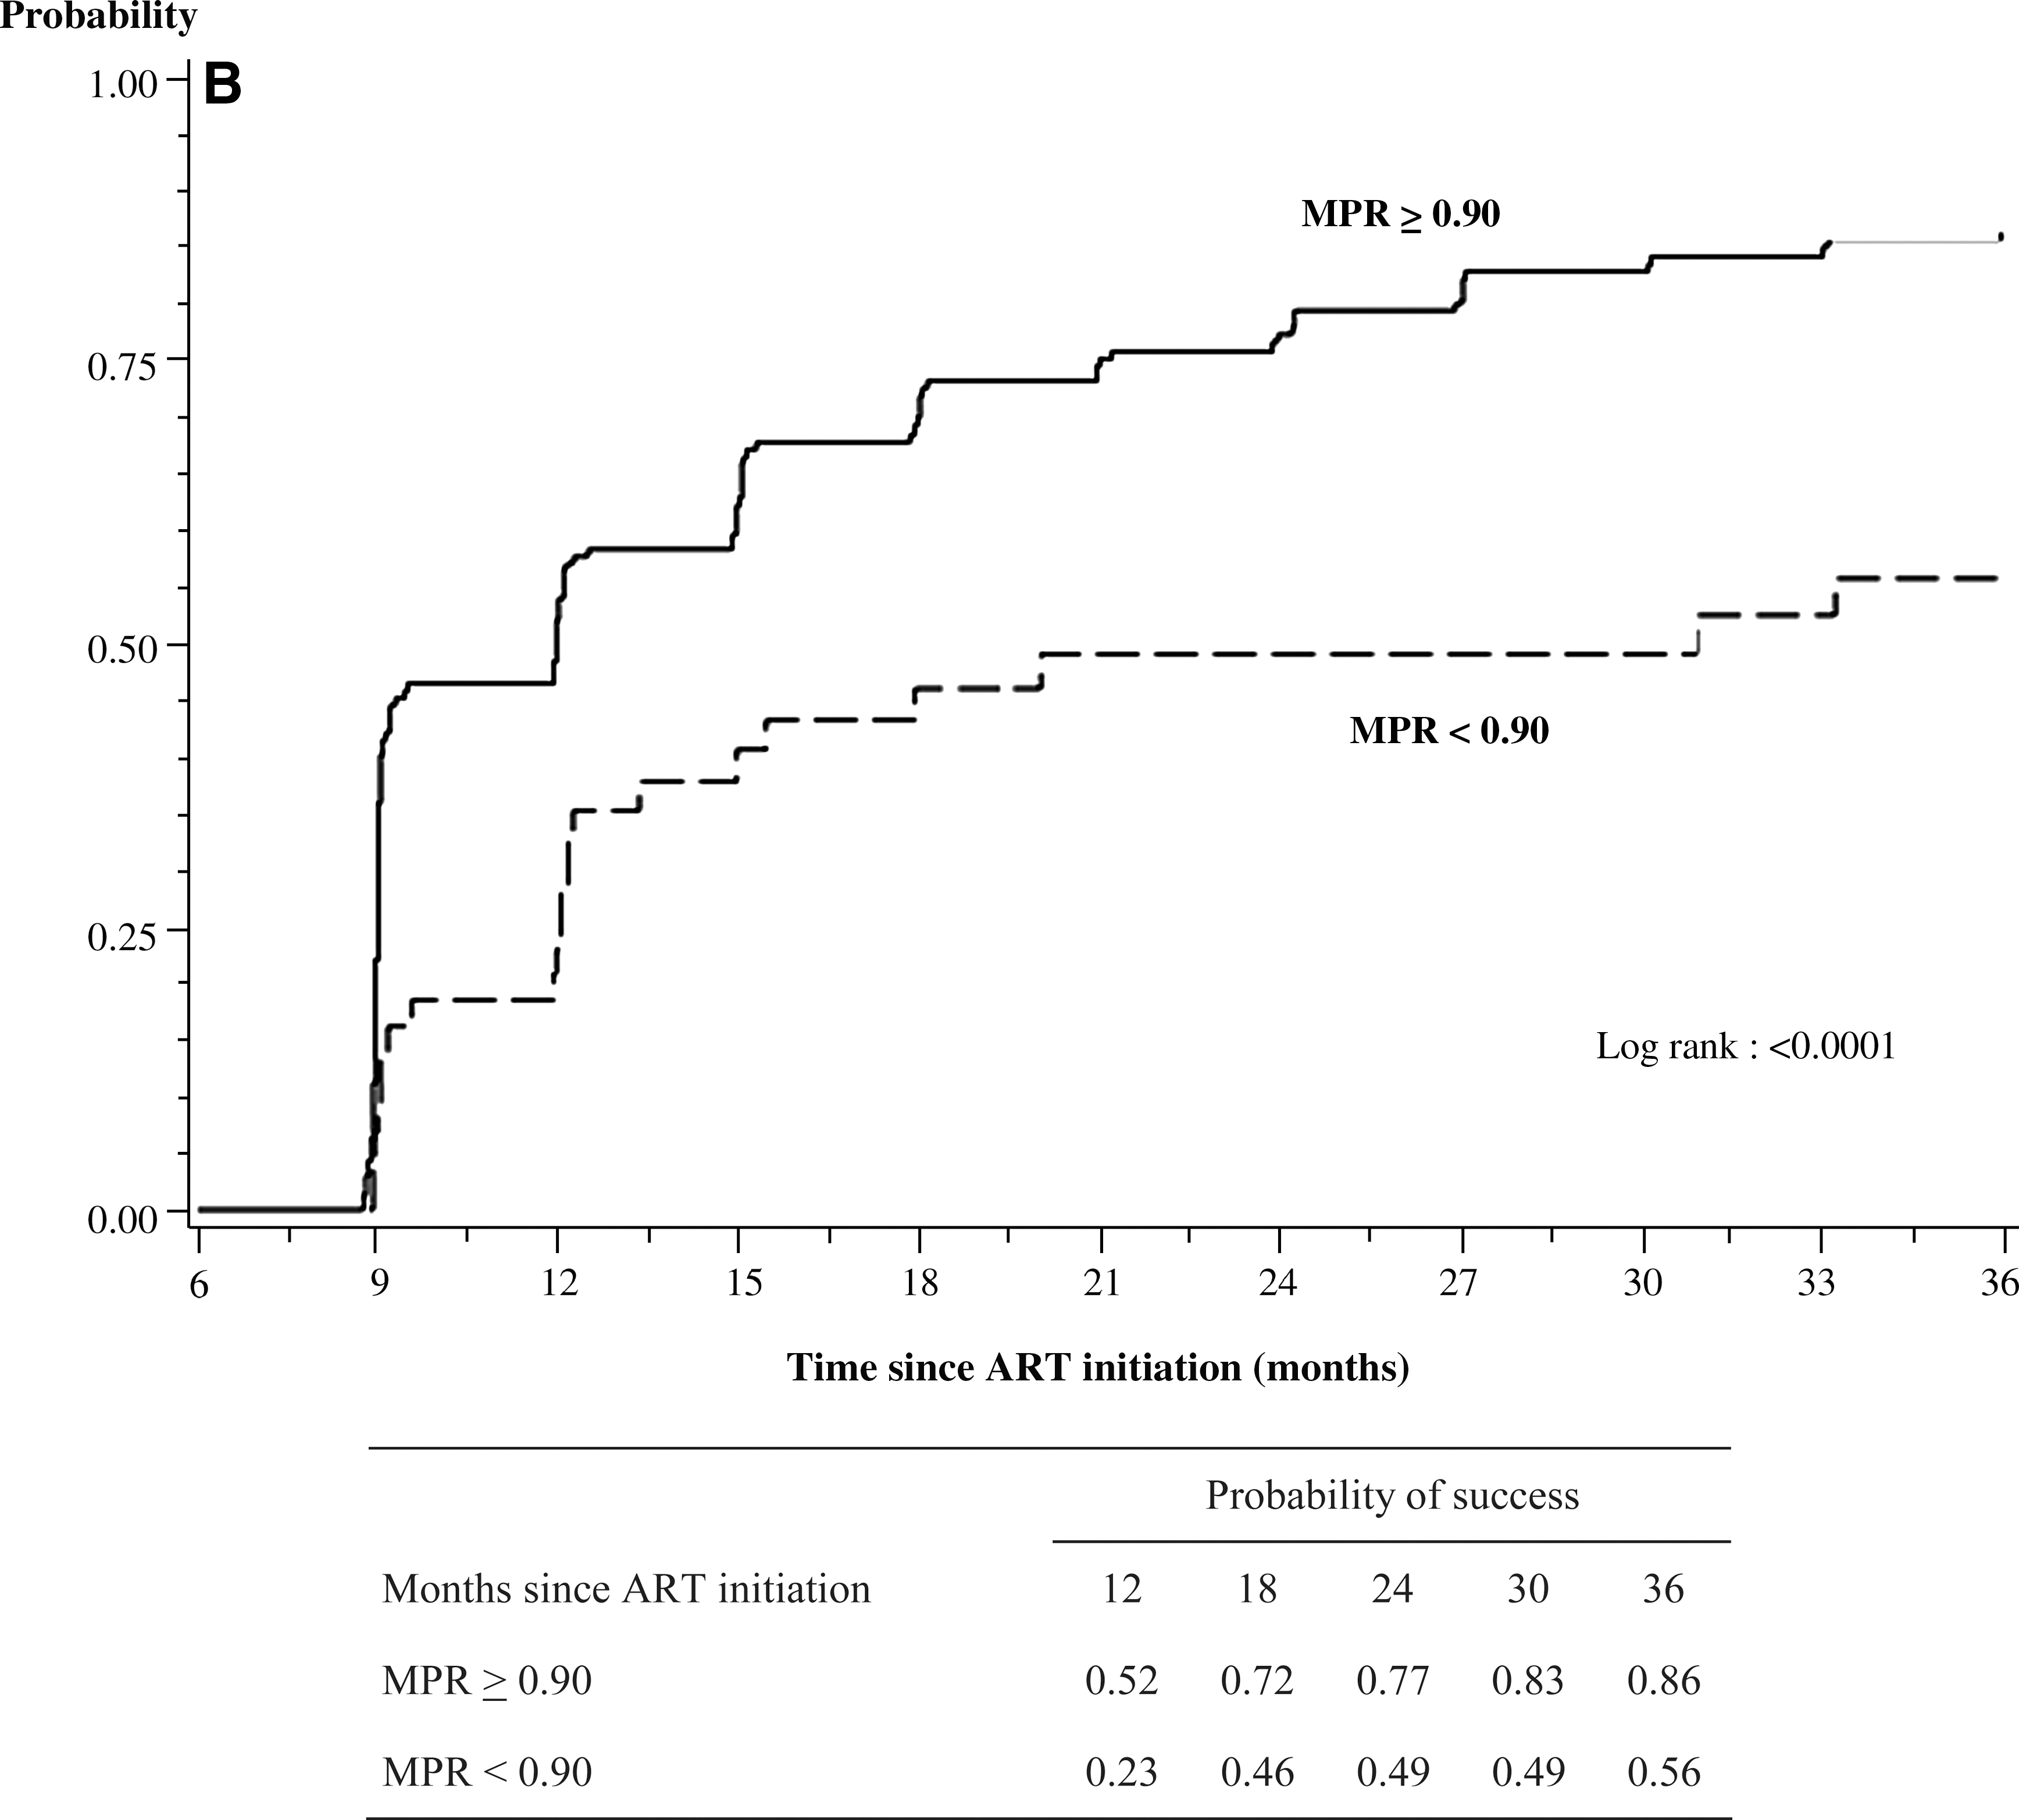
Figure 2 shows the probability of immunovirologic success over time in patients with detectable viral load and with or without resistance at M6 (Fig. 2A) and in patients with MPR M6–M36 above and below 0.90 (Fig. 2B).
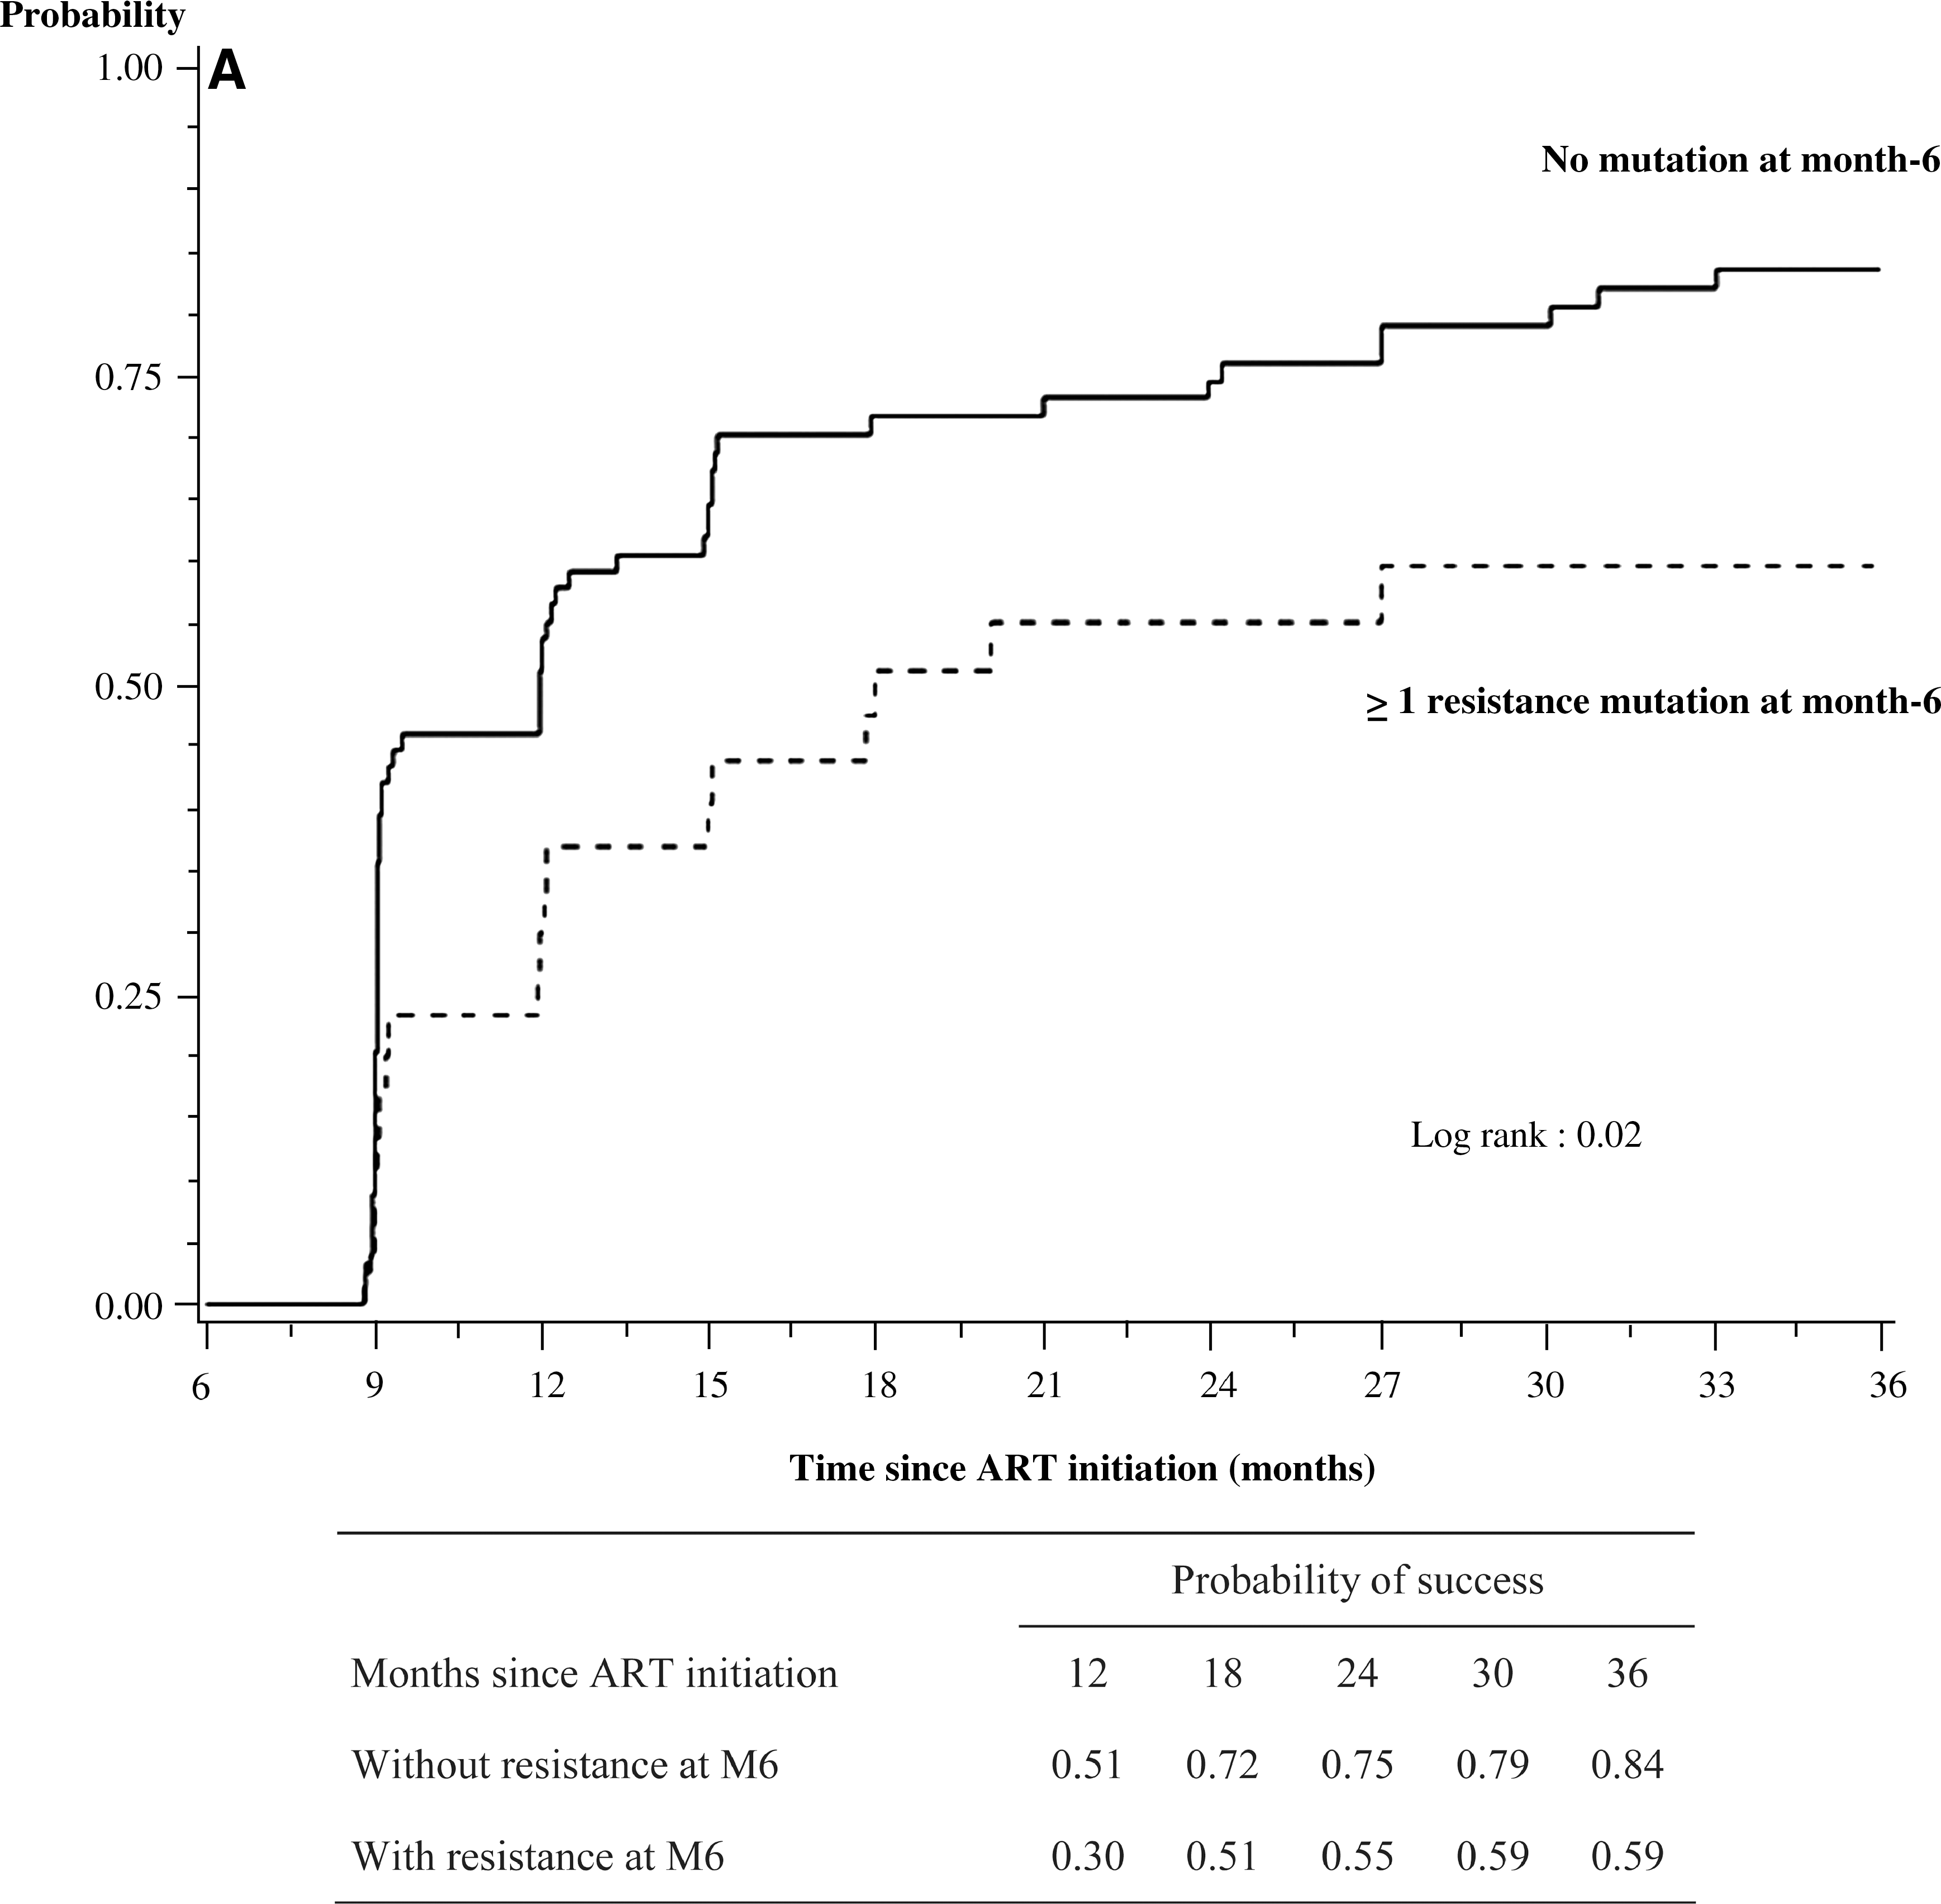
(
In sensitivity analyses, the same variables were associated with immunologic and virologic success, with comparable levels of risk and significance, when these types of success were considered separately (data not shown).
Discussion
In resource-limited countries, viral load testing is rarely available and second-line drugs are between 4 and 10 times more expensive than first-line drugs. The decision to switch ART regimens after patients fail treatment is frequently based on CD4 counts and clinical conditions. Both of these indicators have been shown to be poor surrogates for plasma viral load, especially at the early stages of virologic failure. 29,30 Switching regimens based on criteria that are often poorly predictive of virologic failure may lead patients to start second-line therapy too early, thereby increasing the risk of unjustified costs and wasting the number of ART regimens still available to each individual. On the other hand, waiting for the clinical and immunologic consequences of virologic failure to occur before switching ART regimens may increase the number of resistance mutations, in turn increasing the risk of poor responses to future lines of ART. 31,32 Finally, even in the few settings in which plasma HIV-1 RNA viral load testing is available to some patients, genotype resistance testing is almost always unavailable. If viral load is detectable but information on resistance is unknown, patients might switch regimens, when a better strategy may be to encourage them to improve adherence to therapy. This is especially relevant during the early phases of treatment.
Due to the availability of immunologic and viral load testing instruments in our study, we were able to capture data that may help inform the chance of treatment success in naive patients who have early warning signs of failure.
First, in patients who failed ART at 6 months, we found that the probability of suppression within the following 30 months was above 80%, though only 3% of patients had switched to a second-line regimen. Second, the probability of success in patients who failed immunologically only was comparable to that in patients who failed virologically only. Both the probability of continued failure and mortality rates were significantly higher in Dual patients. Third, the probability of succeeding on ART after preliminary failure was strongly associated with four factors: low CD4 count, the presence of resistance mutations, sustained high MPR, and study center.
These findings emphasize several important points. First, the importance of adherence in patients with early failure is highlighted by its influence on the results of our analyses and the high rate of success in our study, which expressly encouraged patients to remain on therapy. 9 Second, in patients with early warning signs of failure, CD4 count and plasma viral load measurements at 6 months provide equivalent prognostic information on the probability of late success. 20 The increased availability of both tests, however, could enhance physicians' prognostic capabilities. HIV resistance tests would also help identify patients who might benefit from switching regimens earlier than currently recommended.
We used the MPR as a proxy for adherence. This ratio is a more objective method of measurement than self-reported adherence, is easy to measure, and has been shown to be associated with ART outcomes in Uganda and Côte d'Ivoire, under both trial condition and real-life condition with and without free access to care, drugs, and transportation. 4,9 On the other hand, patients with similar MPR may have a different rate of pill intake. In our study, this might be illustrated by the fact that we found a significant association between treatment success and study center after adjusting for the MPR. The study center variable may include some patients' and study center characteristics that were not recorded in our study, such as socioeconomic characteristics and medical staff effectiveness in encouraging patients to take the pills.
This study has several limitations.
Participants in this study started ART in the prerandomization phase of a trial. The main inclusion criterion in this prerandomization phase was a CD4 count between 150/mm3 and 350/mm3. Thus, their CD4 count at ART initiation was higher than that of most patients who have been starting ART in sub-Saharan Africa in the past few years. 1 –17
A few patients who were predominantly in the Dual group switched ART regimens during follow-up. In this study, the decision to switch to second-line therapy was based on CD4 counts, viral load levels, and clinical considerations. Genotype tests were not used when making switching decisions, because they were not routinely available in Côte d'Ivoire at the time. Genotype assays were performed months later, using frozen plasma samples. Our data illustrate the difficulty involved in making switching decisions during the first years of treatment in the absence of genotype testing, even when viral load measurements are available. This is all the more true, since patients who develop resistance are also more frequently poorly adherent.
Finally, in multivariate analysis, viral load at 6 months was treated as a dichotomous variable, given the study sample size. As WHO guidelines are based on the level of viremia, further studies should include more patients and multiple levels of viremia, to make the analysis more interpretable with respect to current guidelines
In conclusion, three different populations have been included in the study: patients with virologic suppression who do not increase their CD4 count, patients with incomplete virologic suppression with good immunologic response, and patients with both signs. These three groups have in common the fact that they are seen by physicians as patients with unsatisfactory early responses to treatment. These data show that under good follow-up conditions, which include free care and repeated counseling for adherence, between 67% and 84% of patients considered to have these early warning signs at 6 months may reach immunovirologic success within the following 30 months. Meanwhile, between 16% and 33% of patients with early warning signs continue to fail and remain at high risk of death or loss to follow-up, even in good conditions of care. When available, genotype testing may help identify individuals who will benefit from switching to second-line therapy. In all contexts, whether viral load and genotype testing are available or not, adherence reinforcement remains the key tool for ensuring medium-term success in patients with early warning signs.
Footnotes
Disclosure Statement
No competing financial interests exist.