
Abstract
Two HIV-1 subtype C subclusters have been identified in Ethiopia (C and C′) with little knowledge regarding their biological or clinical differences. We longitudinally monitored HIV-1 viral loads and CD4+ T cell counts for 130 subtype C-infected individuals from Ethiopia over 5 years. The genetic subclusters C and C′ were determined and comparisons were made between the groups. None of the study individuals received antiretroviral therapy. Subcluster C′ was found to be the more prevalent (72.3%) genotype circulating. Individuals infected with subcluster C′ harbored higher viral loads in comparison to subcluster C-infected individuals when the CD4+ T cell counts were high (500–900 cells/mm3), whereas at low CD4+ T cell counts (0–150 cells/mm3) individuals infected with subcluster C viruses showed higher viral loads. We identified a greater number of deaths among individuals infected with subcluster C viruses in comparison to C′. Our results indicate that infection with subcluster C viruses leads to a more rapid onset of disease, despite the initial lower HIV-1 RNA plasma loads. Additionally, the higher viral loads seen for HIV-1 subcluster C′ infections at higher CD4+ T cell counts can help explain the higher prevalence of this subtype in Ethiopia.
Introduction
I
The markers most associated with disease progression have been viral setpoint (following the period of acute infection), CD4 cell counts, and rates of CD4 cell decline, with higher viral loads and steeper slopes being associated with faster progression. 5,6 The activation state of the immune system was also shown to be associated with disease progression, 7 which is pertinent for regions of the world in which coinfection with an array of different pathogens is common. When comparing infection with the variant subtypes some differences have been observed in the disease course, for example, infection with subtype A viruses provides for slower progression in comparison to other subtypes, 8 infection with CRF-01_AE has been associated with higher viral loads among injecting drug users (IDUs) in comparison to subtype B-infected IDUs in The Netherlands, 9 and infection with subtype B viruses in The Netherlands was associated with faster rates of CD4+ T cell decline than rates found in individuals infected with subtype C viruses in Ethiopia. 10 There is cumulating evidence that HIV-1 genotype specificities can account for such differences, such as variation within the promoter regions of the virus, 11 –13 and there is speculation that subtype differences 14 or differences within the virus envelope (gp120/41) can account for altered transmission potential. 15
The HIV-1 epidemic in Ethiopia is dominated by subtype C viruses with two cocirculating subclusters named C and C′ that were identified in 2000. 16 The subclusters have been shown to be related but genetically distinguishable despite circulating within the same endemic population. The C subcluster is related to the ETH2220 reference strain and is specific to Ethiopia, whereas the C′ subcluster possesses phylogenic links to the strains circulating in southern Africa. 15 The prevalence of strain C′ has increased steadily over time in Ethiopia and has surpassed that of C, 15 although it has been estimated that both strains began their epidemiologic expansion around the same time. 17,18 In other regions of the world HIV-1 subtype C has been shown to gain ground even though other subtypes initially dominated those regions 19 ; for example, in India and Malawi subtype C has become the dominant strain although A, B, and D were the subtypes present at the early stages of the epidemic. 20 The goal of this study was to investigate differences between the HIV-1 C and C′ strains cocirculating in Ethiopia, taking advantage of the fact that these strains are found amid the same population, aiming to eventually define subcluster-specific characteristics linked to disease progression.
Materials and Methods
Subjects
This is a retrospective analysis of the ENARP (Ethio-Netherlands AIDS Research Project) cohort that was established to study the natural history of HIV-1 infection in Ethiopia. It comprises factory and sugar plantation workers and has been described in detail elsewhere. 21,22 Although both HIV-negative and HIV-positive individuals were recruited and monitored between 1997 and 2002 for HIV-1 infection in this study only the individuals positive at recruitment and those who became positive during the observation period were included. HIV-1 RNA plasma load and CD4+ T cell count measurements were performed at 6-month intervals. Seroincident subjects were defined as those with two contiguous tests with one negative test followed by a positive test. For the purpose of the analysis only seropositive subjects with a follow-up of at least 1 year were included so as to allow for the longitudinal analysis of CD4+ T cell counts and HIV-1 RNA plasma load measurements. The Ethiopian Health and Nutrition Research Institute (EHNRI) Ethics Committee and the National Ethical Committee approved the study protocol. Comprehensive medical care was provided to all participants with the exception of antiretroviral therapy, which was unavailable in Ethiopia during the study period. Blood was drawn at 6-month intervals from 130 HIV-positive individuals of whom 24 seroconverted during the study period. These individuals were also considered in a separate analysis. For the present analysis the CD4+ T cell counts, HIV-1 RNA plasma load values, and death events were the parameters considered. Disease stage at intake was assessed for all individuals using the WHO staging criteria. 23 Subsequently due to the size of the cohort stage 1 included asymptomatic individuals whereas stages 2–4 considered symptomatic individuals with mild to severe symptoms.
Genotype determination
For each individual, plasma from a single time point was selected and the genotype of the HIV-1 virus determined after purification of the viral RNA, isolated from 200 μl of plasma using the silica-based Boom extraction technique for nucleic acids.
24
For genotype determination we utilized a novel approach based on molecular beacons that distinguish between subcluster C and C
CD4+ T cell count and HIV-1 RNA plasma load analyses
Every participant was initially tested for HIV-1 antibodies using the HIVSPOT assay (Genelabs Diagnostics, Singapore) and enzyme-linked immunosorbent assay (ELISA) (Vironostika HIV, Uni-Form II plus O; BioMérieux, Boxtel, The Netherlands). Positive results were confirmed by Western blot testing (HIV Blot 2.2, Genelabs Diagnostics, Singapore). Subsequently, blood was collected from each study participant at 6-month intervals. CD4+ T cell counts were performed using standard fluorescent-activated cell sorting (FACS) on whole blood, employing commercially available fluorescent-labeled monoclonal antibodies (Becton-Dickinson Immunocytometry, San Jose, CA). HIV-1 RNA plasma load was determined using NucliSens HIV-1 QT assay (BioMérieux, Boxtel, The Netherlands), with a lower limit of detection (80 copies/ml). For the purpose of this study we considered the CD4+ T cell count and HIV-1 RNA plasma loads at each visit and performed analyses of these linked values, with each pair taken as an independent measurement.
Analyses
Descriptive statistics for group comparison and regression analyses were performed utilizing the Prism package software [GraphPad software Inc., San Diego, CA, version 4.0 (
The CD4+ cell counts were divided into four strata to take into account disease progression. We chose high (500–900 cells/μl 3 ), two intermediate (350–500 and 150–350 cells/μl 3 ), and low (0–150 cells/μl 3 ) cell counts. Considering that healthy Ethiopians have lower CD4+ counts than Europeans, 27 we chose the 350 cells/μl 3 value rather than the 400 cells/μl 3 value to divide the intermediate strata. The mean and median CD4+ cell count values for all four strata were compared between the two C and C′ groups to verify that the viral load comparison is not the reflection of CD4+ count differences. Enrollment of the participants during ongoing acute infection was also taken into account. Therefore the analysis was reiterated excluding all first year observation values, which did not alter the relationship of CD4+ cell count to HIV RNA plasma load. Normal distribution of the data in groups was tested using the Kolmogorov–Smirnov (KS) test as embedded in the Prism software package. If the data in the groups were normally distributed, the Student's t test was used to compare groups. If the data were not normally distributed, the Mann–Whitney U test was applied for unpaired samples unless otherwise indicated. To compare differences between the genetic groups based on categorical data, the Fisher's exact test was used. For all analyses the level of significance was set at p = 0.05. Where the slopes of two linear regression lines were compared, an ANCOVA analysis was performed. Finally, the univariate Cox proportional hazards analysis as embedded in the SAS/STAT software package (SAS Institute Inc., Cary, NC) was used to study the predictive value of genotype with death.
Results
Subjects and genotype analyses
One hundred and thirty (N = 130) HIV-1-infected individuals were followed for up to 5 years. Age and gender were known for all 130 individuals at intake and clinical staging information was available for 129 participants (Table 1). From sequence analysis previously described 15,25 we knew that the C and C′ genotypes found in Ethiopia could also be found among the cohort participants (Fig. 1). We first determined the HIV-1 env and gag genotypes for all cohort participants using previously developed beacon assays that can distinguish between C and C′ subclusters of HIV-1 subtype C (Table 2). The gag assay was indeterminate for 14 subjects and negative for 9 whereas the env assay was indeterminate for 4 subjects and negative for 4. In summary, all individuals could be genotyped with one or the other assay with one negative for both (the same individual with consistently undetectable viral load). The analyses showed that subcluster C′ was the predominant genotype (72.3% for env and 53.8% for gag). The 72.3% of C′ isolates in env found in the cohort is concordant with studies utilizing virus isolates collected countrywide. 15 Equally 19.2% of the study individuals harbored a C/C′ recombinant virus according to the two gene analysis, concordant with the percentage found in the general population (20.0%). The relation of viral load to CD4+ cell counts was analyzed for the individuals carrying gag/env recombinant viruses separately and we found results similar to those obtained with individuals harboring viruses of the C′ group envelope. Noteworthy is the observation that 73.4% of the C/C′ recombinant viruses had an envelope of the subcluster C′ genotype indicating the biological advantage of the C′ envelope (data not shown). In addition, there was no statistical difference in the median values of the follow-up period between the two genotypes, 4.54 (3.42–5.39) years for the C′ and 4.10 (2.7–5.2) years for the C genotype (Mann–Whitney U test, p = 0.3037), with the numbers in parentheses indicating the interquartile range.
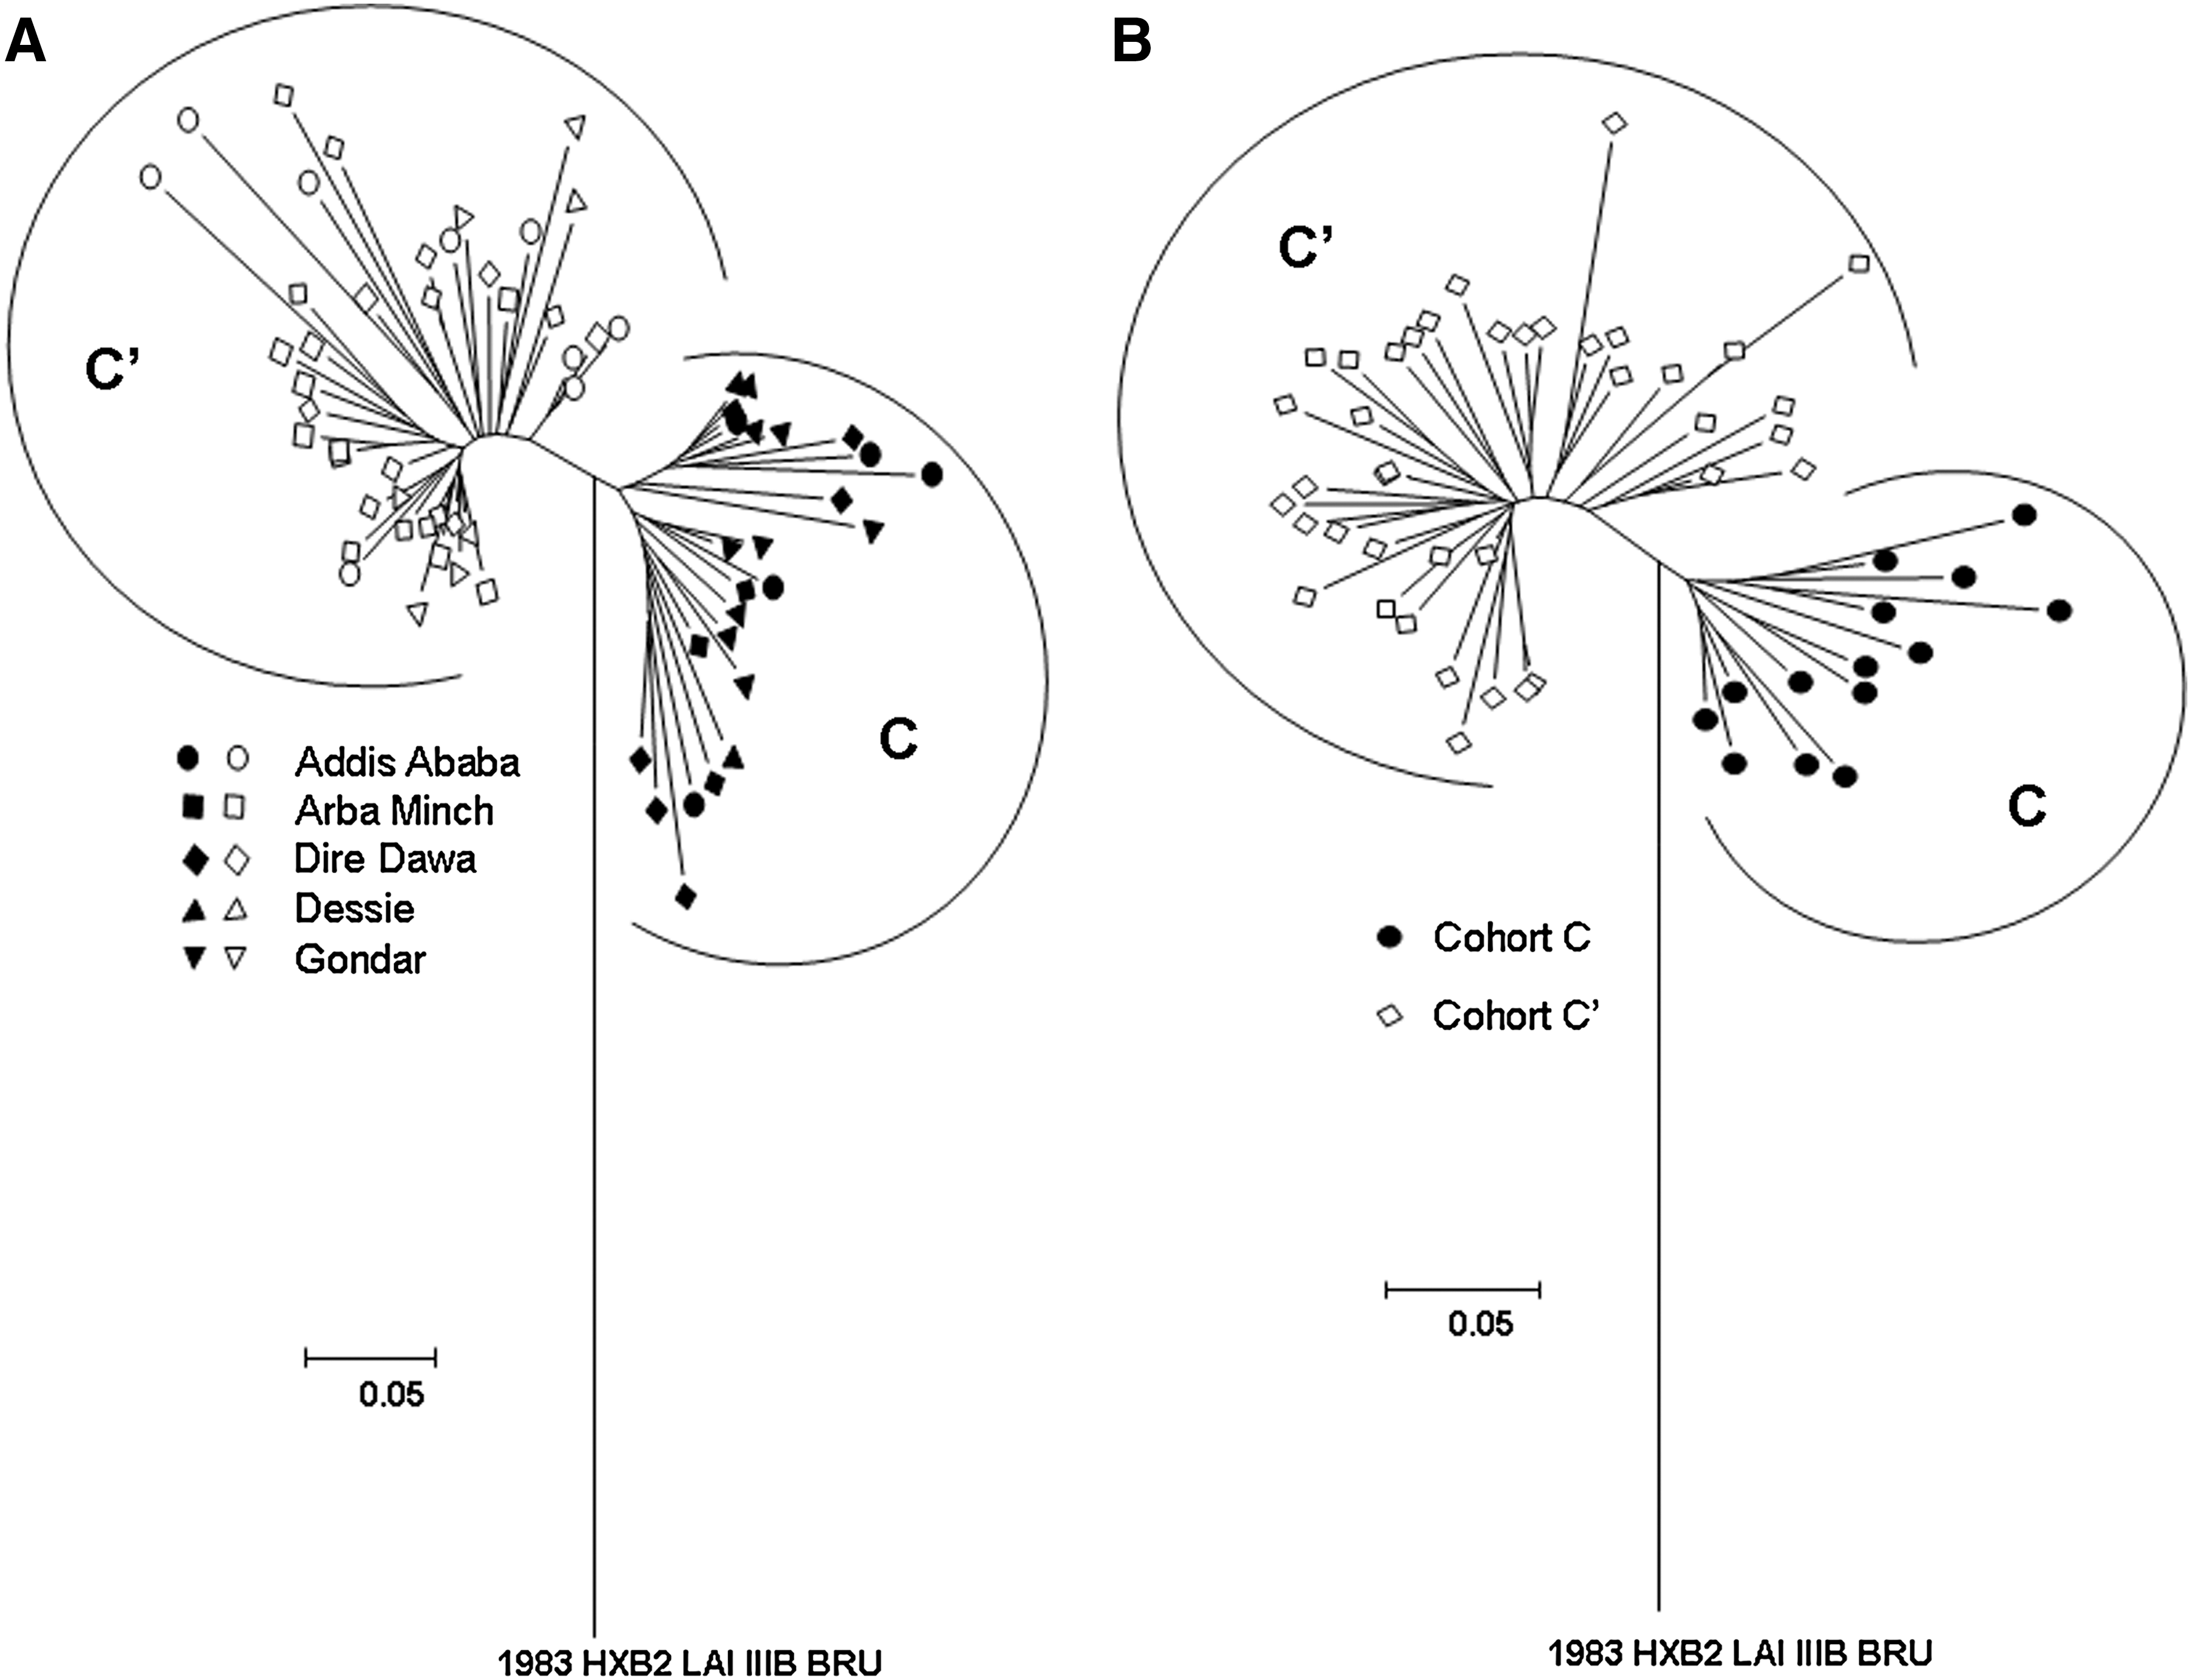
C2V3 envelope phylogenetic tree analysis of Ethiopian HIV-1 sequences using the neighbor-joining method of the DNADIST, NEIGHBOR, and DRAWTREE options of the PHYLIP software package. The two genotypes are indicated as C (closed symbols) and C′ (open symbols). (
Genetic group was defined as C or C′ when both genes gag and env had a similar genotype, and as recombinant when the two genes had a different genotype.
p Values calculated between C and C′ as recombinants were not taken into the main analyses.
Analyzed using the Fisher's exact test.
Analyzed using Student's t-test.
Recombinant (the gag and env genes are not reactive to the same subcluster beacons).
Negative (not detected by either the C or C′ beacons).
Indeterminant (reactive to both the C and C′ beacons).
Indeterminant (negative or indeterminant for the gag or the env gene).
The same subcluster genotype in both genes.
Longitudinal genotype analysis was performed in two subsets of individuals for a period ranging from 3 to 7 years. Two representative groups were selected; the first was composed of 13 individuals who survived the study period, randomly selected. The second was composed of 13 individuals who died of AIDS or AIDS-related complications during the follow-up period who were also analyzed longitudinally. All these individuals possessed consistent gag and env genotypes over the entire study period, indicating the stable character of this cohort. The demographics and clinical characteristics of the study participants at baseline are listed (Table 1). The sex ratios between the C and C′-infected groups were similar, reflecting the sex ratio in the cohort. The median age between subcluster C and C′-infected individuals was 37 and 32 years, respectively. We did not find differences in clinical stages between the two subclusters C and C′ (using Fisher's exact test). There were 86.0% asymptomatic individuals in the C′ group and 82.4% in the C group (Table 1). The ratio C/C′ for both symptomatic and asymptomatic individuals reflected the 30/70 ratio that is found both in the cohort and countrywide. Median CD4+ T cell counts at intake were similar for both groups (C = 327 cells/μl versus C′ = 326 cells/μl, Student's/p = 0.8857), with HIV-1 viral loads also being similar (C = 4.2 log10 copy/ml versus C′ = 3.85 log10 copies/ml, Student's/p = 0.3523).
HIV-1 RNA plasma load differences within the CD4+ T cell count strata of HIV-1 C or C′-infected individuals
We aimed to determine whether the relationship between CD4+ T cell counts and HIV-1 RNA plasma load differed between the C and

Correlation between log10 plasma RNA load and CD4+ counts. (
For this analysis, all HIV viral load/CD4+ T cell count combinations were regarded as independent data points, as both parameters will change intrapatient over the period of the study, whereby the data points from one patient can be in different CD4+ T cell strata. The data in all strata were normally distributed, hence the use of the Student's t test for the comparisons between groups. Furthermore, with this analysis individuals who were infected with C or C′ group viruses for both gag and env genes (nonrecombinants) were compared; nevertheless, when the groups based on either the gag or env gene were analyzed the results did not differ (data not shown).
At the strata of CD4+ T cell counts of 500–900 cells/μl the individuals infected with a subcluster C′ virus had one log higher HIV-1 RNA plasma load median value compared to the C group (3.51 and 2.58 log10 viral RNA, respectively; p < 0.0001). Inversely, at the strata of CD4+ T cell counts of 0–150 cells/μl the study subjects infected with subcluster C′ had a median HIV-1 RNA plasma load value that was one log lower than the C group (4.64 and 5.49 log10 viral load, respectively: p = 0.0002). These differences were not present in both the intermediate CD4+ T cell strata of 150–350 cells/μl and 350–500 cells/μl (150–350 cells/μl median: 4.30 and 4.11 log10 viral RNA, respectively: p = 0.3215) (350–500 cells/μl: median: 4.00 and 3.64 log10 viral RNA, respectively: p = 0.0810) (Fig. 2B). The mean CD4+ cell values were identical between the two groups for all four strata (Fig. 3), suggesting that the differences in viral load did not reflect intragroup differences in CD4+ cell count values.
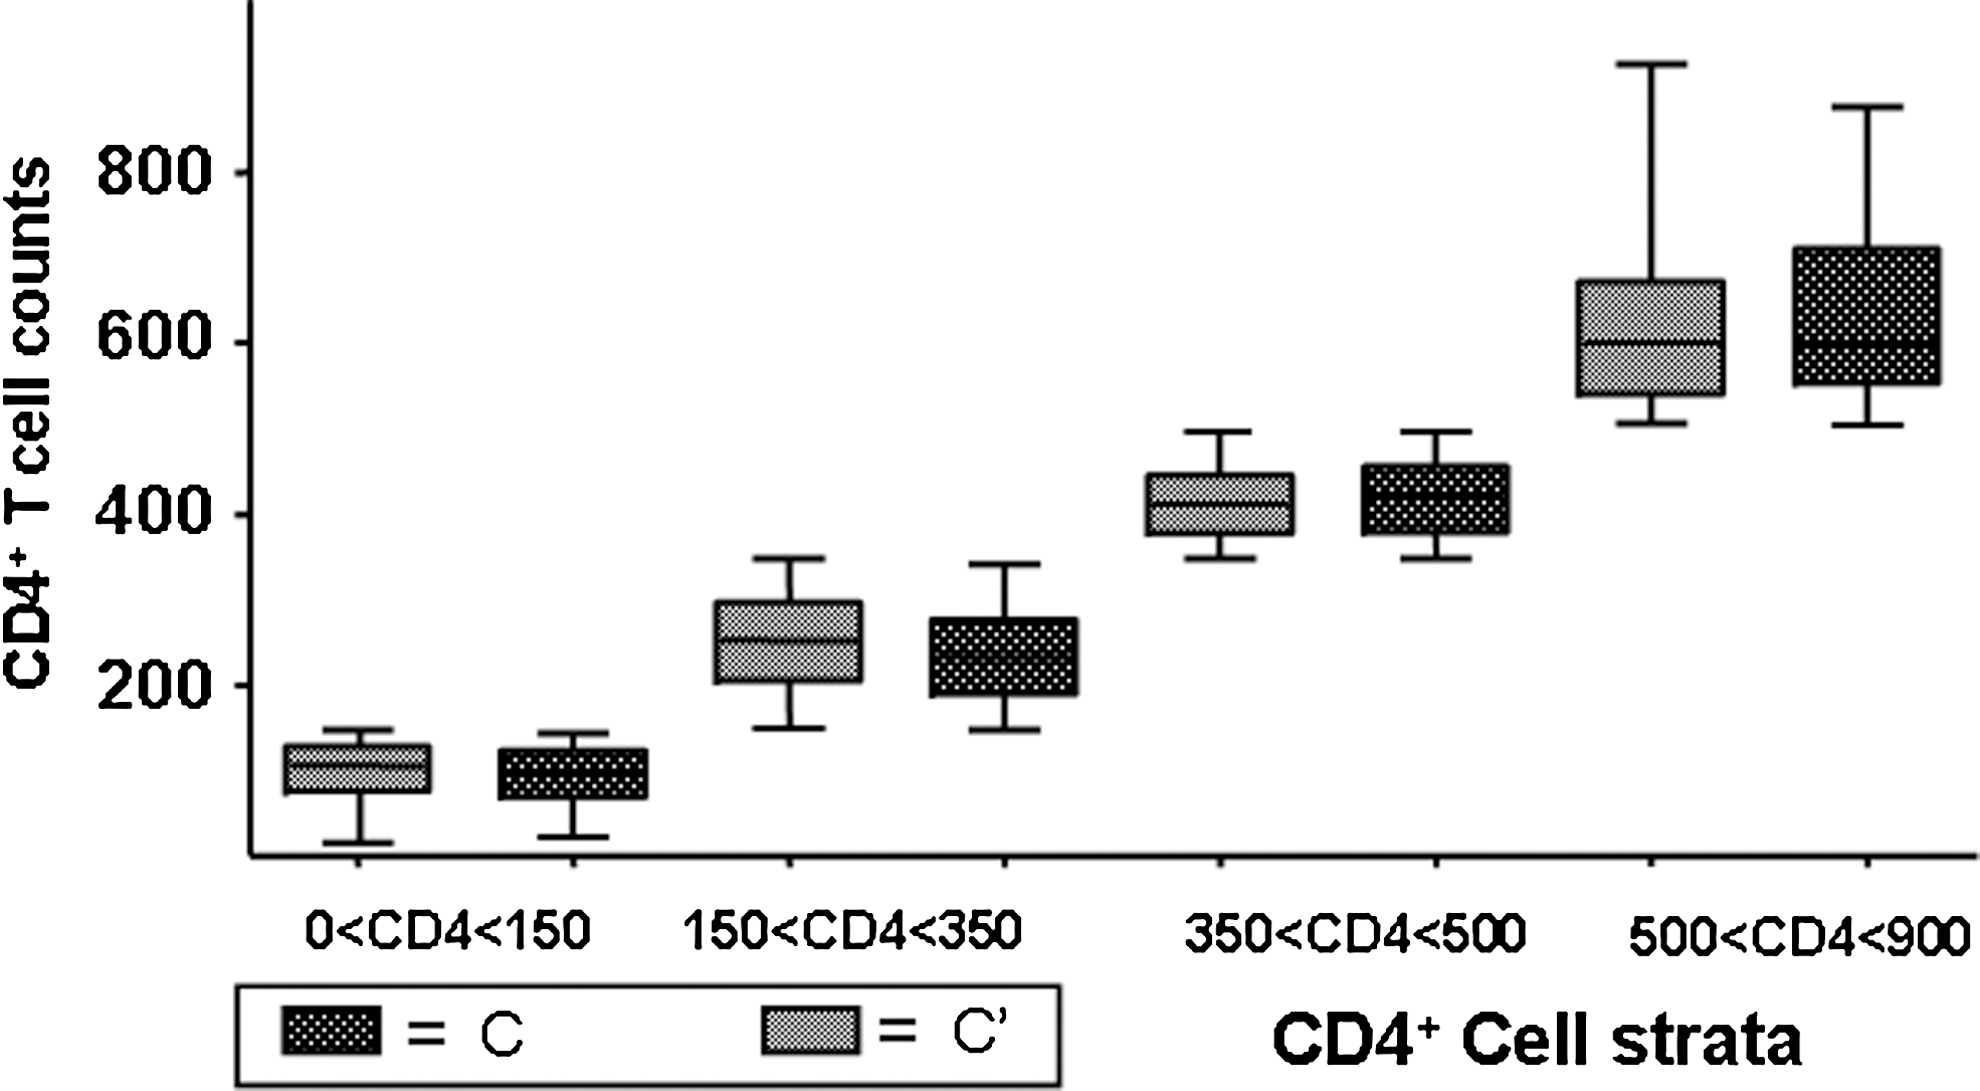
Box plot comparison of the median CD4+ T cell counts in each strata chosen between the C′ and C group. The box patterns are noted and are the same as in Fig. 2.
The observation that individuals infected with subcluster C′ virus had higher viral loads early in infection, when CD4+ counts were high, was confirmed when the analysis was repeated for the subset composed of 24 individuals that was HIV-1 negative at the time of enrollment, but that subsequently seroconverted (Fig. 4A). Among the seroconvertors we could genotype 16 (66.7%) individuals harboring a strain with a C′ and 8 (33.3%) with a C envelope, corresponding to the 70/30 prevalence ratio of the two virus groups within the cohort as well as the general population. The clinical follow-up period for these individuals was not sufficiently long for them to reach a substantial loss in their CD4+ T cell counts. However, the C′ group presented one log10 higher viral loads than the C group in the 500–900 CD4+ T cell counts/μl strata (Fig. 4A). For the 350–500 CD4+ T cell counts/μl strata the difference was still significant, unlike that for the seroprevalent group. In this group of individuals we compared the HIV-1 RNA plasma load values at the early stages of chronic infection, independently of the CD4+ T cell counts that were at healthy levels. To avoid a biased comparison by including high HIV-1 RNA plasma load values often observed at the early moments during the establishment of HIV-1 infection, we compared the HIV-1 RNA plasma load measurements obtained during the second year postseroconversion. Again the subcluster C′ viruses were associated with HIV-1 RNA plasma load values that were significantly higher than those associated with the subcluster C viruses (Student's t test, p = 0.0318) (Fig. 4B), providing one indication as to why C′ has spread faster over the years, overtaking the C group.
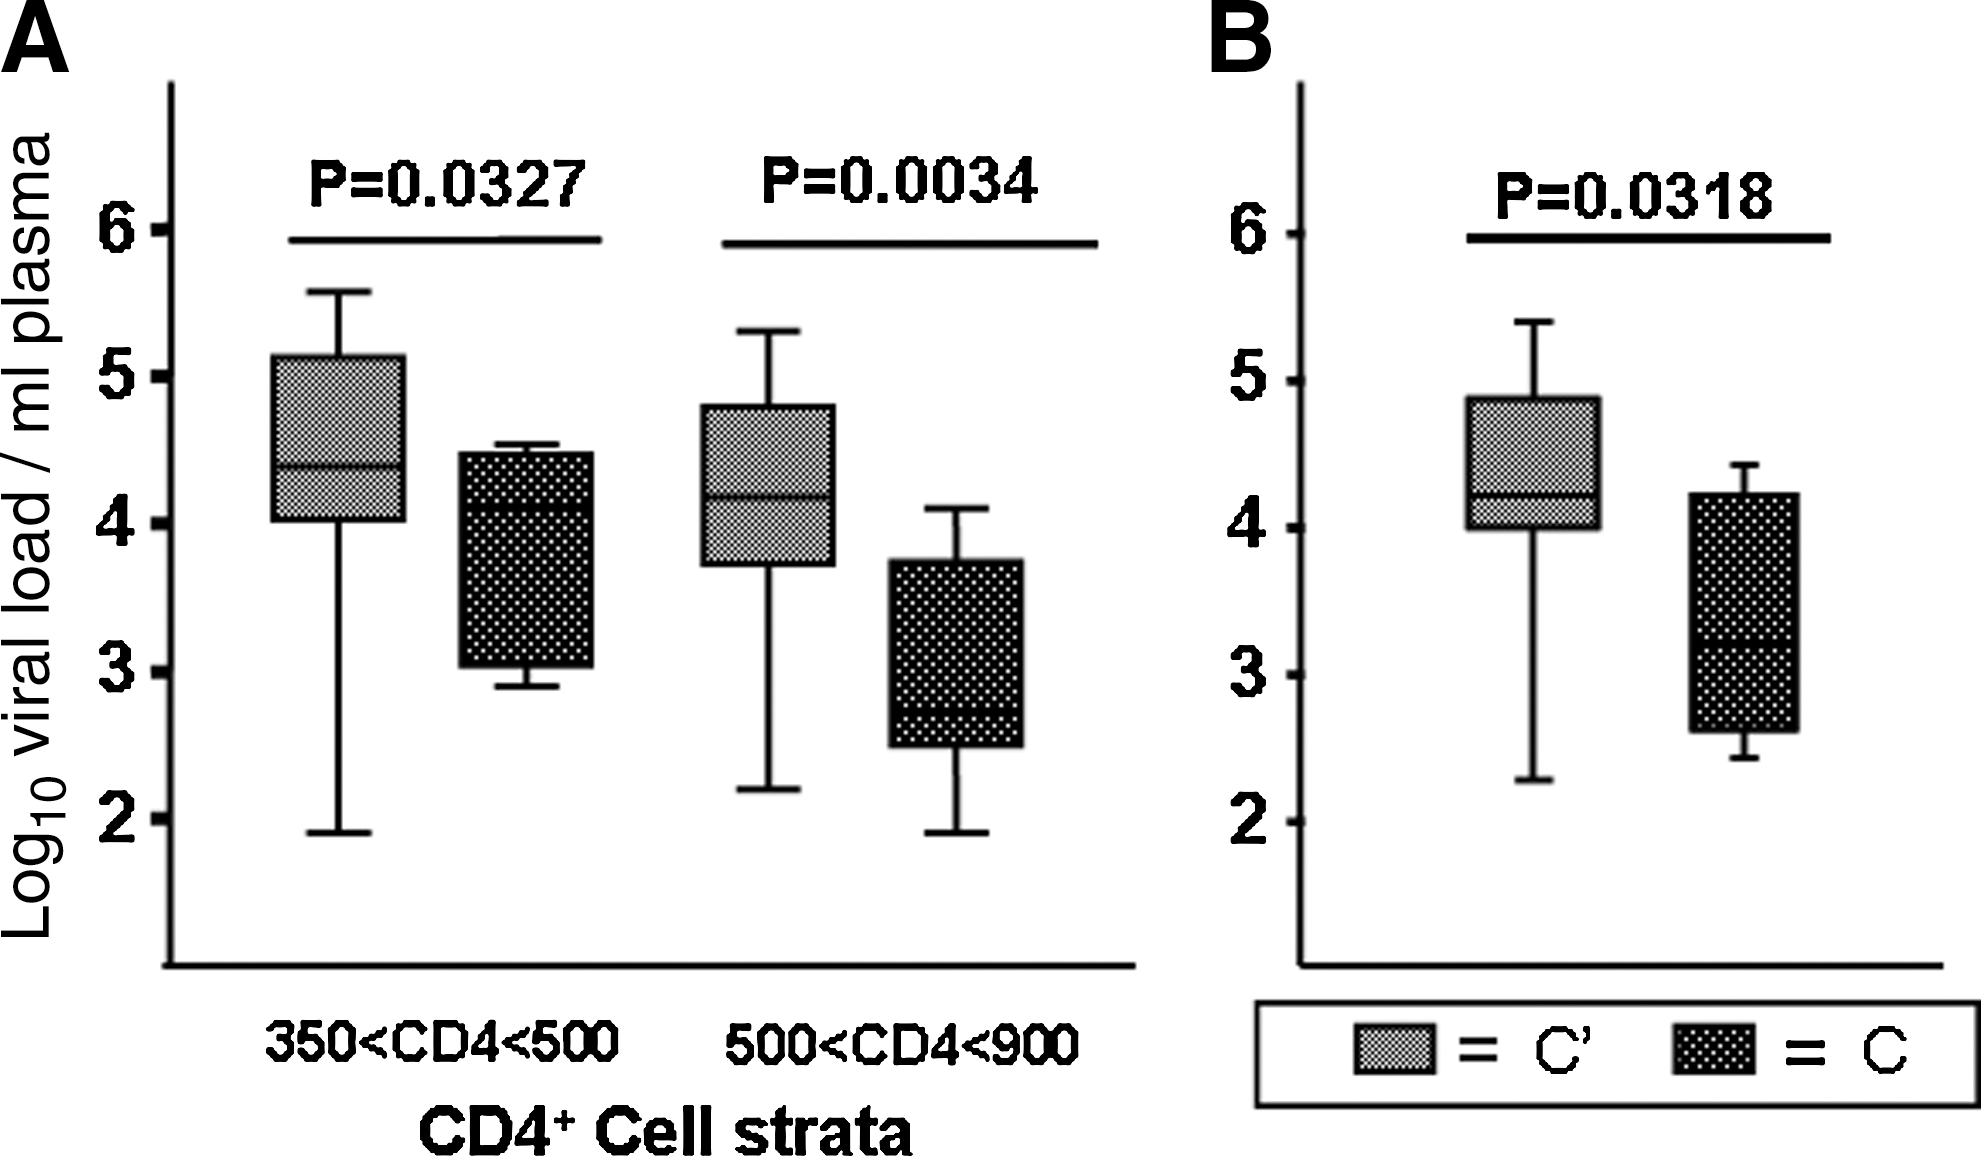
Box plot comparison of the median HIV-1 RNA plasma load values from individuals who became infected after the study begun. The box patterns are noted and are the same as in Fig. 2. (
Death incidence and survival estimates in the Ethiopian cohort
During the observation period, 27 participants died from HIV-related causes. In gag 9 were C and 13 were C′ (5 could not be genotyped). In env 8 were C and 16 were C′ (3 could not be genotyped). Fifteen could be genotyped in both the gag and env genes (7 C and 8 C′). The overall incidence of death was 6.7 per 100 per year of observation. The median time between the last visit and death was 5.2 months (interquartile interval, 3.9–8.2 months). Most of the deaths (82.8%) occurred after the individuals were seen at CD4 stage 4 (with severe AIDS symptoms) and nobody died after being seen at CD4 stage 1 (asymptomatic).
During the observation period, when both the env and gag genes were taken into account, 7/17 individuals harboring C viruses died in comparison to only 8/58 harboring C′ viruses (41.2% C versus 13.8% C′) (Fisher's exact test, p = 0.03), whereas overall in the cohort there was a higher proportion of individuals who harbored C′ viruses (72.3%). Among the individuals who died the median HIV-1 RNA plasma load values at intake were 4.73 log copies/ml (95% confidence interval/CI = 2.9–5.5) for subcluster C, which was not significantly different (Student's t test, p = 0.5887) from the subcluster C′-infected individuals, with 4.68 log copies/ml (95% CI = 3.2–4.9). There was also no statistical difference (Student's t test, p = 0.4286) between the CD4+ cell count median values, 193 cells/μl (95% CI = 89.3–401.9) for the subcluster C and 250 cells/μl (95% CI = 109.7–371.8) for the subcluster C′-infected individuals, implying that the observed difference in death incidence could be determined by strain specificities.
The univariate Cox proportion hazards model showed a greater risk of dying for subcluster C-infected persons. The confidence intervals indicated a significant difference when the analysis was based on the gag genotype [hazard ratio = 3.44, 95% CI (1.43–8.30)] although not significant when the analysis was based on env or both genes together.
Discussion
This study cohort presented an opportunity to determine the virological differences as well as variation in disease progression between individuals infected with the HIV-1 C or C′ genetically related cocirculating strains in Ethiopia. The differential pathogenicity of cocirculating viruses is a complex issue to address. A few studies have hinted at a higher virulence of one subtype compared to another, reflected by the development of higher viral loads or shortened survival probabilities. 8,28 Others have refuted the existence of substantial differences in pathogenicity or disease progression between HIV-1 subtypes. 29,30 In light of accumulating evidence of biological differences among the subtypes it would seem unlikely that they induce identical disease characteristics. 11
Subtype C is somewhat enigmatic as it is the most prevalent subtype found throughout the pandemic and is spreading rapidly. 2 Higher RNA transcription rates 13,31 may help explain the increase in viral fitness and, hence, partially explain the dominance of this subtype. In addition, it has been reported that individuals infected with subtype C viruses are less likely to demonstrate a switch in virus coreceptor usage from CCR5 to CXCR4, in comparison to individuals infected with other HIV-1 subtypes, 32 even though similar env amino acid substitutions are associated with the switch when it does occur. 4,33 Viral burden in infected individuals preceding death (CD4 < 100) in Ethiopia is higher than in individuals infected with subtype B viruses in The Netherlands. 34 In contrast, exhaustive studies comparing subtype B and C viruses found subtype C to be weaker by all counts. 35
In our analyses it was evident that irrespective of which gene was analyzed (gag, env, or gag/env combined), subcluster C′ predominated in the cohort participants in a proportion identical to that found countrywide. 15 Concomitantly, based on gag and env, 19.2% of the isolates analyzed were C/C′ recombinant genomes corroborating previous findings that reported 20% recombination between subcluster C and C′. 15 Moreover, 73.4% of these recombinant viruses carried the C′ envelope, suggesting a biological advantage for this genotype with regard to the ability of the C′ envelope to transmit.
To circumvent the fact that most study subjects were seroprevalent with an unknown time of infection, we stratified the CD4 not as a proxy for time but to compare two groups of viruses at similar states of progression with the underlining notion that lower strata indicates a longer infection time. We are not able to determine whether an identical time has elapsed for a similar state of CD4 decline for both subclusters. Nevertheless, clear HIV-1 RNA plasma load differences could be discerned at the lowest (0–150 cells/μl) and highest (500–900 cells/μl) CD4+ T cell count strata. Infection with subcluster C virus was associated with markedly higher viral loads at the lowest CD4+ T cell count strata, corresponding to advanced/late stage HIV disease. However, at the highest CD4+ T cell count spectrum (taken as a proxy indicator of relatively early HIV infection with intact immune function) the HIV-1 RNA plasma load was significantly higher in subcluster C′-infected individuals. From these observations it can be inferred that subcluster C′-infected subjects initially have higher viral loads, possibly aiding in transmission. The higher percentage of the subcluster C′ envelope among the recombinant strains would also indicate an advantage for this genotype. This observation confirms our previous findings showing that the subcluster C′ envelope has gained ground over subcluster C in Ethiopia. In addition, subcluster C′ is related to the fast spreading subtype C epidemics of southern Africa and India. 15 Recent data by Abraha et al. report that such subtypes C envelopes may have reduced pathogenic fitness but could outcompete viruses of subtypes A and D in tissue competition experiments, suggesting a transmission advantage. 36
Subcluster C infection, possibly because of its lower HIV-1 RNA plasma load earlier in infection, may therefore be less efficiently transmitted and much less likely to establish itself as the predominant genotype in Ethiopia. Nevertheless, whereas the C virus seemingly induces a lower HIV-1 RNA plasma load early in disease, higher viral loads are found later in disease. This observation triggers a reconsideration of the basic principal established for HIV-1 subtype B infection. Individuals with higher viral loads early in disease are more at risk for faster disease progression in the absence of therapy. Whereas this principal remains true, it may be related to differences in the predictive value of viral load among subtypes or genotypes. Analysis of subtype B-infected individuals indicates that the presenting HIV RNA level only minimally predicts the rate of CD4 cell decline in untreated persons, 37 which suggests that other as yet undefined factors likely drive CD4 cell losses. Therefore the predictive value may differ for the various subtypes.
The C and C′ viruses may induce different states of immune activation, although it has been shown that even in individuals infected with different HIV-1 subtypes, namely B and C, there are similarities in the immune activation profiles. 38 In Ethiopia, in contrast to the higher frequency of pathogens, a slower CD4+ cell decline was observed in individuals infected with subtype C than in individuals in The Netherlands infected with subtype B viruses. 22
The differences observed between the C and C′-infected groups may result from the fact that the two groups of viruses entered the population at different moments in time. However, studies based on the expansion of genetic diversity in the two groups estimated that the expansion of the epidemic in both groups (C and C′) began at the same time in the early 1980s. 17,18 Host differences are also unlikely to explain C and C′ differences as these viruses are cocirculating within the same population. However, we cannot rule out variant immune recognition of the two strains. The differences in the number of individuals who died could only indicate that at the time the study began individuals harboring subcluster C viruses had been infected longer than those carrying subcluster C′ strains. However, at the beginning of the study there were no differences between the two groups, either in terms of CD4+ cell counts or in viral load values, that would indicate a difference in the timing of the infection.
In conclusion, even with the inherent limitations associated with inferences drawn from a seroprevalent group, in our study, with the analysis of the seroprevalent and seroincident individuals, we identified genetic differences between subcluster C and C′ HIV-1 infections in Ethiopia indicating functional differences. Thus the higher viral loads associated with subcluster C′ infection in early stage HIV disease are consistent with the epidemiological evidence, which demonstrates that subcluster C′ has gained ground and is the predominant genotype currently circulating in Ethiopia. In the 1980s during the early period of the epidemic subcluster C was dominant and we cannot exclude the possibility that the increased incidence of death among the C subcluster-infected individuals may have contributed to the shift of relative prevalence between C and C′. Our findings support the hypothesis that closely related, yet distinct HIV-1 viruses (intrasubtype variation) may possess inherent properties that affect disease transmission and progression. Such insights highlight the need for ongoing studies to delineate the mechanisms by which genetic variants of HIV-1 cause immunopathogenesis.
Footnotes
Acknowledgments
This study is a part of and was supported financially by the Ethio-Netherlands AIDS Research Project (ENARP), a collaborative effort of the Ethiopian Health and Nutrition Research Institute (EHNRI), Addis Ababa, Ethiopia, the Amsterdam Municipal Health Service (GG/GD), the Academic Medical Center of the University of Amsterdam (AMC), and the Central Laboratory of the Netherlands Red Cross Blood Transfusion Service (CLB), Amsterdam, The Netherlands. Financial support of ENARP is from the Netherlands Ministry of Foreign Affairs and the Ethiopian Ministry of Health (MOH) as a bilateral project. The authors especially thank Dr. J.M. Ruijter from the Department of Anatomy and Embryology of the Academic Medical Center, University of Amsterdam, for his constructive comments.
Author Disclosure Statement
No competing financial interests exist.