
Abstract
Initial viral decay rate may be useful when comparing the relative potency of antiretroviral regimens. Two hundred twenty-seven ART-naïve patients were randomized to receive efavirenz (EFV) (n = 74), lopinavir/ritonavir (LPV/r) (n = 77), or atazanavir/ritonavir (ATV/r) (n = 79) in combination with two NRTIs. The most frequently used NRTI combinations in the EFV and ATV/r groups were the nonthymidine analogues tenofovir and emtricitabine or lamivudine (70% and 68%, respectively) and, in the LPV/r group, lamivudine and the thymidine analogue zidovudine (89%). HIV-1 RNA was monitored during the first 28 days after treatment initiation. Phase 1 and 2 decay rate was estimated in a subset of 157 patients by RNA decrease from days 0 to 7, and days 14 to 28. One-way ANOVA and subsequent Tukey's post hoc tests were used for groupwise comparisons. Mean (95% CI) HIV-1 RNA reductions from days 0 to 28 were 2.59 (2.45–2.73), 2.42 (2.27–2.57), and 2.13 (2.01–2.25) log10 copies/ml for the EFV-, LPV/r-, and ATV/r-based treatment groups, respectively, with a significantly larger decrease in the EFV-based group at all time points compared with ATV/r (p < 0.0001), and with LPV/r at days 7–21 (p < 0.0001–0.03). LPV/r gave a greater RNA decrease compared with ATV/r from day 14 (p = 0.02). Phase 1 decay rate was significantly higher in the EFV group compared with LPV/r (p = 0.003) or ATV/r (p < 0.0001). No difference was found in phase 2 decrease. EFV-based treatment gave a more rapid decline in HIV-1 RNA than did either of the boosted protease inhibitor–based regimens. The observed differences may reflect different inherent regimen potencies.
Introduction
HIV-1
After antiretroviral treatment is initiated, viral production decreases as infection of new lymphocytes and macrophages is prevented. At least three phases of viral decline can be identified; a first phase 1 decay attributed mainly to cells with a short half-life of 1–2 days during which plasma viral load declines rapidly over 7 to 10 days, followed by a more-gradual phase 2 decline of cells with estimated half-life of 2 to 3 weeks over the following months. 5,6 The cells implicated in the first phase of viral decline are mainly activated CD4+ T lymphocytes, whereas macrophages, follicular dendritic cells, and CD4+ T cells in a state of partial activation have been suggested as the major contributors to viral load during phase 2. 6,7 After the initial decline, HIV-1 RNA levels stabilize at low but detectable levels >1 to 2.5 copies/ml, given successful therapy. 2 –4 The pool of resting, latently infected CD4+ T cells has been shown to be very stable, with a decay rate corresponding to a half-life of >40 months 8,9 constituting a third phase of viral decay. 4
The initial viral decay rate may be useful as a way of comparing relative potency between different treatment combinations. More-potent drug combinations possibly lead to faster viral decay rates, and may in turn reflect the overall efficacy of the regimen. 10 Long-term success of treatment, however, is influenced by other factors, such as the frequency and manageability of side effects and adverse drug reactions that influence adherence to therapy.
A combination of two nucleoside reverse transcriptase inhibitors (NRTIs) and either a nonnucleoside reverse transcriptase inhibitor (NNRTI) or a ritonavir-boosted protease inhibitor (PI/r) is currently recommended for first-line therapy. 11 –14 The NORTHIV study is an ongoing, phase 4, open-label, randomized, multicenter study comparing the efficacy and safety of three antiretroviral regimens, efavirenz + 2 NRTIs, lopinavir/r + 2 NRTIs, and atazanavir/r + 2 NRTIs for treatment of HIV infection in antiretroviral-naïve patients. As a part of the NORTHIV study, we evaluated the initial viral decay in the respective treatment groups.
Materials and Methods
Study design and participants
NORTHIV was designed as a randomized, open-label, multicenter trial of three initial antiretroviral regimens for the treatment of HIV-1 infection. The study was planned to enroll ≥150 patients randomly assigned to one of three treatment regimens: lopinavir/r (coformulated 133/33-mg capsule or coformulated 200/50-mg tablet) 400/100 mg plus two NRTIs taken twice daily; atazanavir (150-mg capsule) 300 mg plus ritonavir (100-mg capsule) 100 mg plus two NRTIs taken once daily; or efavirenz, 600 mg plus two NRTIs taken once daily.
The viral dynamics evaluation was preplanned as a part of the study. Randomization of individual study subjects was performed by the coordinating center and was stratified by screening HIV-1 RNA levels (<100.000 copies/ml or ≥100.000 copies/ml) and CD4 cell count (<200 cells/ml or ≥200 cells/ml).
Adult, HIV-1–infected patients were eligible for participation if they were previously naïve to antiretroviral therapy, had indications to start treatment, and were able to understand and provide informed consent. Pregnant women, women not practicing birth control during the study, and patients with known resistance to any of the study drugs were excluded from the study. Genotypic resistance testing was not mandatory and was not performed consistently in all patients. No restriction existed regarding CD4 cell count or documented or suspected ongoing opportunistic infections.
Study visits were scheduled at baseline and at day 28 (24–35), with additional visits at days 7 (5–9), 14 (12–16), and 21 (19–23) for a subset of patients. Samples collected outside the intervals stated in the study protocol were excluded from the analysis. For the purpose of viral dynamics evaluation, subjects who interrupted treatment or with known nonadherence to therapy during the study period were excluded from the analysis. However, if available, data collected before interruption of treatment were included in the analysis. At each visit, clinical assessment and laboratory testing, including plasma HIV-1 RNA level, was performed. HIV-1 in plasma was measured by quantitative polymerase chain reaction (HIV-1 monitor assay, version 1.5; Amplicor; Roche Diagnostic System; Hoffman–La Roche). CD4 cell counts were sampled at baseline and on day 28.
Adherence to medication was evaluated by the investigator through patient self-report, as well as by using a modified version of the validated ACTG adherence questionnaire 15,16 at study visit days 14 and 28. Subjects reporting more than three missed doses during the study period were excluded from the analysis. Adherence to medication in relation to plasma drug concentration and virologic effects is reported elsewhere.
All patients provided signed informed consent to participate in the study. The study protocol was approved by the Research Ethics Committee of the University of Gothenburg, the Regional Committees for Medical Research Ethics in Norway, and the Swedish Medical Products Agency.
Statistical methods
HIV-1 RNA decrease per day from baseline to the first sampling (day 5–9) was used for estimation of the phase 1 decay rate. For phase 2, HIV-1 RNA decrease in samples collected between days 14 (12–16) and 28 (24–35) were used to estimate the decay rate. Data points for subjects collected outside stated protocol intervals were excluded from the primary analysis of RNA decrease and decay rate. A total of 23 subjects had one or more data point excluded: eight in the efavirenz group, seven in the lopinavir/r group, and eight in the atazanavir/r group. The log10 HIV-RNA decline, phase 1 and 2 decay rates, and CD4-cell increases in the different treatment groups were analyzed by using one-way analysis of variance (ANOVA) and subsequent Tukey's post hoc test for groupwise comparisons. A value of p < 0.05 was considered statistically significant.
Results
Baseline characteristics
In total, 239 patients were enrolled in the NORTHIV study between 2004 and 2007, and randomized individually to one of the three treatment groups containing either efavirenz, lopinavir/r, or atazanavir/r in combination with two NRTIs chosen by the recruiting center. Twelve patients were excluded from the viral dynamics study because of protocol violation (n = 6), treatment interruption before the first sampling (n = 3), or nonadherence defined as reporting more than three missed doses during the study period (n = 3, all reporting more than seven missed medication doses). Of the remaining 227 subjects, 74 patients were included in the efavirenz-based treatment group, 76 patients in the lopinavir/r-based treatment group, and 77 patients in the atazanavir/r-based treatment group. Subject demographics and baseline characteristics are shown in Table 1. One hundred fifty-seven subjects underwent further monitoring with an additional one to three study visits (Table 2).
CDC, Centers for Disease Control; HBsAg, Hepatitis B surface antigen; NRTI, nucleoside/nucleotide reverse transcriptase inhibitor; ZDV, Zidovudine; 3TC, Lamivudine; ABC, Abacavir; FTC, Emtricitabine; TDF, Tenofovir disoproxil fumarate.
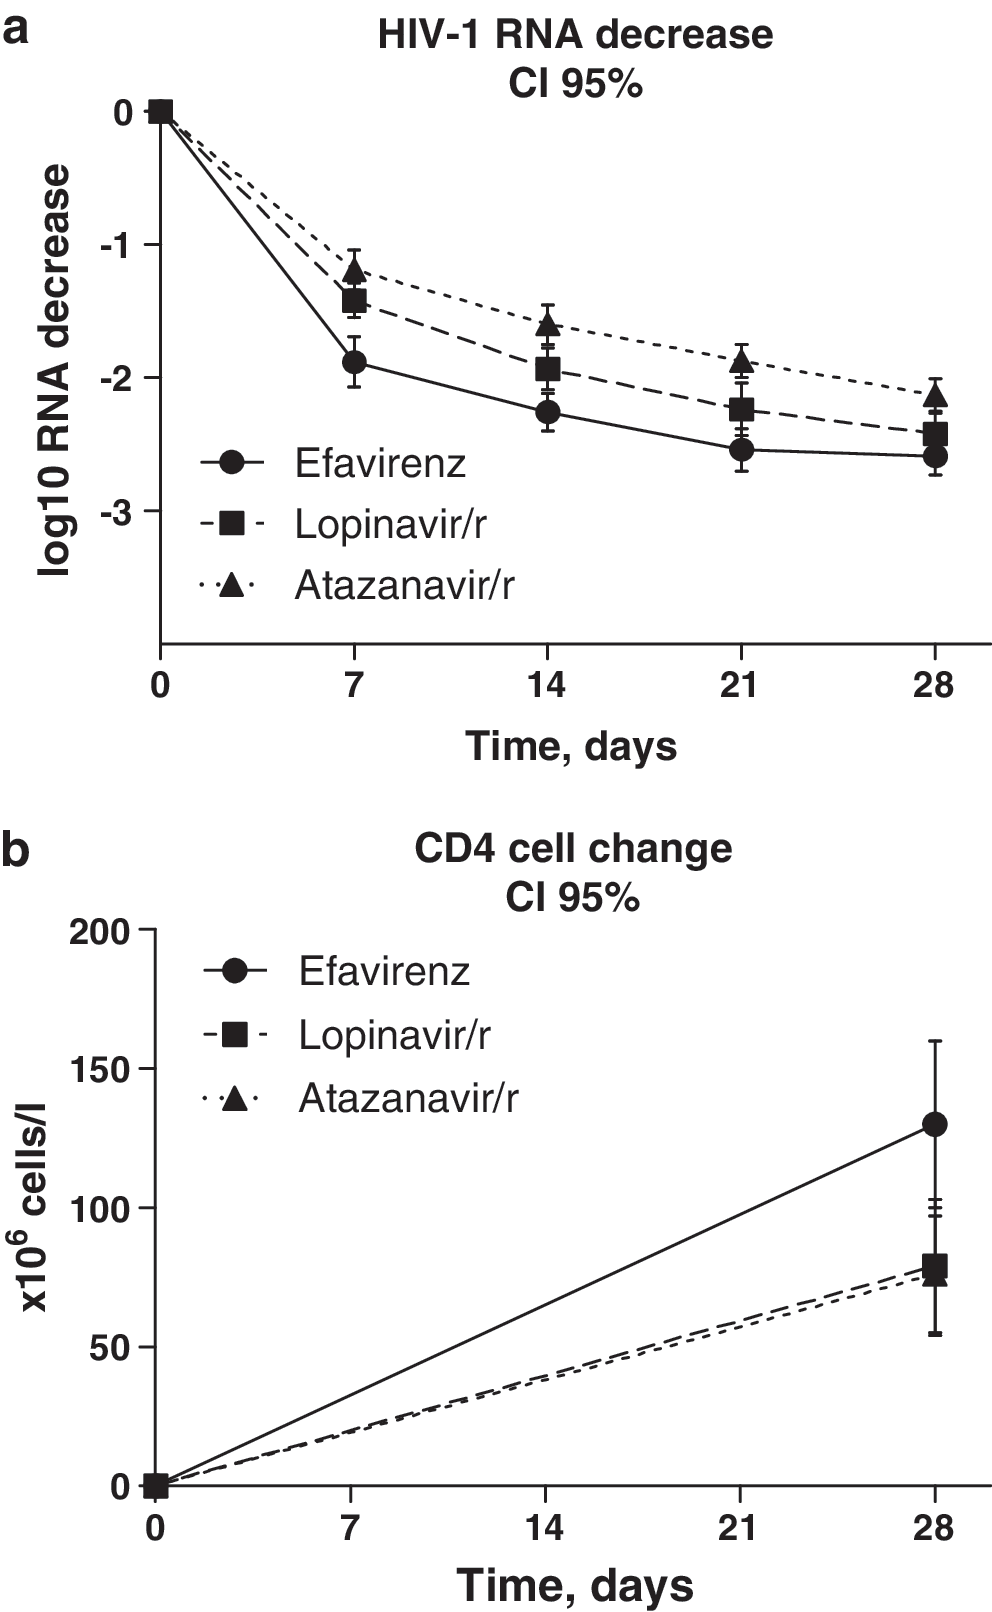
HIV-1 RNA decrease, by treatment group Efv, efavirenz; Lpv, lopinavir/ritonavir; Atv, atazanavir/ritonavir; CI 95, 95% confidence interval.
log10 HIV-1 RNA copies/ml.
In total, nine patients discontinued the study during the study period. One patient in the efavirenz group discontinued the study because of treatment interruption after day 7. In the lopinavir/r group, three (4%) of 76 patients discontinued the study before day 28. Two patients discontinued because of adverse events (rash), and one patient was lost to follow-up; in the atazanavir/r arm, five (6%) of 77 patients discontinued because of adverse events (pneumonitis, n = 1; nausea, rash, n = 1; renal failure, n = 1), or death (Pneumocystis jiroveci pneumonia, CMV pneumonitis, n = 1; PML, n = 1). In all cases, available data collected before discontinuation were included in the analysis.
In the whole study population, the mean baseline plasma RNA level was 5.17 (95% CI, 5.07–5.27) log10 copies/ml, and mean CD4 cell count was 153 (CI 95%, 141–164) × 106 cells/L. One hundred forty-seven (65%) patients had baseline HIV-1 RNA ≥100.000 copies/ml, and 159 (70%) patients had a baseline CD4 cell count <200 cells/ml. The 47 (21%) patients fulfilled CDC class C criteria with concurrent opportunistic infections or AIDS-indicator conditions, including Pneumocystis jiroveci pneumonia (n = 24), wasting syndrome (n = 5), Mycobacterium tuberculosis (n = 8), esophageal candidiasis (n = 4), Kaposi sarcoma (n = 2), progressive multifocal leukoencephalopathy (n = 2), cytomegalovirus pneumonia (n = 1), and retinitis (n = 1); chronic isosporiasis, herpes simplex bronchitis, chronic ulcers, CNS toxoplasmosis, and disseminated Mycobacterium avium complex infection (n = 1, respectively). Table 1 shows the distribution of baseline characteristics in the three treatment groups. Baseline HIV-1 RNA, CD4 cell counts, and CDC class were balanced between the 3 study treatment arms (Table 1).
Treatment regimens and NRTI backbone therapy are shown in Table 1. As NRTI backbone was not regulated by study protocol, backbone regimens given in each treatment group varied. As atazanavir/r as well as efavirenz was given once daily, the majority of patients in each treatment group were given an NRTI backbone suitable for once-daily dosing. Consequently, in the efavirenz and atazanavir/r treatment groups, a majority of patients were given an NRTI backbone containing either abacavir or tenofovir disoproxil fumarate (tenofovir), whereas in the lopinavir/r group, a majority of patients were given zidovudine-containing regimens. Furthermore, study protocol allowed modification of the NRTI backbone without violation of study requirements, and six patients changed the NRTI backbone during the study period.
Adherence to treatment
Self-reported adherence data from one or more visits was available for 212 patients. Self-reported adherence was good overall, with 204 subjects reporting no missed doses; only eight patients reported one to three missed doses during the first 4-week treatment period.
Plasma HIV decay rates
HIV-1 RNA decrease from baseline value was calculated for each subject available for analysis and is shown in Fig. 1. Mean HIV-1 RNA decrease from baseline to day 28 was 2.59 (95% CI, 2.45–2.73), 2.42 (95% CI, 2.27–2.57), and 2.13 (95% CI, 2.01–2.25) log10 copies/ml for the treatment groups, based on efavirenz, lopinavir/r and atazanavir/r, respectively. The efavirenz-based treatment group showed a significantly greater HIV-1 RNA decrease compared with the atazanavir/r-based group at all time points; compared with the lopinavir/r-based group, efavirenz-based therapy gave a greater HIV-1 RNA decrease at days 7 through 21. Lopinavir/r-containing regimens in turn gave rise to a faster HIV-1 RNA decline than did atazanavir/r-containing regimens from days 14 through 28. Table 2 summarizes the mean HIV-1 RNA decrease from baseline level at each time point.
Mean plasma HIV-1 RNA decrease (
Stratified analysis of patients with baseline viral load >100,000 copies/ml showed an identical pattern. However, when restricting analysis to patients with baseline viral load <100.000 copies/ml, the only significant difference between treatment groups was a greater HIV RNA decline for efavirenz-based compared to atazanavir/r-based treatment at days 7 through 21 (data not shown).
Estimated HIV-1 RNA decay rates for phases 1 and 2 are shown in Table 3. The efavirenz-based treatment group had a greater first-phase decay rate than either of the protease inhibitor–based treatment groups. In the second phase, no statistically significant difference was found between treatment groups.
Efv, efavirenz; Lpv, lopinavir/ritonavir; Atv, atazanavir/ritonavir; CI 95, 95% confidence interval.
log10 HIV-1 RNA copies/ml.
At day 28, 29 (45%) of 65, 24 (36%) of 67, and 14 (22%) of 64 subjects reached viral load <400 HIV-1 RNA copies/ml in the efavirenz-, lopinavir/r-, and atazanavir/r-based treatment groups, respectively. Only eight (12%) of 65, eight (12%) of 67, and four (6%) of 64 patients in respective treatment groups (Fig. 2) reached HIV-1 RNA viral load <50 copies/ml at day 28.
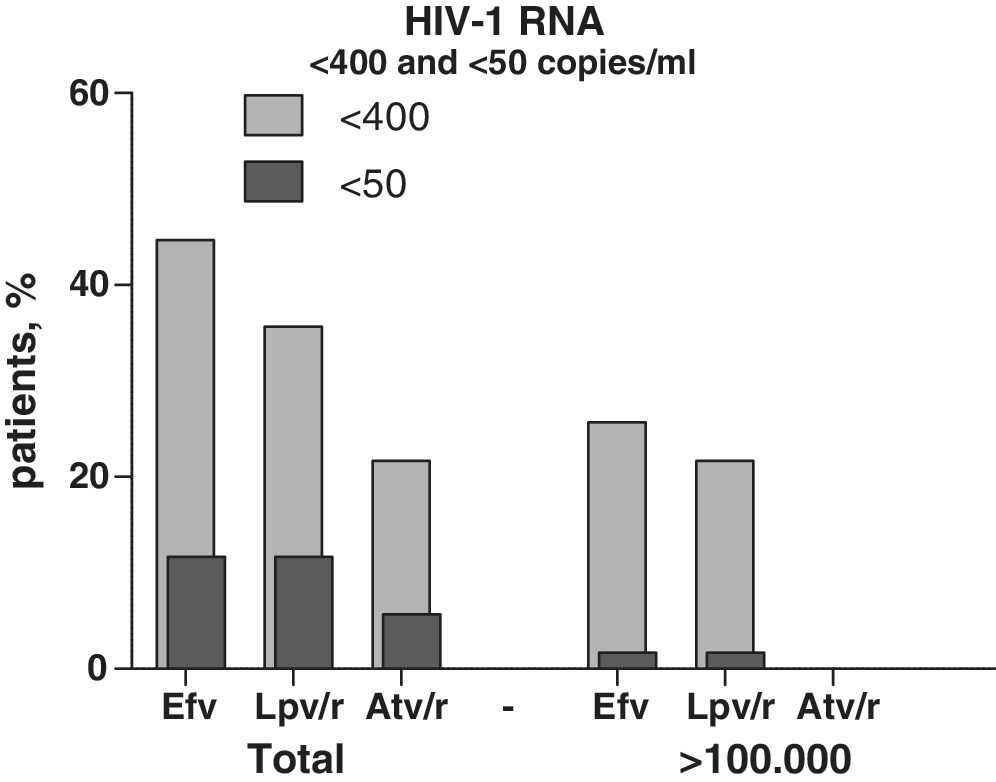
Percentage of patients reaching <400 and <50 HIV-1 RNA copies/ml at day 28, by treatment group. Efv, efavirenz; Lpv/r, lopinavir/ritonavir; Atv/r, atazanavir/ritonavir. Total, all subjects; >100,000, baseline HIV-1 RNA >100,000 copies/ml.
As shown in Fig. 2, comparatively fewer patients with high baseline viral load (>100.000 copies/ml) reached a viral load of <400 copies/ml in the first 4 weeks. For the treatment groups containing efavirenz and lopinavir/r, corresponding numbers of subjects with high baseline viral load reaching <400 copies/ml were 11 (26%) of 43 and 10 (22%) of 45, whereas none of the subjects treated with atazanavir/r reached viral load <400 copies/ml. One patient in each of the efavirenz- and lopinavir/r-based groups with baseline viral load >100.000 copies/ml reached undetectable (<50 copies/ml) HIV-1 RNA during the study period.
Patients in the efavirenz- and atazanavir/r-based treatment arms were predominately given an NRTI backbone containing either abacavir or tenofovir together with lamivudine or emtricitabine. A comparison was made of HIV-1 RNA decrease at day 28 in patients treated with either abacavir or tenofovir in respective treatment groups. In the atazanavir/r treatment group, 43 patients treated with tenofovir and 19 patients treated with abacavir were available for analysis, with 25 (tenofovir) and 14 (abacavir) with baseline HIV-1 RNA >100.000 copies/ml. Corresponding numbers in the efavirenz treatment group were 47 (32) and 11 (five) subjects. No significant difference in HIV-1 RNA decrease between abacavir- and tenofovir-treated subjects in either treatment group was noted, regardless of baseline HIV-1 RNA level.
CD4 cell changes
Baseline mean CD4 cell count was 143 (95% CI, 123–162), 154 (135–173), and 161 (140–183) × 106 cells/L for the efavirenz-, lopinavir/r- and atazanavir/r-based treatment groups, respectively, as shown in Table 1. Mean CD4 cell count for treatment groups at day 28 was 272 (95% CI, 237–306), 243 (219–268), and 257 (229–285) × 106 cells/L, corresponding to a mean CD4 T-cell change of 130 (95% CI, 100–160), 79 (55–103), and 76 (54–97) × 106 cells/l, respectively (Fig. 1). The efavirenz-based treatment group had a greater increase in CD4 cell count at day 28 compared with the protease inhibitor–containing regimens (p = 0.015).
Discussion
In the present study, patients treated with efavirenz-containing regimens had a faster initial decay in viral load than did patients treated with protease inhibitor–based regimens. In the protease-inhibitor treatment groups, lopinavir/r-based therapy led to faster initial decline in HIV-1 RNA than did atazanavir/r-containing drug combinations. Previous studies have demonstrated faster initial viral decay in patients treated with efavirenz compared with a triple-nucleoside regimen, 17 or with nelfinavir, 18 but to our knowledge, the initial viral decay rate for patients treated with lopinavir/r or atazanavir/r is less well studied. Differences between treatment groups were seen, both in terms of total HIV-1 RNA decrease and in terms of first-phase viral decay. Our estimation of HIV-1 RNA decrease in treatment groups corresponded to median half-lives of 1.17–1.75 and 8.8–13 days for first- and second-phase decay, comparable to those previously reported. 6,17,19 Although no difference was observed in estimated phase 2 decay, treatment groups differed regarding total HIV-1 RNA decrease to day 28. Likely the difference in first-phase decay accounts for the difference in total RNA decrease during the study period, and it is probable that treatment groups would have achieved similar levels of RNA reduction given longer time to follow-up. Palmer et al. demonstrated a correlation between residual viremia and baseline viral load, 4 but not to treatment regimen, 2 although other studies suggest the possibility that HAART regimen may indeed influence virologic suppression. 20
Typically, productively infected activated CD4+ T cells are regarded as the main viral source during the rapid first phase of decay, in which viral production and clearance occur at a high rate. 1,6 In patients with a high baseline viral load, this corresponds to a large number of infected cells, and presumably a more-potent antiretroviral regimen can have a greater impact on preventing new cells from infection, and thereby on the rate at which HIV-1 RNA declines, given that the rates of decay of virus-producing CD4+ T cells are comparable in matched patient cohorts. 10 Differences in pharmacologic mechanisms of given drugs may also have an important impact on antiretroviral potential 21 and initial decay. 22
Viral turnover is much lower in the second phase, and the decay rate is slower than that seen in the first phase. Macrophages as well as latently infected CD4+ T cells undergoing activation and release of viral particles from follicular dendritic cells have been suggested as the cellular sources attributed to viral production in this stage. 6,7 We did not find any significant correlation between treatment regimen and phase-2 decay rate in our study cohort, consistent with previous reports. 17
Consistent with results from analysis of the initial viral decay, a greater number of patients in the efavirenz-based treatment group reached a viral load <400 copies/ml than did patients in either protease inhibitor–based group, followed in turn by the lopinavir/r group. A clearer difference was seen in patients with baseline viral load >100.000 copies/ml, where none of the patients in the atazanvir/r-based treatment group reached viral load <400 copies/ml compared with 11 (26%) and 10 (22%) for efavirenz- and lopinavir/ritonavir-based groups. Overall, few patients reached undetectable (<50 copies/ml) HIV-1 RNA during the study period; however, a majority of patients in the study population had advanced disease at baseline, 149 (65%) of 230 with baseline HIV-RNA >100.000 copies/ml and 162 (70%) of 230 with CD4 cell count <200 cells/ml, likely contributing to the short-term treatment outcome.
The NRTI backbone varied in the study population. In the lopinavir/r-based treatment group, a majority of patients received zidovudine/lamivudine suitable for twice-daily dosing, whereas patients in the efavirenz- and atazanavir/r-based groups were predominately treated with abacavir or tenofovir, together with either lamivudine or emtricitabine once daily. A combination of tenofovir/emtricitabine was superior to zidovudine/lamivudine in virologic efficacy over 144 weeks, given in combination with efavirenz, although the difference could be attributed to higher tolerability in tenofivir-treated patients. 23 Comparable virologic responses have been found for abacavir and zidovudine, both combined with lamivudine and efavirenz over 48 weeks. 24 Studies evaluating the efficacy and safety of abacavir/lamivudine versus tenofovir/emtricitabine are ongoing, and although concern has been raised regarding the comparative efficacy of abacavir/lamivudine in patients with baseline HIV-1 RNA >100.000 copies/ml, results are still pending. 25,26 In our limited material, we were not able to see any clear difference in viral decrease between abacavir- and tenofovir-treated patients in the efavirenz- or atazanavir/r-based treatment groups, regardless of baseline viral load. It must be noted, however, that the number of patients in this subanalysis was quite small.
The impact of these NRTI combinations on initial viral decay are not as well studied; however, it can be assumed that the potency of all drugs included in combination therapy contribute to the overall efficacy of the regimen. In our study population, the efavirenz and atazanavir/r treatment groups were roughly similar regarding backbone NRTI regimens (70% and 68% tenofovir/emtricitabine or lamivudine; 16% and 29% abacavir/lamivudine) but showed the greatest difference in initial viral decay. Comparing viral decrease only in patients treated with tenofovir/emtricitabine in these two treatment groups did not alter the nature of results or level of significance (data not shown). The lopinavir/r group was intermediate in initial decay, and 90% of the patients received a zidovudine/lamivudine backbone that was uncommon in the other treatment groups. We cannot rule out that the differences in backbone NRTI therapy may have influenced our results, although the impact is probably lower than the use of either efavirenz, lopinavir/r, or atazanavir/r. 27,28
The rate of initial viral decay after initiation of a combination of antiretroviral drugs may be a reflection of the overall potency in a treatment regimen. 19,29 Previous studies have found that treatment groups with faster initial viral decay tended to have a more favorable outcome. 17,18,30 Others have not seen such a correlation. 31,32 Recent reports have shown superior long-term viral efficacy in patients treated with efavirenz-containing regimens compared with lopinavir/r-based therapy. 33,34 Atazanavir/r was shown to have similar antiviral efficacy over 48 weeks compared with lopinavir/r. 35 However, other factors besides antiviral potency are important to the overall success of a treatment regimen. Tolerability and side effects, drug resistance, and, most important, adherence to treatment contribute to treatment results over time. Adherence in our study population was monitored according to standard clinical practice as well as by the use of adherence forms, and was considered good overall, although not perfect. No difference was found in adherence between the three study groups that would bias results during this brief follow-up.
In conclusion, we found that patients treated with efavirenz had a more rapid initial decline in HIV-1 RNA than did patients treated with either of the protease inhibitors, lopinavir/r or atazanavir/r, and, in turn, lopinavir/r-treated patients had a more rapid initial decay than did atazanavir/r-treated patients. The efavirenz-based group had a greater increase in CD4 cell count during the first 28 treatment days. This is an indication that efavirenz, when combined with two NRTIs, holds the potential for higher antiviral potency compared with the two protease inhibitor–containing regimens studied, although the differences in pharmacologic mechanisms between drug classes may influence the rate of viral decay. Whether this will translate to a more successful outcome of treatment over time remains to be shown, although the trends found in this work are in accordance with results from other recent studies.
Footnotes
Acknowledgments
This study was supported in part by grants from the Swedish Research Council (2007-7092), the Sahlgrenska Academy at the University of Gothenburg (ALFGBG-11067), The Health & Medical Care Committee of the Region Västra Götaland (VGFOUREG 25921), and the Research Foundation of Swedish Physicians Against AIDS.
Author Disclosure Statement
M.G. has received research grants, and/or consultancy fees, and/or honoraria from Abbott, Boehringer-Ingelheim, Bristol-Myers Squibb, F. Hoffmann-La Roche, Gilead, GlaxoSmithKline, Merck, Sharp and Dohme, Tibotec/Janssen-Cilag.
L.F. has received consultancy fees from Abbott, Boehringer-Ingelheim Bristol-Myers Squibb, F. Hoffmann-La Roche, Gilead, GlaxoSmithKline, Tibotec/Janssen-Cilag.
A.S. has been an advisory board member of Gilead, and received consultancy fees from Abbott and GlaxoSmithKline.
F.J. has received lecture fees from Bristol-Myers Squibb.
Other authors declare no conflict of interest.
References
 100,000 c/mL.